
 Submit a Paper
 Propose a Special lssue
 Open Access
ARTICLE

Identification and verification of aging-related lncRNAs for prognosis prediction and immune microenvironment in patients with head and neck squamous carcinoma
1 Department of Radiation Oncology, The First Affiliated Hospital of Nanjing Medical University, Nanjing, 210029, China
2 Department of Oncology, Jurong People’s Hospital, Jurong, 212499, China
3 Department of Radiation Oncology, Nanjing Jiangning Hospital and the Affiliated Jiangning Hospital of Nanjing Medical University, Nanjing, 211199, China
* Corresponding Authors: Xinchen Sun, ; Xiaoke Di,
# Qing Gao, Yujing Shi, and Yuanyuan Sun have contributed equally to this work
Oncology Research 2023, 31(1), 35-61. https://doi.org/10.32604/or.2022.028193
Received 04 December 2022; Accepted 30 January 2023; Issue published 01 March 2023
 View Full Text
 Download PDF
Abstract
Aging is highly associated with tumor formation and progression. However, little research has explored the association of aging-related lncRNAs (ARLs) with the prognosis and tumor immune microenvironment (TIME) of head and neck squamous cell carcinoma (HNSCC). RNA sequences and clinicopathological data of HNSCC patients and normal subjects were downloaded from The Cancer Genome Atlas. In the training group, we used Pearson correlation, univariate Cox regression, least absolute shrinkage/selection operator regression analyses, and multivariate Cox regression to build a prognostic model. In the test group, we evaluated the model. Multivariate Cox regression was done to screen out independent prognostic factors, with which we constructed a nomogram. Afterward, we demonstrated the predictive value of the risk scores based on the model and the nomogram using time-dependent receiver operating characteristics. Gene set enrichment analysis, immune correlation analysis, and half-maximal inhibitory concentration were also performed to reveal the different landscapes of TIME between risk groups and to predict immuno- and chemo-therapeutic responses. The most important LINC00861 in the model was examined in HNE1, CNE1, and CNE2 nasopharyngeal carcinoma cell lines and transfected into the cell lines CNE1 and CNE2 using the LINC00861-pcDNA3.1 construct plasmid. In addition, CCK-8, Edu, and SA-β-gal staining assays were conducted to test the biofunction of LINC00861 in the CNE1 and CNE2 cells. The signature based on nine ARLs has a good predictive value in survival time, immune infiltration, immune checkpoint expression, and sensitivity to multiple drugs. LINC00861 expression in CNE2 was significantly lower than in the HNE1 and CNE1 cells, and LINC00861 overexpression significantly inhibited the proliferation and increased the senescence of nasopharyngeal carcinoma cell lines. This work built and verified a new prognostic model for HNSCC based on ARLs and mapped the immune landscape in HNSCC. LINC00861 is a protective factor for the development of HNSCC.Keywords
Head and neck squamous cell carcinoma (HNSCC) is a type of malignancy originating from the mucosal epithelium of the lip, oral cavity, larynx, or naso-, oro-, hypo-pharynx. HNSCC has a mortality rate of nearly 50% in the first five years after diagnosis, with over 850,000 new cases and more than 400,000 deaths globally in 2020 [1–3]. Though diverse treatment modalities such as surgery, targeted therapy, chemo-, radio- and immuno-therapy are used in HNSCC patients, their clinical benefits are far from satisfactory [4].
Aging is an irreversible growth arrest condition closely associated with the development of many chronic diseases and cancers [5]. Cellular senescence can be induced by stimuli such as telomere shortening due to extensive replication, oxidative stress, DNA damage, and oncogene overexpression, which are regulated by senescence-related genes [6]. After senescent cells lose proliferative capacity, hindering tumor progression, they remain viable and metabolically active, secreting various cytokines that promote the growth, migration, and invasion of tumor cells [7,8]. The potential prognostic value of aging-related genes in HNSCC and the correlations with inflammation and tumor immunity have recently been explored and confirmed [9].
Long non-coding RNAs (lncRNAs) are a class of non-protein-coding RNAs that are more than 200 nucleotides in length and have specific functions (e.g., splicing, transcriptional and post-transcriptional modulation of mRNA), which are largely linked to tumor development, metastasis, and tumor immunity [10]. The action mechanisms of lncRNAs in aging have not yet been elucidated, and the prognostic impact of lncRNAs associated with aging-related genes in HNSCC remains unknown.
Here, we use bioinformatics to probe into the mechanisms of aging-related lncRNAs (ARLs) in HNSCC, identify some new molecular biomarkers linked with prognosis, and build an effective prognostic model to forecast the survival of HNSCC patients and function as their new treatment target.
We downloaded the RNA sequencing data and clinical data of HNSCC and normal tissues from The Cancer Genome Atlas (TCGA) (https://portal.gdc.cancer.gov/). Aging-related genes were acquired from the Human Ageing Genomic Resources (HAGR; Table S1). Expression data were standardized to fragment per kilobase million. Based on Strawberry Perl, we integrated and processed the data, distinguished between lncRNA and mRNA, extracted complete clinical information, and removed data missing survival status and unknown survival time or <30 days.
Identification of ARLs in HNSCC
We performed co-expression analysis of lncRNAs and AGs in tumor samples (correlation coefficient > 0.5 and p < 0.001) with packages Strawberry Perl and limma R and mapped a network with igraph R. Differential expression of ARLs in cancer versus normal tissue samples was analyzed (Log2 fold change (FC) > 1, false discovery rate (FDR) < 0.05, p < 0.05) [11], and a heatmap was plotted with the R package pheatmap.
Construction of the Prognostic Signature
Based on the clinical data of HNSCC, lncRNAs with significant effects on OS were screened from ARLs (p < 0.05) using univariate Cox analysis. Samples were randomly and evenly separated into a training risk group and a test risk group on the R package caret. In the training group, we conducted the least absolute shrinkage and selection operator (LASSO) Cox regression on the R package glmnet and multivariate Cox analysis to recognize the ARLs for risk models and computed the risk score as follows:
where the coefficient denoted the regression coefficient of the corresponding lncRNA [12]. The overall group was classified by the median risk score into low- and high-risk groups.
Verification of risk signature and establishment of nomogram
We performed the Kaplan–Meier survival curve and log-rank test on the R package survminer to clarify whether the low-risk group has longer OS than the high-risk group. The 1, 3- and 5-year survival receiver’s operating characteristic (ROC) curves and the areas under the curves (AUCs) were conducted on the R package timeROC to assess the prediction efficacy in comparison with other clinical data [13]. Based on the R package rms, a nomogram for forecasting survival was built on basis of the risk score and clinical features, which were detected by both uni-/multi-variate Cox regression. We assessed the accuracy of the nomogram via calibration curve and ROC analysis.
Gene set enrichment analyses (GSEA) and assessment of the immune landscape
We performed GSEA (version 4.2.3) using the curated gene set (kegg.v7.5.1 symbols.gmt), screened at p < 0.05 and FDR < 0.25, to determine the different biofunctions and pathways between the two groups [14]. Immune cell infiltration files for HNSCC in the TCGA were obtained from UCSC Xena (https://xena.ucsc.edu/). Pearson correlation analyses between risk score and immune cell infiltration scores were conducted by the R packages “limma”, “scales”, “ggplot2”, “reshape2”, “tidyverse”, “ggpubr” and “ggtext” and we screened out and visualized the results at p < 0.05. The TME scores of HNSCC were calculated using the ESTIMATE algorithm with estimate R package. Then we assessed immune cell infiltration and immune cell function by single-sample GSEA (ssGSEA), and we accessed immune checkpoint activity by comparing differential expression of immune checkpoint genes.
Prediction of drug therapy response
We adopted the Genomics of Cancer Drug Sensitivity in Cancer (https://www.cancerrxgene.org) and R package pRRophetic to forecast the sensitivity to drug therapies as per the half-maximal inhibitory concentration (IC50) in the two groups. All the code files mentioned above can be downloaded and used at the following website: https://github.com/yexian123/ARLs-HNSCC-analysis.git.
Cell culture and cell transfection
We purchased three human nasopharyngeal carcinoma cell lines (HNE1, CNE1, and CNE2) from the Chinese Academy of Sciences (Shanghai, China). All cells were grown in an RPMI-1640 medium (KeyGEN, Nanjing, China) with 10% fetal bovine serum (FBS, PAN-Seratech, Germany) and 1% penicillin/streptomycin in 5% CO2 at 37°C. The pcDNA3.1 and LINC00861-pcDNA3.1 bought from Genescript Biotechnology were transfected into CNE1 and CNE2 cells using Lipotransfectamine 3000 (Thermo). After 48 h, the CNE1 and CNE2 cells were harvested.
Quantitative real-time PCR (qRT-PCR)
Total RNA from each cell line was extracted with an RNA-easy isolation reagent, and reversed with HiScript® III RT SuperMix for qPCR (+gDNA wiper) (both Vazyme Biotech, China) to synthesize complementary DNA (cDNA). The PCR system was made from SYBR Green® Premix Ex Taq™ (Vazyme Biotech, China). Results of individual lncRNAs were standardized to the GAPDH expression. The primer sequences for LINC00861 and GAPDH are listed in Table S2.
Cell counting kit-8 (CCK-8) assay
Cell proliferation was detected using CCK-8 assay (Beyotime, Shanghai, China) according to the instructions. Cells (1000/well) were planted into 96-well plates and grown in an RPMI-1640 medium containing 10% FBS. At the same time each day, 10 μl of a CCK-8 solution was added to each well, and further incubated for 2 h at 37°C. Absorbance at 450 nm was detected using a microplate spectrophotometer (Thermo, USA) and used to estimate the proliferative capacity of CNE1 and CNE2 cells.
We assessed cell proliferation using an EdU assay kit (RiboBio, China). CNE1 and CNE2 cells (5 × 10⁴ cells/well) were inoculated in a confocal laser cuvette, then cultured in a medium with 50 μM EdU (C10310-1, RiboBio) for 2 h and treated as per the instructions. Images were obtained under a fluorescent microscope. The mean proportion of EdU-positive cells in three random fields of view was analyzed.
Senescence-associated β-galactosidase (SA-β-gal) staining
Cellular SA-β-gal activity were assayed according to the manufacturer’s instructions (C0602, Beyotime, Nanjing, China). CNE1 and CNE2 cells were fixed and stained with the fixative solution and staining solution mixture provided in the kit. Observe and photograph the cells under an ordinary light microscope. The number of SA-β-gal-positive cells in 3 to 5 regions of the 6-well plate was randomly counted as a percentage of the total number of cells, and the mean value was calculated.
All statistical analysis and graphical visualization were conducted on R software 4.1.2. Categorical data between groups were compared via the chi-square test. Continuous variables in normal distribution (containing risk score and TME scores) were compared between two or more groups via Student’s t-test or one-way ANOVA. Differences in expression levels between immune checkpoint genes and ARLs were investigated via Wilcox test. The significance level was probability less than 0.05.
Identification of aging-related LncRNAs in HNSCC patients
Fig. 1 illustrates the flowchart of the study. Firstly, we downloaded transcript data of 44 normal and 504 cancer samples from TCGA on 2022-04-15. Then 307 aging-related genes (ARGs) were obtained from HAGR (Table S1). After that, we got 156 AGs and 565 ALRs by correlation analysis (correlation coefficient > 0.5 and p < 0.001).
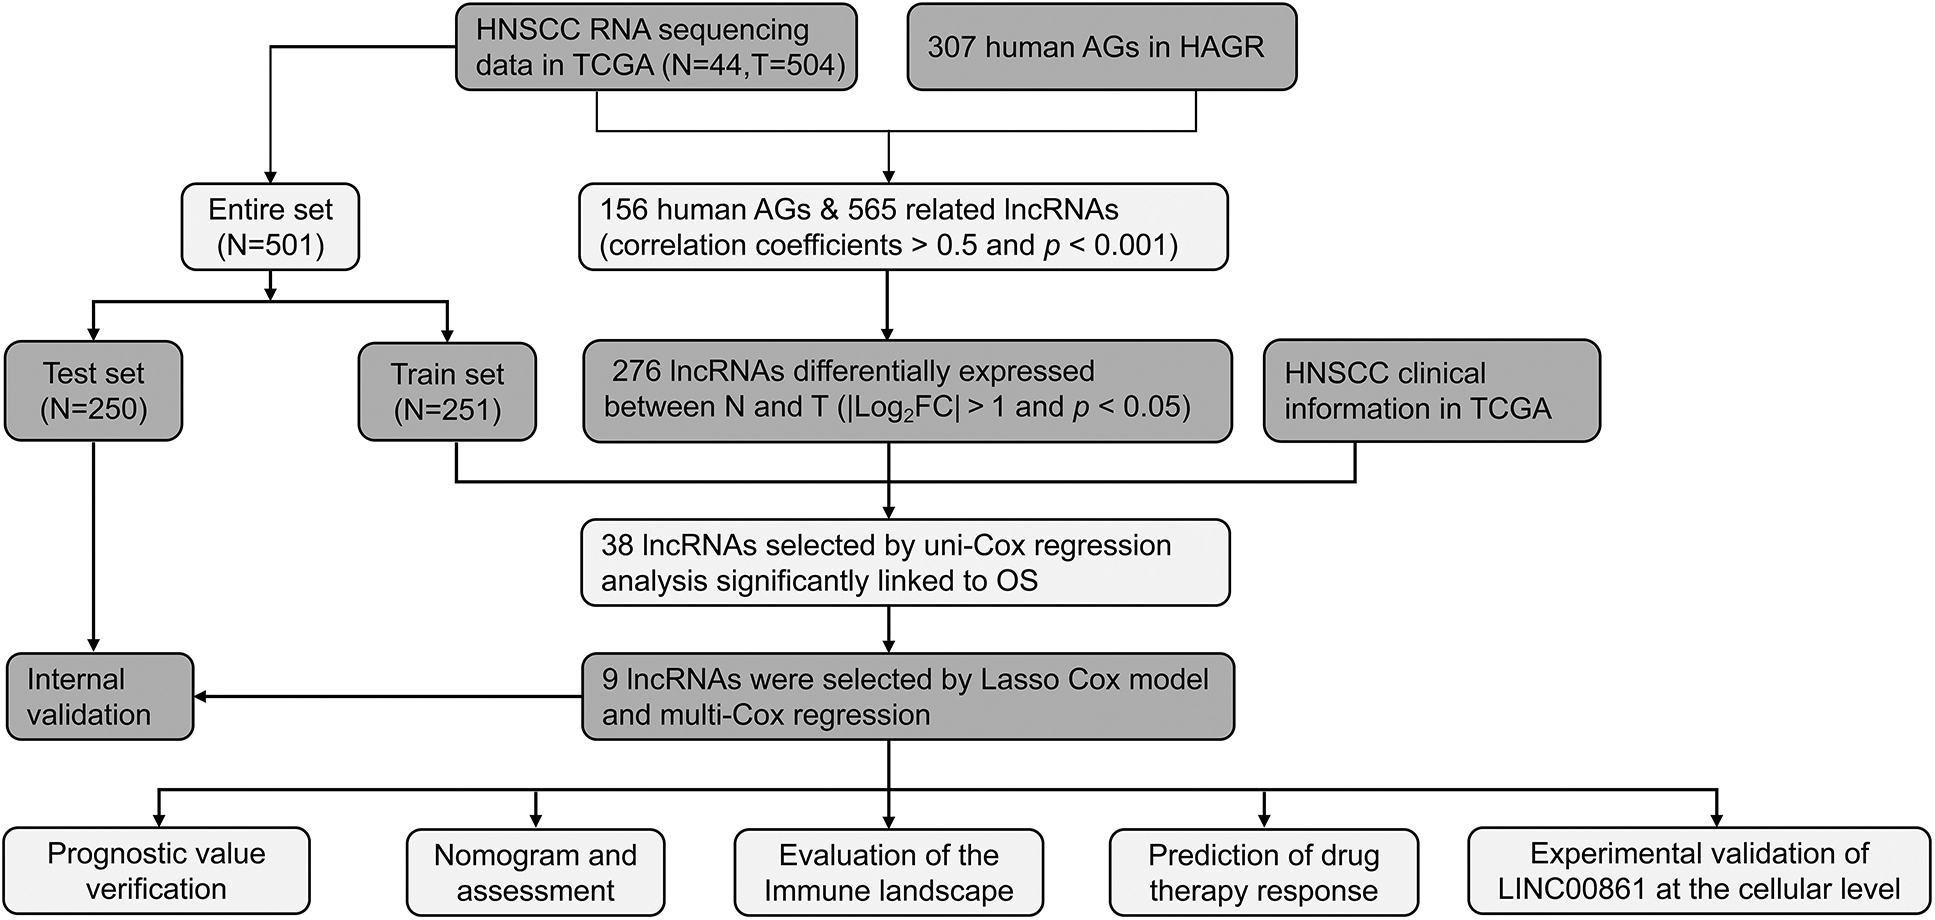
Figure 1: The flow chart of the whole analysis process.
The regulatory network of these lncRNAs with AGs is shown in Fig. 2A. Based on differential expression analysis of the ALRs in cancer versus normal tissue samples (|Log2FC| > 1 and p < 0.05), we acquired 276 significantly different ALRs, of which 244 were up-regulated and 32 were down-regulated in cancer tissues (Table S3, Fig. 2B).
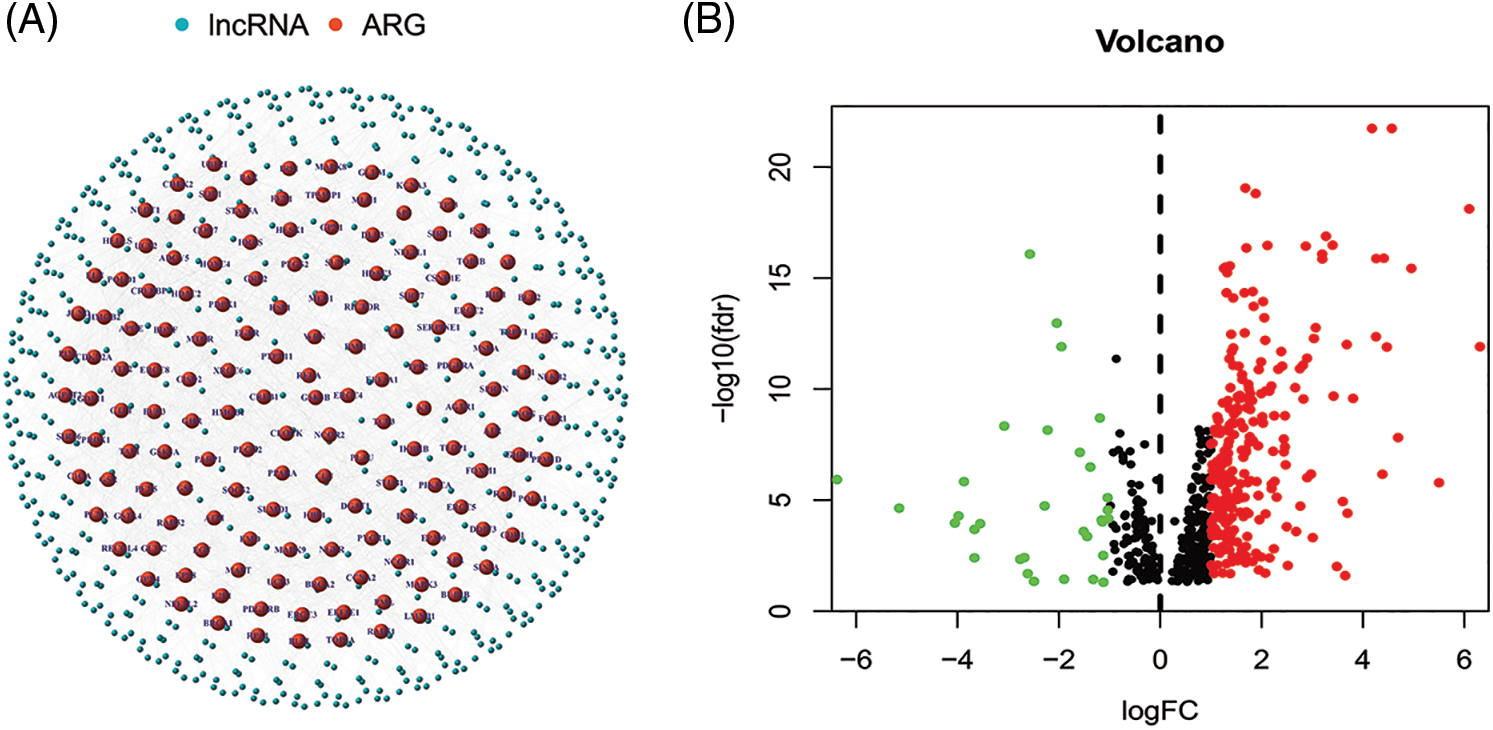
Figure 2: (A) The regulatory network showed 565 lncRNAs associated with 156 AGs. (B) The 276 significantly different ALRs in cancer versus normal tissue samples.
Establishment and verification of the prognostic model
The 501 eligible tumor samples with complete information were equally divided into a train (N = 251) group and a test group (N = 250). In the training group, univariate Cox regression analysis identified 38 ALRs significantly related with overall survival (OS) (p < 0.05) (Figs. 3A and 3B). To avoid over-fitting of the prognostic features, we used LASSO regression of these lncRNAs and isolated sixteen lncRNAs associated with AGs in HNSCC when the first-order value of Log(λ) was the smallest likelihood of bias (Figs. 3C and 3D), where Log(λ) was −3.96. After that, we performed multi-COX regression analysis and finalized nine ARLs used to construct the model. The Sankey diagram (Fig. 3E) demonstrated that these nine lncRNAs were positively associated with the AGs ADCY5, C1QA, CDKN2A, ELN, GSR, KCNA3, TFDP1 and UCP2.
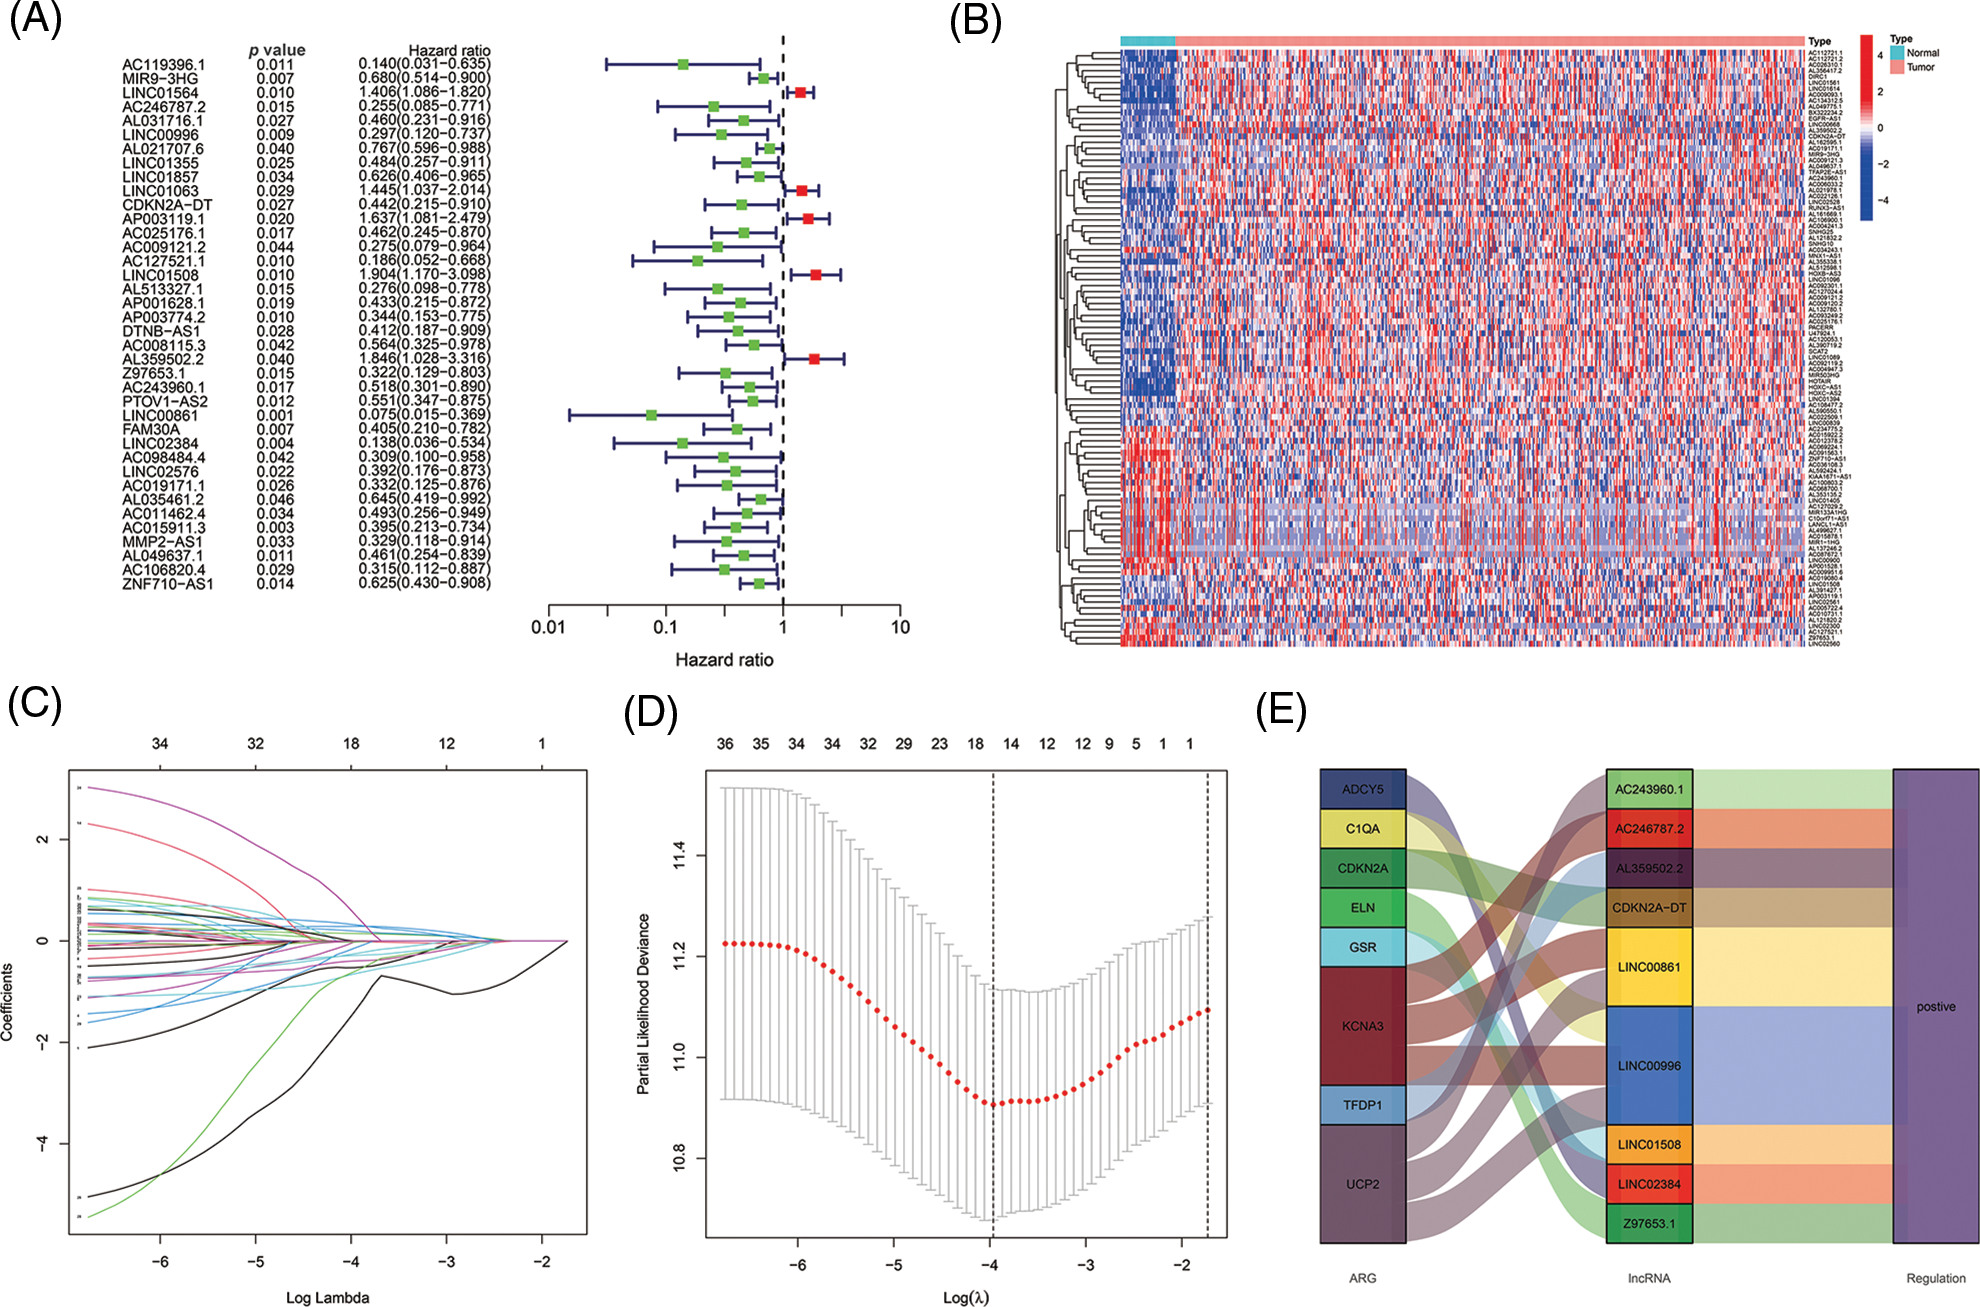
Figure 3: Selecting eligible ARLs in the training group for building the model. (A) ARLs affecting OS extracted by univariate Cox regression analysis. (B) The heatmap showed the expression profiles of 38 prognostic lncRNAs. (C) The 10-fold cross-validation for variable selection in the LASSO model. (D) The LASSO coefficient profile of 16 ARLs, the intersection of the middle dashed line with the upper X-axis is the number of lncRNAs obtained from the LASSO regression, and the intersection with the lower X-axis is the value of Log(λ). (E) The Sankey diagram of 8 aging-related genes and 9 associated lncRNAs.
Risk scores were calculated as follows: AC246787.2 × (−1.08765834515961) + LINC00996 × (−1.00608978255594) +`CDKN2A-DT` × (−0.754633772241435) + LINC01508 × (0.524759230799357) + AL359502.2 × (0.64309513483616) + Z97653.1 × (−1.22717339963094) + AC243960.1 × (3.02676937595734) + LINC00861 × (−4.95297301646684) + LINC02384 × (−1.88205538422933).
With the risk score formula, we divided the train, test, and entire groups into low- and high-risk groups. We compared the distribution of risk scores, survival status, lncRNA expression, and survival time among the risk groups. All results showed significant differences between the low- and high-risk groups (Figs. 4A–4D). Time-dependent receiver operating characteristics (ROC) were used to assess the sensitivity and specificity of the model for prognosis. We also illustrated the ROC results in terms of the area under the ROC curve (AUC); the 1-, 3- and 5-year AUCs were 0.751, 0.779, and 0.801 for the train set, 0.645, 0.681, and 0.713 for the test set and 0.679, 0.684 and 0.695 for the whole group, respectively (Fig. 4E). In the entire set, patients showed the same results for age, gender, T, N, or M staging, and grade (Fig. 4F).
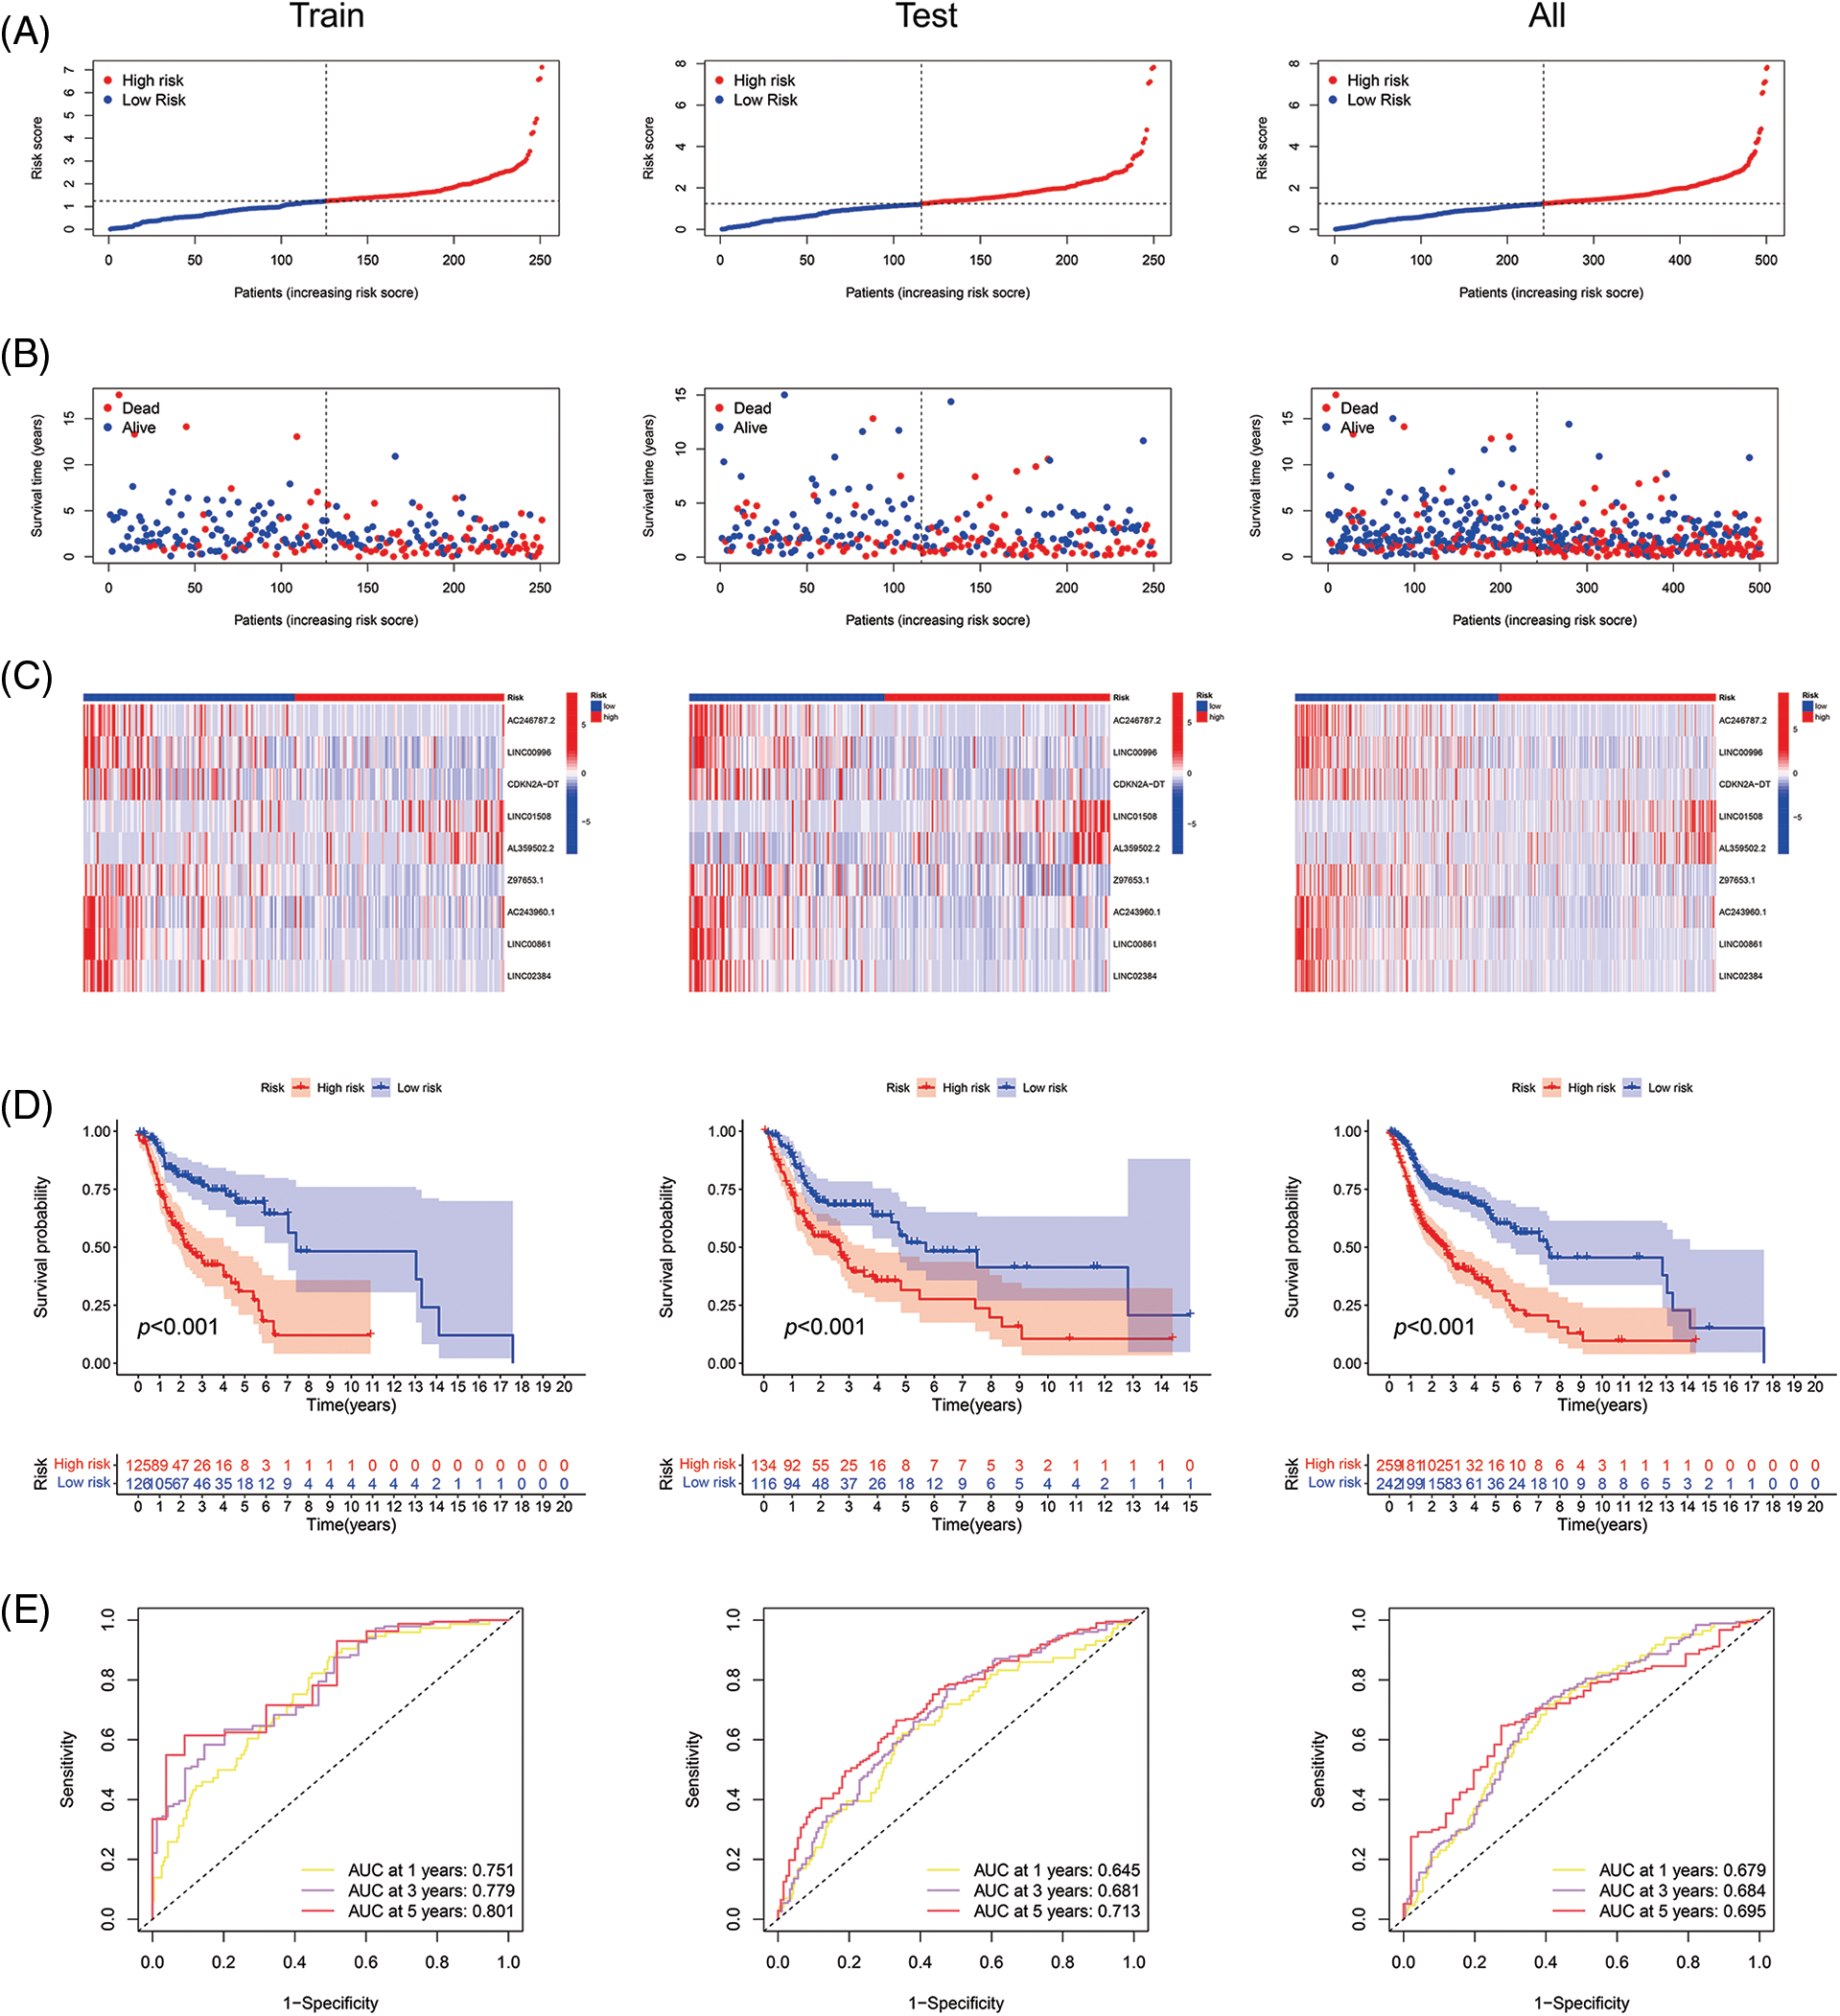
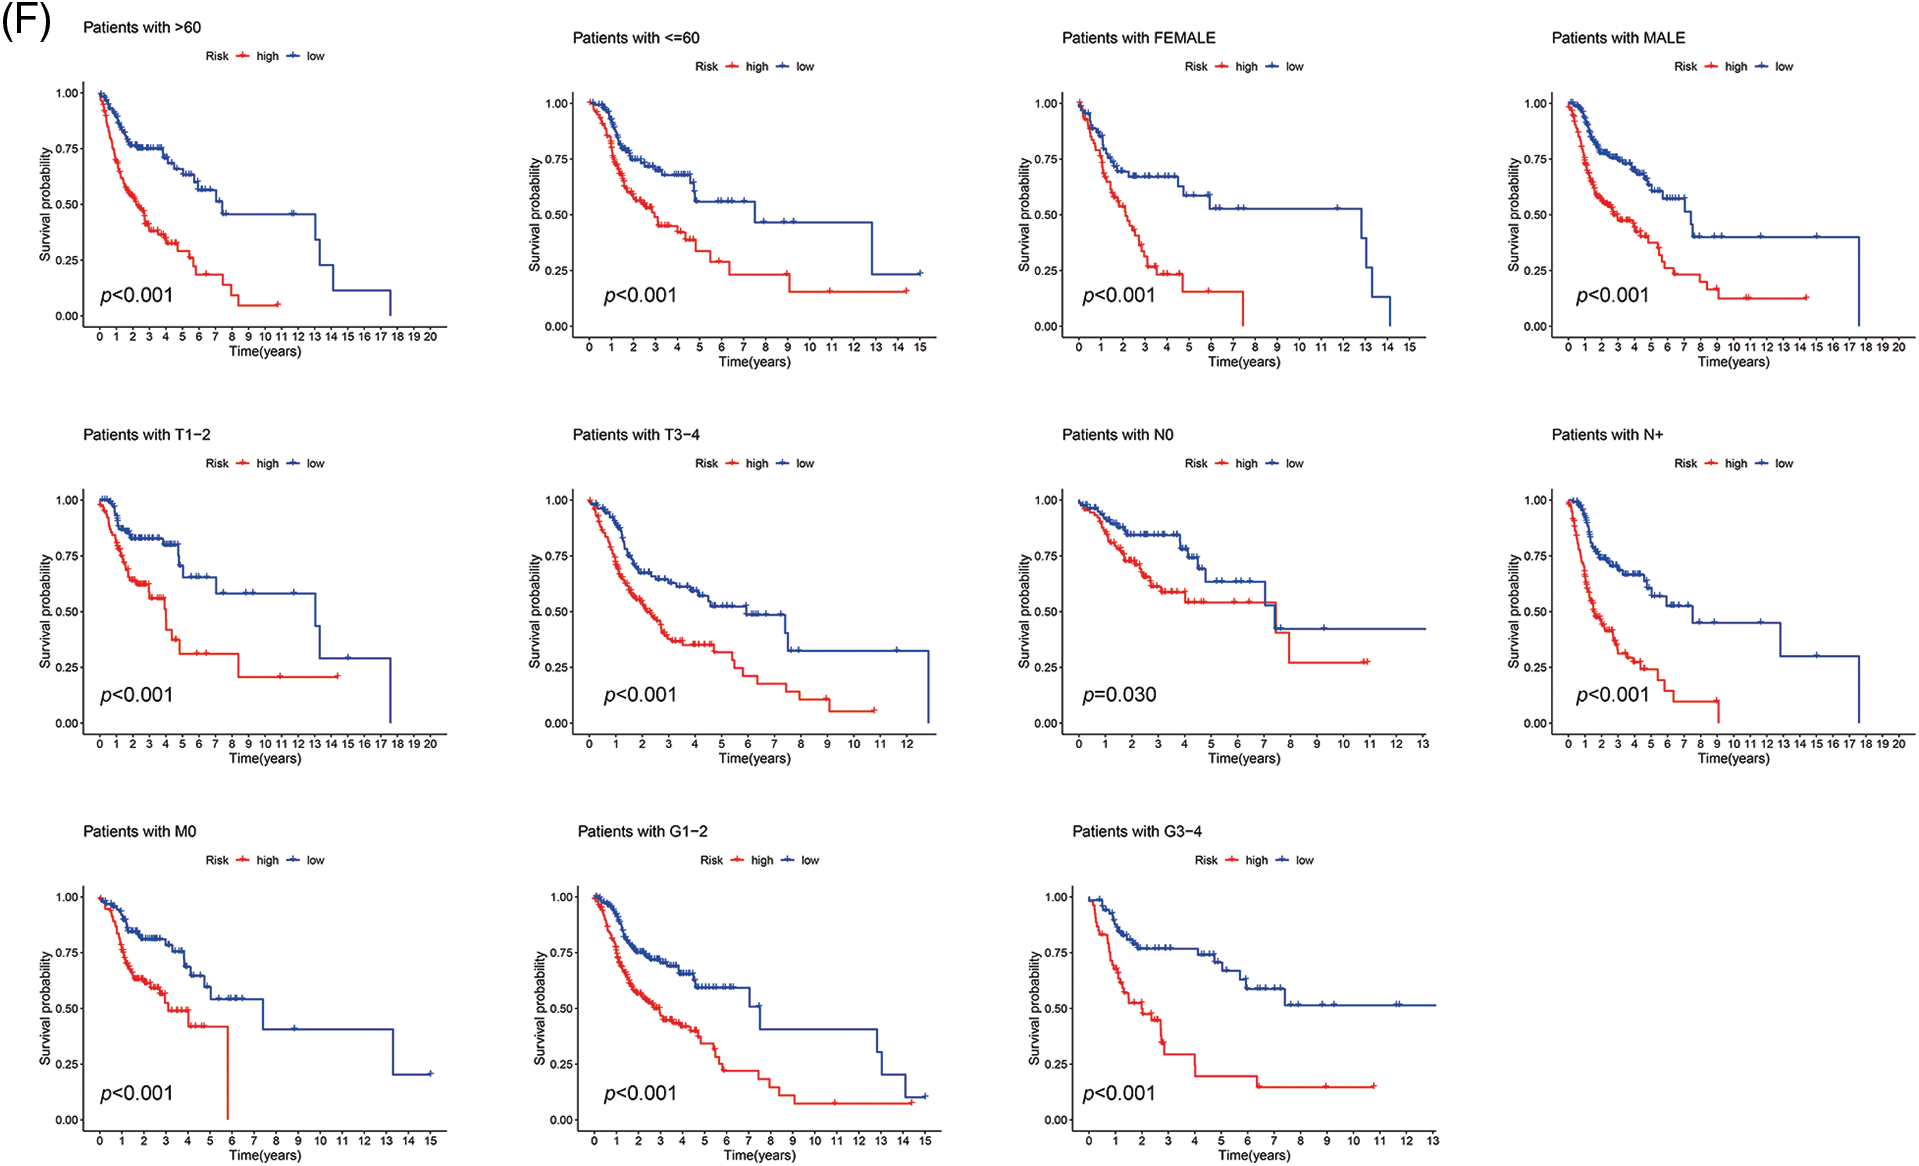
Figure 4: Prognosis value of the 9 ARLs model in the train, test, and all sets. (A) Exhibition of ARLs model based on risk score of the train, test, and entire sets, respectively. (B) Survival time and survival status between low- and high-risk groups in the train, test, and all sets, respectively. (C) The heat map of 9 ARLs expressions in the train, test, and all sets, respectively. (D) Kaplan-Meier survival curve of OS for patients between risk groups in the train, test, and all sets, respectively. (E) The train, test, and all sets’ 1-, 3-, and 5-year ROC curves, respectively. (F) Kaplan-Meier survival analysis for HNSCC patients stratified by age, gender, T, N, or M staging, and grade in all set.
Independent prognostic ability of the signature
In univariate Cox regression analyses for all tumor samples, the hazard ratio (HR) for the risk score was 1.324, with a 95% confidence interval (CI) of 1.193–1.468 (p < 0.001). In addition, age, and stage were also statistically different (Fig. 5A). In the multivariate Cox regression, risk score (HR: 1.379, 95% CI: 1.225–1.553, p < 0.001), age (HR: 1.023, 95% CI: 1.007–1.038; p = 0.003) and stage (HR: 1.610, 95% CI: 1.322–1.960; p < 0.001) were independent prognostic factors of HNSCC (Fig. 5B).
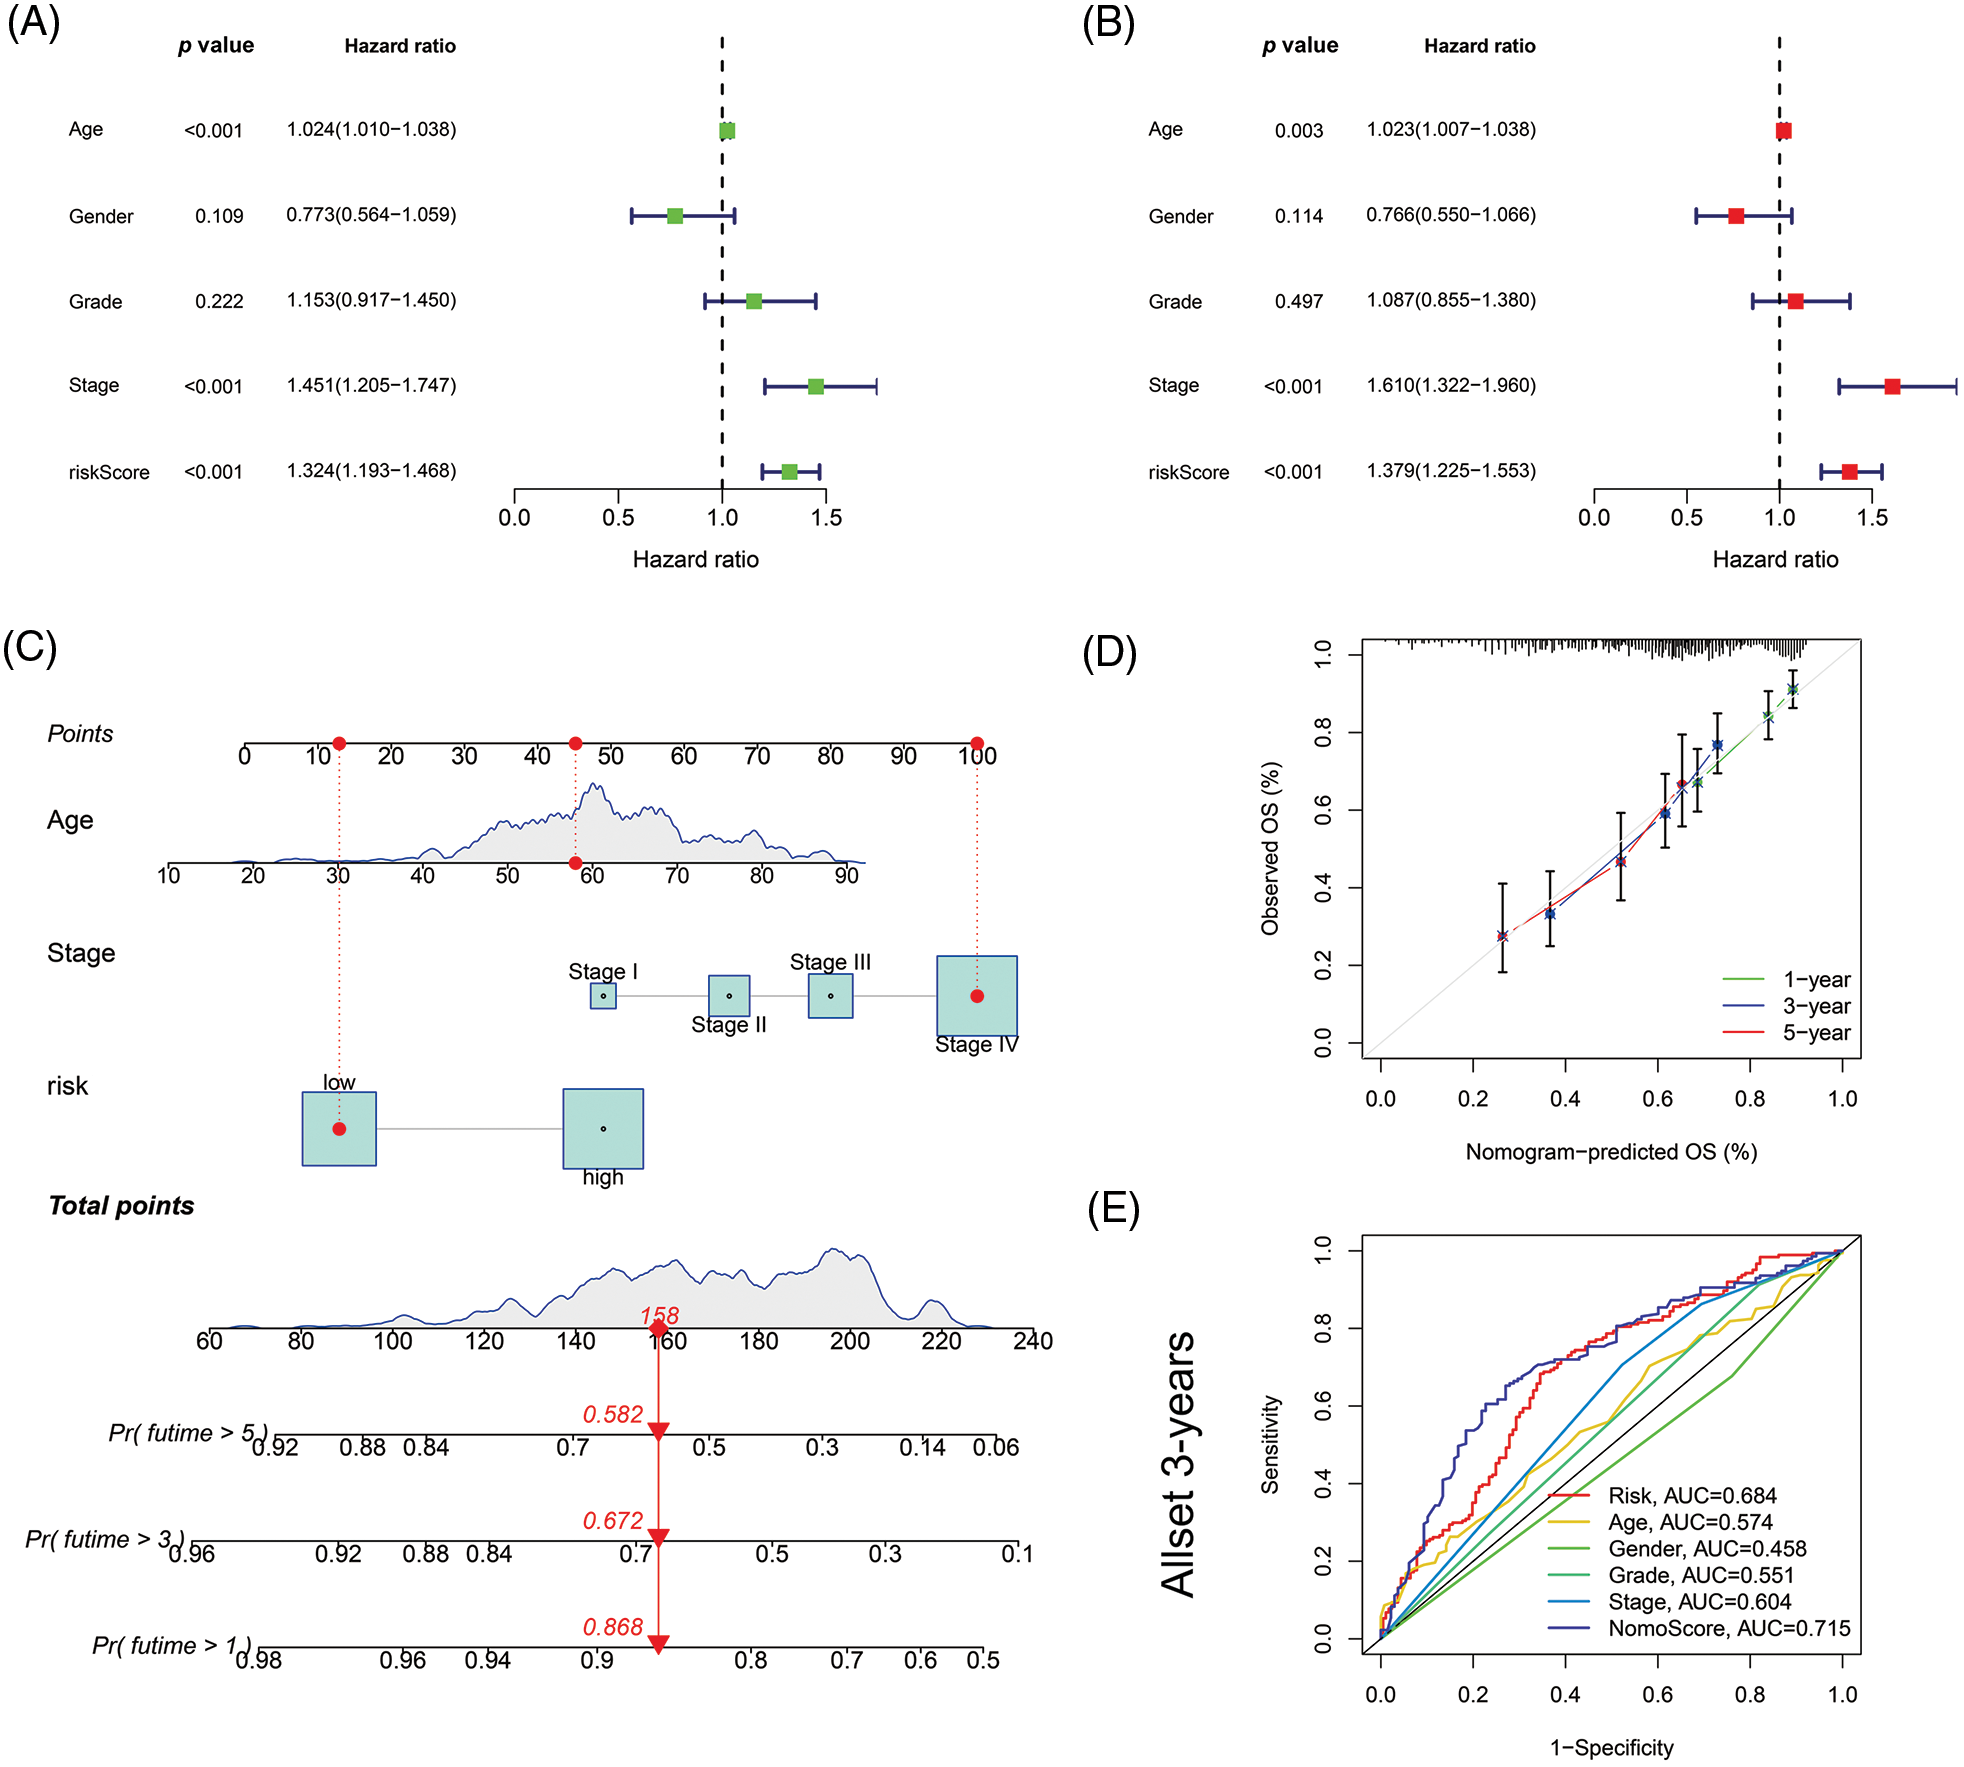
Figure 5: Nomogram and assessment of the risk model. (A) Uni-Cox and (B) multi-Cox analyses of clinical factors and risk score with OS. (C) The nomogram that integrated the age, tumor stage, and risk score predicted the probability of the 1-, 3-, and 5-year OS. (D) The calibration curves for 1-, 3-, and 5-year OS. (E) The 3-year ROC curves of risk score, nomogram total score, and clinical characteristics.
Then based on risk score, age, and stage, we constructed a nomogram to predict the incidence rates of 1-, 3-, and 5-year OS in HNSCC patients (Fig. 5C). The calibration curves demonstrated a high concordance between the actual and nomogram-predicted survival rates of HNSCC patients (Fig. 5D). The sensitivity and specificity of the model for prognosis were evaluated via time-dependent ROC. The risk score (AUC = 0.684) and nomogram score (AUC = 0.715) had better predictive ability than age, gender, grade, and stage in the 3-year ROC of the risk model (Fig. 5E).
Gene set enrichment analyses and investigation of immune status
Firstly, with the GSEA software, we explored the KEGG pathways in low- and high-risk groups to investigate the biofunction differences. Of the top 10 significantly enriched pathways, the high-risk group was enriched in only one pathway related to steroid biosynthesis. In comparison, the low-risk group was enriched in four immune-associated KEGG pathways (all FDR < 0.25) (Fig. 6A). Then we analyzed the relevance of immune cells to the low- and high-risk groups using data from multiple platforms. Results showed the majority of immune cells were related to the low-risk group, which generally agrees with the GSEA results (Fig. 6B). The content of B cells, follicular helper T cells (cTfh), was negatively related to the risk score, suggesting they were more abundant in the low-risk group (Fig. 6C), which had larger immune score and ESTIMATE score (Fig. 6D). Furthermore, the low-risk group had more immune cell infiltration such as B cells, CD8+ T cells, and dendritic cells (DCs), and more prosperous immune functions (Fig. 6E). The above results imply that the low-risk group is under a higher immune infiltration state.
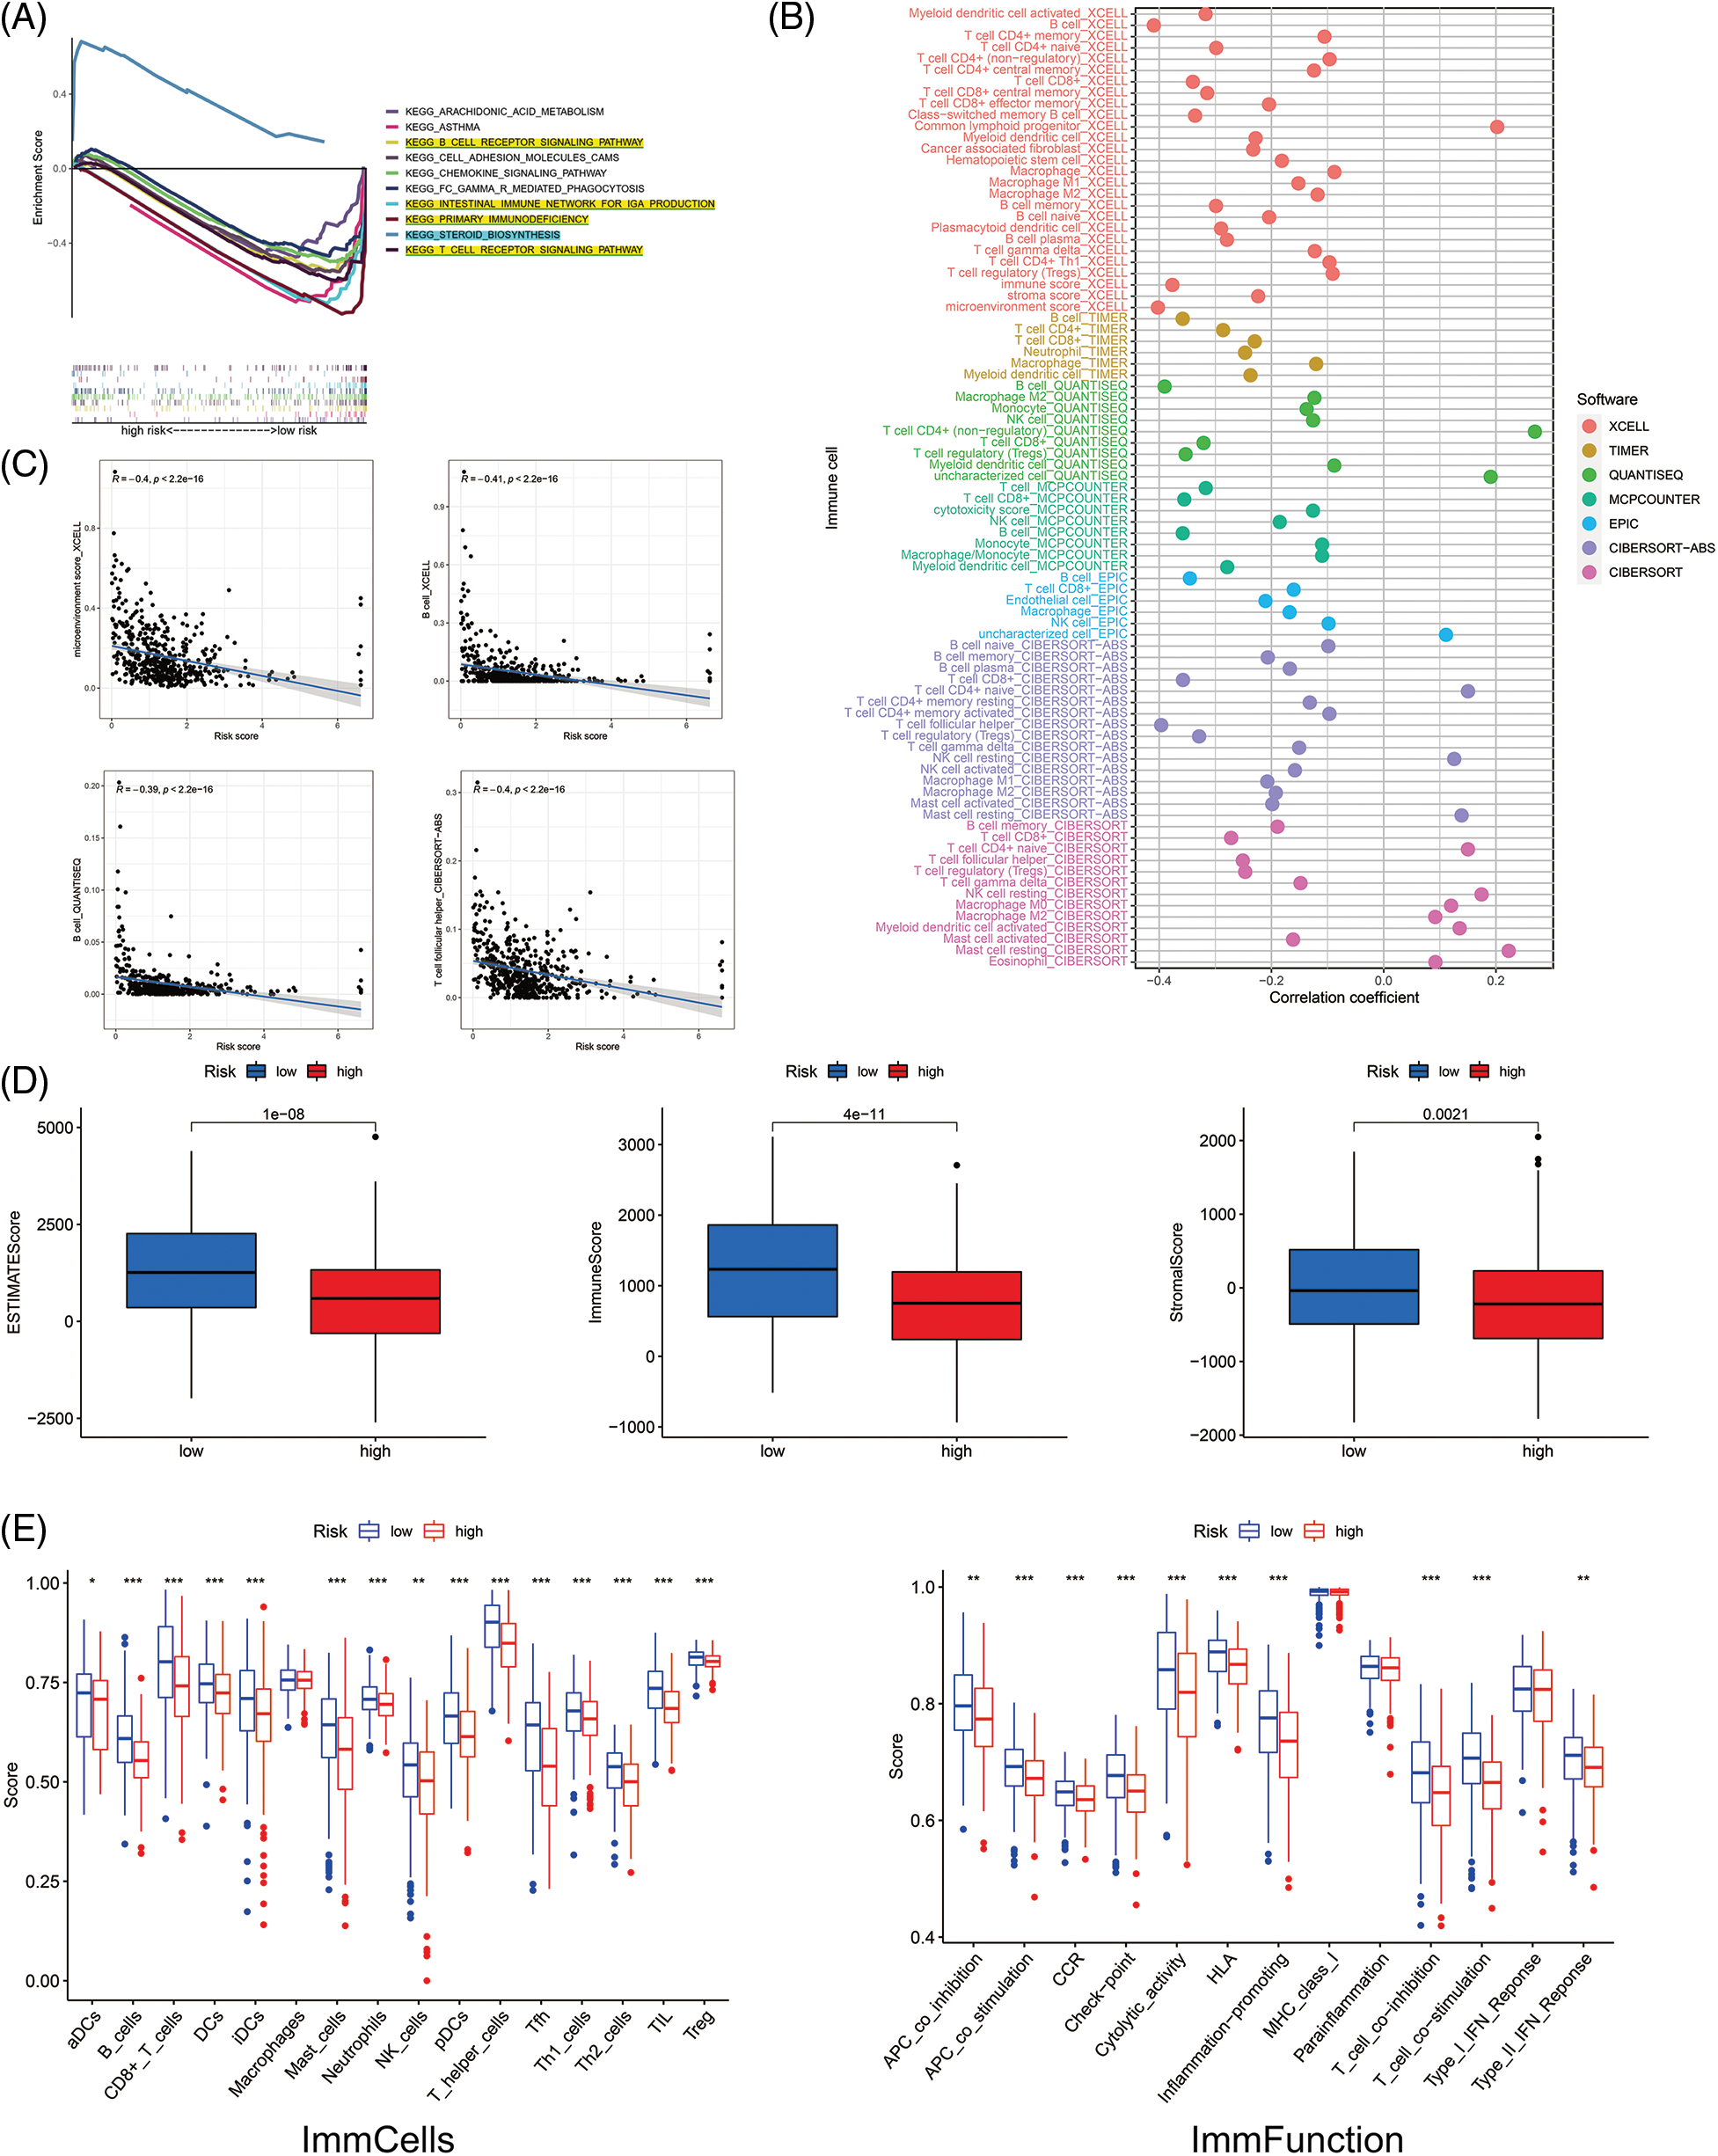
Figure 6: The investigation of tumor immune factors and immunotherapy. (A) GSEA of the top 10 pathways significantly enriched in the low- and high-risk groups. (B) The immune cell bubble of risk groups. (C) The correlation between risk score and immune cells. (D) The comparison of immune-related scores between low- and high-risk groups. (E) The difference between immune cell infiltration and immune functions in risk groups. *p < 0.05; **p < 0.01; ***p < 0.001.
Clinical treatment response analyses
Most immune checkpoints were also better activated in the low-risk group (Fig. 7A), which means we can group HNSCC patients by the risk pattern to select the appropriate checkpoint inhibitor. The low-risk group with higher immune scores had smaller IC50 in 15 immunotherapeutic agents (Fig. 7B) [15–29] and was more sensitive to 18 targeted therapeutics (e.g., Nilotinib) and six chemotherapeutic agents (e.g., Vinblastine) than the high-risk group. All 39 chemicals were shown in Fig. S1. Sixteen drugs had lower IC50 in the high-risk group (Fig. S2), of which three drugs including Bryostatin.1 were associated with immunotherapy (Fig. 7C) [30–32].
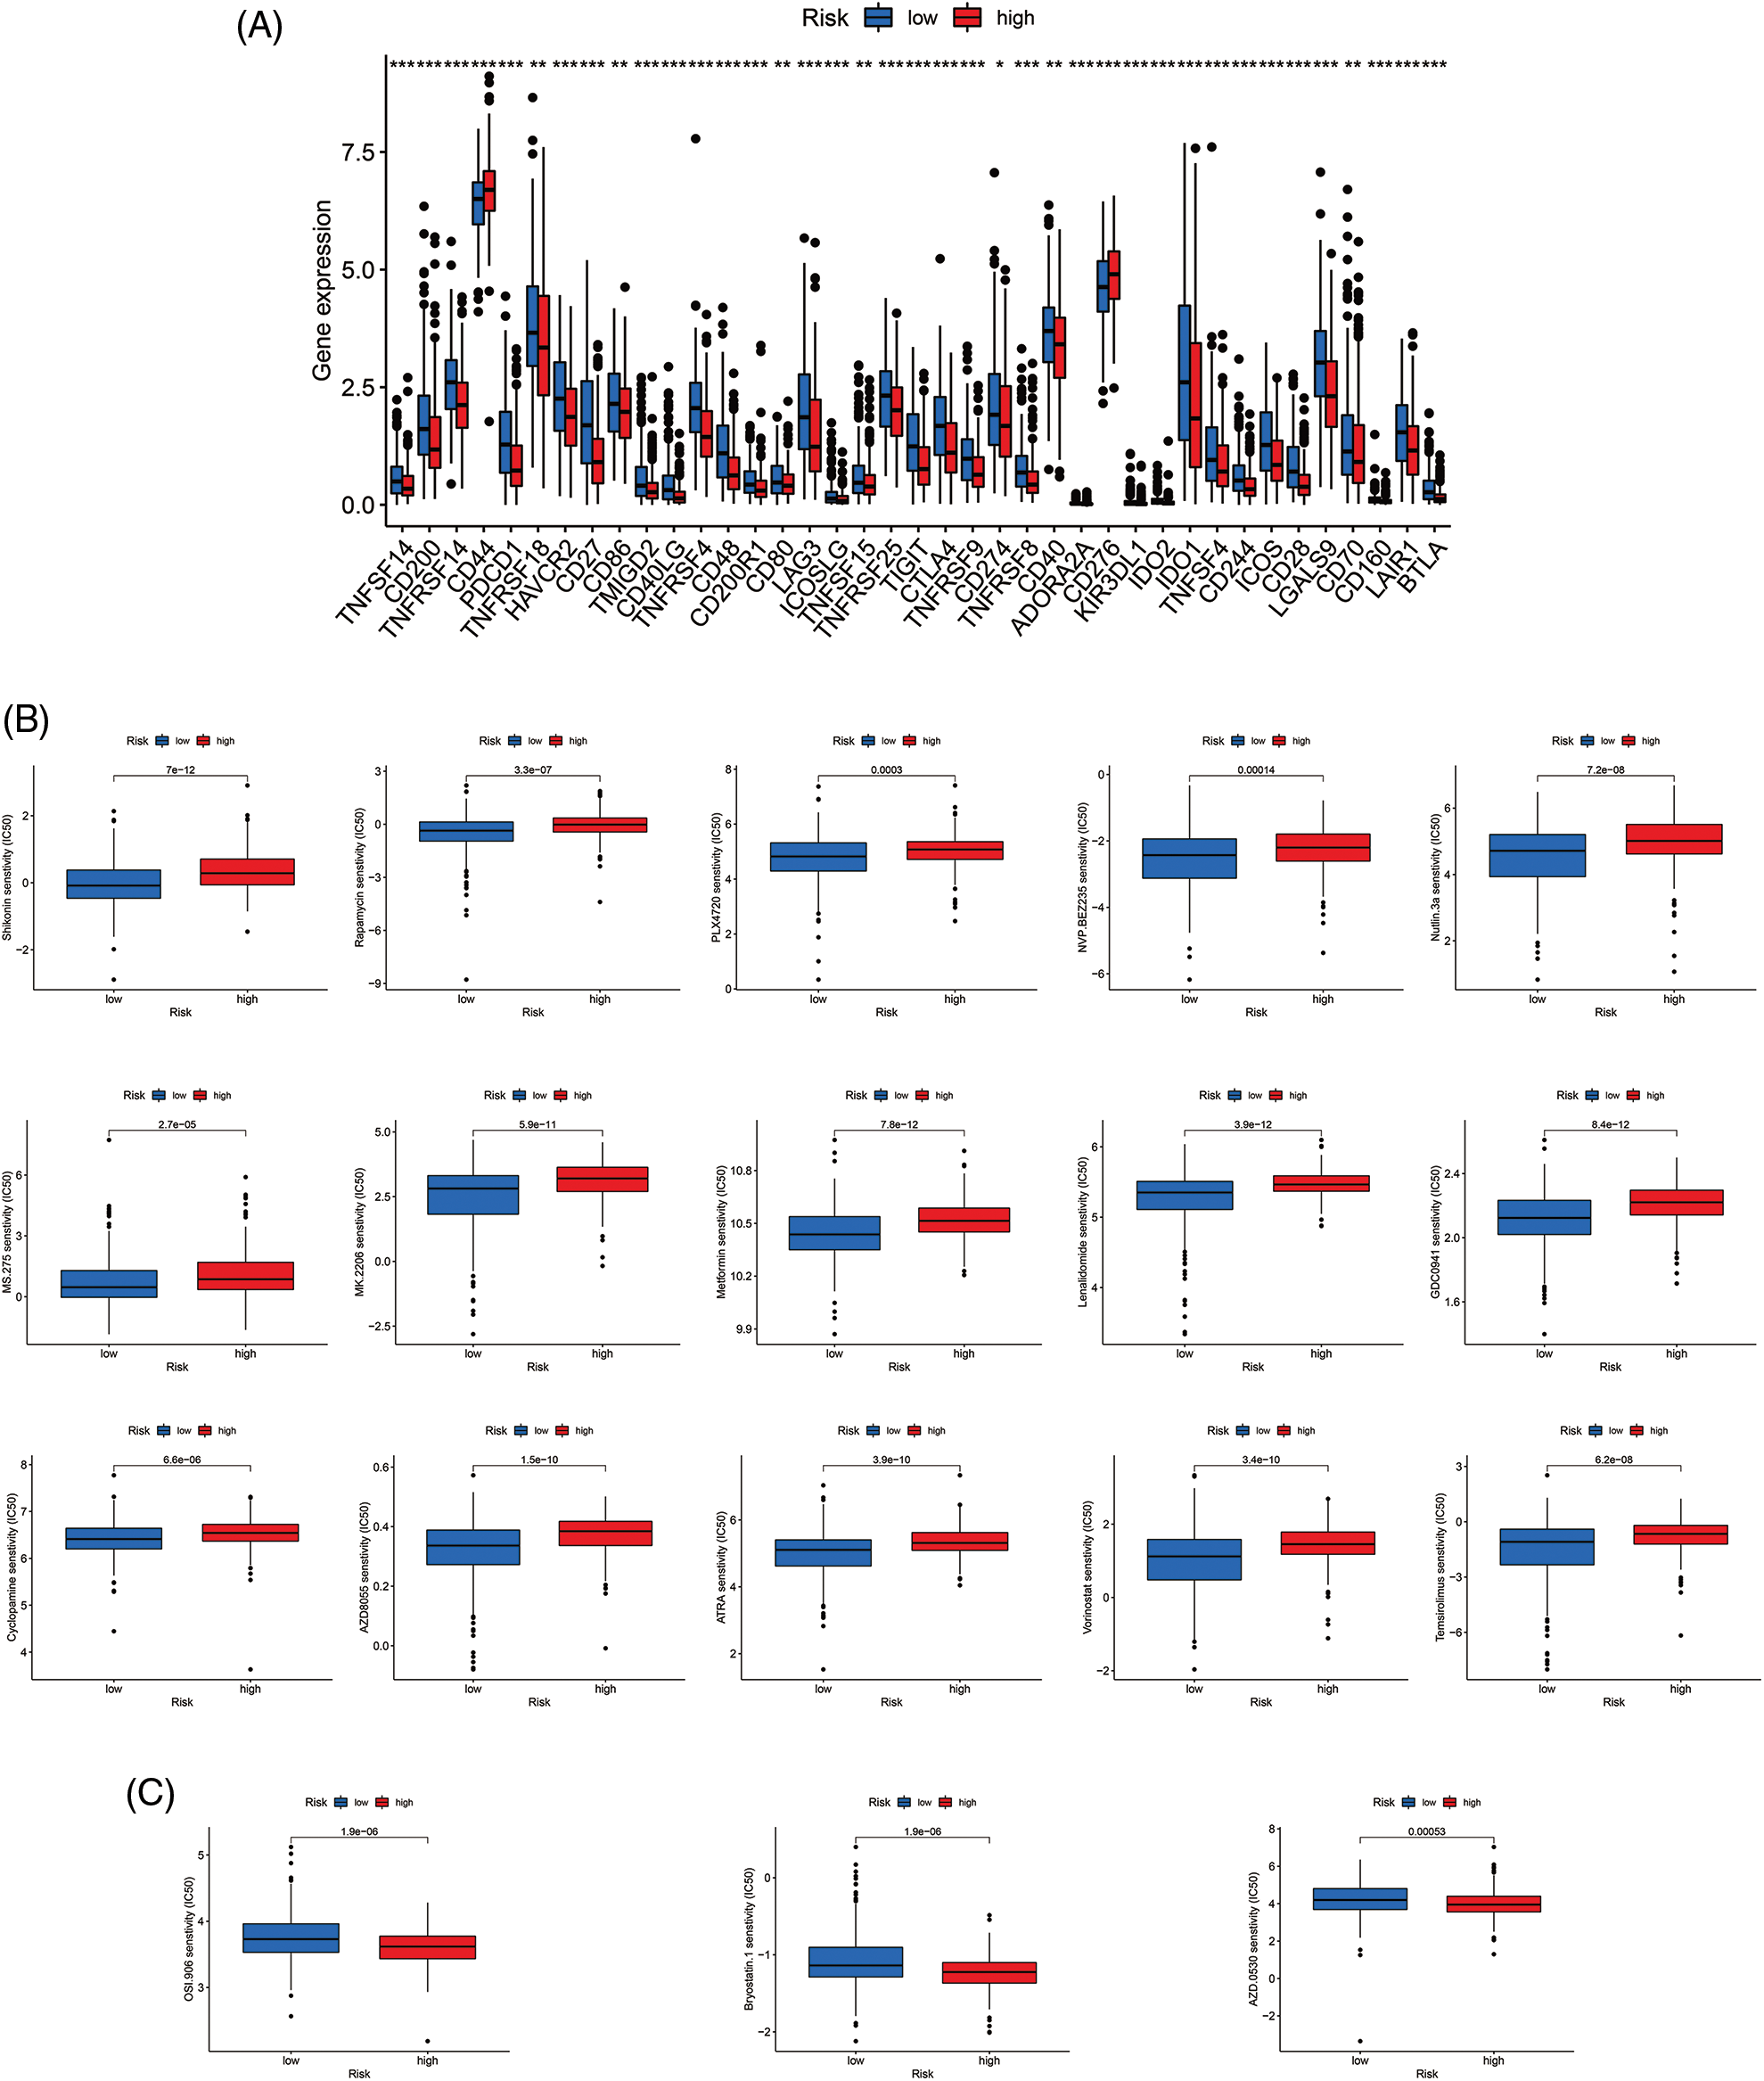
Figure 7: Immune checkpoints and drug sensitivity analyses. (A) The difference in immune checkpoint expression in risk groups. (B) Fifteen immunotherapeutic drugs showed lower IC50 values in the low-risk group. (C) Three immunotherapeutic drugs showed lower IC50 values in the high-risk group. *p < 0.05; **p < 0.01; ***p < 0.001.
LINC00861 inhibited the proliferation of nasopharyngeal carcinoma cells
We selected LINC00861 for further analysis since it had the highest correlation with the risk signature. The qRT-PCR indicated that LINC00861 was differentially expressed in three different nasopharyngeal carcinoma cell lines (Fig. 8A). We transfected the LINC00861-PCDNA3.1 plasmid in CNE1 and CNE2 cells to overexpress it and verified the transfection efficiency by qRT-PCR (Fig. 8B). CCK-8, Edu, and SA-β-gal Staining assays showed that LINC00861 overexpression considerably inhibited the growth and increased the senescence of CNE1 and CNE2 cells (Figs. 8C–8E).
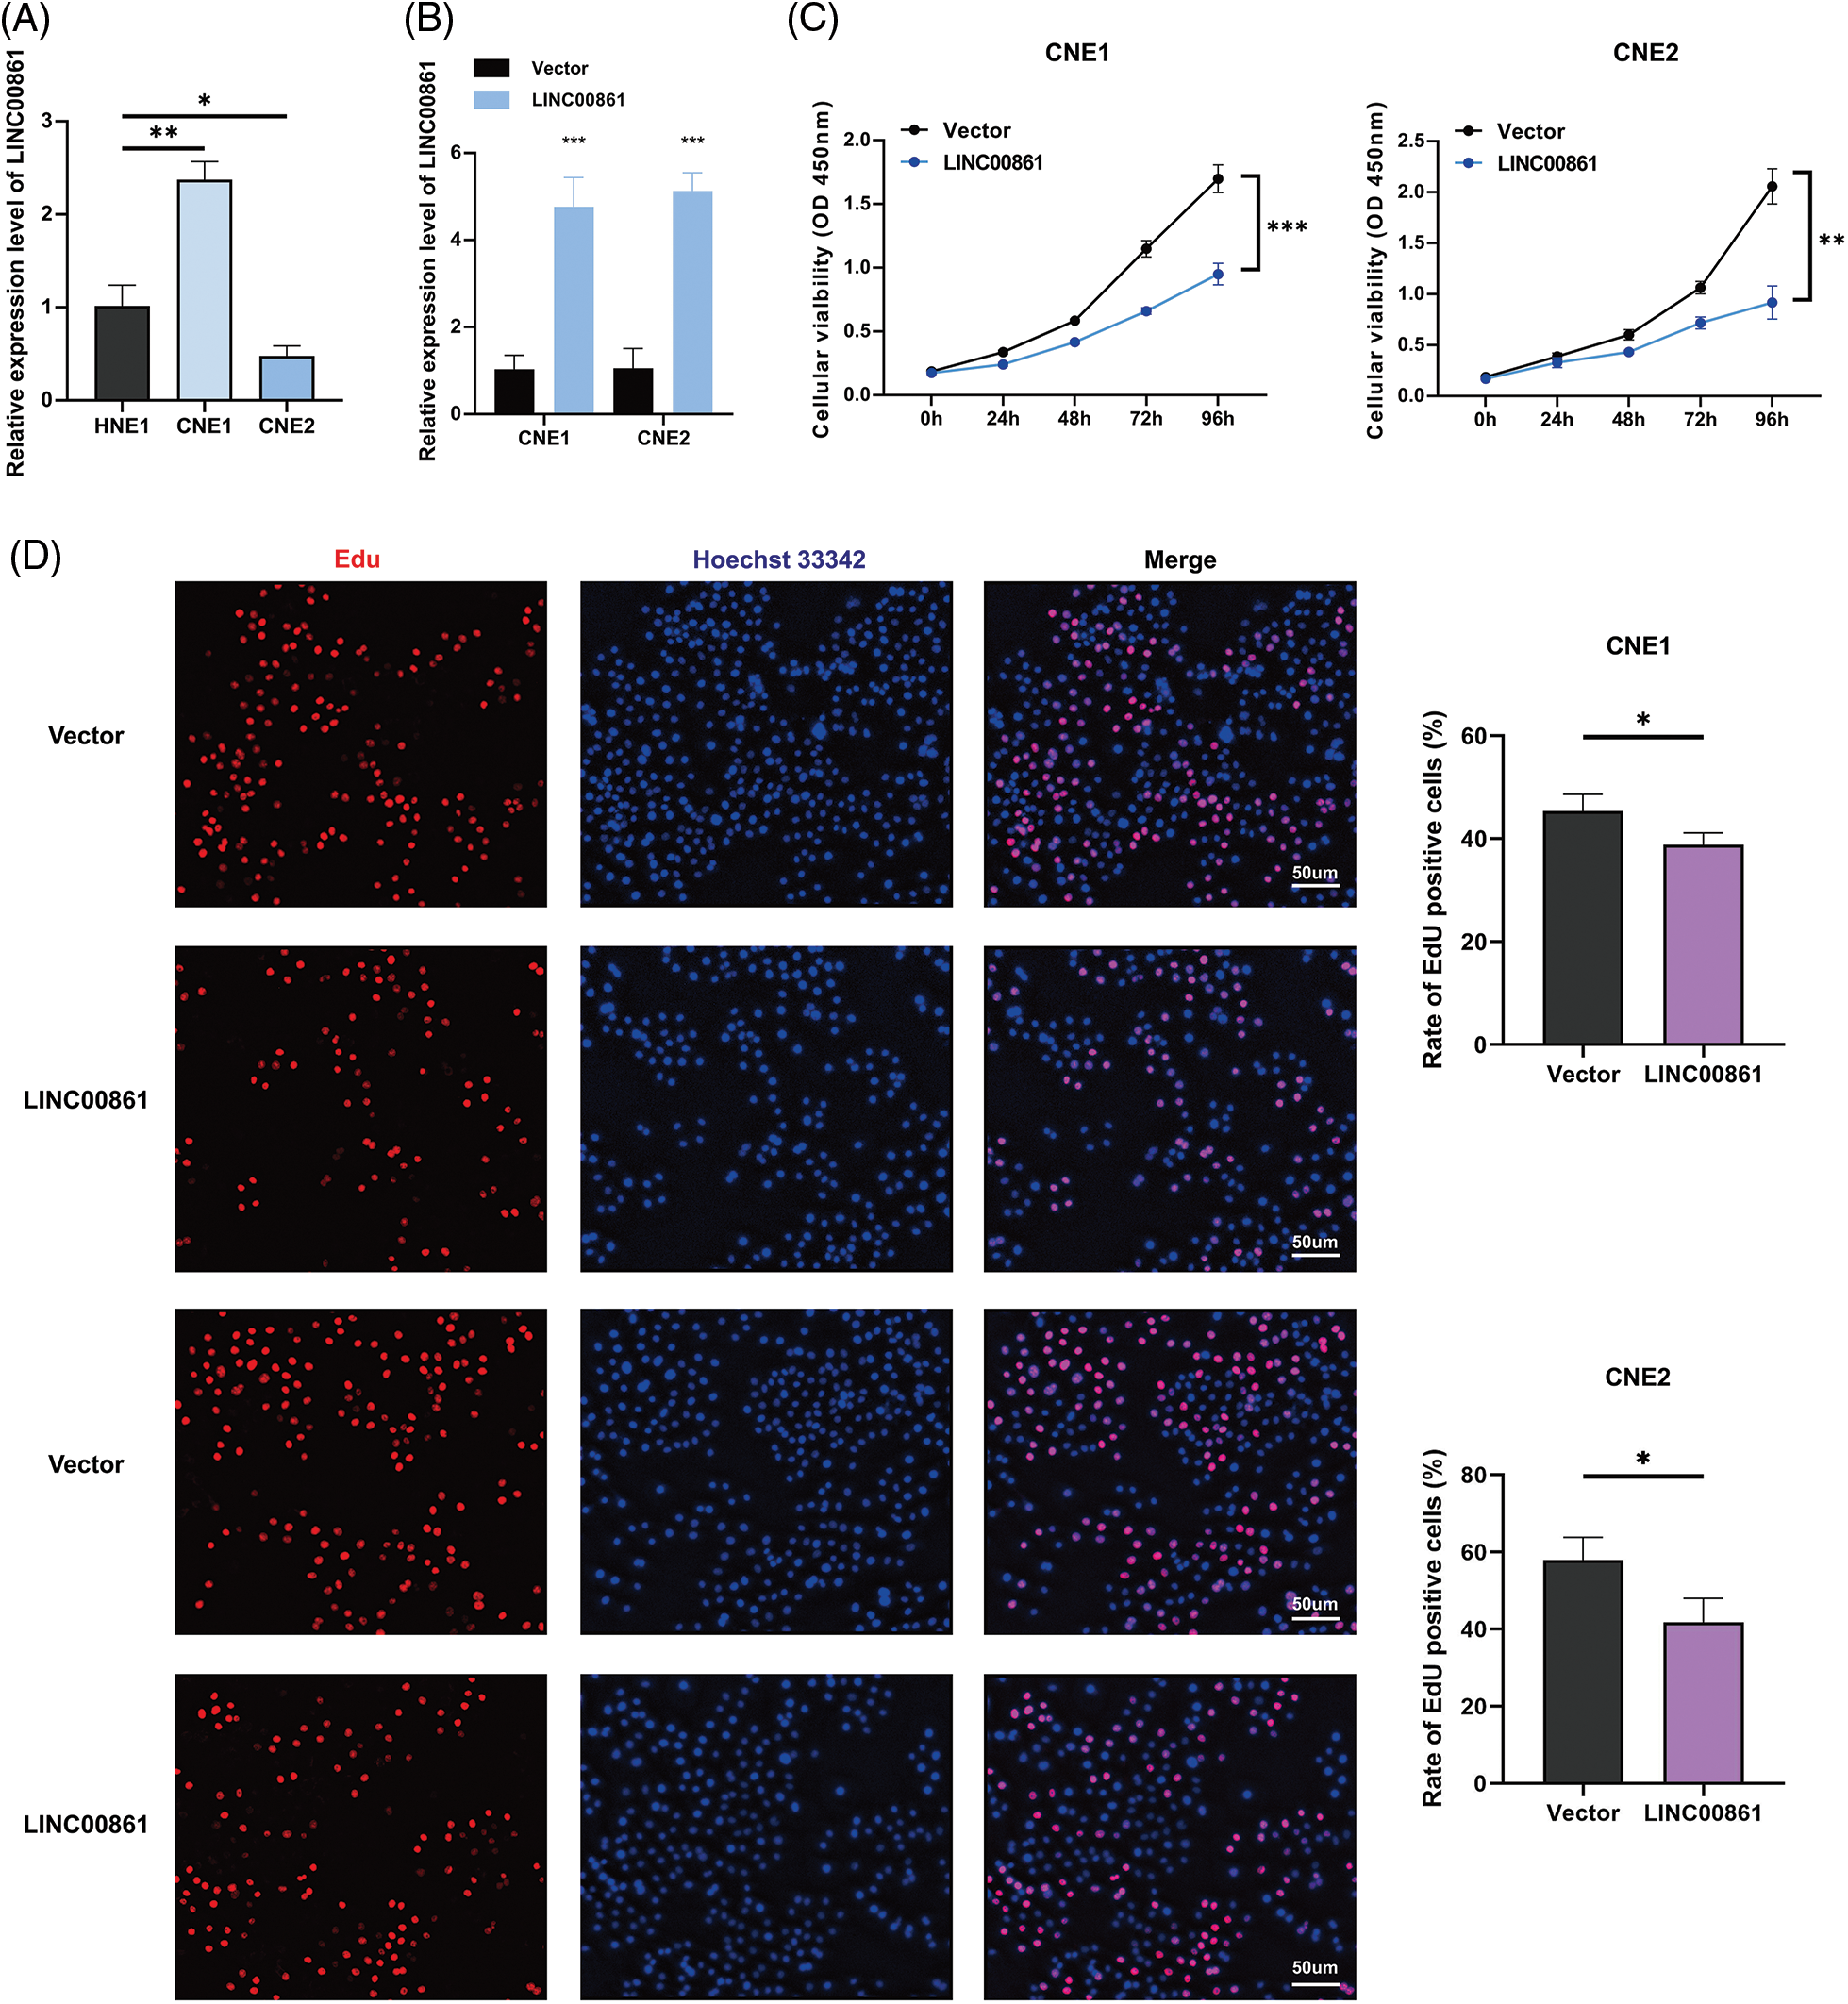
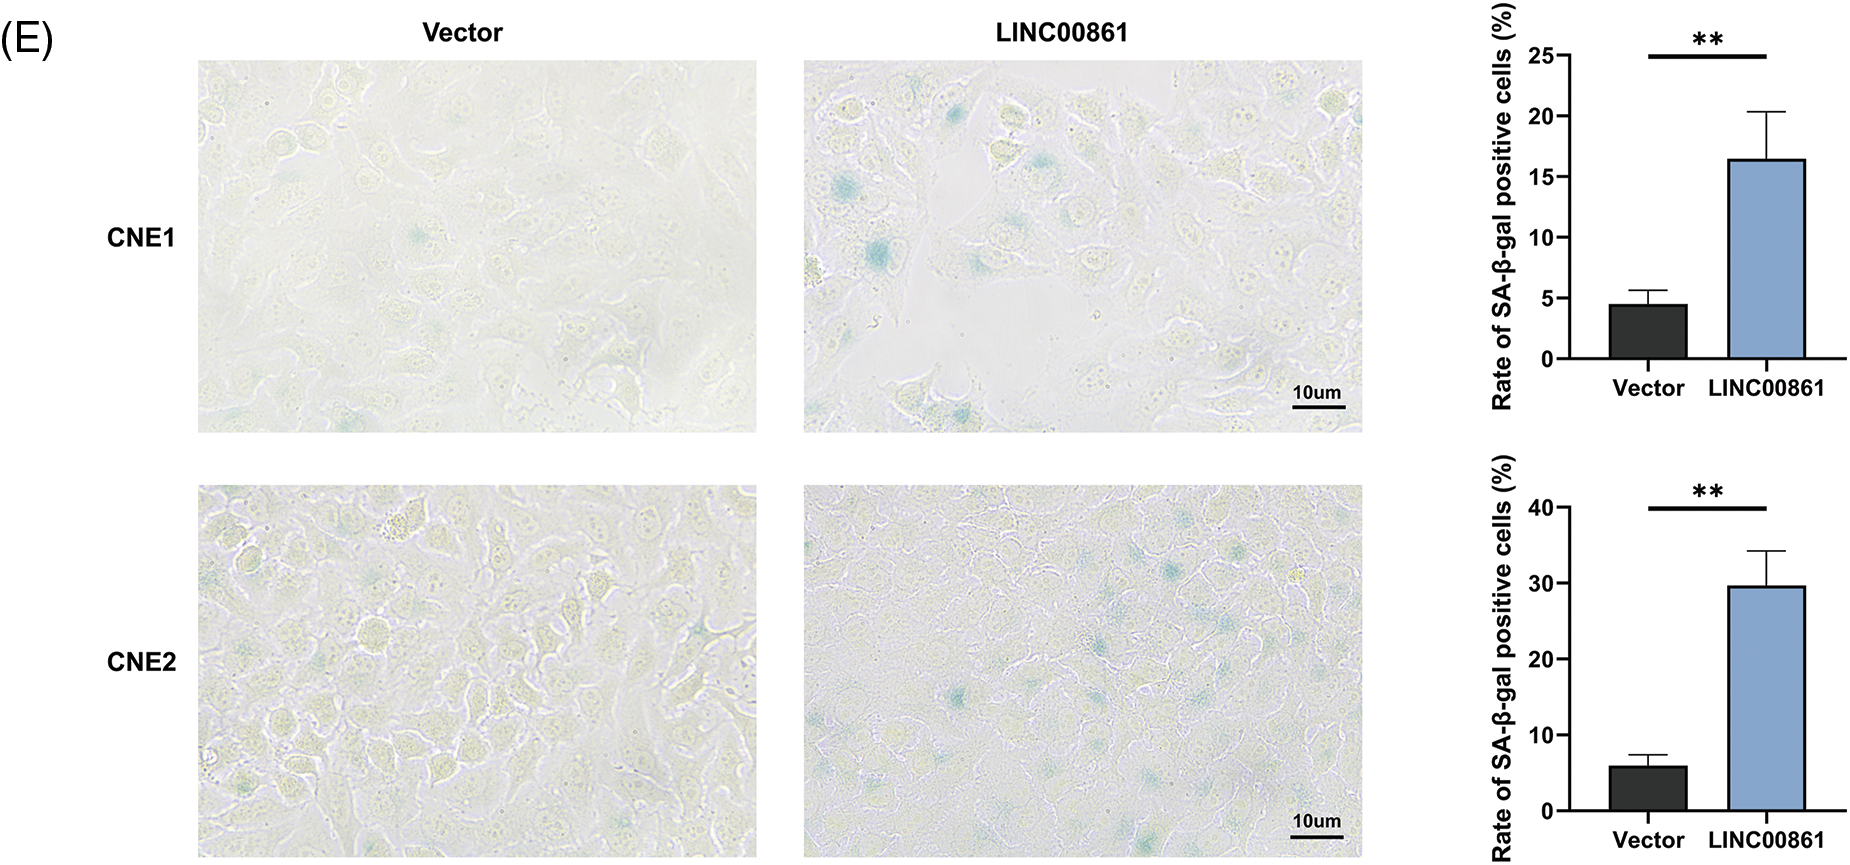
Figure 8: Cellular experiments. (A) and (B) Expression level of LINC00861. (C) CCK-8, (D) Edu, and (E) SA-β-gal staining assay in CNE1 and CNE2 cell lines in different treatment groups. *p < 0.05; **p < 0.01; ***p < 0.001.
Surgery, radiotherapy, and standard chemotherapy are commonly used for HNSCC. Recently, medicine including cetuximab, an anti-EGFR, and pembrolizumab, an anti-PD-1 therapy, was accepted for late-stage, recurrent, or metastatic HNSCC [33,34]. Regardless of therapeutic progress, the 5-year OS rate of HNSCC is still low (<50%) due to its ease of invasion, metastasis, development of chemo-resistance, and the fact that most cases are diagnosed at late stages [35]. Moreover, the 3-year OS rate is around 80% for HPV+ HNSCC and 55% for HPV- HNSCC [36]. Recently, a variety of novel biomarkers such as PITX2 methylation and C1GALT1 autoantibody that forecast prognosis, and B7-H3 that predicts immunotherapeutic prognosis and reaction in HNSCC were identified gradually [37–39]. However, the prognostic models and biomarkers need to be updated since more new drugs, including ICP inhibitors, are put into clinical practice. Here, a new model based on ARLs was constructed for the first time in HNSCC, which can both predict prognosis and differentiate the TIME.
Aging is closely connected with the occurrence of many chronic diseases and tumors [5]. Cell senescence is a physiological process whereby cells lose the proliferative ability forever. Cell senescence is triggered by various stimuli and the DNA damage response (DDR), leading to stimulation of the p53 and/or p16INK4A pathways, and its important regulatory factors include the cell cycle regulators p53, p21, p16, and pRb proteins [40]. The increased activity of lysosomal senescence-related β-galactosidase (SA-β-Gal) is an important marker of senescent cells [41]. Cell senescence is a double-edged sword in malignant tumors, as it prevents tumor development and promotes HNSCC progression through the secretion of various factors, called senescence-associated secretory phenotype (SASP). Notch, mTOR, and NF-κB pathways are engaged in SASP management [42]. The majority of studies conclude that cellular senescence acts primarily as a cancer suppressor rather than a cancer promoter [43–50]. Silencing peroxiredoxin1(Prx1)-induced cellular senescence blocks malignant conversion and inhibits the formation of oral squamous carcinoma [51]. In nasopharyngeal carcinoma, senescent cells promote tumor cell invasion by increasing the secretion of matrix metalloproteinase 9 (MMP 9) [52]. Bioinformatics analyses reveal the critical function of AGs in predicting the survival prognosis and revealing the TIME landscape of HNSCC [9,53].
Recently, many studies show that lncRNAs are critical in HNSCC occurrence, and can both promote and suppress cancer. More importantly, some lncRNAs can serve as biomarkers and treatment targets for HNSCC and can predict patient prognosis [2,54,55]. However, as the significant member involved in transcriptional and post-transcriptional regulation, the adjusting role of aging by lncRNAs in HNSCC is unknown. Therefore, we analytically validated the link of lncRNAs with aging and the prognosis of HNSCC, aiming to make some contribution to subsequent studies.
By LASSO and multi-cox regression analysis, we identified nine lncRNAs associated with eight AGs in HNSCC, all of which were positively regulated with the genes (Fig. 3E). Three lncRNAs (LINC01508, AL359502.2, AC243960.1) were related with a high risk of patients with poor prognosis, and the remaining 6 lncRNAs (AC246787.2, LINC00996, `CDKN2A-DT`, Z97653.1, LINC00861, LINC02384) were associated with low risk. These nine lncRNAs were enrolled into a prediction model. Through validation, the model was proved to be reliable and stable (Figs. 4, 5A–5E). By comparing with published prognostic models of HNSCC constructed based on ferroptosis-related lncRNAs, we found that these articles had high AUC predictive values for 3-year survival (0.83, 0.811, 0.726, and 0.687, respectively) [56–59], the 3-year AUC in our results was 0.779 for the train set, so collectively it seems that our proposed model shows a good accuracy in predicting prognosis. Reportedly, LINC01508 upexpression inhibited cisplatin tolerance of ovarian cancer cells by suppressing the Hippo-YAP pathway [60]. In cervical cancer cells, LINC00861 inhibits tumor progression and EMT by acting as a ceRNA for miR-513b-5p and modulating the PTEN/AKT/mTOR pathway [61]. The biological functions of the rest lncRNAs used in the modeling are unknown, about which researchers can carry out future experiments.
Aging not only regulates cell proliferation, but also alters the TIME through the secretion of SASP, which contains MMP, growth factors (VEGF and GM-CSF), inflammatory factors (IL-6 and IL-8), and the accumulation of lipofuscin deposits [62]. GSEA implied that the low-risk group was enriched with immune pathways such as the B cell receptor (BCR) and T cell receptor (TCR) pathways, and had higher immune infiltration and immune score, which may be related to their better prognosis (Figs. 6A and 6D). Considering the function of cell senescence in regulating TME, we conducted ssGSEA to explore the immune state in the low- and high-risk groups. The immune cells (aDCs, B cells, CD8+ T cells, DCs, iDCs, mast cells, neutrophils, NK cells, pDCs, T helper cells, Tfh cells, Th1 cells, Th2 cells, TIL, Tregs) and immune roles (APC (or T cell) co-suppression, APC (or T cell) co-stimulation, CCR, checkpoint, cytolytic activity, HLA, proinflammation, type II IFN response) were more active in the low-risk group (Figs. 6B and 6E). ICPs including PD-1, CTLA4, CD200, CD27, CD86, CD80, CD70, and TIGIT were more expressed in the low-risk group (Fig. 7A). These results imply that we can use the risk scores of ARLs to well distinguish the immune infiltration status of HNSCC and which is higher in the low-risk group. SASP factors released by senescent cells recruit innate immune cells (neutrophils, NK cells) and adaptive immune cells (CD8+ T cells) to modulate the removal of senescent tumor cells [63]. Therefore, the low-risk group may have more active cell senescence and thus is can be more cured by immunotherapy.
Radio-, chemo-, immuno-, and targeted therapies can induce cellular senescence and play an important role in TME through SASP [64]. Most HNSCC patients receive radiotherapy, which alters TME and activates the immune response of tumor cells [65,66] and may account for better outcomes in the low-risk group. As for drug sensitivity, the low-risk group was more sensitive to six inhibitors of the PI3K/AKT/mTOR pathway, such as rapamycin, which not only enhanced immunotherapeutic effects [18,22–25,29] but also blocked SASP-induced tumor progression (Fig. 7B). One study found that rapamycin prevented radiation-induced secretion of NFκB-driven pro-inflammatory SASP from prostate cancer cells and fibroblasts, thereby inhibiting tumor progression [67]. As a result, our study can guide clinical treatment and provide evidence for improving future immunotherapy and seeking appropriate target populations. Moreover, LINC00861 was identified as a protective factor against HNSCC progression in vitro (Fig. 8).
However, our study still has some limitations. Firstly, both our training and validation sets were from TCGA, which may cause bias, so the results may be more plausible if external validation was performed. Secondly, we only performed qRT-PCR, CCK-8, Edu, and SA-β-gal staining assays validation of LINC00861 in cell lines, but did not do further functional experiments or tissue validation, so further experiments are still needed. Finally, more clinical follow-up data shall be used to demonstrate the value of our prognostic model.
In conclusion, we built a robust prognostic prediction model for HNSCC using nine ARLs. It has a good predictive value in survival time, immune infiltration, immune checkpoint expression, and sensitivity to multiple drugs. LINC00861 acts as a protective factor against HNSCC progression.
Acknowledgement: We thank the supporters of Jiangsu Province Hospital Core Facility Centre in cellular experimental.
Funding Statement: This work was supported by the National Natural Science Foundation of China (82003228), the Natural Science Foundation of Jiangsu Province (BK20201080), and the Research Project of Clinical Medical Science and Technology Development Fund of Jiangsu University (JLY2021097).
Author Contributions: Xiaoke Di, Xinchen Sun, and Qing Gao were primarily involved in the design of this study. Xiaoke Di, Yuanyuan Sun, and Shu Zhou performed the bioinformatics analysis. Qing Gao and Yuanyuan Sun completed the cellular experimental validation. Qing Gao, Xiaoke Di, Yujing Shi, and Zeyuan Liu completed the manuscript writing. All authors read and approved the final manuscript.
Availability of Data and Materials: The public datasets to advocate our results can be gained from TCGA (https://portal.gdc.cancer.gov).
Ethics Approval: TCGA belongs to public databases. The patients involved in the database have obtained ethical approval. Users can download relevant data for free for research and publish relevant articles. Our study is based on open source data, so there are no ethical issues and other conflicts of interest.
Conflicts of Interest: The authors declare that they have no conflicts of interest to report regarding the present study.
References
1. Sung, H., Ferlay, J., Siegel, R. L., Laversanne, M., Soerjomataram, I. et al. (2021). Global cancer statistics 2020: GLOBOCAN estimates of incidence and mortality worldwide for 36 cancers in 185 countries. CA: A Cancer Journal for Clinicians, 71(3), 209–249. https://doi.org/10.3322/caac.21660 [Google Scholar] [PubMed] [CrossRef]
2. Kozłowska, J., Kolenda, T., Poter, P., Sobocińska, J., Guglas, K. et al. (2021). Long intergenic non-coding RNAs in HNSCC: From “Junk DNA” to important prognostic factor. Cancers, 13(12), 2949. https://doi.org/10.3390/cancers13122949 [Google Scholar] [PubMed] [CrossRef]
3. Johnson, D. E., Burtness, B., Leemans, C. R., Lui, V. W. Y., Bauman, J. E. et al. (2020). Head and neck squamous cell carcinoma. Nature Reviews Disease Primers, 6(1), 92. https://doi.org/10.1038/s41572-020-00224-3 [Google Scholar] [PubMed] [CrossRef]
4. Goel, B., Tiwari, A. K., Pandey, R. K., Singh, A. P., Kumar, S. et al. (2022). Therapeutic approaches for the treatment of head and neck squamous cell carcinoma—An update on clinical trials. Translational Oncology, 21(3), 101426. https://doi.org/10.1016/j.tranon.2022.101426 [Google Scholar] [PubMed] [CrossRef]
5. Lee, S., Schmitt, C. A. (2019). The dynamic nature of senescence in cancer. Nature Cell Biology, 21(1), 94–101. https://doi.org/10.1038/s41556-018-0249-2 [Google Scholar] [PubMed] [CrossRef]
6. Montes, M., Lubas, M., Arendrup, F. S., Mentz, B., Rohatgi, N. et al. (2021). The long non-coding RNA MIR31HG regulates the senescence associated secretory phenotype. Nature Communications, 12(1), 2459. https://doi.org/10.1038/s41467-021-22746-4 [Google Scholar] [PubMed] [CrossRef]
7. Stoczynska-Fidelus, E., Węgierska, M., Kierasińska, A., Ciunowicz, D., Rieske, P. (2022). Role of senescence in tumorigenesis and anticancer therapy. Journal of Oncology, 2022, 5969536. https://doi.org/10.1155/2022/5969536 [Google Scholar] [PubMed] [CrossRef]
8. Zhai, W. Y., Duan, F. F., Chen, S., Wang, J. Y., Zhao, Z. R. et al. (2022). An aging-related gene signature-based model for risk stratification and prognosis prediction in lung squamous carcinoma. Frontiers in Cell and Developmental Biology, 10, 770550. https://doi.org/10.3389/fcell.2022.770550 [Google Scholar] [PubMed] [CrossRef]
9. Yang, J., Jiang, Q., Liu, L., Peng, H., Wang, Y. et al. (2020). Identification of prognostic aging-related genes associated with immunosuppression and inflammation in head and neck squamous cell carcinoma. Sedentary Life and Nutrition, 12(24), 25778–25804. https://doi.org/10.18632/aging.104199 [Google Scholar] [PubMed] [CrossRef]
10. Beylerli, O., Gareev, I., Sufianov, A., Ilyasova, T., Guang, Y. (2022). Long noncoding RNAs as promising biomarkers in cancer. Non-Coding RNA Research, 7(2), 66–70. https://doi.org/10.1016/j.ncrna.2022.02.004 [Google Scholar] [PubMed] [CrossRef]
11. Zhao, Z., Liu, H., Zhou, X., Fang, D., Ou, X. et al. (2021). Necroptosis-related lncRNAs: Predicting prognosis and the distinction between the cold and hot tumors in gastric cancer. Journal of Oncology, 2021, 6718443. https://doi.org/10.1155/2021/6718443 [Google Scholar] [PubMed] [CrossRef]
12. Luo, L., Li, L., Liu, L., Feng, Z., Zeng, Q. et al. (2022). A necroptosis-related lncRNA-based signature to predict prognosis and probe molecular characteristics of stomach adenocarcinoma. Frontiers in Genetics, 13, 833928. https://doi.org/10.3389/fgene.2022.833928 [Google Scholar] [PubMed] [CrossRef]
13. Robin, X., Turck, N., Hainard, A., Tiberti, N., Lisacek, F. et al. (2011). pROC: An open-source package for R and S+ to analyze and compare ROC curves. BMC Bioinformatics, 12(1), 77. https://doi.org/10.1186/1471-2105-12-77 [Google Scholar] [PubMed] [CrossRef]
14. Yu, G., Wang, L. G., Han, Y., He, Q. Y. (2012). clusterProfiler: An R package for comparing biological themes among gene clusters. OMICS: A Journal of Integrative Biology, 16(5), 284–287. https://doi.org/10.1089/omi.2011.0118 [Google Scholar] [PubMed] [CrossRef]
15. Zheng, A., Xie, F., Shi, S., Liu, S., Long, J. et al. (2022). Sustained drug release from liposomes for the remodeling of systemic immune homeostasis and the tumor microenvironment. Frontiers in Immunology, 13, 829391. https://doi.org/10.3389/fimmu.2022.829391 [Google Scholar] [PubMed] [CrossRef]
16. Tettamanti, S., Rotiroti, M. C., Giordano Attianese, G. M. P., Arcangeli, S., Zhang, R. et al. (2022). Lenalidomide enhances CD23.CAR T cell therapy in chronic lymphocytic leukemia. Leukemia and Lymphoma, 63(7), 1566–1579. https://doi.org/10.1080/10428194.2022.2043299 [Google Scholar] [PubMed] [CrossRef]
17. Gong, W., Wang, L., Schubert, M. L., Kleist, C., Neuber, B. et al. (2022). HDAC inhibition for optimized cellular immunotherapy of NY-ESO-1-positive soft tissue sarcoma. Biomedicines, 10(2), 373. https://doi.org/10.3390/biomedicines10020373 [Google Scholar] [PubMed] [CrossRef]
18. Wang, H., Chen, H., Liu, S., Zhang, J., Lu, H. et al. (2021). Costimulation of γδTCR and TLR7/8 promotes Vδ2 T-cell antitumor activity by modulating mTOR pathway and APC function. Journal for ImmunoTherapy of Cancer, 9(12), e003339. https://doi.org/10.1136/jitc-2021-003339 [Google Scholar] [PubMed] [CrossRef]
19. Veneziani, I., Infante, P., Ferretti, E., Melaiu, O., Battistelli, C. et al. (2021). Nutlin-3a enhances natural killer cell-mediated killing of neuroblastoma by restoring p53-dependent expression of ligands for NKG2D and DNAM-1 receptors. Cancer Immunology Research, 9(2), 170–183. https://doi.org/10.1158/2326-6066.CIR-20-0313 [Google Scholar] [PubMed] [CrossRef]
20. Li, J., Zhou, S., Yu, J., Cai, W., Yang, Y. et al. (2021). Low dose shikonin and anthracyclines coloaded liposomes induce robust immunogenetic cell death for synergistic chemo-immunotherapy. Journal of Controlled Release, 335, 306–319. https://doi.org/10.1016/j.jconrel.2021.05.040 [Google Scholar] [PubMed] [CrossRef]
21. Chung, Y. M., Khan, P. P., Wang, H., Tsai, W. B., Qiao, Y. et al. (2021). Sensitizing tumors to anti-PD-1 therapy by promoting NK and CD8+ T cells via pharmacological activation of FOXO3. Journal for ImmunoTherapy of Cancer, 9(12), e002772. https://doi.org/10.1136/jitc-2021-002772 [Google Scholar] [PubMed] [CrossRef]
22. Marks, D. K., Gartrell, R. D., El Asmar, M., Boboila, S., Hart, T. et al. (2020). Akt inhibition is associated with favorable immune profile changes within the tumor microenvironment of hormone receptor positive, HER2 negative breast cancer. Frontiers in Oncology, 10, 968. https://doi.org/10.3389/fonc.2020.00968 [Google Scholar] [PubMed] [CrossRef]
23. Liu, G., Jin, Z., Lu, X. (2020). Differential targeting of Gr-MDSCs, T cells and prostate cancer cells by dactolisib and dasatinib. International Journal of Molecular Sciences, 21(7), 2337. https://doi.org/10.3390/ijms21072337 [Google Scholar] [PubMed] [CrossRef]
24. Kobayashi, Y., Yamada, D., Kawai, T., Sato, Y., Teshima, T. et al. (2020). Different immunological effects of the molecular targeted agents sunitinib, everolimus and temsirolimus in patients with renal cell carcinoma. International Journal of Oncology, 56(4), 999–1013. https://doi.org/10.3892/ijo.2020.4975 [Google Scholar] [PubMed] [CrossRef]
25. Ge, M., Hu, Z., Chen, X., Du, G., Wang, H. et al. (2019). PCC0208018 exerts antitumor effects by activating effector T cells. International Journal of Immunopathology and Pharmacology, 33, 2058738419843366. https://doi.org/10.1177/2058738419843366 [Google Scholar] [PubMed] [CrossRef]
26. Ferrari de Andrade, L., Ngiow, S. F., Stannard, K., Rusakiewicz, S., Kalimutho, M. et al. (2014). Natural killer cells are essential for the ability of BRAF inhibitors to control BRAFV600E-mutant metastatic melanoma. Cancer Research, 74(24), 7298–7308. https://doi.org/10.1158/0008-5472.CAN-14-1339 [Google Scholar] [PubMed] [CrossRef]
27. Onishi, H., Morisaki, T., Kiyota, A., Koya, N., Tanaka, H. et al. (2013). The Hedgehog inhibitor cyclopamine impairs the benefits of immunotherapy with activated T and NK lymphocytes derived from patients with advanced cancer. Cancer Immunology, Immunotherapy, 62(6), 1029–1039. https://doi.org/10.1007/s00262-013-1419-5 [Google Scholar] [PubMed] [CrossRef]
28. Bridle, B. W., Chen, L., Lemay, C. G., Diallo, J. S., Pol, J. et al. (2013). HDAC inhibition suppresses primary immune responses, enhances secondary immune responses, and abrogates autoimmunity during tumor immunotherapy. Molecular Therapy, 21(4), 887–894. https://doi.org/10.1038/mt.2012.265 [Google Scholar] [PubMed] [CrossRef]
29. Jiang, Q., Weiss, J. M., Back, T., Chan, T., Ortaldo, J. R. et al. (2011). mTOR kinase inhibitor AZD8055 enhances the immunotherapeutic activity of an agonist CD40 antibody in cancer treatment. Cancer Research, 71(12), 4074–4084. https://doi.org/10.1158/0008-5472.CAN-10-3968 [Google Scholar] [PubMed] [CrossRef]
30. de Billy, E., Pellegrino, M., Orlando, D., Pericoli, G., Ferretti, R. et al. (2021). Dual IGF1R/IR inhibitors in combination with GD2-CAR T-cells display a potent anti-tumor activity in diffuse midline glioma H3K27M-mutant. Neuro-Oncology, 24(7), 1150–1163. https://doi.org/10.1093/neuonc/noab300 [Google Scholar] [PubMed] [CrossRef]
31. Hardman, C., Ho, S., Shimizu, A., Luu-Nguyen, Q., Sloane, J. L. et al. (2020). Synthesis and evaluation of designed PKC modulators for enhanced cancer immunotherapy. Nature Communications, 11(1), 1879. https://doi.org/10.1038/s41467-020-15742-7 [Google Scholar] [PubMed] [CrossRef]
32. Takai, S., Sabzevari, H., Farsaci, B., Schlom, J., Greiner, J. W. (2012). Distinct effects of saracatinib on memory CD8+ T cell differentiation. Journal of Immunology, 188(9), 4323–4333. https://doi.org/10.4049/jimmunol.1101439 [Google Scholar] [PubMed] [CrossRef]
33. Powell, S. F., Gold, K. A., Gitau, M. M., Sumey, C. J., Lohr, M. M. et al. (2020). Safety and efficacy of pembrolizumab with chemoradiotherapy in locally advanced head and neck squamous cell carcinoma: A phase IB study. Journal of Clinical Oncology, 38(21), 2427–2437. https://doi.org/10.1200/JCO.19.03156 [Google Scholar] [PubMed] [CrossRef]
34. Bauman, J. E., Ohr, J., Gooding, W. E., Ferris, R. L., Duvvuri, U. et al. (2020). Phase I study of ficlatuzumab and cetuximab in cetuximab-resistant, recurrent/metastatic head and neck cancer. Cancers, 12(6), 1537. https://doi.org/10.3390/cancers12061537 [Google Scholar] [PubMed] [CrossRef]
35. Akbari Dilmaghani, N., Khoshsirat, S., Shanaki-Bavarsad, M., Pourbagheri-Sigaroodi, A., Bashash, D. (2021). The contributory role of long non-coding RNAs (lncRNAs) in head and neck cancers: Possible biomarkers and therapeutic targets? European Journal of Pharmacology, 900(3), 174053. https://doi.org/10.1016/j.ejphar.2021.174053 [Google Scholar] [PubMed] [CrossRef]
36. Morgan, E. L., Chen, Z., van Waes, C. (2020). Regulation of NFκB signalling by ubiquitination: A potential therapeutic target in head and neck squamous cell carcinoma? Cancers, 12(10), 2877. https://doi.org/10.3390/cancers12102877 [Google Scholar] [PubMed] [CrossRef]
37. Sailer, V., Gevensleben, H., Dietrich, J., Goltz, D., Kristiansen, G. et al. (2017). Clinical performance validation of PITX2 DNA methylation as prognostic biomarker in patients with head and neck squamous cell carcinoma. PLoS One, 12(6), e0179412. https://doi.org/10.1371/journal.pone.0179412 [Google Scholar] [PubMed] [CrossRef]
38. Lin, M. C., Huang, M. C., Lou, P. J. (2021). Anti-C1GALT1 autoantibody is a novel prognostic biomarker for patients with head and neck cancer. Laryngoscope, 131(1), E196–E202. https://doi.org/10.1002/lary.28694 [Google Scholar] [PubMed] [CrossRef]
39. Lin, W., Xu, Y., Gao, J., Zhang, H., Sun, Y. et al. (2021). Multi-omics data analyses identify B7-H3 as a novel prognostic biomarker and predict response to immune checkpoint blockade in head and neck squamous cell carcinoma. Frontiers in Immunology, 12, 757047. https://doi.org/10.3389/fimmu.2021.757047 [Google Scholar] [PubMed] [CrossRef]
40. Kudlova, N., de Sanctis, J. B., Hajduch, M. (2022). Cellular senescence: Molecular targets, biomarkers, and senolytic drugs. International Journal of Molecular Sciences, 23(8), 4168. https://doi.org/10.3390/ijms23084168 [Google Scholar] [PubMed] [CrossRef]
41. Park, S. S., Choi, Y. W., Kim, J. H., Kim, H. S., Park, T. J. (2021). Senescent tumor cells: An overlooked adversary in the battle against cancer. Experimental and Molecular Medicine, 53(12), 1834–1841. https://doi.org/10.1038/s12276-021-00717-5 [Google Scholar] [PubMed] [CrossRef]
42. Popov, A., Mandys, V. (2022). Senescence-associated miRNAs and their role in pancreatic cancer. Pathology Oncology Research, 28, 1610156. https://doi.org/10.3389/pore.2022.1610156 [Google Scholar] [PubMed] [CrossRef]
43. Wang, Z., Li, Y., Wu, D., Yu, S., Wang, Y. et al. (2020). Nuclear receptor HNF4α performs a tumor suppressor function in prostate cancer via its induction of p21-driven cellular senescence. Oncogene, 39(7), 1572–1589. https://doi.org/10.1038/s41388-019-1080-3 [Google Scholar] [PubMed] [CrossRef]
44. Jia, Y., Jin, H., Gao, L., Yang, X., Wang, F. et al. (2020). A novel lncRNA PLK4 up-regulated by talazoparib represses hepatocellular carcinoma progression by promoting YAP-mediated cell senescence. Journal of Cellular and Molecular Medicine, 24(9), 5304–5316. https://doi.org/10.1111/jcmm.15186 [Google Scholar] [PubMed] [CrossRef]
45. Zou, J., Ma, Q., Sun, R., Cai, J., Liao, H. et al. (2019). Dihydroartemisinin inhibits HepG2.2.15 proliferation by inducing cellular senescence and autophagy. BMB Reports, 52(8), 520–524. https://doi.org/10.5483/BMBRep.2019.52.8.058 [Google Scholar] [PubMed] [CrossRef]
46. Lee, Y. H., Chen, Y. Y., Yeh, Y. L., Wang, Y. J., Chen, R. J. (2019). Stilbene compounds inhibit tumor growth by the induction of cellular senescence and the inhibition of telomerase activity. International Journal of Molecular Sciences, 20(11), 2716. https://doi.org/10.3390/ijms20112716 [Google Scholar] [PubMed] [CrossRef]
47. Li, R., Zhang, X., Tian, X., Shen, C., Zhang, Q. et al. (2017). Triptolide inhibits tumor growth by induction of cellular senescence. Oncology Reports, 37(1), 442–448. https://doi.org/10.3892/or.2016.5258 [Google Scholar] [PubMed] [CrossRef]
48. Geng, R., Song, J., Zhong, Z., Ni, S., Liu, W. et al. (2022). Crosstalk of redox-related subtypes, establishment of a prognostic model and immune responses in endometrial carcinoma. Cancers, 14(14), 3383. https://doi.org/10.3390/cancers14143383 [Google Scholar] [PubMed] [CrossRef]
49. Hu, Y., Song, J., Wang, Z., Kan, J., Ge, Y. et al. (2021). A novel S100 family-based signature associated with prognosis and immune microenvironment in glioma. Journal of Oncology, 2021(2), 3586589. https://doi.org/10.1155/2021/3586589 [Google Scholar] [PubMed] [CrossRef]
50. Song, J., Liu, Y., Guan, X., Zhang, X., Yu, W. et al. (2021). A novel ferroptosis-related biomarker signature to predict overall survival of esophageal squamous cell carcinoma. Frontiers in Molecular Biosciences, 8, 675193. https://doi.org/10.3389/fmolb.2021.675193 [Google Scholar] [PubMed] [CrossRef]
51. Lu, Y., Li, L., Chen, H., Jing, X., Wang, M. et al. (2021). Peroxiredoxin1 knockdown inhibits oral carcinogenesis via inducing cell senescence dependent on mitophagy. OncoTargets and Therapy, 14, 239–251. https://doi.org/10.2147/OTT.S284182 [Google Scholar] [PubMed] [CrossRef]
52. Lan, Y. Y., Chang, F. H., Tsai, J. H., Chang, Y. (2018). Epstein-Barr virus Rta promotes invasion of bystander tumor cells through paracrine of matrix metalloproteinase 9. Biochemical and Biophysical Research Communications, 503(3), 2160–2166. https://doi.org/10.1016/j.bbrc.2018.08.006 [Google Scholar] [PubMed] [CrossRef]
53. Chen, F., Gong, X., Xia, M., Yu, F., Wu, J. et al. (2022). The aging-related prognostic signature reveals the landscape of the tumor immune microenvironment in head and neck squamous cell carcinoma. Frontiers in Oncology, 12, 857994. https://doi.org/10.3389/fonc.2022.857994 [Google Scholar] [PubMed] [CrossRef]
54. Gu, H., Song, J., Chen, Y., Wang, Y., Tan, X. et al. (2022). Inflammation-related LncRNAs signature for prognosis and immune response evaluation in uterine corpus endometrial carcinoma. Frontiers in Oncology, 12, 923641. https://doi.org/10.3389/fonc.2022.923641 [Google Scholar] [PubMed] [CrossRef]
55. Ghafouri-Fard, S., Mohammad-Rahimi, H., Jazaeri, M., Taheri, M. (2020). Expression and function of long non-coding RNAs in head and neck squamous cell carcinoma. Experimental and Molecular Pathology, 112(12), 104353. https://doi.org/10.1016/j.yexmp.2019.104353 [Google Scholar] [PubMed] [CrossRef]
56. Tang, Y., Li, C., Zhang, Y. J., Wu, Z. H. (2021). Ferroptosis-related long non-coding RNA signature predicts the prognosis of Head and neck squamous cell carcinoma. International Journal of Biological Sciences, 17(3), 702–711. https://doi.org/10.7150/ijbs.55552 [Google Scholar] [PubMed] [CrossRef]
57. Wu, C., Liu, F., Chen, H., Liu, Q., Song, C. et al. (2022). Identification of ferroptosis-related lncRNA pairs for predicting the prognosis of head and neck squamous cell carcinoma. Journal of Oncology, 2022, 7602482. https://doi.org/10.1155/2022/7602482 [Google Scholar] [PubMed] [CrossRef]
58. Jiang, W., Song, Y., Zhong, Z., Gao, J., Meng, X. (2021). Ferroptosis-related long non-coding RNA signature contributes to the prediction of prognosis outcomes in head and neck squamous cell carcinomas. Frontiers in Genetics, 12, 785839. https://doi.org/10.3389/fgene.2021.785839 [Google Scholar] [PubMed] [CrossRef]
59. Qiu, L., Tao, A., Liu, F., Ge, X., Li, C. (2022). Potential prognostic value of a eight ferroptosis-related lncRNAs model and the correlative immune activity in oral squamous cell carcinoma. BMC Genomic Data, 23(1), 80. https://doi.org/10.1186/s12863-022-01097-z [Google Scholar] [PubMed] [CrossRef]
60. Xiao, L., Shi, X. Y., Li, Z. L., Li, M., Zhang, M. M. et al. (2021). Downregulation of LINC01508 contributes to cisplatin resistance in ovarian cancer via the regulation of the Hippo-YAP pathway. Journal of Gynecologic Oncology, 32(5), e77. https://doi.org/10.3802/jgo.2021.32.e77 [Google Scholar] [PubMed] [CrossRef]
61. Liu, H., Zhang, L., Ding, X., Sui, X. (2021). LINC00861 inhibits the progression of cervical cancer cells by functioning as a ceRNA for miR‐513b‐5p and regulating the PTEN/AKT/mTOR signaling pathway. Molecular Medicine Reports, 23(1), 24. https://doi.org/10.3892/mmr.2020.11662 [Google Scholar] [PubMed] [CrossRef]
62. Maggiorani, D., Beauséjour, C. (2021). Senescence and aging: Does it impact cancer immunotherapies? Cells, 10(7), 1568. https://doi.org/10.3390/cells10071568 [Google Scholar] [PubMed] [CrossRef]
63. Faget, D. V., Ren, Q., Stewart, S. A. (2019). Unmasking senescence: Context-dependent effects of SASP in cancer. Nature Reviews: Cancer, 19(8), 439–453. https://doi.org/10.1038/s41568-019-0156-2 [Google Scholar] [PubMed] [CrossRef]
64. Chambers, C. R., Ritchie, S., Pereira, B. A., Timpson, P. (2021). Overcoming the senescence-associated secretory phenotype (SASPA complex mechanism of resistance in the treatment of cancer. Molecular Oncology, 15(12), 3242–3255. https://doi.org/10.1002/1878-0261.13042 [Google Scholar] [PubMed] [CrossRef]
65. Lin, W., Chen, M., Hong, L., Zhao, H., Chen, Q. (2018). Crosstalk between PD-1/PD-L1 blockade and its combinatorial therapies in tumor immune microenvironment: A focus on HNSCC. Frontiers in Oncology, 8, 532. https://doi.org/10.3389/fonc.2018.00532 [Google Scholar] [PubMed] [CrossRef]
66. Hanoteau, A., Newton, J. M., Krupar, R., Huang, C., Liu, H. C. et al. (2019). Tumor microenvironment modulation enhances immunologic benefit of chemoradiotherapy. Journal for ImmunoTherapy of Cancer, 7(1), 10. https://doi.org/10.1186/s40425-018-0485-9 [Google Scholar] [PubMed] [CrossRef]
67. Toso, A., Revandkar, A., di Mitri, D., Guccini, I., Proietti, M. et al. (2014). Enhancing chemotherapy efficacy in Pten-deficient prostate tumors by activating the senescence-associated antitumor immunity. Cell Reports, 9(1), 75–89. https://doi.org/10.1016/j.celrep.2014.08.044 [Google Scholar] [PubMed] [CrossRef]
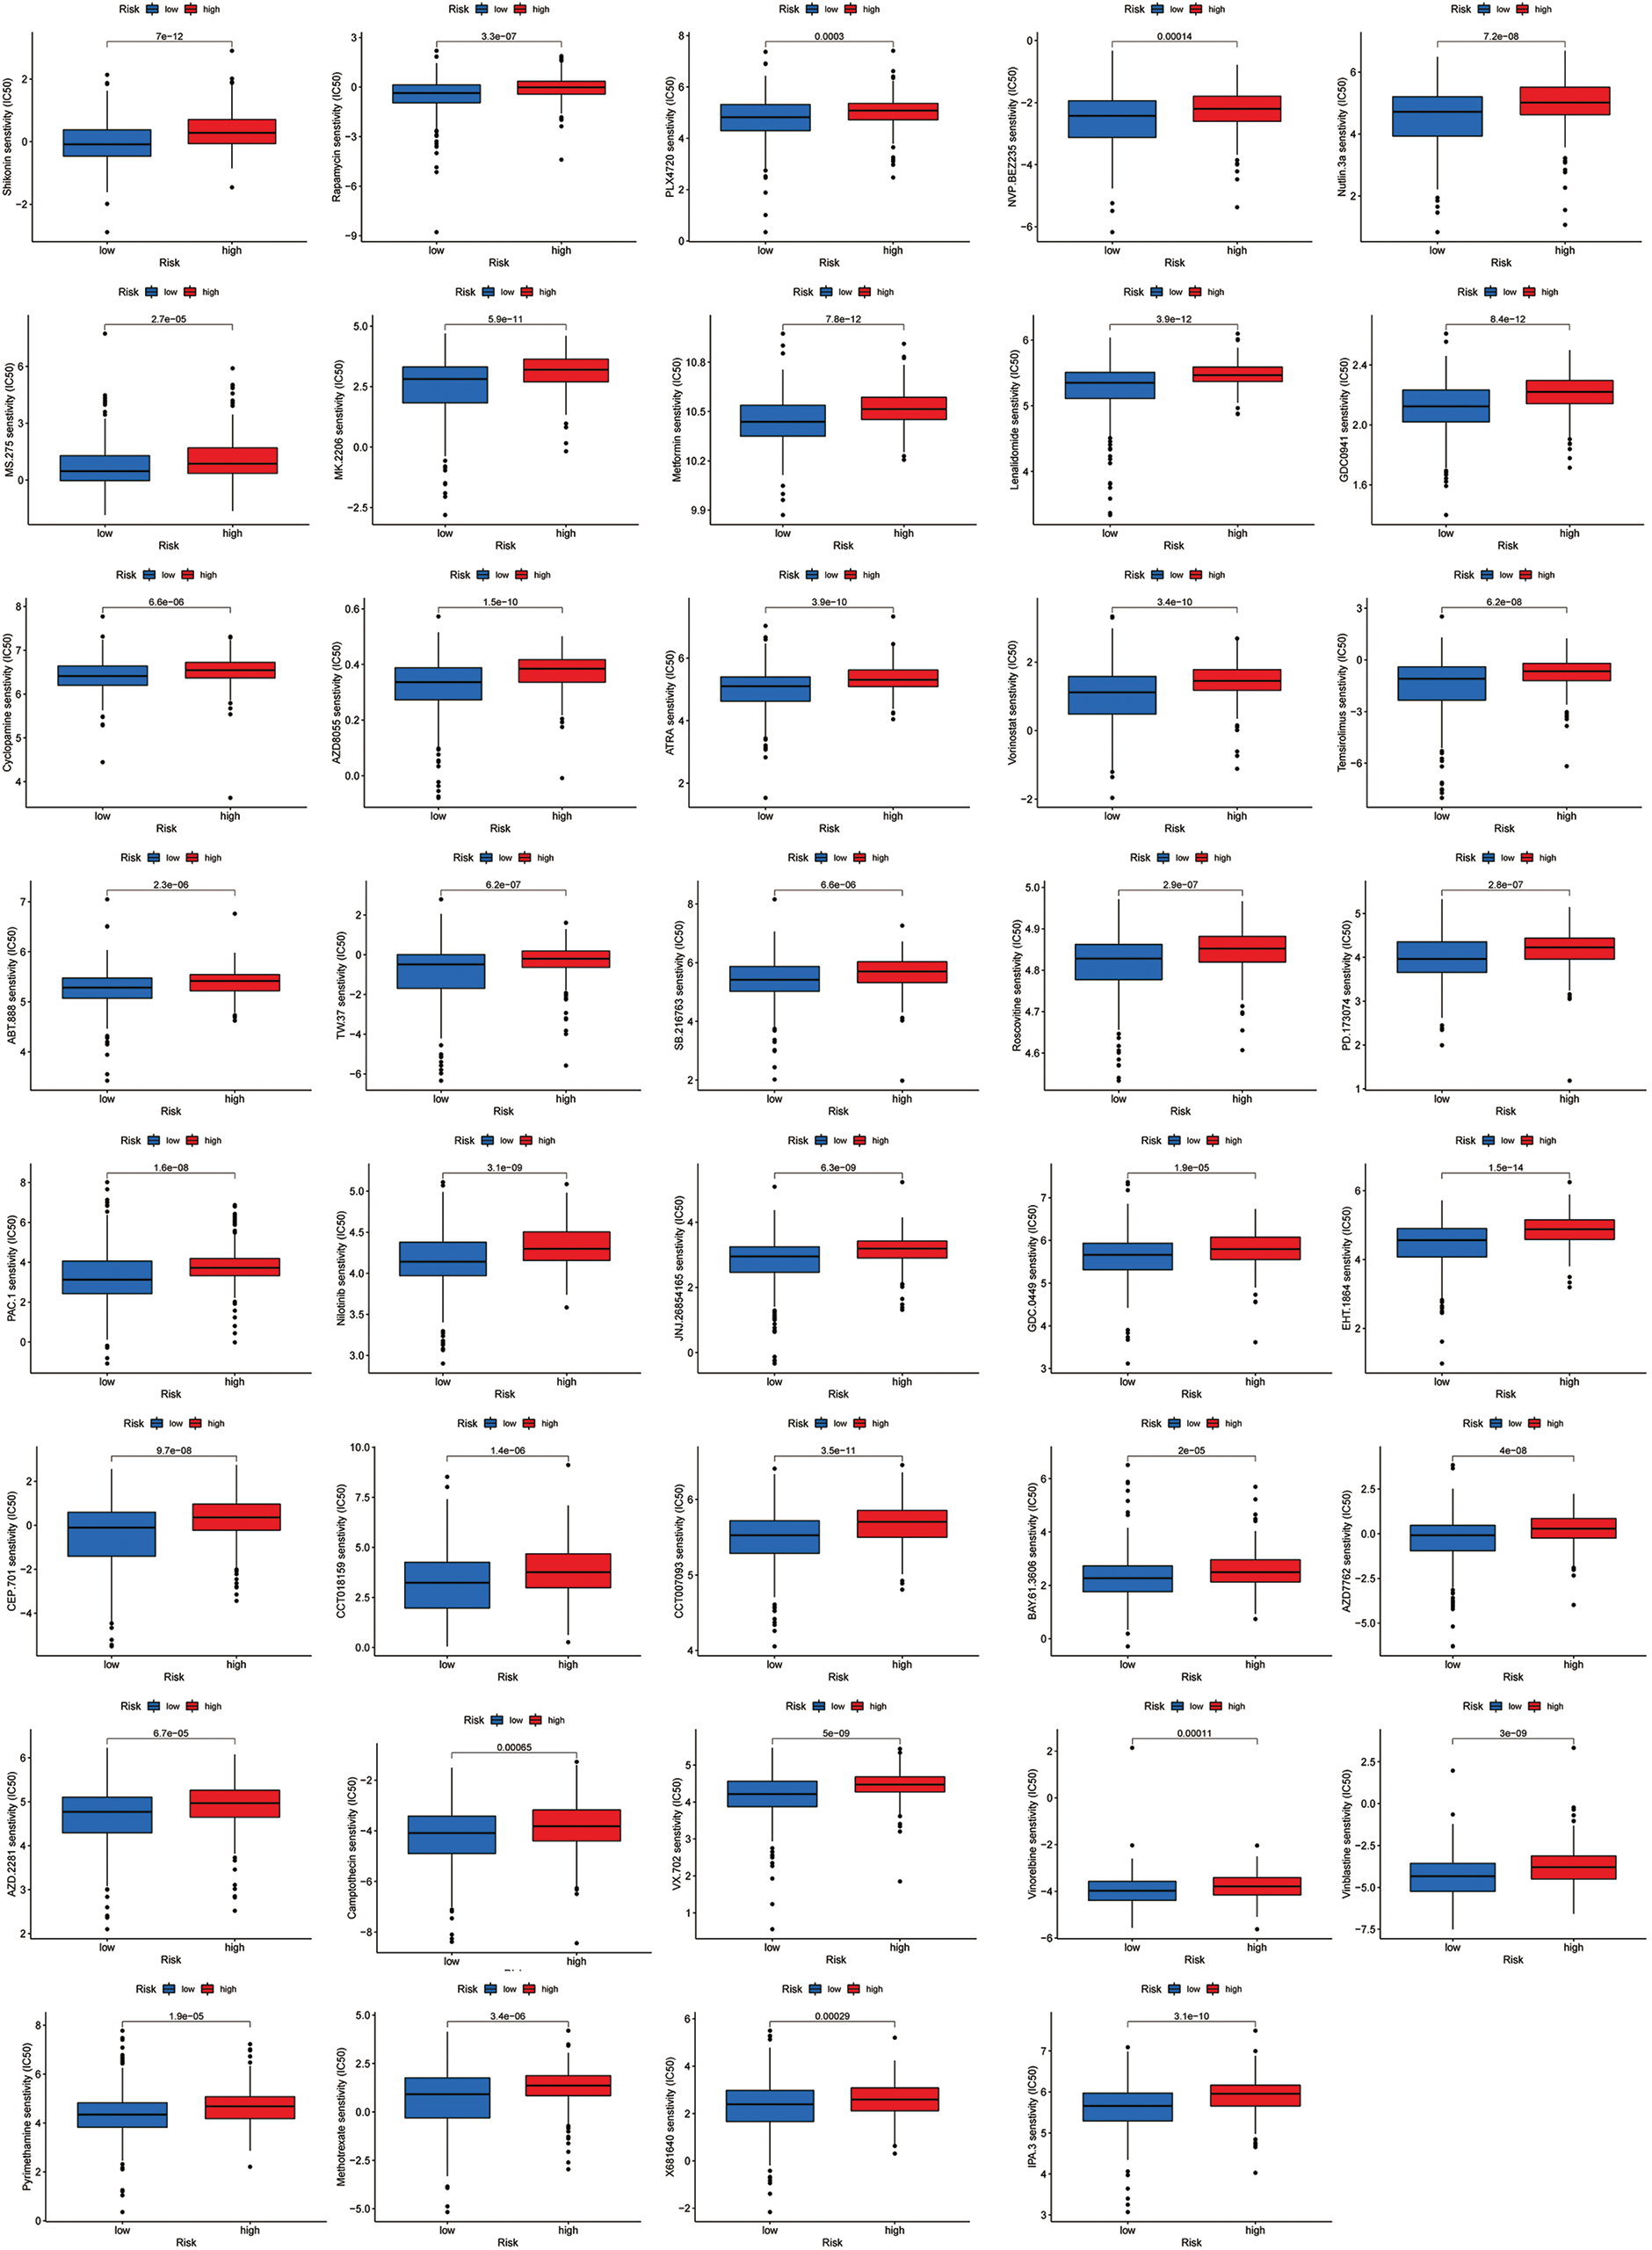
Figure S1: All 39 chemicals with lower IC50 values in the low-risk group.
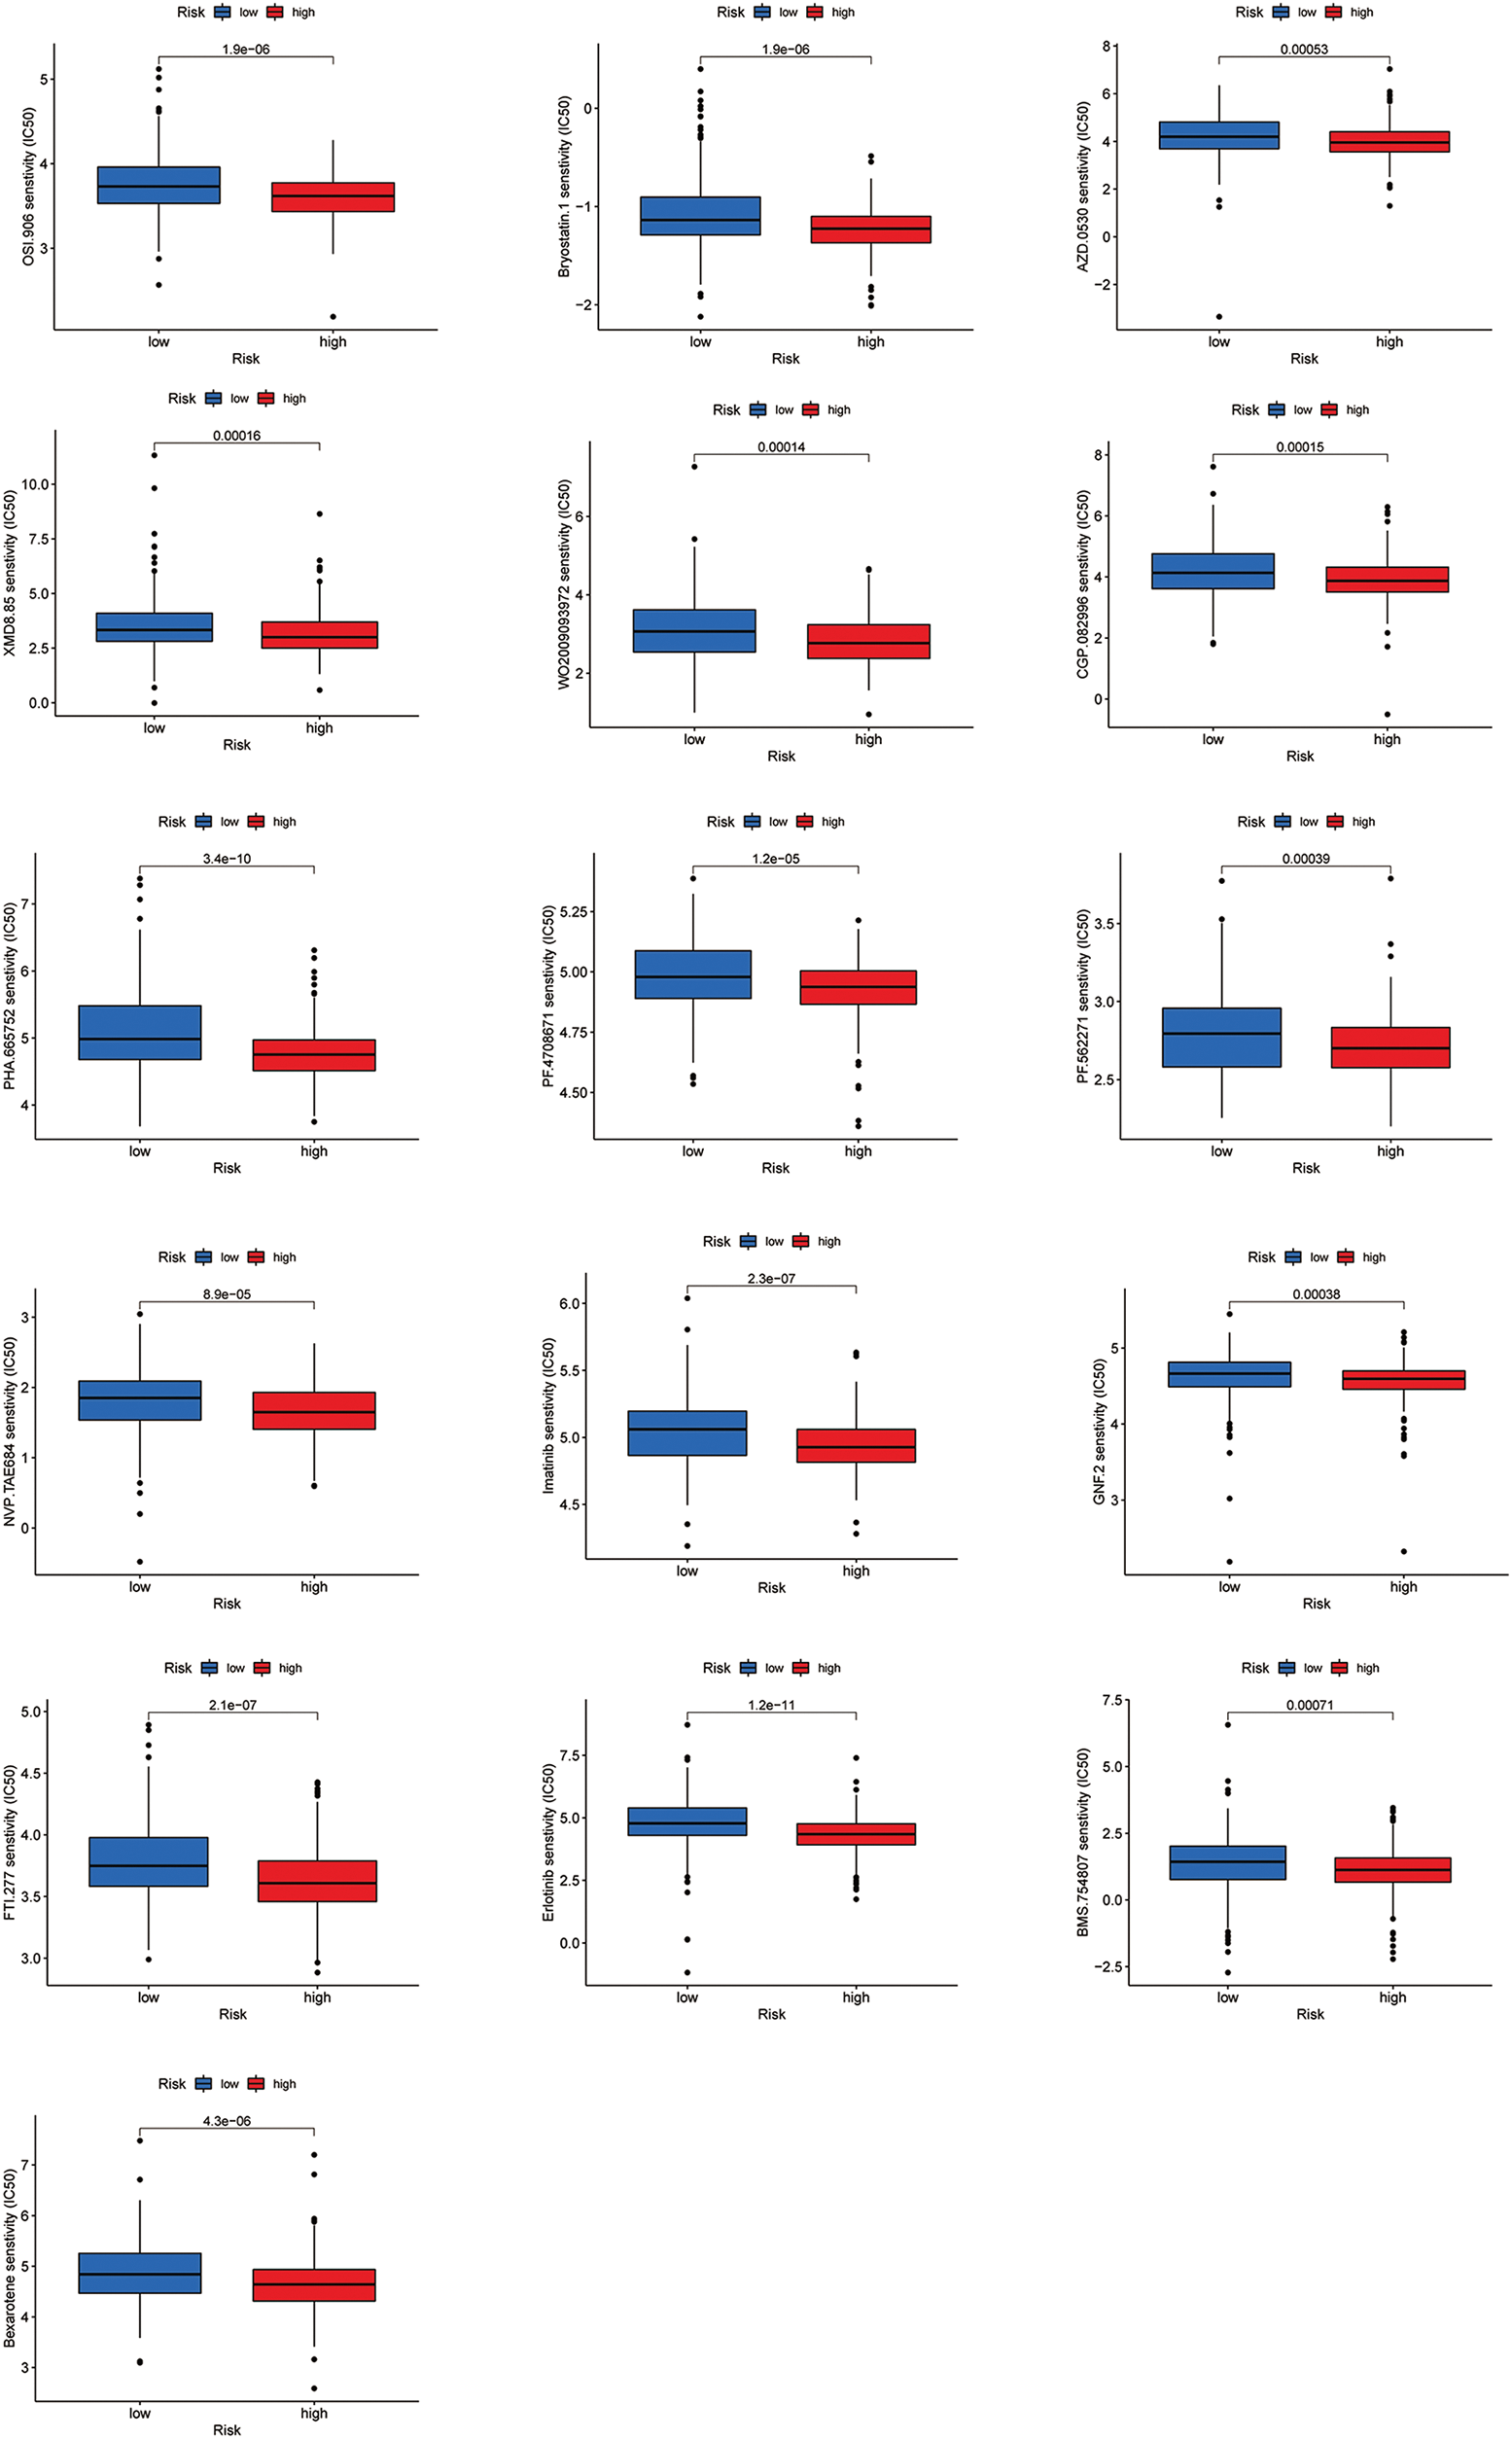
Figure S2: All 16 chemicals with lower IC50 values in the high-risk group.


Cite This Article
 Copyright © 2023 The Author(s). Published by Tech Science Press.
This work is licensed under a Creative Commons Attribution 4.0 International License , which permits unrestricted use, distribution, and reproduction in any medium, provided the original work is properly cited.
 Downloads
 Citation Tools