
 Submit a Paper
 Propose a Special lssue
 Open Access
ARTICLE

A Metabolism-Related Gene Signature Predicts the Prognosis of Breast Cancer Patients: Combined Analysis of High-Throughput Sequencing and Gene Chip Data Sets
1 School of Basic Medical Sciences, Wannan Medical College, Wuhu, 241001, China
2 Anhui Province Key Laboratory of Medical Physics and Technology, Institute of Health and Medical Technology, Hefei Institutes of Physical Science, Chinese Academy of Sciences, Hefei, 230031, China
3 Science Island Branch, Graduate School of University of Science and Technology of China, Hefei, 230026, China
4 Department of Pathology, Hefei Cancer Hospital, Chinese Academy of Sciences, Hefei, 230031, China
* Corresponding Authors: Hongzhi Wang. Email: ; Wulin Yang. Email:
# The authors contributed equally to this work
(This article belongs to the Special Issue: Biomarkers for Breast Cancer Diagnosis and Treatment Selection: from Basic Research to Practice)
Oncologie 2022, 24(4), 803-822. https://doi.org/10.32604/oncologie.2022.026419
Received 04 September 2022; Accepted 25 November 2022; Issue published 31 December 2022
 View Full Text
 Download PDF
Abstract
Background and Aim: Hundreds of consistently altered metabolic genes have been identified in breast cancer (BC), but their prognostic value remains to be explored. Therefore, we aimed to build a prediction model based on metabolism-related genes (MRGs) to guide BC prognosis. Methods: Current work focuses on constructing a novel MRGs signature to predict the prognosis of BC patients using MRGs derived from the Virtual Metabolic Human (VMH) database, and expression profiles and clinicopathological data from The Cancer Genome Atlas (TCGA) and Gene Expression Omnibus (GEO) databases. Results: The 3-MRGs-signature constructed by SERPINA1, QPRT and PXDNL was found to be an independent prognostic factor for the survival of patients, and based on the model, the overall survival (OS) of the high-risk group was significantly lower. Furthermore, a nomogram was developed based on risk score and independent prognostic clinical indicators, and its validity of survival prediction was confirmed by the calibration curve, the concordance index, decision curve analysis and receiver operating characteristic curve. The ssGSEA analysis showed a negative correlation between immune cell infiltration and risk score, which is consistent with the GSEA result showing that low-risk score group was associated with activated immune processes. Half-maximal inhibitory concentration of chemotherapeutic drugs was estimated by pRRophetic algorithm to guide clinical medication. Conclusion: We constructed and validated an effective 3-MRGs (SERPINA1, QPRT and PXDNL)-based prognostic model, and demonstrated that lower-risk patients were associated with higher immune infiltrations, underscoring the importance of immune ecosystems in determining the prognosis of BC patients.Keywords
Breast cancer (BC), one of the most common cancers among women [1], is a heterogeneous disease that can be separated into different clinical subtypes based on tumor histological markers, including estrogen receptor (ER), progesterone receptor (PR), and HER2 [2]. The incidence of BC in young women increases at an annual rate of about 0.5% [3–5]. How to reduce the mortality of BC, especially for those in advanced stages, remains a global challenge. Due to heterogeneity, the responses to treatment and prognosis vary in different patients even if the clinical stage and pathological grade are the same [6,7]. Thus, different aspects of these subtypes should be considered to predict prognosis and survival in BC. Recently, due to the progresses made by high-throughput methods, polygenic predictions have become new approaches. For example, the 21-gene Oncotype Dx assay (Genome Health Inc., Redwood City, CA) was developed and showed effective to predict recurrence of early-stage tamoxifen-treated, node-negative BC [8–10]. Some other programs, including breast cancer Index (BCI) (bioTheranostics), PAM50-based Prosigna risk of recurrence (ROR) (NanoString), EndoPredict (EPclin) (Myriad Genetics), and the 70 gene MammaPrint (Agendia, Huntington Beach, CA) have been endorsed by several guidelines and routinely used in the prediction of prognosis for ER-positive or ER-negative early-stage node-negative BC [11,12]. Although significant progresses have been made in this field, however, these prediction methods have limited predictive power in some subtypes of BC, for example, the late-stage ER-negative subtype. Therefore, there are still some challenges in accurately predicting the prognosis of BC [13].
Altered nutrient metabolism in tumors is emerging as an important aspect of cancer-associated events, which allows cancer cells to survive, proliferate, and metastasize [14,15]. Earlier in the 1920s, Otto Warburg observed that some tumor cells preferentially depended on glycolysis to provide energy even in circumstances with plenty of oxygen [16]. This significant finding also has been found in a variety of cancers to date. Abnormalities of metabolism play a critical role in tumorigenesis and development [17]. Therefore, it is possible to combine metabolomics with genomics and transcriptomics to gain a more comprehensive understanding of metabolic reprogramming in tumors. On the other hand, metabolism-related genes have been effectively used to generate prediction models for hepatocellular carcinoma [18], gastric cancer [19], lung adenocarcinoma [20], and glioma [21]. While the expression profile of metabolism-related genes has also been used to improve the prediction of the prognosis of BC patients, the predictive power is not ideal [22,23]. Importantly, both models are developed using gene sets in MSigDB database (http://www.gsea-msigdb.org/gsea/msigdb/index.jsp), which has a limited number of metabolic genes. Compared to MsigDB, the latest Virtual Metabolic Human (VMH, www.vmh.life) database encapsulates the current human metabolic data in 5 interrelated resources, including 3695 human genes, and contains more profound metabolism-related gene information.
Based on the metabolism-related genes derived from the VMH database, this study first analyzed the metabolism-related genes that were commonly dysregulated in multiple datasets in BC. Further, the Cancer Genome Atlas-Breast Carcinoma dataset (TCGA-BRCA) was used to analyze the prognosis-related metabolism-related genes to establish a prediction model, which was then verified with a GEO dataset. In addition, we combined the clinical characteristics of the patients with the risk score of the signature to establish a new nomogram model, and validated the effectiveness of the model in predicting prognosis. Meanwhile, we analyzed the correlation between clinical drugs and risk scores, which can be used to guide the treatment strategy of BC.
The training dataset (n = 1171 patients) containing RNA-sequencing data and clinical information related to gene expression of BC patients was derived from TCGA-BRCA dataset (https://portal.gdc.cancer.gov/). To estimate the power and robustness of the model, we downloaded the GSE20685 dataset from the Gene Expression Omnibus (GEO: https://www.ncbi.nlm.nih.gov/geo/) for verification. GSE20685 dataset is based on GPL570 platform, which contains 327 BC samples. All samples were left for analysis after setting the condition that the overall survival was greater than 90 days. The probes were annotated using homo sapiens GTF files in the ensemble database (http://asia.ensembl.org/index.html).
2.2 Identification of Differential Expression Genes
After normalization and gene ID transformation, the gene expression matrix was used as an input file and the “Deseq2” R package was used to search for genes differentially expressed in normal and BC samples in TCGA-BRCA [24].
2.3 Extraction of Metabolism-Related Genes
The metabolism-related genes were derived from the Virtual Metabolic Human (VMH, www.vmh.life) database encapsulating current knowledge of human metabolism within five interlinked resources ‘Human metabolism’, ‘Disease’, ‘Nutrition’, ‘Gut microbiome’, and ‘Recon Maps’. In total, the VMH captured 5180 unique metabolites, 17730 unique reactions, 3695 human genes, 255 Mendelian diseases, 818 microbes, 632685 microbial genes and 8790 food items [25].
2.4 Construction and Validation of the Metabolism-Related Gene Signature
In the training cohort (TCGA-BRCA), univariate cox regression analysis (“survival” package) was applied to screen the metabolism-related genes correlated with survival and a p < 0.001 was set as the cutoff for statistical significance in the univariate cox regression analysis. To solve the effect of overfitting, the Least Absolute Shrinkage and Selection Operator (LASSO) regression analysis with tenfold cross-validation was subsequently applied by using “glmnet” and “survival” packages [26]. The independent prognostic metabolism-related genes were obtained through a multivariate Cox regression analysis and used to construct the prognostic model with the following formula:
Risk score = (−0.142 × SERPINA1 expression) + (0.1635 × QPRT expression) + (0.105 × PXDNL expression).
The “survivalROC” package was used to investigate the time-dependent prognostic value of the gene signature. A two-sided log-rank p < 0.05 was considered significant for survival analysis.
2.5 Evaluation of the Sensitivity of Chemotherapeutic Agents
To predict the relationship between high-/low-risk patients and the half-maximal inhibitory concentration (IC50) of chemotherapeutic drugs to infer the sensitivity of different patients, we used the “pRRophetic” package in R software by applying the ridge regression model based on the cell line expression spectrum from Genomics of Drug Sensitivity in Cancer (GDSC) (www.cancerrxgene.org/) and TCGA gene expression profiles [27]. The IC50 of chemotherapeutic drugs in the TCGA-BRCA project was calculated by the pRRophetic algorithm and the difference of IC50 between the high- and low- risk groups was determined by Wilcoxon test.
To explore the potential molecular mechanisms underlying our constructed prognostic model, GSEA was performed to find enriched terms [28]. p < 0.01 and FDR (false discovery rate) q < 0.05 were considered statistically significant. The ssGSEA was applied to explore the different infiltration degrees of immune cell types using the immunologic signature gene set and analyzed by the R packages “GSVA” [29]. Forest plot was shown related Hazard ration (HR), Log-Rank, Concordance index of BRCA. Ggplot package was used to explore the correlation between the high/low risk and IC50 of anti-tumor drugs by violin diagrams. The ggrisk package was used to xisualiza the con model. The protein expressions of the three metabolism-related genes in the signature were obtained using the recorded data from Human Protein Atlas (HPA) database (https://www.proteinatlas.org/). GEPIA, an online analysis database that integrates RNA sequencing data from the TCGA and GTEx datasets, was used to explore the expression levels of 3 metabolism-related genes in the signature [30].
The R packages “survminer” and “survival” were used to draw the Kaplan-Meier survival curve. The patients were classified into high- and low-risk groups according to the median value. P value < 0.01 on both sides indicated a significant difference in survival time between the two groups. The prognostic MRGs-based gene signature was externally validated in the GEO dataset, and p < 0.05 was regarded as statistically significant.
All statistical analyses were performed using R version 3.6.2 (https://cran.r-project.org/). Wilcoxon or Kruskal-Wallis tests were used to compare continuous variables. The difference of overall survival between the high-risk group and the low-risk group in each cohort was evaluated by the log-rank test. All p values were based on a two-sided statistical test, and p < 0.05 was considered statistically significant.
3.1 Construction and Validation of the Prognostic Metabolic Gene Signature for Breast Cancer
We first analyzed differential expressed genes of BC. We downloaded data containing 1171 samples from the TCGA-BRCA dataset, as shown in the flowchart (Fig. S1). In total, 10224 differentially expressed genes (|log2 FC| > 0.5, adjust p < 0.05) were obtained in the TCGA-BRCA dataset (training cohort) (Fig. S2A), which was then intersected with the 3286 metabolic genes from the VMH database (duplicates were removed from the original 3695 human metabolism-related genes) and 21656 differentially expressed genes from GEO database. Through this analysis, a total of 1471 common differentially expressed metabolism-related genes were obtained (Fig. S2B). Next, for the survival analysis, all cases with OS of fewer than 90 days were excluded. To identify candidate prognostic metabolism-related genessignificantly associated with OS, the expression matrix of 993 samples from the remaining TCGA-BRCA dataset was used as a training set. The univariate Cox regression analysis was first used to screen metabolism-related genes related to OS. Then the LASSO algorithm was performed to select the factors with a non-zero weight, and a total of 8 metabolism-related genes were selected to develop the prognostic model (Figs. 1A and 1B). Among these 8 genes, 3 independent prognostic metabolism-related genes associated with OS were identified by multivariate Cox analysis, including one protective prognostic factor (SERPINA1) and two dangerous prognostic factors (QPRT, PXDNL) (Fig. 1C). The Risk score can be calculated by: Risk score = (−0.142 × SERPINA1 expression) + (0.1635 × QPRT expression) + (0.105 × PXDNL expression). Among the 3 signature genes, SERPINA1 had a negative coefficient in cox regression analysis, implying that its higher expression level was associated with lower risk and better OS. On the contrary, QPRT, PXDNL showed positive coefficients; their elevated expression levels were accompanied by higher risk scores, thus predicting poor OS.
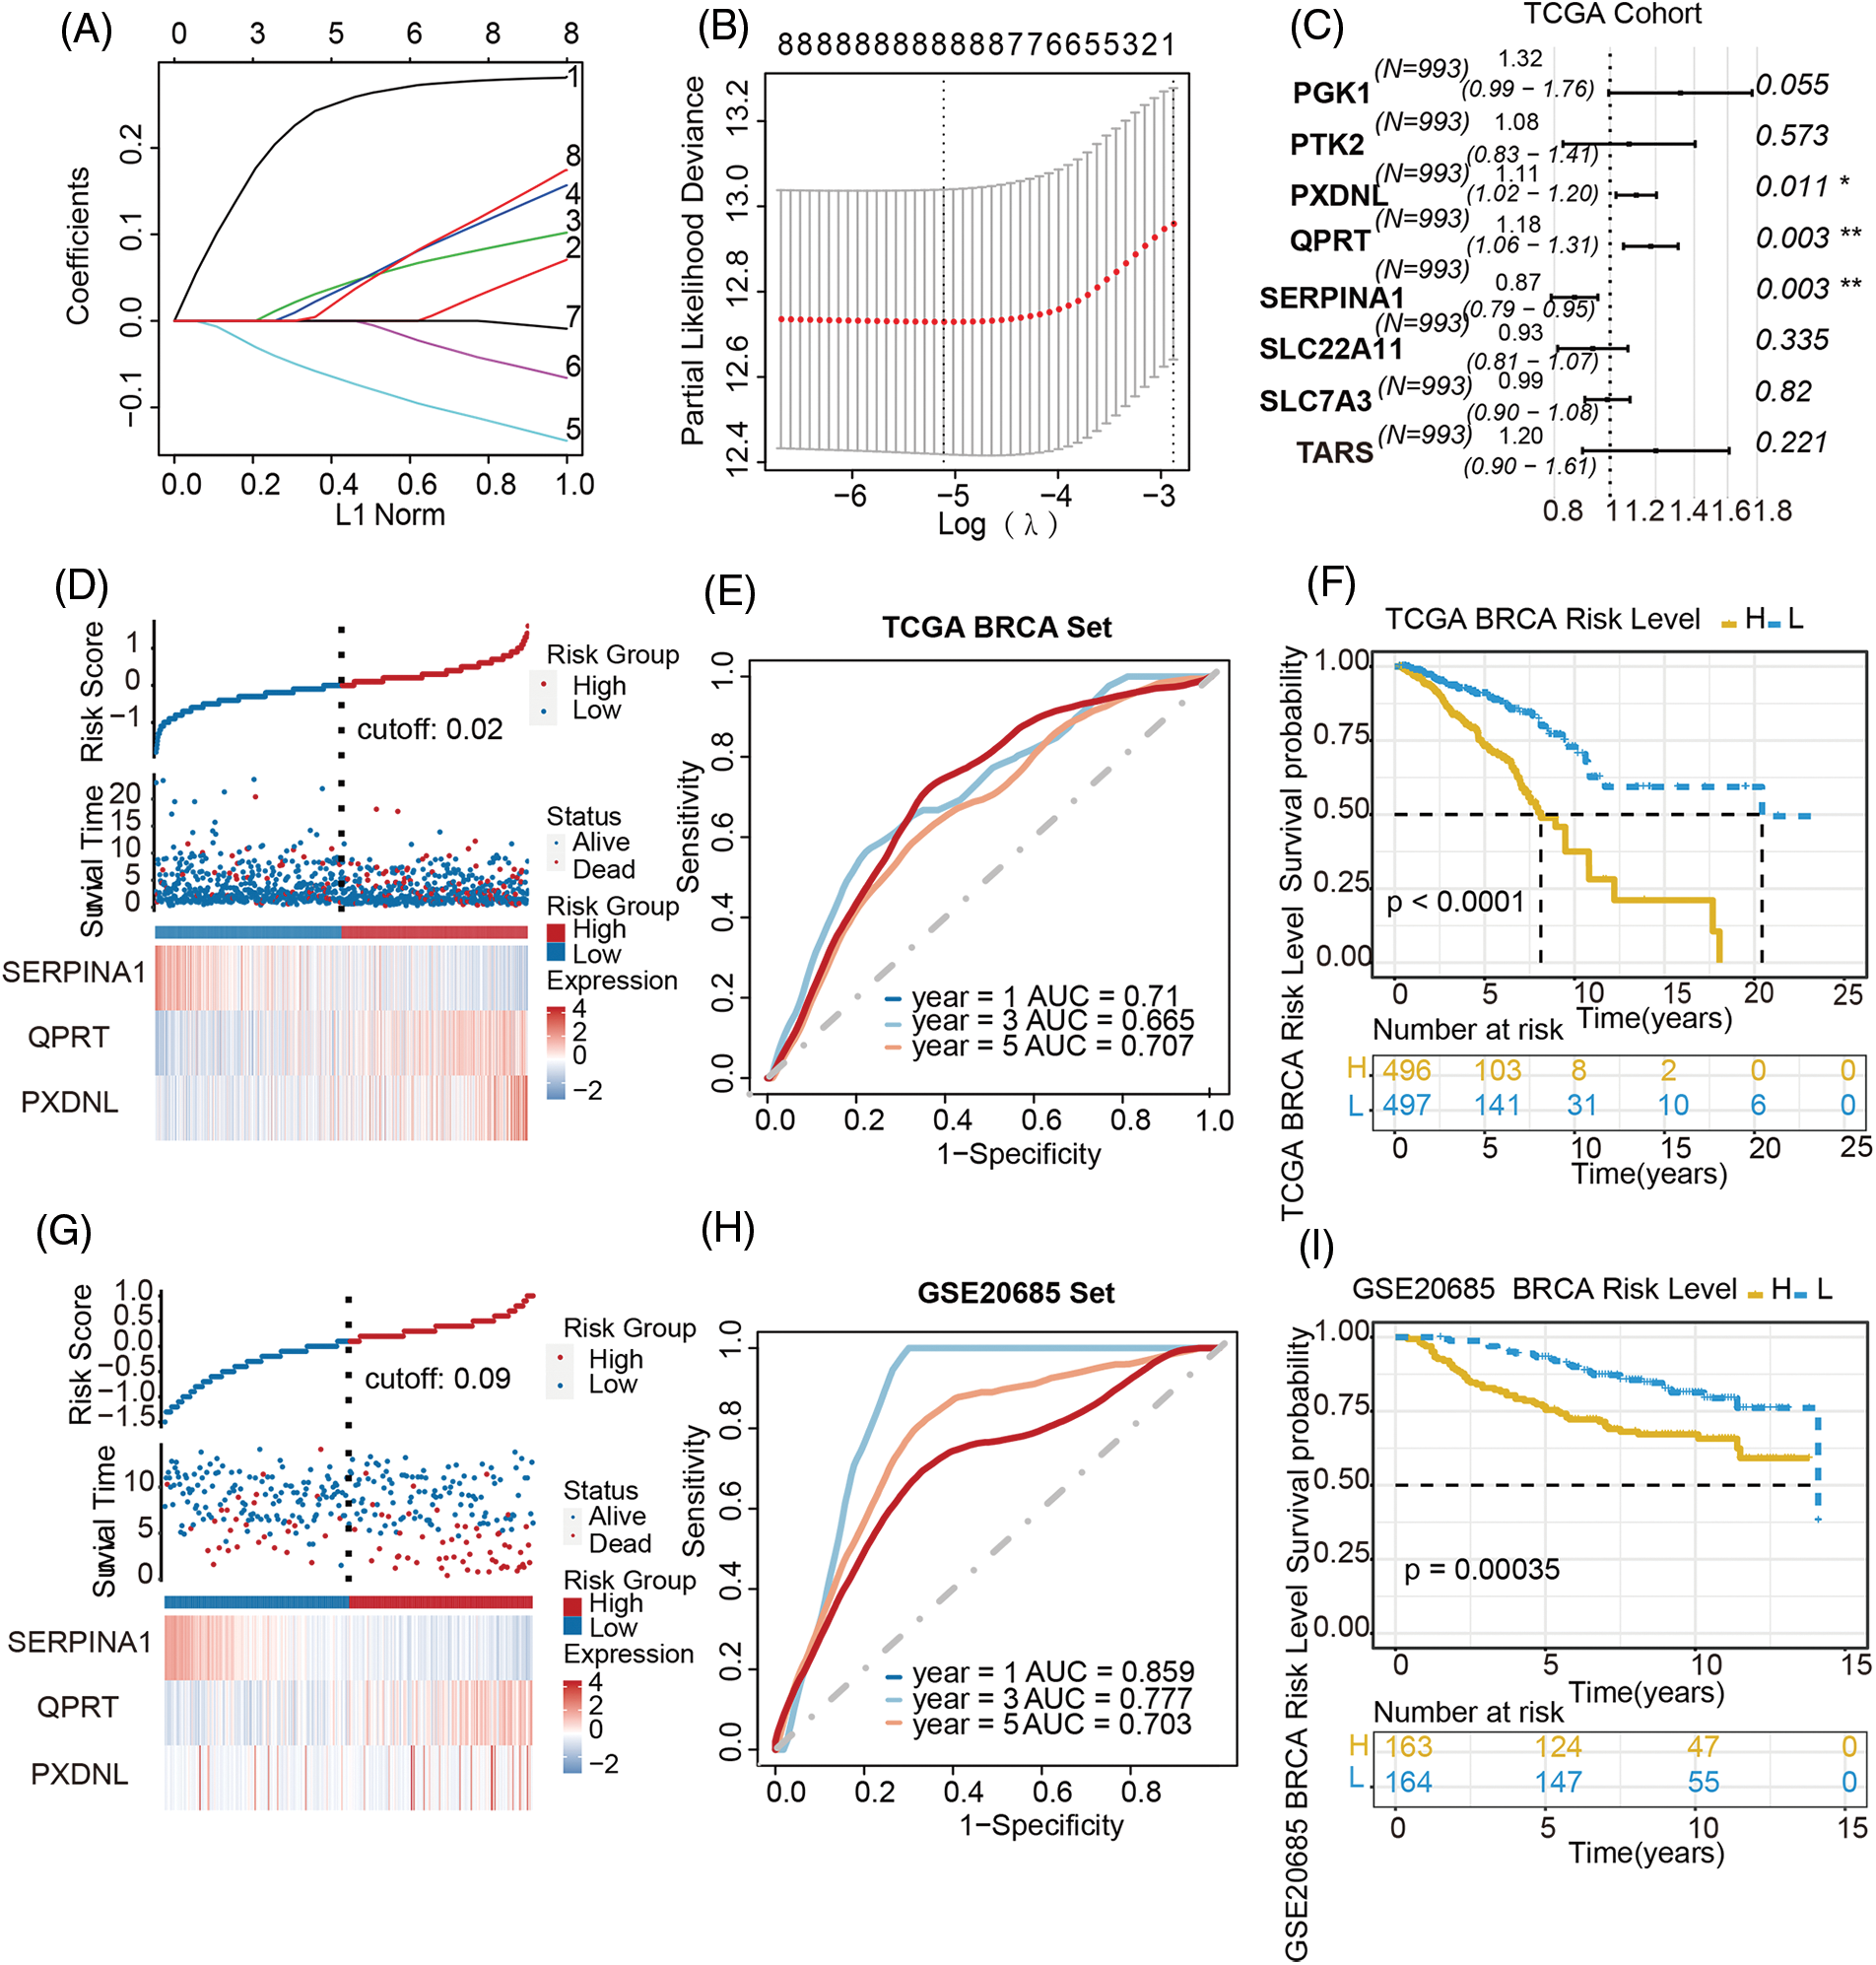
Figure 1: Establishment of a metabolism-related prognostic model in breast cancer. (A) LASSO coefficient profiles of the candidate prognosis-related metabolism-related genes. (B) Selection of the optimal parameter in the LASSO regression with tenfold cross-validation. (C) Multivariate Cox regression analysis of 8 prognosis-related candidate metabolism-related genes. (D–F) Risk score distribution, the heatmap of mRNA expression, time-dependent ROC curve and Kaplan-Meier curve of the 3-gene signature in the training cohort. (G–I) Risk score distribution, the heatmap of mRNA expression, time-dependent ROC curve and Kaplan-Meier curve of the 3-gene signature in the validation cohort
To validate the prognostic value of this derived model, patients other than in the training set from TCGA-BRCA cohort were divided into high-/low-risk groups with a median cut-off value (Fig. 1D), followed by the calculation of the risk score in both groups. The accuracy of the OS predictions with this metabolism-related genes-based gene signature, was evaluated by ROC analysis. The area under the ROC curve (AUC) for 1-, 3-, 5-year’ OS were 0.71, 0.665, 0.707 respectively, indicating good performance in survival prediction (Fig. 1E). Kaplan-Meier survival curve analysis further confirmed that the high-risk group had significantly lower OS than the low-risk group (p < 0.0001; Fig. 1F).
Patients in the GSE20685 cohort were also divided into high-risk and low-risk groups to validate the prognostic model (Fig. 1G). The distribution of risk scores and the survival status of patients in the validation cohort were also displayed in Fig. 1G. The AUC for 1-, 3-, and 5-year OS were 0.859, 0.777, 0.703, respectively (Fig. 1H), again indicating a predictive capacity of the model. The OS was also significantly poorer in the high-risk group than in the low-risk group (p < 0.00035; Fig. 1I). Taking together, these results demonstrated a metabolism-related prognostic model with good sensitivity and specificity has been successfully constructed.
3.2 The Prognostic Role of the Metabolism-Related Genes Signature Is Independent of TNM Staging
TNM staging system remains the most useful tool to guide the treatment options for patients with cancer. To explore the prognostic value of the signature in different stages of patients, TCGA cohort was classified into three subgroups based on pathologic TNM staging: Pathologic T, Pathologic N, Pathologic M. The analysis of survival in different TNM staging indicated that with the progress of T staging, the survival period was greatly shortened (p = 0.0023) (Fig. 2A). Similarly, as the degree of lymph node metastasis was higher, the survival period was shorter (p < 0.0001, Fig. 2B). Moreover, the survival time after metastasis was significantly lower than that of patients without metastasis (p < 0.0001) (Fig. 2C).

Figure 2: Independent prognostic role of the metabolism-related genes signature. (A–C) The training cohort was classified into several subgroups based on pathologic TNM staging (Pathologic T, Pathologic N, Pathologic M). It can be seen that with the progress of TNM staging, the survival period was greatly shortened. Forest plot was applied to display the univariate (D) and multivariate (E) Cox regression analysis of pathologic T, N, M staging and risk score of 3-gene signature
In order to compare the prognostic power of metabolism-related genes-based gene signature with clinical factors such as traditional pathological TNM staging, univariate and multivariate cox regression analysis were performed in the training and validation datasets, and the results showed that age, TNM staging and metabolism-related genes signature were all independent prognostic factors of OS by univariate and multivariate Cox analysis in training cohort (Fig. 2D). Among the 327 patients included in GSE20685, although univariate analysis found that TNM staging and metabolism-related genes signature were both prognostic factors for OS, multivariate analysis found that only N staging and metabolism-related genes signature were independent prognostic factors, while in T and M staging and metabolism-related gene signature were dependent prognostic factors. These results indicated that metabolism-related genes signature had a more stable independent prognostic ability than TNM staging (Fig. 2E).
3.3 Metabolism-Related Gene Signature Predicts High and Low Risk of Survival in Different Breast Cancer Subtypes
To explore the prognostic value of the metabolism-related genes signature in different subtypes of BC patients, TCGA-BRCA cohort was classified into several subtypes based on clinical features. According to the expression levels of ER, PR, and HER2, primary BC can be divided into 4 subtypes, including luminal A, luminal B, HER2, TNBC, respectively. After comparing survival abilities between the high- and low-risk groups in all 4 subtypes (Fig. 3A and Fig. S3), patients in the high-risk group all had higher mortality than the patients in the low-risk group (all p < 0.05) except in subtype HER2 overexpression and subtype Basal (Figs. S3C, S3D). This might be because there were too few samples in HER2 and Basal subtypes, but there was a tendency for high risk to correlate with poorer survival.
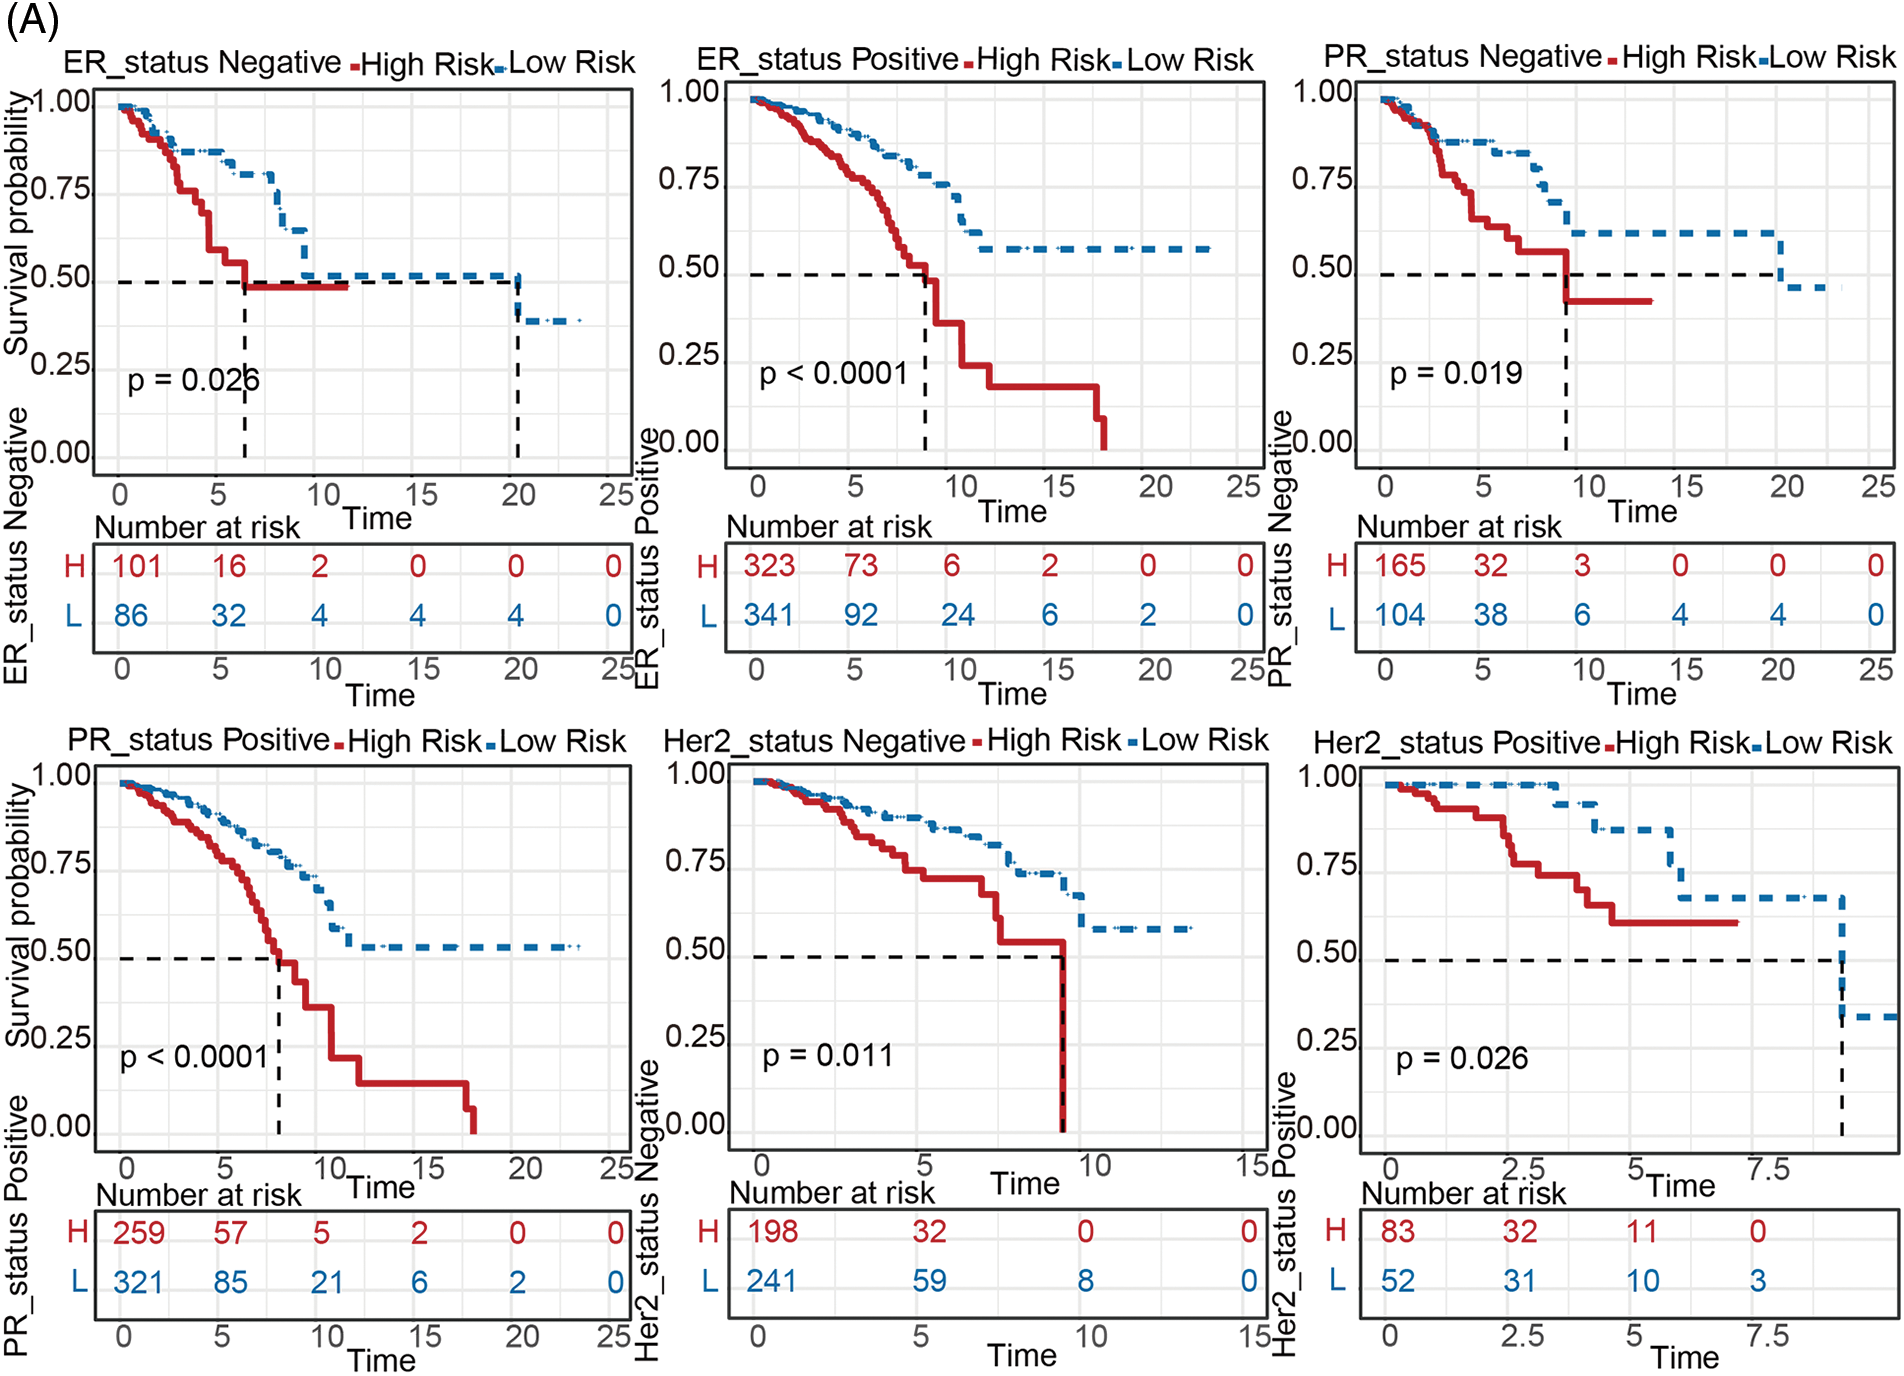

Figure 3: Stratified survival analysis between the high- and low-risk groups. (A) Kaplan-Meier analysis between groups at high- and low-risk for various breast cancer subtypes (including ER status positive/negative, PR status positive/negative, HER2 status positive/negative). (B) Comparisons of the degree of 22 infiltrated immune cells between the high- and low-risk groups
To evaluate this gene signature in the reflection of anti-cancer immune, immune scores were inferred by ssGSEA method based on “GSVA” R package. As shown in Fig. 3B, almost all immune cells (including Activated B cell, CD8 T cell, dendritic cell, Eosinophil, Macrophage, Mast cell, MDSC, Monocyte, Regulatory T cell, Natural killer cell, etc) were more enriched in the low-risk group compared to high-risk group, indicating that the metabolism-related genes signature can reflect immune infiltration in the BC tumor microenvironment (all p < 0.05).
3.4 Building and Validating a Predictive Nomogram in Both Training and Validation Cohorts
Nomogram was further built by including Pathologic N staging and the metabolism-related genes signature in the training cohort, which integrated variables via proportional line segments to predict the OS in the model (Fig. 4A). The calibration curves for the nomogram showed favorable consistency between actual observation and predictive value (Fig. 4B). The AUC of the combined score was 0.787, 0.684, 0.711 for ROC curves of the 1-, 3-, or 5-years’ OS prediction for these variables, respectively, suggesting pretty good prognostic performance (Fig. 4C). Furthermore, we anzlyzed the predictive power of the risk score with TNM staging. As shown in Fig. S4, the prediction efficiency was even better. DCA curve analysis was used to evaluate the clinical efficacy of the model. A higher dotted line of the DCA curve for the nomogram model, suggesting this nomogram model had good clinical efficacy in survival prediction (Fig. 4D).
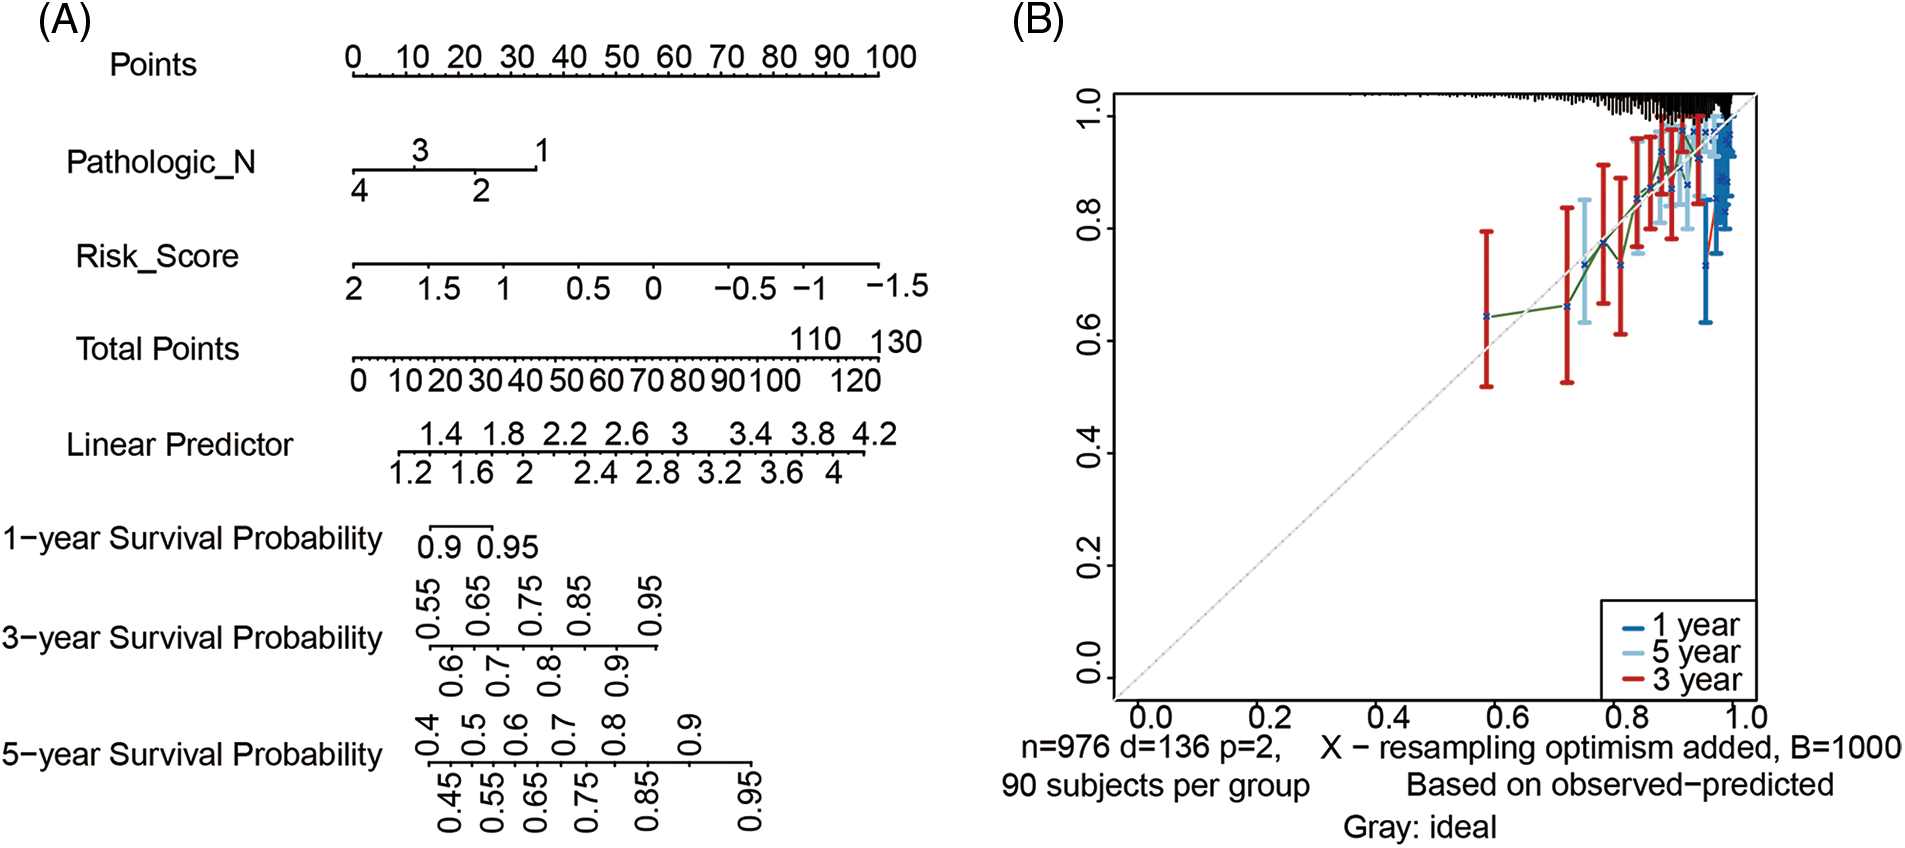
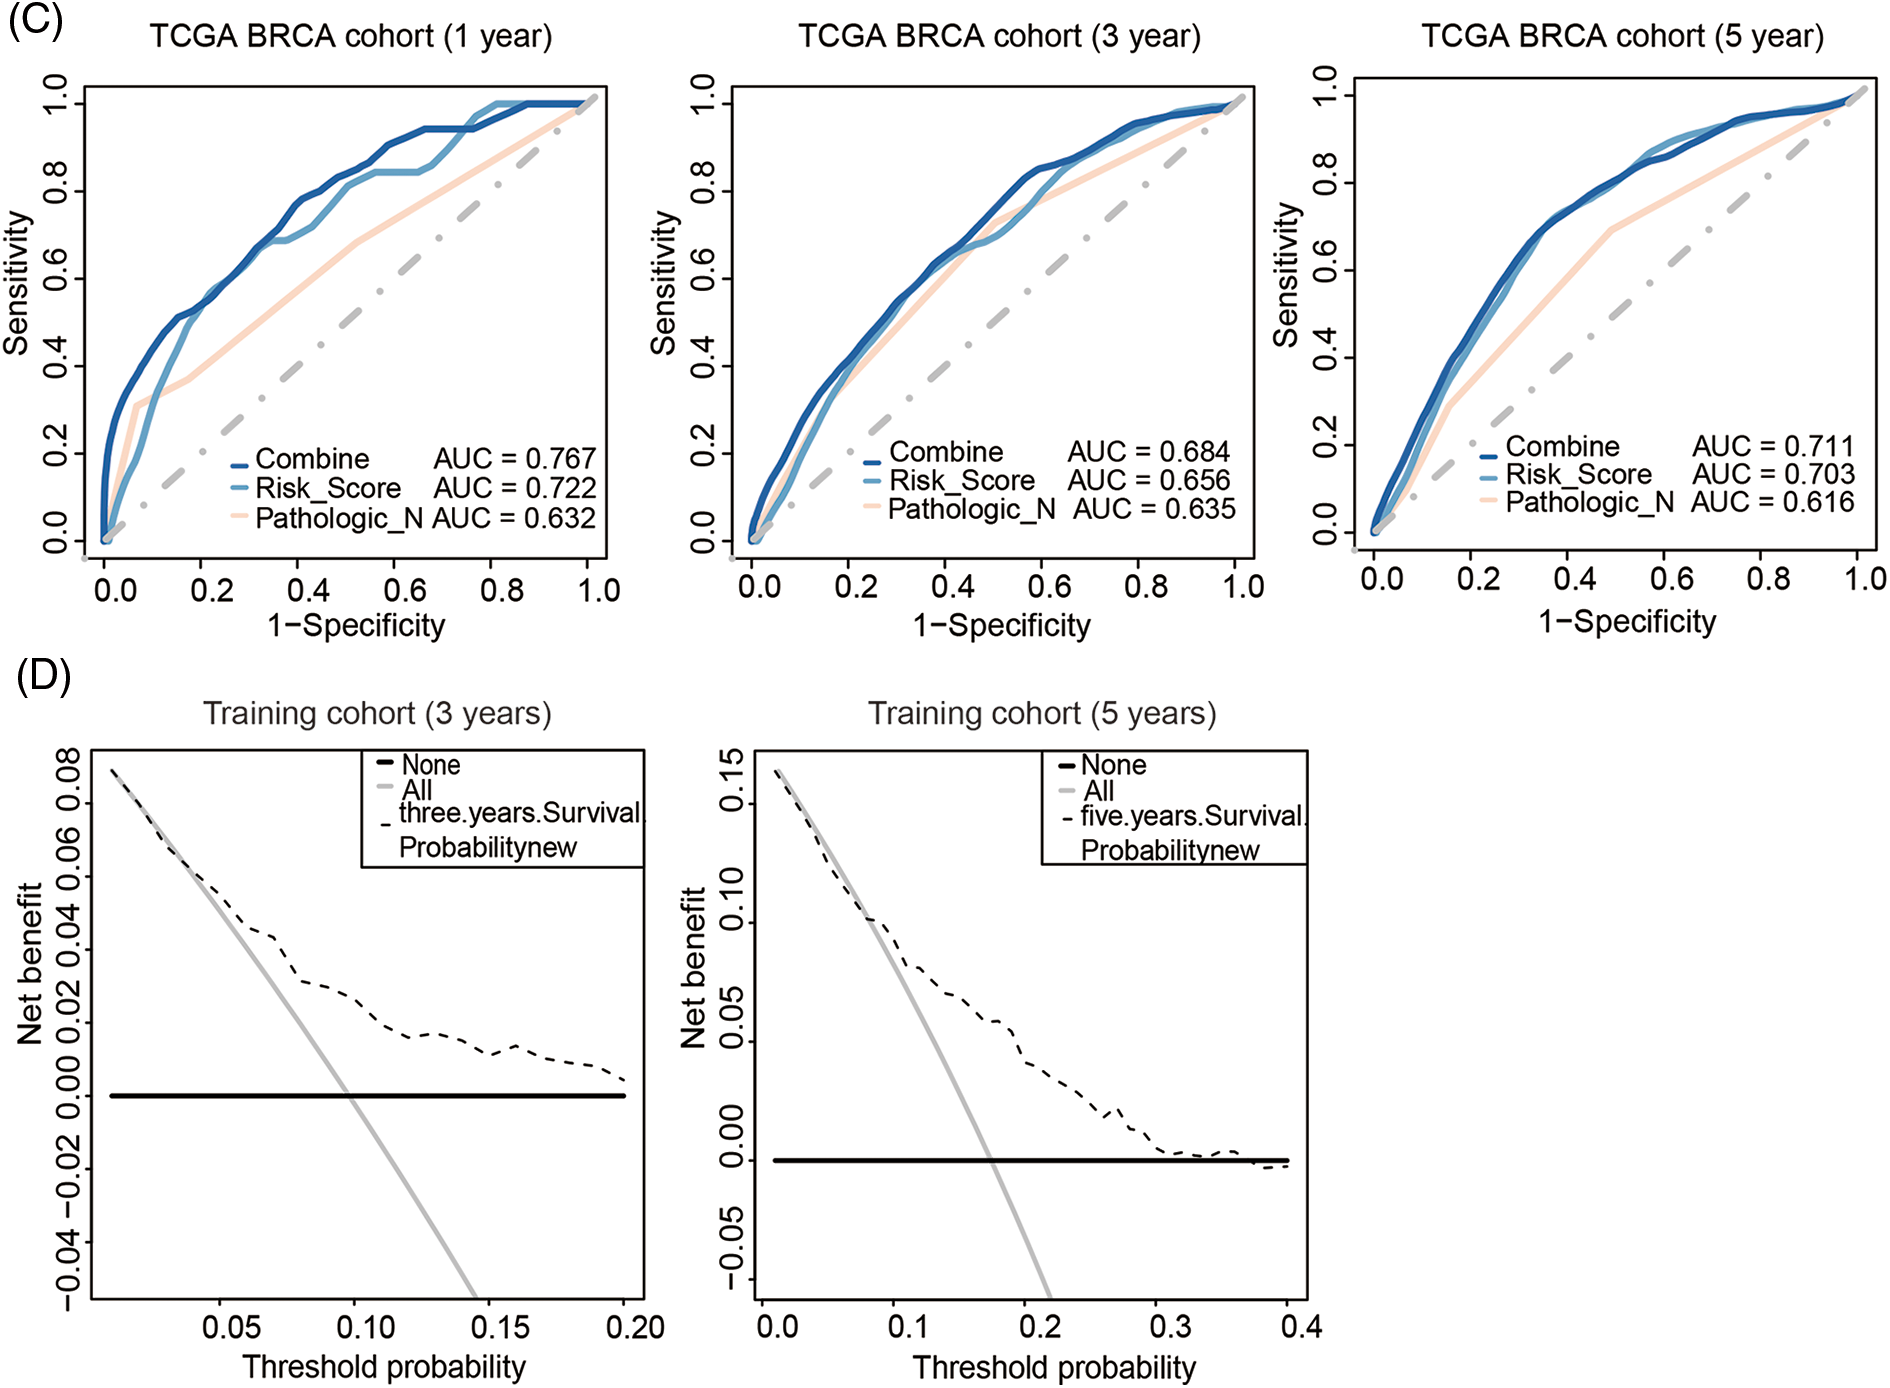
Figure 4: Development of metabolism-related genes-based nomogram. (A) Development of metabolism-related genes-based nomogram in the training cohort. (B) The calibration plots, (C) The ROC curves and (D) The decision curves were used to evaluate the performance of the 3-gene signature in predicting OS in the training cohort. In the decision curve, the solid black line represented no patients would die, and the grey line represented all patients would die
Nomogram was also built on the same variables in the validation cohort (Fig. S5A). Calibration plots also showed that the validating nomogram had good predictive ability (Fig. S5B). The AUCs of the combined score were 0.709, 0.847, 0.785 for 1-, 3- or 5-year respectively in the validation cohort (Fig. S5C), indicating that combining the metabolism-related genes signature with N staging showed some benefit for predicting OS. DCA curves also suggested that this nomogram model had good clinical efficacy (Fig. S5D).
In summary, combining the metabolism-related genes signature with traditional pathologic N staging can improve the sensitivity and specificity of OS prediction and contribute to accurate clinical prognosis.
3.5 Response of High- and Low-Risk Patients to Chemotherapy
We then attempted to identify associations between chemotherapeutics and metabolism-related genes signature in treating BC patients. According to the pRRophetic algorithm, we predicted the IC50 of 8 common chemotherapeutic agents (AS601245, Bexarotene, Bleomycin, Roscovitine, Dasatinib, Doxorubicin, Etoposide, and Rapamycin) in high- and low-risk patients and found that all eight drugs had lower IC50 in high-risk patients (Wilcoxon test, all p < 0.01, Fig. 5A). These data indicated that the high-risk patients were more sensitive to these 8 drugs, providing a reference for clinical medications.

Figure 5: Responses of high- and low-risk patients to chemotherapy. (A) Based on the correlation between risk scores and IC50 of chemotherapeutic drugs, this model provides a reference for clinical chemotherapeutic drug selection. A high-risk score was associated with a lower IC50 for the following chemotherapeutic agents, such as Bexarotene, Bleomycin, Roscovitine, Dasatinib, Doxorubicin, Etoposide, Rapamycin. (B) GSEA analysis shows that a lower-risk score was accompanied by enriched pathways related to immune response and a higher risk score was associated with the activation of metabolism-related pathways
To explore the underlying mechanisms associated with the metabolism-related genes signature, we conducted GSEA analysis comparing the high-risk group with the low-risk group in TCGA-BRCA cohort. In the low-risk group, the enriched KEGG pathways and GO terms were mainly focused on the immune processes (including KEGG primary immunodeficiency, KEGG autoimmune thyroid disease, GO regulation of humoral immune response), which was consistent with the finding the low-risk score correlates with higher immune infiltrations (Fig. 3B). In the high-risk group, the enriched KEGG pathways and GO terms were mainly focused on various metabolism processes (KEGG Glutathione metabolism, GO cofactor metabolic process, GO regulation of mRNA metabolic process), all p < 0.001 (Fig. 5B), suggesting that activation of these metabolic pathways may contribute to disease progression and was responsible for the high survival risk of BC patients.
3.6 Validation of Metabolism-Related Genes Expression Using External Databases
The above results indicated that the metabolism-related genes signature composed of three metabolism-related genes found in this study can effectively predict the prognosis of BC, suggesting that these genes may play key roles in the occurrence and development of BC. We found that the 3 genes (SERPINA1, QPRT and PXDNL) were consistently overexpressed in tumor tissues in the GEPIA database in the mRNA levels (Fig. 6A). To further evaluate the protein expressions of these genes, we searched for their expressions in protein level in the HPA database, where the information for protein expressions of SERPINA1 and QPRT was found. As seen from Fig. 6B, Immunohistochemical staining of SERPINA1 and QPRT was increased in BC tissue compared to normal breast tissue, in consistent with changes in mRNA levels. Survival analysis also indicated that SERPINA1 is a protective factor, while QPRT and PXDNL are risk factors (Fig. 6C). Therefore, these 3 metabolism-related genes appeared to be potential therapeutic targets.


Figure 6: Verification of the expressions of the three MRGs in the signature. (A) The mRNA expressions of SERPINA1, QPRT, and PXDNL between breast cancer and normal tissues in the GEPIA database. (B) The protein expression profiles of the metabolism-related genes between breast cancer and normal tissues in the HPA database. (C) Kaplan-Meier analysis of OS for SERPINA1, QPRT and PXDNL in breast cancer patients using GEPIA web tool
Breast cancer screening is common in developed countries, while early detections are at high rates and can greatly improve the survival [31]. However, the pros and cons of BC screening using BRCA have also been hotly debated in recent years, as studies have found the increased relative numbers and rates of overdiagnosis, including for ductal carcinoma in situ and invasive cancer [32,33]. Now, BC is still one of the most frequently diagnosed cancers in women and a major cause of morbidity and premature mortality among women globally [34,35]. Owing to the high heterogeneity of BRCA, patients with TNM similar stages often have different survival outcomes, indicating that the TNM staging system has limitations in predicting patients’ survival. Therefore, it is necessary to develop new prognostic methods for BC to provide guidance and direction for personalized treatment of BC patients.
Some studies have shown that metabolic changes are a well-known feature of BC. It is well known that BC cells exhibit a variety of characteristic metabolic changes which supply material and energy for rapidly growing tumor cells, but current research is far from revealing the specific mechanism of metabolic changes in BC and providing clinical guidance. Mitochondrial energy reprogramming has been found to play an important role in the metabolic plasticity in BC beyond glycolytic phenotypes [36–38]. Moreover, tumor glucose metabolism and glycolysis rates were identified as the major trigger of intrinsic or acquired resistance to classical chemotherapeutics [39]. Metabolism reprogramming has also been recognized as a mechanism of breast cancer resistance. The metabolic profiles showed that there were 25 metabolites with significant changes, including 4 exhibited decreased levels and 21 exhibited increased levels, in doxorubicin-resistant MCF-7 cells [40]. Min et al. reported that the level of G6PD (glucose-6-phosphate dehydrogenase) and metabolites of 3-phosphoglycerate and ribulose-5-phosphate production were both increased in paclitaxel-resistant cells [41]. In addition, G6PD was demonstrated to regulate the metastasis and drug resistance of breast cancer cells through its antioxidant property [42]. Given the close relationship between metabolism and tumor, the application of metabolism-related prognostic models is of great significance for guiding clinical decision-making and clinical precision medication. However, the existing signatures have some defects such as insufficient samples or lack of external verification. As far as we know, the predictive power of the existing BC prognostic models have limited predictive power. Because of this, our study aims to construct an metabolism-related genes-based gene signature that might promote the understanding of molecular mechanisms related to BC metabolism. In this study, we first used a training set (TCGA dataset including 1171 samples) for modeling and a validation cohort (GSE20685 including 327 samples) for verification. The metabolism-related genes signature comprising 3 genes (SERPINA1, QPRT, PXDNL) developed herein could properly divide patients into high-risk and low-risk groups in the training and validation sets and the prognosis of different risk groups was accurately predicted. Furthermore, this 3-gene metabolism-related genes signature was shown to be an independent prognostic factor by the multivariate Cox proportional hazards regression analyses. From the perspective of clinical implications, our metabolism-related genes prognostic model gives reproducible and reliable results and can efficiently predict the OS of patients with BC.
Some of the genes included in the model have been studied intensively in recent years. For example, SERPINA1 (Serine protease inhibitor family A member 1) is a gene encoding a serine protease inhibitor. SERPINA1 plays an important role in physiological and pathological processes, such as angiogenesis, tumor invasion and metastasis. Literature has shown that the expression of SERPINA1 is related to the prognosis of lung cancer [43] and colon cancer metastasis [44]. However, SERPINA1 has been less studied in BC. Our analysis proves that SERPINA1 is a protective factor, which also points the way for future research. QPRT (quinolinic acid phosphoribosyltransferase) is a key enzyme in the metabolism of quinolinate, and may be involved in the metabolic regulation of BC development. Studies have shown that the high expression of QPRT indicates a lower survival rate for BC patients and is related to poor prognosis [45], which is consistent with our analysis. PXDNL (Peroxidasin like) has many biological functions, including the characteristic activity of hormone biosynthesis, host defense, and cell motility. It is a member of the peroxidase gene family, encoding a peroxidase-like protein, and its isomer PMR1 encodes nucleic acid endonucleases that selectively degrade certain target genes. Moreover, PXDNL is found to be closely connected with the progression of BC [46]. We integrated the 3 genes into a panel and established a novel signature for predicting the prognosis in BC that showed a strong predictive ability and acted as an independent prognostic factor. Our model also confirms that, regardless of the subtypes of patients, the survival time of patients in the high-risk group is lower than that in the low-risk group based on the risk scores calculated from the 3-gene signature, which further verified the extensive practicability of the model.
In conclusion, we constructed an metabolism-related genes-based prognostic model and validated its efficacy in predicting OS in BC. Our model showed that lower-risk patients were associated with higher immune infiltrations, underscoring the importance of immue ecosystems in determing the prognosis of BC patients. Although our model has achieved good prediction performance on both the training and validation sets in this study, more external validation is needed to popularize its application. Further biological experiments are also needed to verify the molecular function of these metabolic genes in the signature. This can not only improve the credibility of the model but also provide potential targets for the targeted treatment of BC.
Acknowledgement: We are grateful to the GEO and TCGA databases for providing a platform for researchers, and to the data contributors for generously sharing their important and meaningful datasets.
Authorship: The authors confirm contribution to the paper as follows: study conception and design: LH, HW and WY; data collection: LH and MC; analysis and interpretation of results: LH, MC, HD, HW and WY; draft manuscript preparation: LH and WY. All authors reviewed the results and approved the final version of the manuscript.
Availability of Data and Materials: The datasets presented in this study can be found in online repositories, as mentioned in the section of “Materials and Methods”. And all data related to this study are available from the corresponding author upon reasonable request.
Ethics Approval and Informed Consent Statement: Not applicable.
Funding Statement: This study was supported by National Natural Science Foundation of China (Grant Nos. 81872276 and 61973295), the Research Project issued by Shanxi Scholarship Council of China (Grant No. 2020-085), the Foundation of Anhui Province Key Laboratory of Medical Physics and Technology (Grant No. LMPT201908), the Hefei Institutes of Physical Science of Chinese Academy of Sciences (CASHIPS) Director’s Fund (Grant No. YZJJ2021QN40) and the Key Scientific Research Project of Wannan Medical College (Grant No. WK2022Z01).
Conflicts of Interest: The authors declare that they have no conflicts of interest to report regarding the present study.
References
1. Dumas, A., Vaz Luis, I., Bovagnet, T., El Mouhebb, M., di Meglio, A. et al. (2020). Impact of breast cancer treatment on employment: Results of a multicenter prospective cohort study (CANTO). Journal of Clinical Oncology, 38(7), 734–743. DOI 10.1200/JCO.19.01726. [Google Scholar] [CrossRef]
2. DeSantis, C. E., Ma, J., Goding Sauer, A., Newman, L. A., Jemal, A. (2017). Breast cancer statistics, 2017, racial disparity in mortality by state. CA: A Cancer Journal for Clinicians, 67(6), 439–448. DOI 10.3322/caac.21412. [Google Scholar] [CrossRef]
3. Johnson, R. H., Chien, F. L., Bleyer, A. (2013). Incidence of breast cancer with distant involvement among women in the United States, 1976 to 2009. JAMA, 309(8), 800–805. DOI 10.1001/jama.2013.776. [Google Scholar] [CrossRef]
4. Ferlay, J., Soerjomataram, I., Dikshit, R., Eser, S., Mathers, C. et al. (2015). Cancer incidence and mortality worldwide: Sources, methods and major patterns in GLOBOCAN 2012. International Journal of Cancer, 136(5), E359–E386. DOI 10.1002/ijc.29210. [Google Scholar] [CrossRef]
5. Pfeiffer, R. M., Webb-Vargas, Y., Wheeler, W., Gail, M. H. (2018). Proportion of U.S. trends in breast cancer incidence attributable to long-term changes in risk factor distributions. Cancer Epidemiology, Biomarkers and Prevention, 27(10), 1214–1222. DOI 10.1158/1055-9965.EPI-18-0098. [Google Scholar] [CrossRef]
6. Reis-Filho, J. S., Pusztai, L. (2011). Gene expression profiling in breast cancer: Classification, prognostication, and prediction. Lancet, 378(9805), 1812–1823. DOI 10.1016/S0140-6736(11)61539-0. [Google Scholar] [CrossRef]
7. Cremasco, V., Astarita, J. L., Grauel, A. L., Keerthivasan, S., MacIsaac, K. et al. (2018). FAP delineates heterogeneous and functionally divergent stromal cells in immune-excluded breast tumors. Cancer Immunology Research, 6(12), 1472–1485. DOI 10.1158/2326-6066.CIR-18-0098. [Google Scholar] [CrossRef]
8. Paik, S., Shak, S., Tang, G., Kim, C., Baker, J. et al. (2004). A multigene assay to predict recurrence of tamoxifen-treated, node-negative breast cancer. The New England Journal of Medicine, 351(27), 2817–2826. DOI 10.1056/NEJMoa041588. [Google Scholar] [CrossRef]
9. Paik, S., Tang, G., Shak, S., Kim, C., Baker, J. et al. (2006). Gene expression and benefit of chemotherapy in women with node-negative, estrogen receptor-positive breast cancer. Journal of Clinical Oncology, 24(23), 3726–3734. DOI 10.1200/JCO.2005.04.7985. [Google Scholar] [CrossRef]
10. Chitalia, R. D., Rowland, J., McDonald, E. S., Pantalone, L., Cohen, E. A. et al. (2020). Imaging phenotypes of breast cancer heterogeneity in preoperative breast dynamic contrast enhanced magnetic resonance imaging (DCE-MRI) scans predict 10-year recurrence. ClinIical Cancer Research, 26(4), 862–869. DOI 10.1158/1078-0432.CCR-18-4067. [Google Scholar] [CrossRef]
11. Parker, J. S., Mullins, M., Cheang, M. C., Leung, S., Voduc, D. et al. (2009). Supervised risk predictor of breast cancer based on intrinsic subtypes. Journal of Clinical Oncology, 27(8), 1160–1167. DOI 10.1200/JCO.2008.18.1370. [Google Scholar] [CrossRef]
12. Sestak, I., Buus, R., Cuzick, J., Dubsky, P., Kronenwett, R. et al. (2018). Comparison of the performance of 6 prognostic signatures for estrogen receptor-positive breast cancer: A secondary analysis of a randomized clinical trial. JAMA Oncology, 4(4), 545–553. DOI 10.1001/jamaoncol.2017.5524. [Google Scholar] [CrossRef]
13. Bao, M., Shi, R., Zhang, K., Zhao, Y., Wang, Y. et al. (2019). Development of a membrane lipid metabolism-based signature to predict overall survival for personalized medicine in ccRCC patients. The EPMA Journal, 10(4), 383–393. DOI 10.1007/s13167-019-00189-8. [Google Scholar] [CrossRef]
14. Ward, P. S., Thompson, C. B. (2012). Metabolic reprogramming: A cancer hallmark even warburg did not anticipate. Cancer Cell, 21(3), 297–308. DOI 10.1016/j.ccr.2012.02.014. [Google Scholar] [CrossRef]
15. Yan, W., Wu, X. W., Zhou, W. Y., Fong, M. Y., Cao, M. H. et al. (2018). Cancer-cell-secreted exosomal miR-105 promotes tumour growth through the MYC-dependent metabolic reprogramming of stromal cells. Nature Cell Biology, 20(5), 597–609. DOI 10.1038/s41556-018-0083-6. [Google Scholar] [CrossRef]
16. Lunt, S. Y., Vander Heiden, M. G. (2011). Aerobic glycolysis: Meeting the metabolic requirements of cell proliferation. Annual Review of Cell and Developmental Biology, 27, 441–464. DOI 10.1146/annurev-cellbio-092910-154237. [Google Scholar] [CrossRef]
17. Zaimenko, I., Lisec, J., Stein, U., Brenner, W. (2017). Approaches and techniques to characterize cancer metabolism in vitro and in vivo. Biochimica et Biophysica Acta (BBA)–Reviews on Cancer, 1868(2), 412–419. DOI 10.1016/j.bbcan.2017.08.004. [Google Scholar] [CrossRef]
18. Liu, G. M., Xie, W. X., Zhang, C. Y., Xu, J. W. (2020). Identification of a four-gene metabolic signature predicting overall survival for hepatocellular carcinoma. Journal of Cellular Physiology, 235(2), 1624–1636. DOI 10.1002/jcp.29081. [Google Scholar] [CrossRef]
19. Luo, T., Li, Y., Nie, R., Liang, C., Liu, Z. et al. (2020). Development and validation of metabolism-related gene signature in prognostic prediction of gastric cancer. Computational and Structural Biotechnology Journal, 18, 3217–3229. DOI 10.1016/j.csbj.2020.09.037. [Google Scholar] [CrossRef]
20. He, L., Chen, J., Xu, F., Li, J., Li, J. (2020). Prognostic implication of a metabolism-associated gene signature in lung adenocarcinoma. Molecular Therapy Oncolytics, 19, 265–277. DOI 10.1016/j.omto.2020.09.011. [Google Scholar] [CrossRef]
21. Liu, Y. Q., Chai, R. C., Wang, Y. Z., Wang, Z., Liu, X. et al. (2019). Amino acid metabolism-related gene expression-based risk signature can better predict overall survival for glioma. Cancer Science, 110(1), 321–333. DOI 10.1111/cas.13878. [Google Scholar] [CrossRef]
22. Yu, S., Wang, X., Zhu, L., Xie, P., Zhou, Y. et al. (2021). A systematic analysis of a potential metabolism-related prognostic signature for breast cancer patients. Annals of Translational Medicine, 9(4). DOI 10.21037/atm-20-7600. [Google Scholar] [CrossRef]
23. Sun, X., Zhou, Z. R., Fang, Y., Ding, S. N., Lu, S. S. et al. (2021). A novel metabolic gene signature-based nomogram to predict overall survival in breast cancer. Annals of Translational Medicine, 9(5). DOI 10.21037/atm-20-4813. [Google Scholar] [CrossRef]
24. Love, M. I., Huber, W., Anders, S. (2014). Moderated estimation of fold change and dispersion for RNA-seq data with DESeq2. Genome Biology, 15(12), 550. DOI 10.1186/s13059-014-0550-8. [Google Scholar] [CrossRef]
25. Noronha, A., Modamio, J., Jarosz, Y., Guerard, E., Sompairac, N. et al. (2019). The virtual metabolic human database: Integrating human and gut microbiome metabolism with nutrition and disease. Nucleic Acids Research, 47(D1), D614–D624. DOI 10.1093/nar/gky992. [Google Scholar] [CrossRef]
26. Tibshirani, R. (1997). The lasso method for variable selection in the cox model. Statistics in Medicine, 16(4), 385–395. DOI 10.1002/(Sici)1097-0258(19970228)16:4. [Google Scholar] [CrossRef]
27. Geeleher, P., Cox, N. J., Huang, R. S. (2014). Clinical drug response can be predicted using baseline gene expression levels and in vitro drug sensitivity in cell lines. Genome Biology, 15(3), R47. DOI 10.1186/gb-2014-15-3-r47. [Google Scholar] [CrossRef]
28. Subramanian, A., Tamayo, P., Mootha, V. K., Mukherjee, S., Ebert, B. L. et al. (2005). Gene set enrichment analysis: A knowledge-based approach for interpreting genome-wide expression profiles. PNAS, 102(43), 15545–15550. DOI 10.1073/pnas.0506580102. [Google Scholar] [CrossRef]
29. Foroutan, M., Bhuva, D. D., Lyu, R., Horan, K., Cursons, J. et al. (2018). Single sample scoring of molecular phenotypes. BMC Bioinformatics, 19. DOI 10.1186/s12859-018-2435-4. [Google Scholar] [CrossRef]
30. Tang, Z. F., Li, C. W., Kang, B. X., Gao, G., Li, C. et al. (2017). GEPIA: A web server for cancer and normal gene expression profiling and interactive analyses. Nucleic Acids Research, 45(W1), W98–W102. DOI 10.1093/nar/gkx247. [Google Scholar] [CrossRef]
31. Gøtzsche, P. C., Jørgensen, K. J. (2013). Screening for breast cancer with mammography. Cochrane Database of Systematic Reviews, 2013(6), Cd001877. DOI 10.1002/14651858.CD001877.pub5. [Google Scholar] [CrossRef]
32. Løberg, M., Lousdal, M. L., Bretthauer, M., Kalager, M. (2015). Benefits and harms of mammography screening. Breast Cancer Research, 17(1), 63. DOI 10.1186/s13058-015-0525-z. [Google Scholar] [CrossRef]
33. Ma, C. X., Bose, R., Ellis, M. J. (2016). Prognostic and predictive biomarkers of endocrine responsiveness for estrogen receptor positive breast cancer. Advances in Experimental Medicine and Biology, 882, 125–154. DOI 10.1007/978-3-319-22909-6_5. [Google Scholar] [CrossRef]
34. Siegel, R. L., Miller, K. D., Jemal, A. (2020). Cancer statistics, 2020. CA: A Cancer Journal for Clinicians, 70(1), 7–30. DOI 10.3322/caac.21590. [Google Scholar] [CrossRef]
35. Kang, S. Y., Kim, Y. S., Kim, Z., Kim, H. Y., Kim, H. J. et al. (2020). Breast cancer statistics in Korea in 2017: Data from a breast cancer registry. Journal of Breast Cancer, 23(2), 115–128. DOI 10.4048/jbc.2020.23.e24. [Google Scholar] [CrossRef]
36. Liu, L., Zhang, X., Ding, H., Liu, X., Cao, D. et al. (2021). Arginine and lysine methylation of MRPS23 promotes breast cancer metastasis through regulating OXPHOS. Oncogene, 40(20), 3548–3563. DOI 10.1038/s41388-021-01785-7. [Google Scholar] [CrossRef]
37. Evans, K. W., Yuca, E., Scott, S. S., Zhao, M., Paez Arango, N. et al. (2021). Oxidative phosphorylation is a metabolic vulnerability in chemotherapy-resistant triple-negative breast cancer. Cancer Research, 81(21), 5572–5581. DOI 10.1158/0008-5472.Can-20-3242. [Google Scholar] [CrossRef]
38. Becherini, P., Caffa, I., Piacente, F., Damonte, P., Vellone, V. G. et al. (2021). SIRT6 enhances oxidative phosphorylation in breast cancer and promotes mammary tumorigenesis in mice. Cancer & Metabolism, 9(1), 6. DOI 10.1186/s40170-021-00240-1. [Google Scholar] [CrossRef]
39. Ma, L., Zong, X. (2020). Metabolic symbiosis in chemoresistance: Refocusing the role of aerobic glycolysis. Frontiers in Oncology, 10, 5. DOI 10.3389/fonc.2020.00005. [Google Scholar] [CrossRef]
40. Chong, K. H., Chang, Y. J., Hsu, W. H., Tu, Y. T., Chen, Y. R. et al. (2022). Breast cancer with increased drug resistance, invasion ability, and cancer stem cell properties through metabolism reprogramming. International Journal of Molecular Sciences, 23(21). DOI 10.3390/ijms232112875. [Google Scholar] [CrossRef]
41. Min, H. Y., Lee, H. J., Suh, Y. A., Pei, H., Kwon, H. et al. (2022). Targeting epidermal growth factor receptor in paclitaxel-resistant human breast and lung cancer cells with upregulated glucose-6-phosphate dehydrogenase. British Journal of Cancer, 127(4), 661–674. DOI 10.1038/s41416-022-01843-1. [Google Scholar] [CrossRef]
42. Luo, M., Fu, A., Wu, R., Wei, N., Song, K. et al. (2022). High expression of G6PD increases doxorubicin resistance in triple negative breast cancer cells by maintaining GSH level. International Journal of Biological Sciences, 18(3), 1120–1133. DOI 10.7150/ijbs.65555. [Google Scholar] [CrossRef]
43. Ercetin, E., Richtmann, S., Delgado, B. M., Gomez-Mariano, G., Wrenger, S. et al. (2019). Clinical significance of SERPINA1 Gene and Its encoded Alpha1-antitrypsin protein in NSCLC. Cancers, 11(9), 1306. DOI 10.3390/cancers11091306. [Google Scholar] [CrossRef]
44. Jiang, L., Hu, L. G. (2020). Serpin peptidase inhibitor clade a member 1-overexpression in gastric cancer promotes tumor progression in vitro and is associated with poor prognosis. Oncology Letters, 20(6), 278. DOI 10.3892/ol.2020.12141. [Google Scholar] [CrossRef]
45. Xu, Y. H., Deng, J. L., Wang, L. P., Zhang, H. B., Tang, L. et al. (2020). Identification of candidate genes associated with breast cancer prognosis. DNA and Cell Biology, 39(7), 1205–1227. DOI 10.1089/dna.2020.5482. [Google Scholar] [CrossRef]
46. Li, Y., Jiao, Y., Luo, Z., Li, Y., Liu, Y. (2019). High peroxidasin-like expression is a potential and independent prognostic biomarker in breast cancer. Medicine, 98(44), e17703. DOI 10.1097/md.0000000000017703. [Google Scholar] [CrossRef]
Supplementary Figures
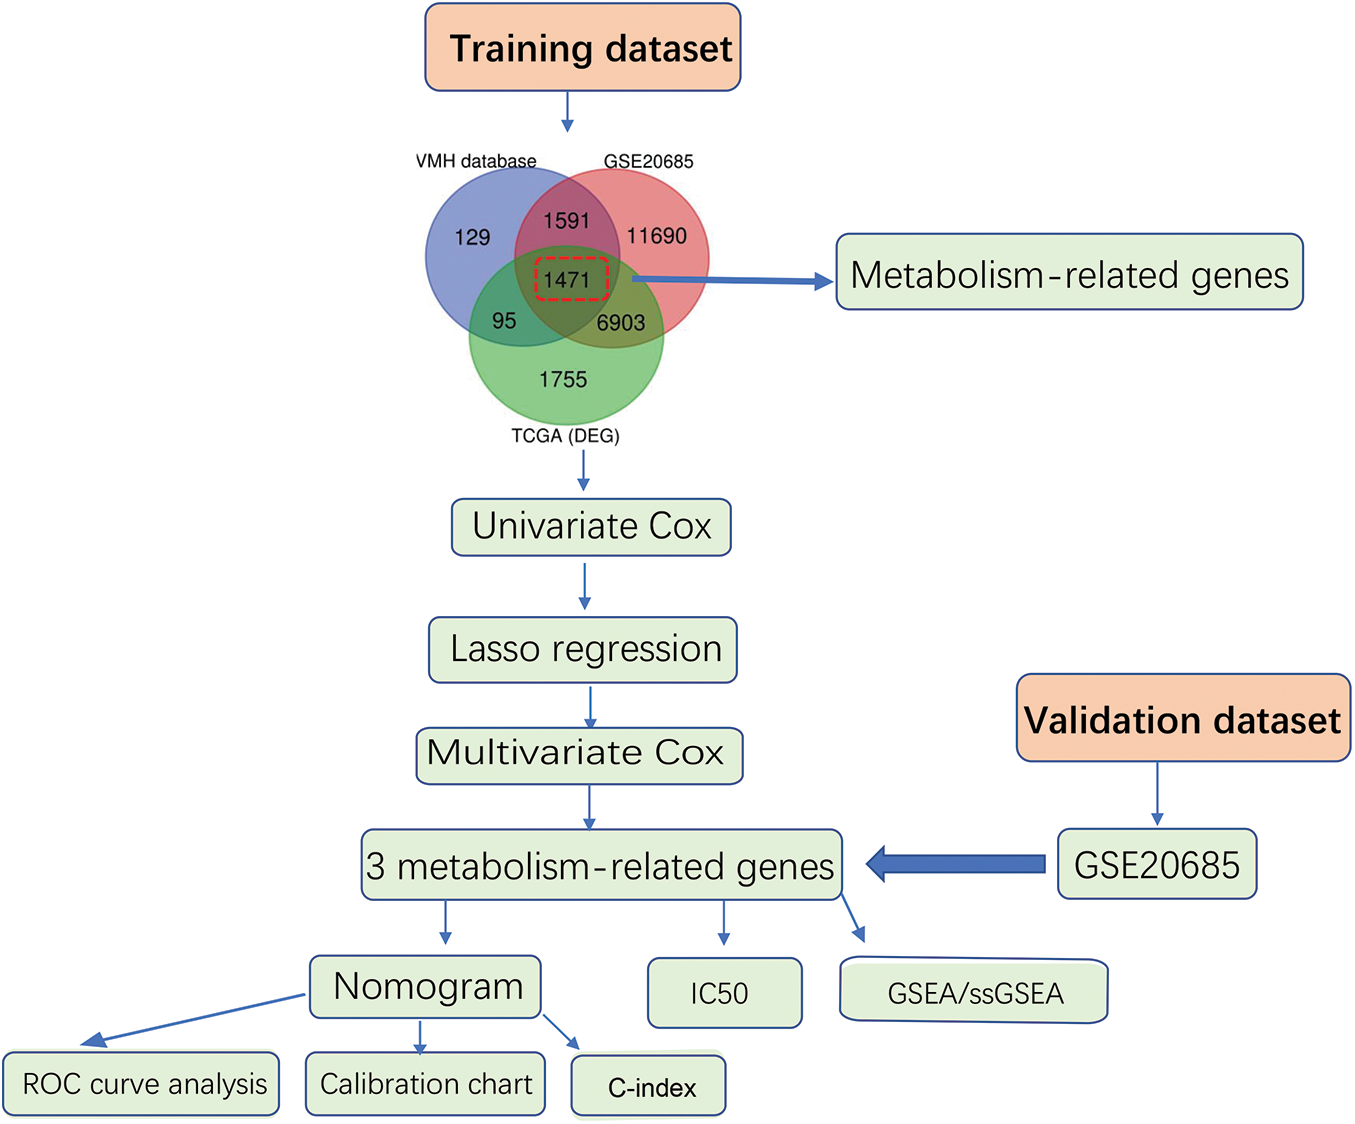
Figure S1: Flow diagram for the construction of the metabolism-related genes-based prognostic model

Figure S2: Identification of differentially expressed genes (DEGs). (A) Identification of DEGs between cancer and normal tissues in TCGA-BRCA dataset. A volcano plot was applied to display the distribution of differentially expressed genes, the red dots represent up-regulated genes, and the blue dots represent down-regulated genes (adj. p < 0.05 and |log2 FC| > 0.5). (B) Venn diagram was applied to display the overlap of differentially expressed metabolism-related genes between different datasets

Figure S3: Stratified survival analysis between the high- and low-risk groups. (A–D) Kaplan-Meier analysis between groups at high- and low-risk for various breast cancer subtypes, including subtype Luminal A (A), Luminal B (B), Her2 overexpression (C) and Basal (D)

Figure S4: Relationship between the risk_score value and clinical characteristics. ROC curves showed the predictive efficiency of the Risk_Score value, Pathologic_T, Pathologic_N, Pathologic_M, age and combine on the 1 (A), 3 (B), 5 (C) year

Figure S5: Verification of metabolism-related genes-based nomogram. (A) Validation of metabolism-related genes-based nomogram in GSE20685 dataset. (B) The calibration plots, (C) The ROC curves and (D) the decision curves were used to evaluate the performance of the 3-gene signature in predicting OS in the validation cohort
Cite This Article
 Copyright © 2022 The Author(s). Published by Tech Science Press.
This work is licensed under a Creative Commons Attribution 4.0 International License , which permits unrestricted use, distribution, and reproduction in any medium, provided the original work is properly cited.
 Downloads
 Citation Tools