
 Submit a Paper
 Propose a Special lssue
 Open Access
ARTICLE

Expression and Clinical Significance of ACTA2 in Osteosarcoma Tissue
1 Department of Oncology, The First Affiliated Hospital of Soochow University, Suzhou, China
2 Department of Oncology, Shanghai Sixth People’s Hospital, Shanghai Jiao Tong University, Shanghai, China
* Corresponding Author: Zhenxin Wang. Email:
Oncologie 2022, 24(4), 913-925. https://doi.org/10.32604/oncologie.2022.026296
Received 28 August 2022; Accepted 17 November 2022; Issue published 31 December 2022
 View Full Text
 Download PDF
Abstract
Objective: To investigate the expression of alpha–smooth muscle actin (ACTA2) in osteosarcoma tissues and its relationship with prognosis. Methods: Prognostic analysis of lung metastasis–related genes in osteosarcoma using the TCGA database. Single-cell sequencing detected the expression of ACTA2 in 11 osteosarcoma tissues. Paraf- fin-embedded tissues of 74 osteosarcoma patients treated at the Sixth People’s Hospital of Shanghai Jiao Tong University from 2014 to 2019 were collected, and tissue microarrays were prepared. ACTA2 expression was detected and scored by immunohistochemistry. According to the median value of the ACTA2 histochemical score, 74 patients were divided into two groups, the high-expression group and low-expression group, and the relationship of expression with clinicopathological characteristics and prognosis was analyzed by Cox regression. Results: Through analysis of ACTA2 expression by single-cell sequencing of osteosarcoma samples together with an immuno-microarray, we found moderate ACTA2 expression. Upon analyzing the prognostic impact of ACTA2, CCL2, TGFBI, VEGFA, PDGFB, PDGFC, COL1A1, COL14A1, CXCL12, CXCL14, CSPP1, LUM, DES, MYL9, and SFRP2 on osteosarcoma patients using the TCGA database, we found that patients with high ACTA2 expression had a significantly better prognosis than those with low ACTA2 expression. Patients with high expression of ACTA2 in osteosarcoma lung metastases showed longer progression-free survival and overall survival than those with low expression. Conclusion: High expression of ACTA2 in patients with osteosarcoma lung metastasis suggests a better prognosis.Keywords
Osteosarcoma is the most common primary malignant bone tumor. It occurs mostly during the growth spurt of adolescence and is most often seen in areas of rapid skeletal growth, such as the epiphyseal regions of long bones [1,2]. In the last 50 years, with the standardized treatment of high-dose chemotherapy combined with surgery, the limb preservation rate and five-year survival rate of patients with osteosarcoma have significantly improved from those in the earlier years after surgery alone. However, the five-year survival rate of patients with metastatic osteosarcoma remains low [2,3]. Approximately 80% to 90% of patients have combined pulmonary metastases or micro-metastases at first presentation [4–8]. The tumor microenvironment is closely related to tumor metastasis [9]. The mechanism of pulmonary metastasis in patients with osteosarcoma is currently unknown; therefore, exploring and discovering genes that may be associated with pulmonary metastasis of osteosarcoma have profound clinical implications.
At the beginning of our study, analysis of the TCGA database for genes related to osteosarcoma lung metastasis, we found that patients with osteosarcoma with high ACTA2 expression had a better prognosis, which caught our attention.
2.1 The Atlas of the Human Genome (TCGA) Osteosarcoma Database Data
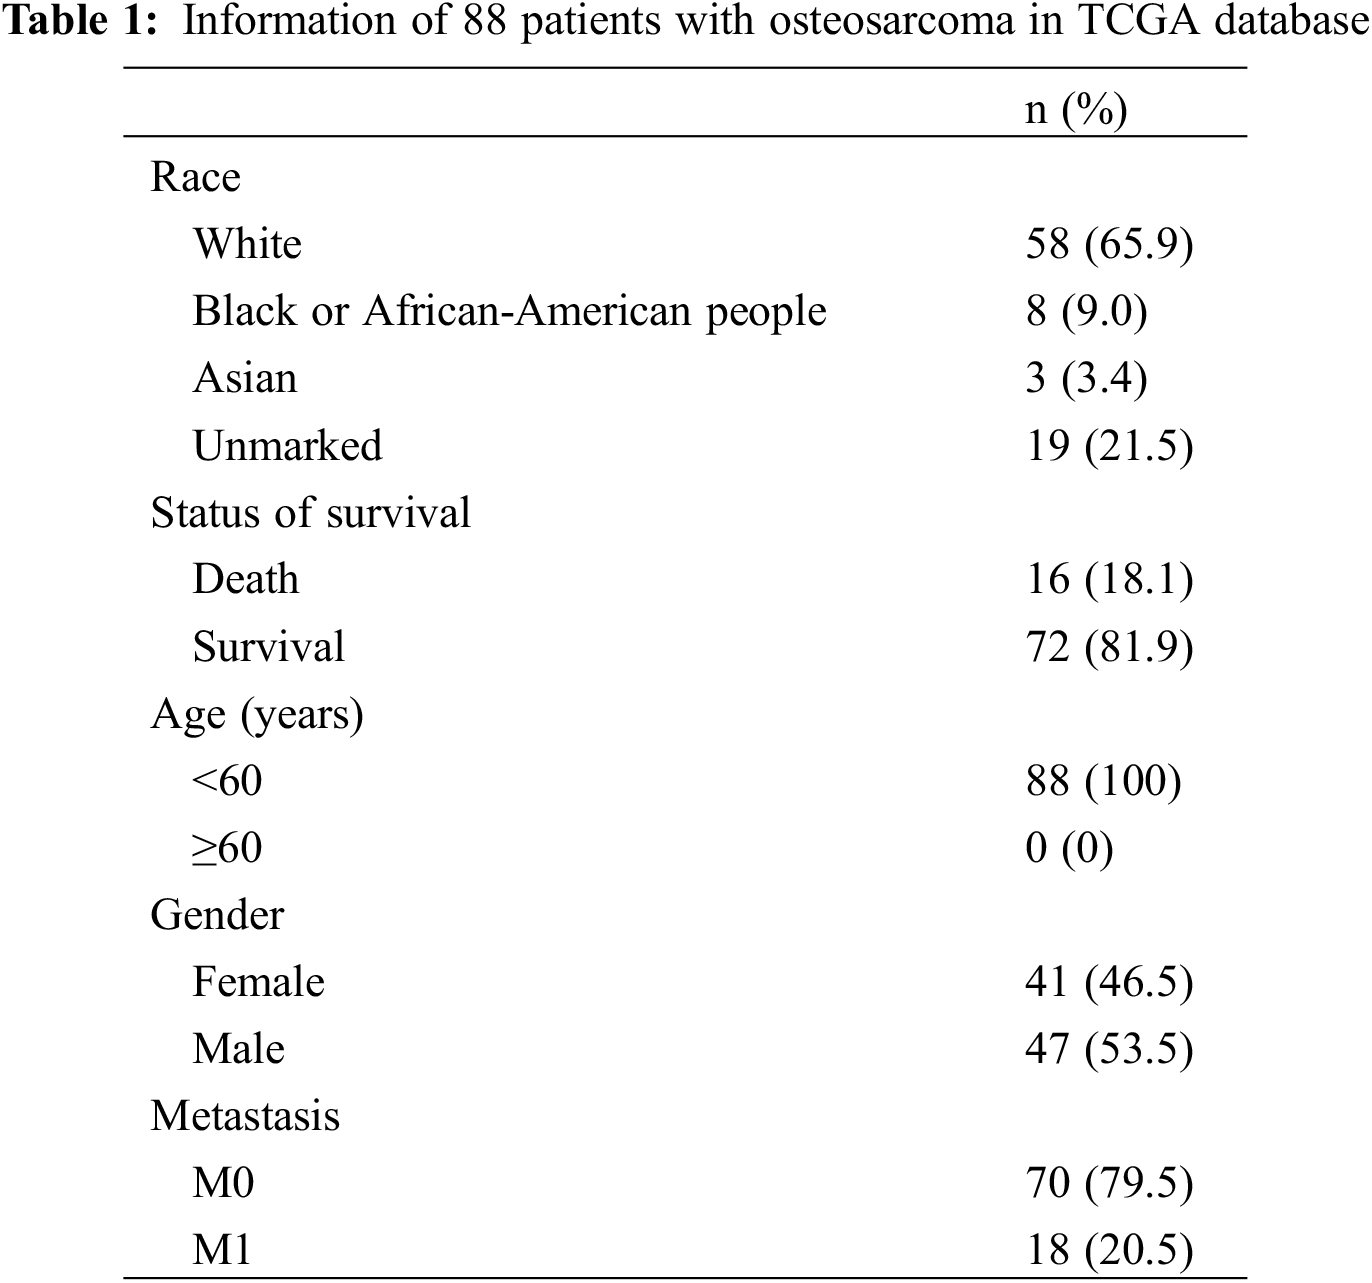
In a previous study in our center, we found that ACTA2, CCL2, TGFBI, VEGFA, PDGFB, PDGFC, COL1A1, COL14A1, CXCL12, CXCL14, CSPP1, LUM, DES, MYL9, and SFRP2 were differentially expressed in osteosarcoma samples from different patients. We decided to perform a prognostic analysis of these factors in osteosarcoma. Therefore, we accessed The Atlas of the Human Genome (TCGA) homepage (https://portal.gdc.cancer.gov/) and downloaded RNA-sequencing data and clinical prognostic information from the osteosarcoma database for 88 patients with primary osteosarcoma. After obtaining the data, the data were normalized to sample expression profile matrix by Perl to obtain samples containing complete expression data, and a total of 88 cases were included for prognostic analysis. From these, cases with data on gene expression, survival status, gender, age, tumor metastasis, and survival time ≥30 days were screened, and finally 88 patients with complete clinical data were included for the study of prognostic genes and clinicopathological factors (Table 1).
2.2 Analysis of Overall Prognostic Information of 88 Patients with Osteosarcoma in TCGA Database
Prognostic information of 88 patients with primary osteosarcoma was obtained from the TCGA osteosarcoma database. After testing the completeness of the genetic profile, we performed a multifactorial prognostic analysis on the 88 samples. First, we took the median values for the expression of transcriptomic ACTA2, CCL2, TGFBI, VEGFA, PDGFB, PDGFC, COL1A1, COL14A1, CXCL12, CXCL14, CSPP1, LUM, DES, MYL9, and SFRP2 genes. Values higher than the median value were classified as the high-expression group, and those lower than the median value were considered the low-expression group. Afterwards, we integrated the high- and low-expression groups of these genes with the clinical prognostic information of the patients, and used the “survival” package of R software to plot the overall survival curves and calculate the survival rates for the high- and low-expression groups of osteosarcoma patients. Receiver operating characteristic (ROC) curves were plotted using the “survival ROC” package in R software, and the area under the curve (AUC) was calculated to assess the efficacy of the prognostic gene model.
2.3 Analysis of the Predictive Value of Each Gene Expression in the TCGA Database for Patient Prognosis
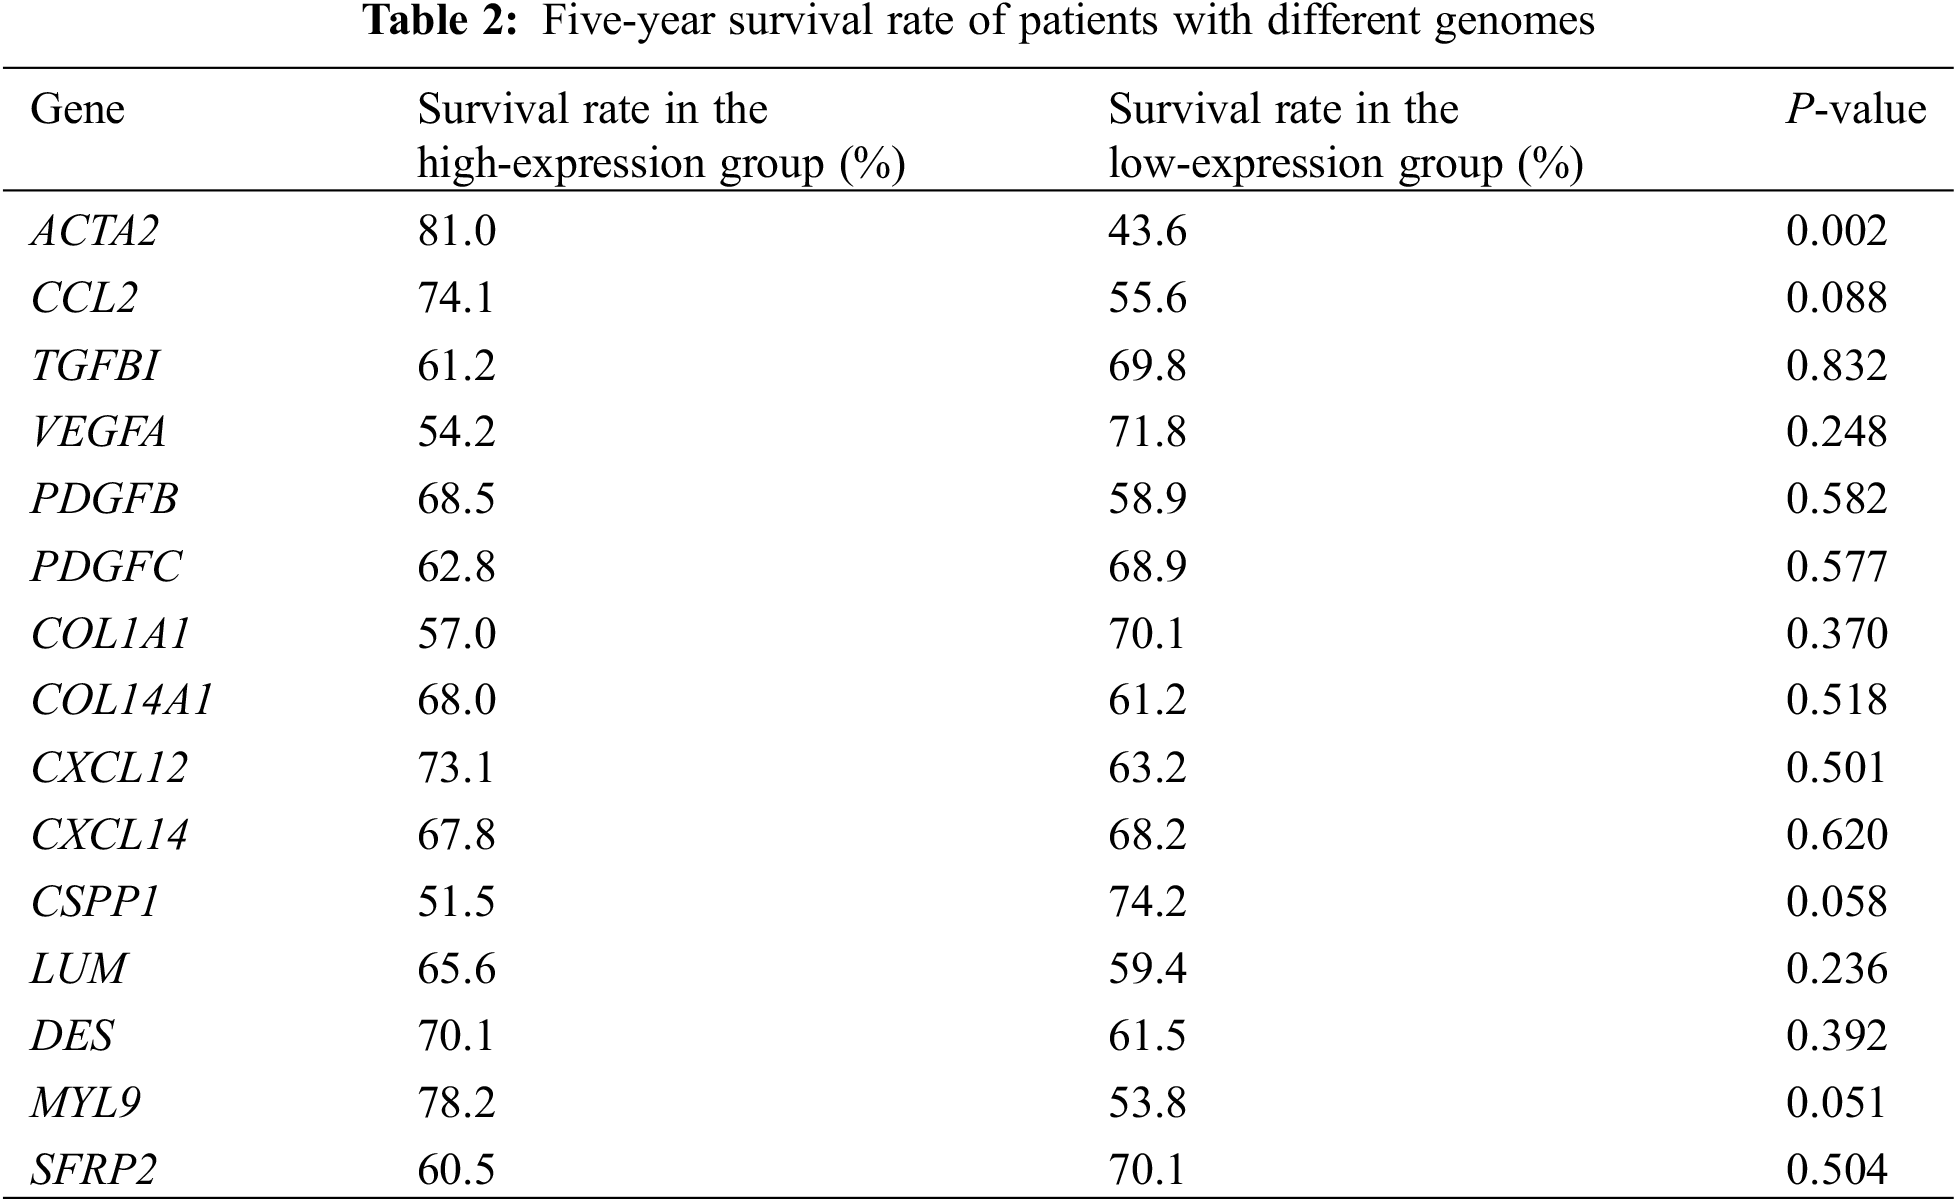
The survival status and survival time were extracted from the clinical data of osteosarcoma using Perl script, and combined with the gene corrected expression. The survival curve of each gene was plotted using the survival package in R software. The five-year survival rate was calculated for patients with high and low expression of each gene.
The fresh surgical tissues of 87 osteosarcoma patients treated at the Department of Oncology of Shanghai Sixth People’s Hospital from August 2014 to January 2019 were collected. Due to the loss during tissue preparation and the loss to follow-up, 13 cases were not included in the analysis, so the follow-up and data analysis were completed for 74 patients. Tissue microarrays were prepared from paraffin-embedded tissue of primary osteosarcoma: tissue chip 1 and tissue chip 2. This study was a retrospective analysis. It was approved by the hospital ethics committee, and all of the patients signed the informed consent form.
This was a retrospective study, the inclusion criteria of which were as follows: 1. patients aged 5–70 years; 2. were either male or female; 3. had osteosarcoma confirmed by pathological analysis; 4. had an expected survival time of more than 6 months; and 5. received standardized treatment for osteosarcoma. The exclusion criteria were: 1. patient could not be confirmed by pathological analysis; 2. patient failed to complete at least one survival follow-up or missed follow-up; 3. patient refused to receive standardized antineoplastic therapy; 4. patient had a history of other malignant tumors; and 5. patients had severe a chronic or immunodeficiency disease.
All 74 patients received pathological confirmation of the diagnosis of osteosarcoma. The patients included 37 males and 37 females, aged 6 to 65 years, with a mean age of 27.5 years. 65 cases were of common pathological type, while nine cases were of uncommon pathological type. There were 44 cases in the femur, 15 cases in the tibia, nine cases in the humerus, two cases in the fibula, and four cases in other skeletal sites. The necrosis rate after neoadjuvant chemotherapy was greater than 90% in 12 cases and lower than 90% in 44 cases, and no necrosis rate results were obtained in 18 cases.
Individual cells were encapsulated into emulsion droplets using a Chromium Controller (10 × Genomics). scRNA-seq libraries were constructed using a Chromium Single Cell 3′Library Kit and a Gel Bead & Multiplex Kit (10 × Genomics, V2 and V3) in accordance with the instructions. The cells were divided into Gel Beads in Emulsion in a ChromiumTM controller, lysed, and reverse-transcribed for RNA barcoding. Sequencing libraries were constructed using cDNA amplified by a Nextera XT DNA sample Pre-Kit (hc-131-1024, Illumina, Shanghai, China), and the final libraries of individual samples were evaluated on an Agilent Bioanalyzer using a high-sensitivity DNA kit (Agilent Technologies, Shanghai, China). The libraries from 75 kit runs were sequenced on an Illumina HiSeq X platform (Illumina, Shanghai, China) in 150 bp paired-end read mode. Seurat objects with gene expression data from individual samples were processed using the Read (10 × Genomics) function. For each sample, gene expression was calculated by determining the percentage of the expression of that gene multiplied by 10,000 and converting the value to the natural logarithm; 1 was added and the value was normalized to avoid taking the logarithm of 0. The top 3,000 highly variable genes (HVG) were filtered from the normalized expression matrix, centered, and scaled for principal component analysis (PCA). Based on the top 50 PCA components, the Harmony package for R (version 1.0) eliminated the batch effect.
2.6 Immunohistochemical Staining Determination Score
Immunohistochemistry (IHC) was performed by the Strept Avidin-Biotin Complex (SABC) method for staining, and the steps were performed in accordance with the kit instructions. The mouse monoclonal antibody ACTA2 (ab7817, Abcam Company, Cambridgeshire, UK) was used at a concentration of 0.034 μg/mL. Heat-mediated antigen retrieval was performed with citrate buffer (pH 6) before starting IHC staining. Positive IHC results were scored as follows: the mean positive intensity of the measured areas was scored as 0, 1, 2, or 3, where negative staining was scored as 0; weakly positive pale-yellow staining was recorded as 1; moderately positive tan staining was recorded as 2’ and strongly positive tan staining was recorded as 3. The cell positivity ratio was scored as follows: 0% to 5% was scored as 0; 6% to 25% was scored as 1; 26% to 50% was scored as 2; 51% to 75% was scored as 3; and >75% was scored as 4. The composite score of positivity was determined as the staining intensity value × positive cell ratio score; a larger value indicated a stronger composite positive intensity.
2.7 Immunofluorescence Staining
After paraffin sections of patients with osteosarcoma had been dewaxed and hydrated, they were repaired with mouse monoclonal antibody ACTA2 (ab7817, Abcam Company, Cambridgeshire, UK) as the primary antibody and incubated at room temperature. After incubation with secondary antibodies, the slices were blocked by re-staining. After each round of staining, a 3D Histech Pannoramic MIDI digital section scanner (3DHISTECH, Budapest, Hungary) was used for fluorescence scanning.
The pseudo-color of the antibody marker was set before scanning, and here we labeled ACTA2 with cy3-labeled goat anti-mouse IgG secondary antibody (A0521, Beyotime Company, Shanghai, China). The CaseViewer image software was used to align and overlay the fluorescence images of each round to achieve the final multiplexed immunofluorescence staining.
Follow-up was conducted until progression or death by outpatient visits and telephone, with a final follow-up date of January 2022. Disease-free survival was defined as survival from the time of surgery until metastasis or recurrence at lung, bone, and other sites as evidenced by imaging. By January 2022, a total of 51 of 74 patients survived, and 23 died. Analysis of the course of the disease showed 30 patients with definite pulmonary metastases, 20 patients with local recurrence, 10 patients with bone metastases, and five patients with metastases to other sites. By the follow-up cutoff, the shortest survival period was 12 months, and the longest survival period was 60 months.
SPSS 20.0 software was used for data analysis. The measurement data are expressed as the mean ± standard deviation, and the median ACTA2 immunohistochemistry (IHC) score was used to divide the defined high- and low-expression groups. The patients’ sex, age, tumor size, pathological type, tumor site, tumor necrosis rate, lung metastasis, recurrence, bone metastasis, and metastasis at other sites were used as covariates, and multifactor ANOVA was used. The Kaplan–Meier method was used to calculate the survival rate, and analysis of variance was performed by the log-rank test. The test level was α = 0.05.
4.1 To Analyze the Relationship between Gene Expression in TCGA Database and Prognosis of Patients with Osteosarcoma
Based on the joint analysis of the TCGA’s osteosarcoma transcriptome database and clinical database, there was no strong correlation of CCL2, TGFBI, VEGFA, PDGFB, PDGFC, COL1A1, COL14A1, CXCL12, CXCL14, CSPP1, LUM, DES, MYL9, and SFRP2 with prognosis in 88 osteosarcoma samples, while the prognosis of patients with high expression of ACTA2 was significantly higher than that of patients with low expression (Fig. 1).
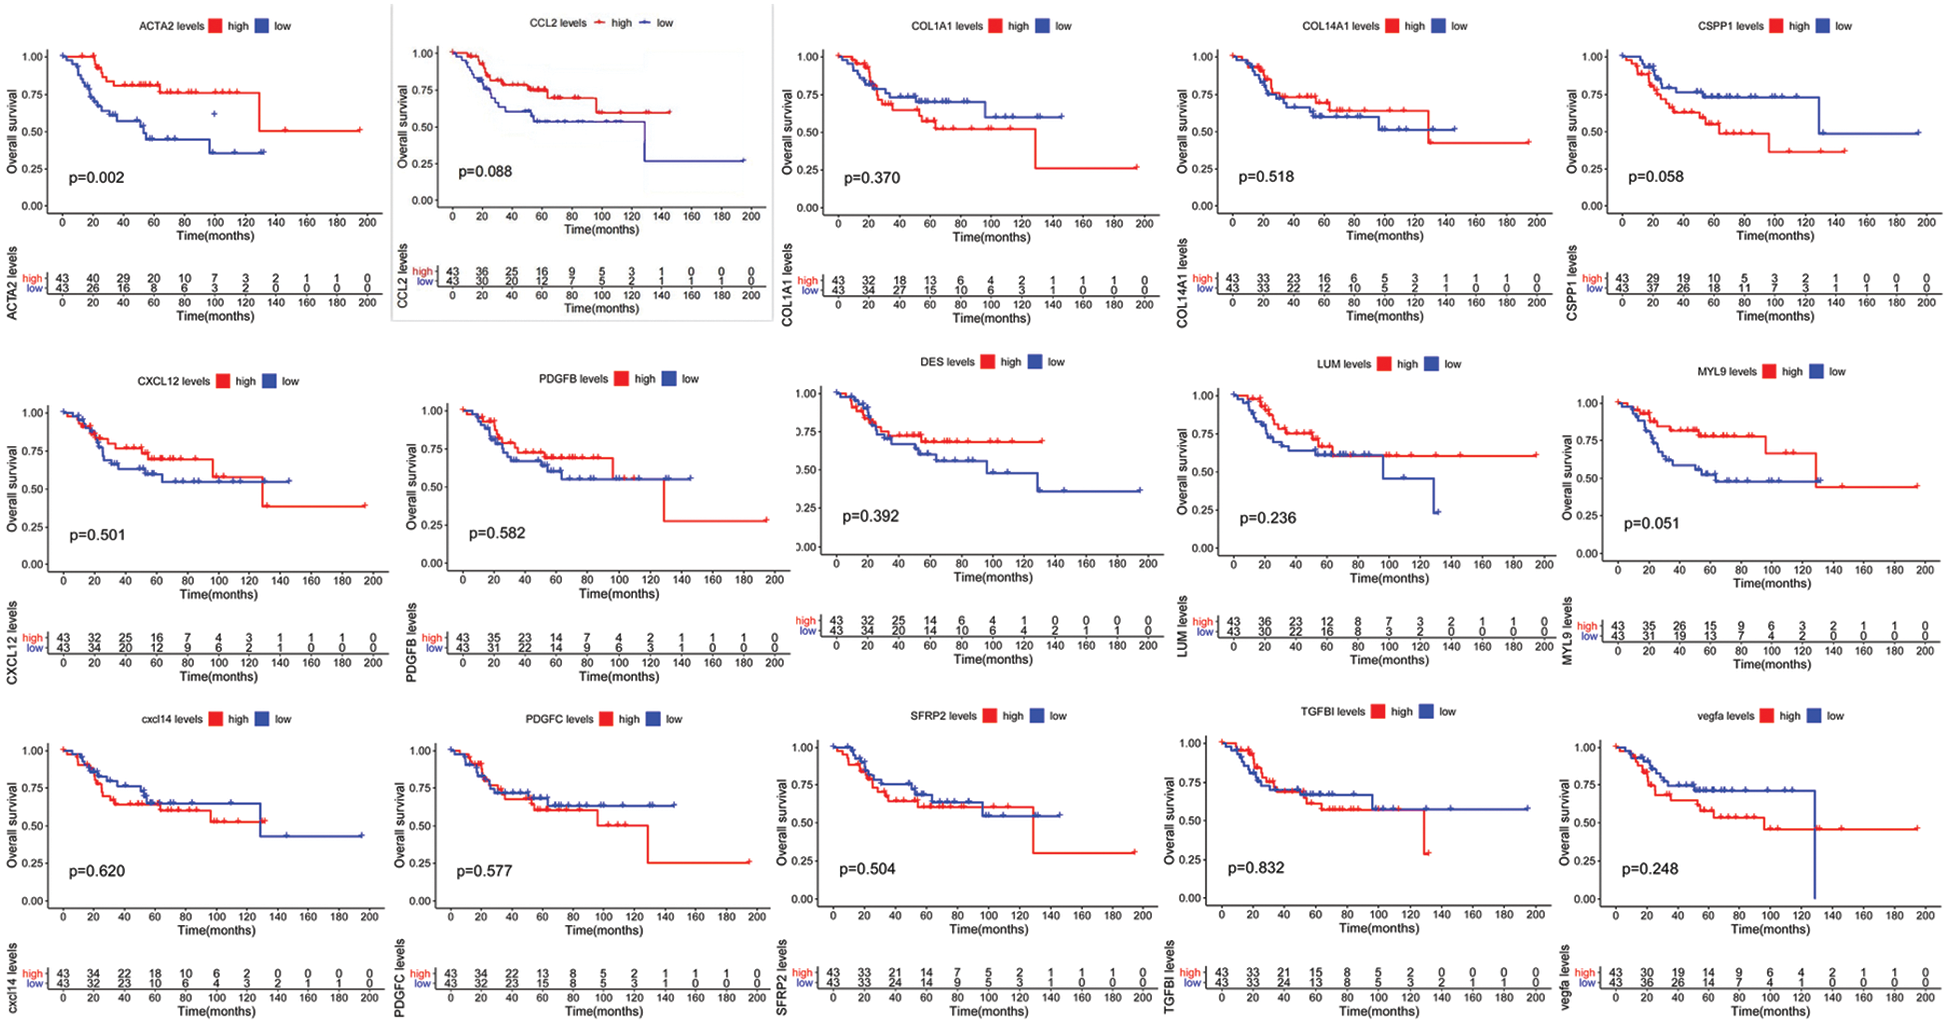
Figure 1: Multivariate prognostic analysis of patients with osteosarcoma. Kaplan–Meier survival curves display the comparison of the overall survival of osteosarcoma patients from TCGA database with high and low expression of 15 genes. P < 0.05 is considered significant
4.2 Predictive Value of Each Gene for Patient’s Survival Status
The five-year survival rates of patients in the CCL2, TGFBI, VEGFA, PDGFB, PDGFC, COL1A1, COL14A1, CXCL12, CXCL14, CSPP1, LUM, DES, MYL9, and SFRP2 high-expression group were not significantly different from those in the low-expression group, while the five-year survival rates of patients in the ACTA2 high-expression group were significantly higher than those in the low-expression group (Table 2).
4.3 Single-Cell Sequencing Analysis of ACTA2 Expression in Osteosarcoma Cells
Based on the Harmony and Louvain algorithm, we identified the main subcluster cell groups in osteosarcoma tissues. Osteoblasts and chondroblasts are the most common pathological subtypes of conventional osteosarcoma. Through t-distributed stochastic neighbor embedding (t-SNE) analysis of malignant osteosarcoma cells, we identified seven subpopulations, including six osteoblast lines and one chondroblastic line. ACTA2 was mainly expressed in the third group of osteosarcoma cells, pericytes, fibroblasts, and mesenchymal stem cells, as reported in our previous study [Nature communications. 2020; 11: 6322] (Fig. 2).
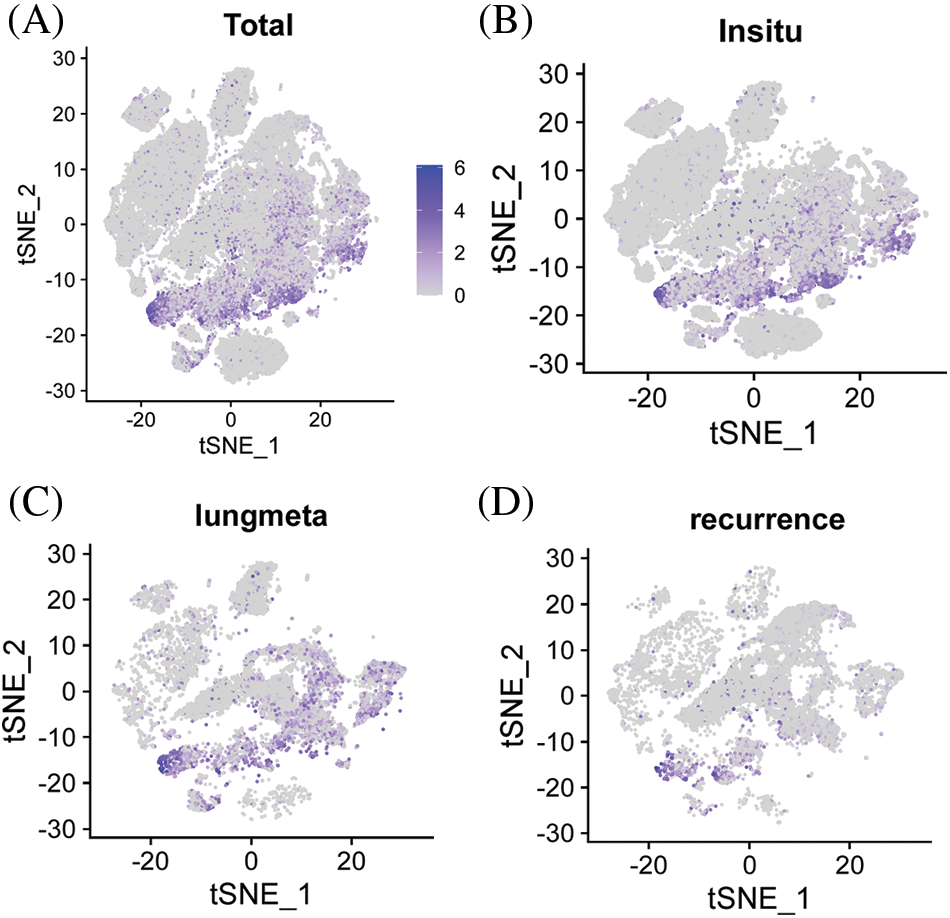
Figure 2: Expression of ACTA2 in osteosarcoma cells from the single-cell sequencing data. Feature plots for ACTA2 expression level in all single cells from osteosarcoma (A), as well as in the stratified tissues from the in situ tumor (B), lung metastasized tumor (C), or recurrence tumor (D) tissues. The color legend shows the log1p-normalized expression levels of ACTA2
4.4 Immunohistochemical Analysis of ACTA2 Expression in Osteosarcoma Cells by Tissue Microarray
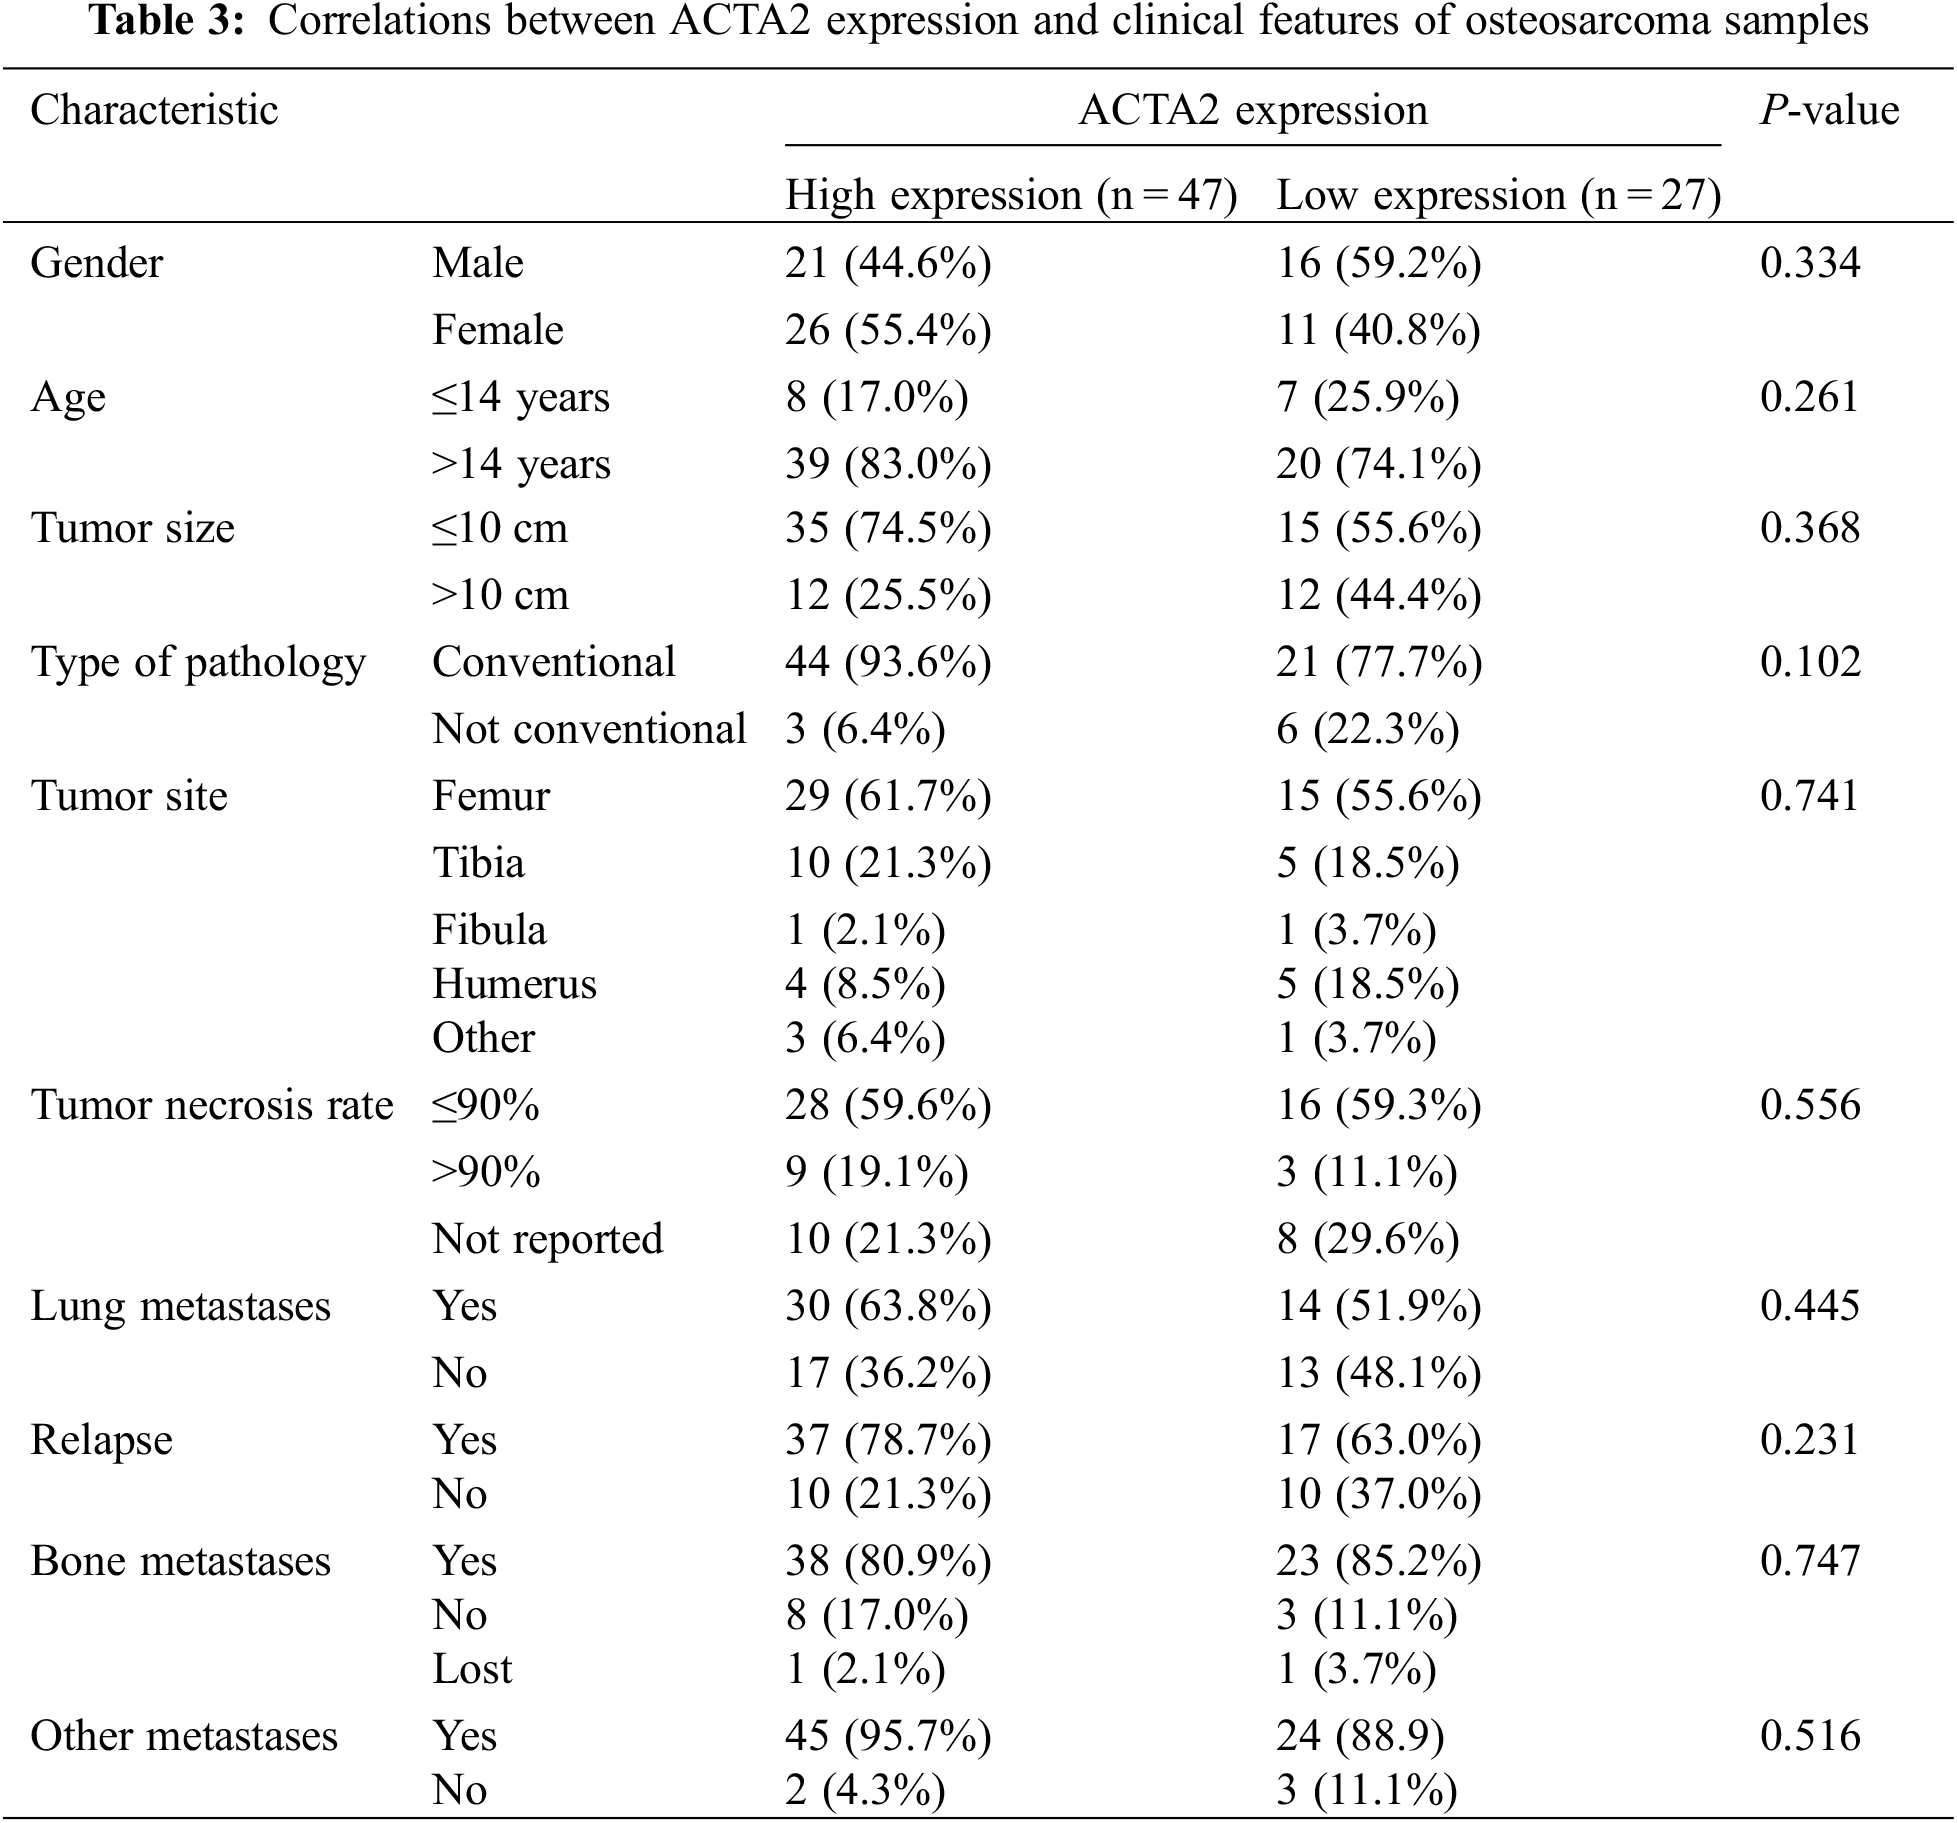
The tissue microarray scores of 74 primary osteosarcoma foci were calculated according to the scoring criteria of immunohistochemical results, and the median values were taken in line with the formula described in the methods. The patients were divided into the high-expression and the low-expression groups (47 vs. 27) (Figs. 3B and 3C). The differences in age, tumor size, pathological type, tumor site, tumor necrosis rate, lung metastasis, recurrence, bone metastasis, and metastasis at other sites were not statistically significant (P > 0.05) (Table 3).
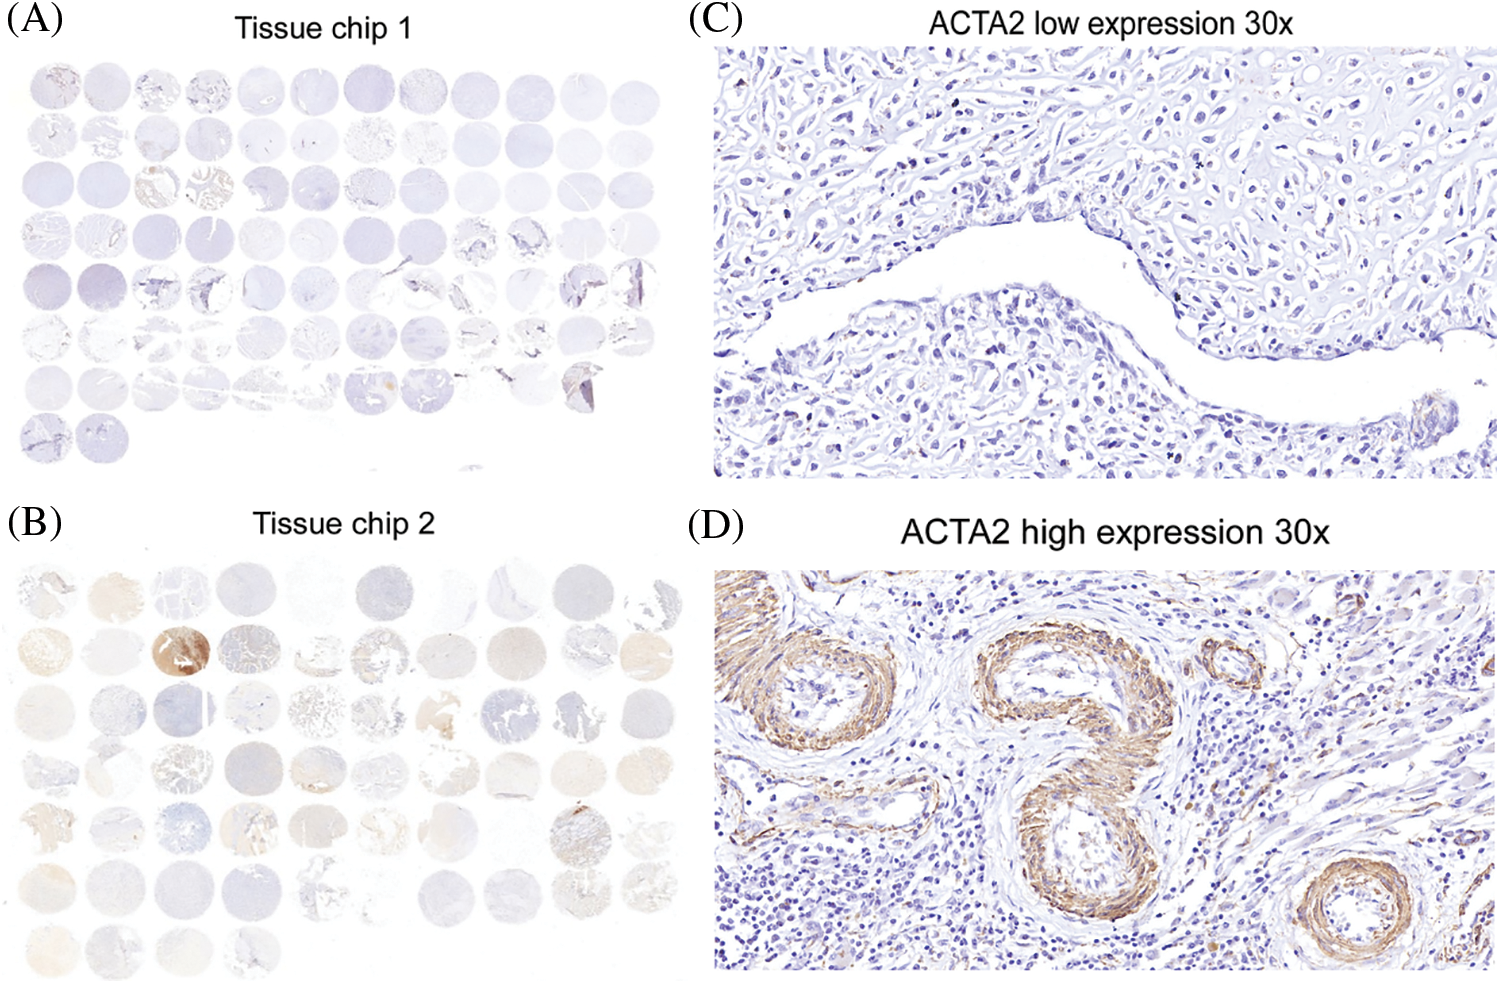
Figure 3: Immunohistochemical analysis of ACTA2 expression in osteosarcoma tissues. The expression of ACTA2 in osteosarcoma tumor tissue microarrays was tested by IHC method. (A) (B) Fresh surgical tissues of 87 patients with osteosarcoma attending the Department of Medical Oncology, Shanghai Sixth People’s Hospital, from August 2014 to January 2019, were collected. A total of 74 patients completed the follow-up and data analysis, while 10 cases had tissue loss and three cases were not included in the analysis due to the loss to follow-up. The two tissue chips were produced in 2018 and 2020, respectively. The two adjacent sites on the first chip were tissues from the same patient. On the second chip, some patient tissues occupied two holes, while some occupied only one hole, so there was a discrepancy in the data. Under 30 × magnifying glass, (C) ACTA2 expression was low and no obvious staining was found. (D) ACTA2 was highly expressed, showing strong positive brown around the vascular wall in the tumor tissue
4.5 Immunofluorescence Staining
With multiple immunofluorescence staining, ACTA2 was labeled with pink fluorescence. The expression of ACTA2 in osteosarcoma tissue was clustered around the vascular wall and distributed in a ring shape. The specific distribution of ACTA2 suggests that there may be more normalized blood vessels in tumor tissue of patients with high expression of ACTA2. Tumor angiogenesis is significantly related to tumor proliferation, metastasis, and drug sensitivity, which may be related to the prognosis of patients (Fig. 4).
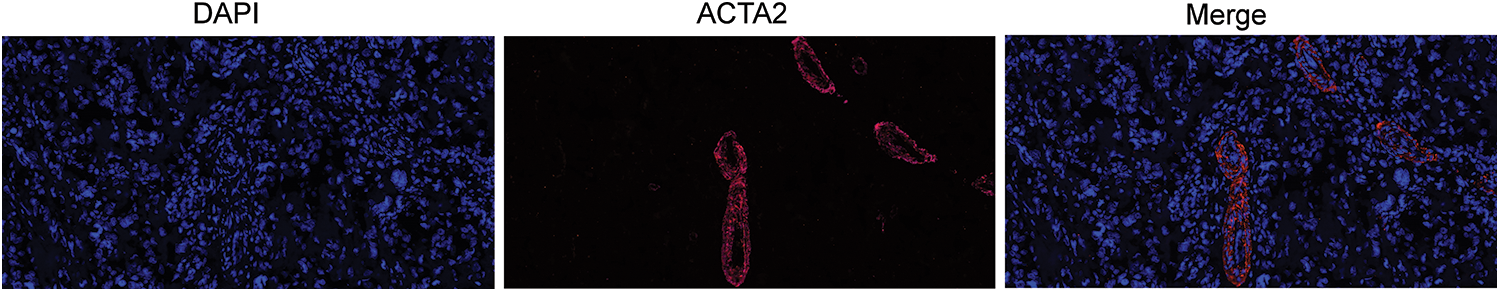
Figure 4: Immunofluorescence of ACTA2 in osteosarcoma specimens. The pictures display ACTA2 expression by multiplex immunofluorescence staining under 20 × objective. The blue picture displays the nuclear staining by DAPI, while ACTA2 is stained with red fluorescence
4.6 Relationship between ACTA2 Expression and Disease-Free Survival in Patients with Osteosarcoma
The follow-up period of this study ranged from 36 to 60 months until January 2022, with 23 patients terminated due to death and the remaining 51 patients alive at the end of the follow-up period. Thirty patients had definite pulmonary metastases; 20 patients had local recurrence; 10 patients had bone metastases; and five patients had metastases other sites during the course of the disease. By the follow-up cutoff, the shortest survival was 12 months, and the longest survival was 60 months. The results of the Kaplan–Meier survival statistical analysis showed that among all 74 patients, the overall survival rate (OS) was significantly higher in the ACTA2 high-expression group than in the low-expression group (P = 0.004, Fig. 5A). The progression-free survival (PFS) of the 74 patients also significantly differed between the two groups, with patients in the ACTA2 high-expression group having a higher PFS than those in the low-expression group (P = 0.007, Fig. 5B). In 30 patients with definite lung metastases, we also found differences in OS and PFS between the high and the low expression of ACTA2; patients in the ACTA2 high-expression group had higher OS and PFS than those in the ACTA2 low-expression group (P = 0.029, P = 0.035, respectively; Figs. 5C and 5D).
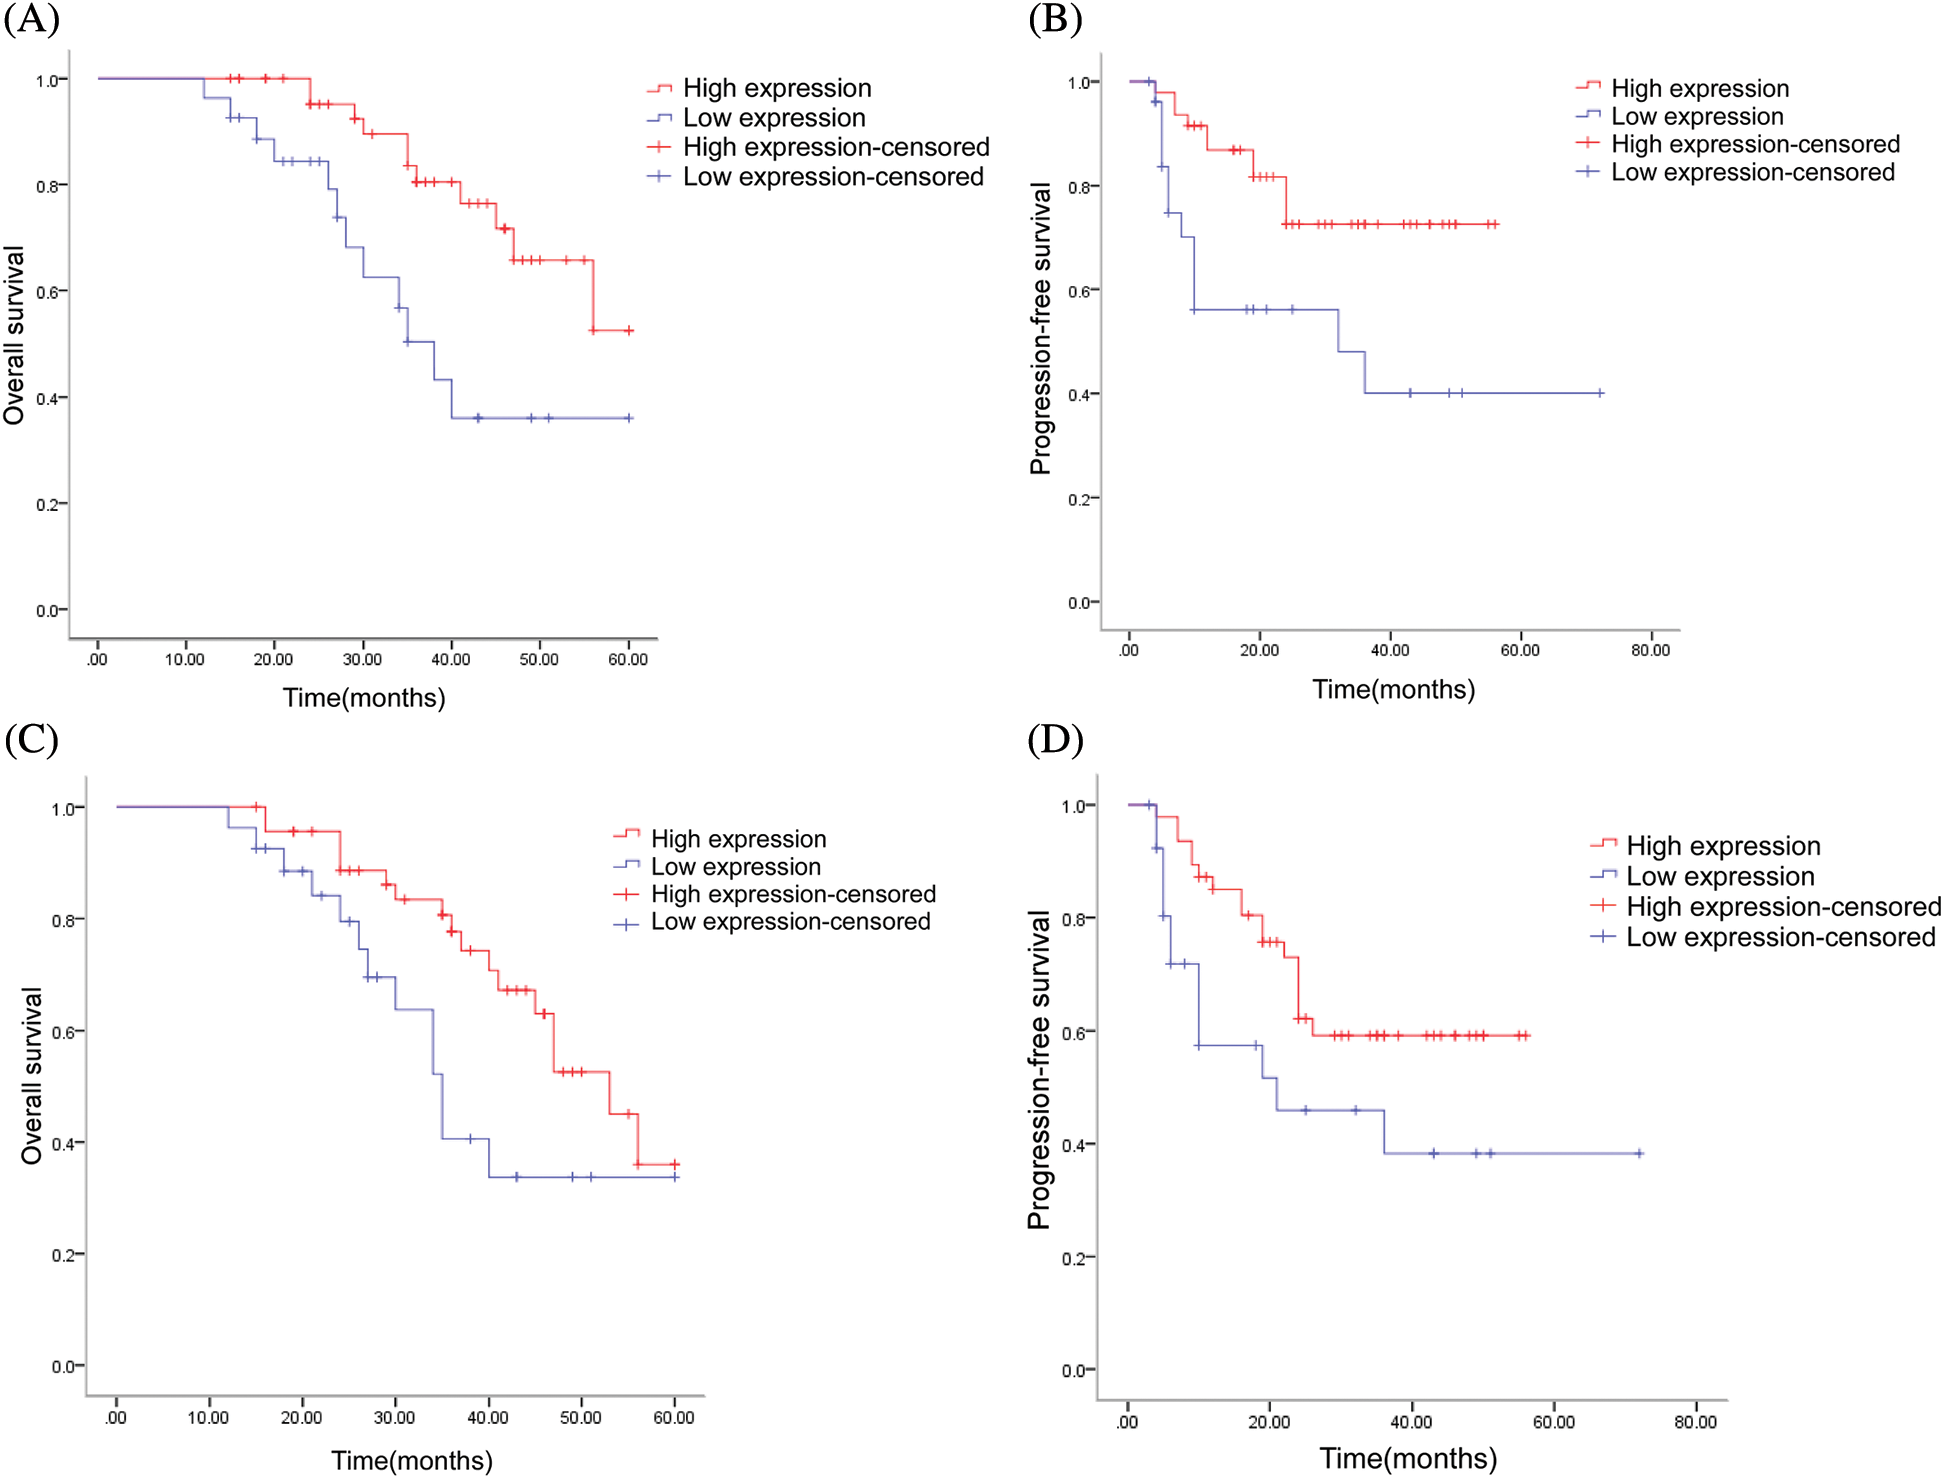
Figure 5: Multivariate prognostic analysis of patients with osteosarcoma in our hospital. (A) Log-rank test of ACTA2 expression and overall survival (OS) in 74 patients (P = 0.004); (B) Log-rank test of ACTA2 expression and progression-free survival (PFS) in 74 patients (P = 0.007); (C) Log-rank test of ACTA2 expression and overall survival (OS) in 30 patients with lung metastases (P = 0.029); (D) Log-rank test of ACTA2 expression and progression-free survival (PFS) in 30 patients with lung metastases (P = 0.035); P < 0.05 is considered statistically significant
Osteosarcoma is still a persistent disease that has not been overcome. The etiology is still unknown; the genomic heterogeneity is high; and no driver gene has yet been found. In addition, the five-year survival rate for patients with associated metastases is still ≤25% [3]. With 80%–90% of patients with osteosarcoma clinically considered to have micro-metastases and with only 15%–20% of patients found to have metastatic lesions at clinically detectable diagnosis, which occur predominantly in the lungs (85%–90%) but sometimes in the bones or lymph nodes [1,2], pulmonary metastases remain the most important cause of treatment failure in osteosarcoma. It has been noted that the significant results of Gene Ontology (GO) enrichment analysis of differentially expressed genes (DEGs) showed that the DEGs were mainly enriched in the positive regulation of the RNA polymerase II promoter in transcription, angiogenesis, and inflammatory response in the bioprocessome, yielding results closely related to the currently reported angiogenesis in osteosarcoma metastasis [10,11].
By analyzing the prognostic relationships of osteosarcoma-related genes in the TCGA database, including ACTA2, CCL2, TGFBI, VEGFA, PDGFB, PDGFC, COL1A1, COL14A1, CXCL12, CXCL14, CSPP1, LUM, DES, MYL9, and SFRP2, we found that the prognosis of patients with high ACTA2 expression was significantly higher than that of patients with low ACTA2 expression. Other molecules had no significant effect on patients’ prognosis. Li et al. [12] screened DEGs and pathways before and after bone tumor metastasis using bioinformatics analysis to help elucidate the molecular mechanism of osteosarcoma metastasis occurrence, which has clinical significance for the early diagnosis and prevention of osteosarcoma metastasis and provides effective guidance on drug combinations for the treatment of osteosarcoma metastasis. ACTA2 was also found to be associated with the survival of patients with osteosarcoma; namely, patients with high ACTA2 expression had longer survival times than those with low expression. These findings were of particular interest. In our study, no significant correlations between ACTA2 expression and the general clinical characteristics of patients were found by immunohistochemical assays. However, further analysis of the variability of ACTA2 expression among patients with lung metastases of osteosarcoma revealed that PFS and OS were higher in those with high ACTA2 expression than in those with low ACTA2 expression. Thus, we speculated that high ACTA2 expression was not the cause of lung metastases but that high ACTA2 expression in patients who had developed lung metastases was associated with a better prognosis.
Nontumor cells in the tumor microenvironment have an important impact on both tumor progression and prognosis. Among them, cancer-associated fibroblasts (CAFs) play an important role in the tumor microenvironment and are mainly characterized by the expression of actin alpha 2 (ACTA2). Communication between osteosarcoma cells and the surrounding tumor microenvironment (TME) is necessary for tumor growth and subsequent metastasis. The main influential components of the TME are tumor-associated macrophages (TAMs), which are immune cells involved in the inflammatory response and tissue homeostasis. Based on the analysis of TCGA database genes, we previously applied single-cell techniques to analyze the heterogeneity of osteosarcoma tissues and the immune microenvironment [13] and found that ACTA2 was moderately expressed in osteosarcoma cells.
ACTA2 is an actin also known as α–smooth muscle actin (α-SMA). It is involved in the contraction of smooth muscle and is also a cytoskeletal protein expressed in myoepithelial cells [14–16]. α-SMA is a typical marker of the contractile phenotype of myofibroblasts and a marker of mesenchymal cell activation [17]. However, in contrast to our findings in osteosarcoma, other findings have indicated that high expression of ACTA2 is associated with poor prognosis in cancer patients. α-SMA expression in tumor tissues of liver cancer patients is significantly higher than that in para-cancerous tissues [18–20], indicating a higher degree of mesenchymal cell activation in tumor tissues than in para-cancerous tissues. The abnormally high expression of α-SMA in esophageal cancer lymph node metastases suggests that esophageal cancer cells may undergo epithelial–mesenchymal transformation, thereby acquiring the ability to migrate and move and promoting the invasion and metastasis of tumor cells [21]. Tsujino et al. [22] found that high α-SMA expression and lymph node metastasis were independent risk factors for postoperative recurrence in patients with colorectal cancer. In high-risk breast cancer patients, relapse-free survival was reduced when the expression levels of ACTA2, STAT1, and HER2 were higher, and ACTA2 gene abnormalities accelerated the invasion and metastasis of breast cancer cells [23].
ACTA2 is a class of microfilament-forming globular multifunctional proteins that are widely found in eukaryotic cells and function by interconnecting with ACTA2 and membranes through the adhesive linkage of calmodulin. ACTA2 is an essential component of the eukaryotic cytoskeleton and plays a role in rapid polymerization and depolymerization to achieve signal transduction by providing cellular support for the cells [24,25]. Pulmonary metastasis of osteosarcoma is the key cause of treatment failure in osteosarcoma patients, but the high ACTA2 expression in patients with pulmonary metastasis suggests the presence of a greater normal vascularized component in the tumor mesenchyme, which bring a survival benefit. Our immunofluorescence analysis also revealed a ring-like distribution of ACTA2 along the vasculature. The current VEGFR-TKI therapy for tumor treatment is based on the fundamental theory of normalizing the abnormal blood vessels of tumors in order to cut off the blood supply to the tumors [26]. Therefore, we speculate that the survival benefit brought by the high expression of ACTA2 in patients with osteosarcoma lung metastases may be related to normalization of tumor blood vessels. However, further studies are needed to confirm this speculation.
Author Contribution: Conceptualization: ZW. Data curation: LT, HY, ZY, HJ, WG, YZ, JL, and ZW. Formal analysis: LT. Investigation: LT, HY, ZY, HJ, WG, YZ, JL, and ZW. Methodology: LT, ZW. Project administration: ZW. Resources: ZW. Supervision: ZW. Visualization: LT. Roles/writing-original draft: LT. Writing-review and editing: LT, HY, ZY, HJ, WG, YZ, JL, and ZW. All authors contributed to the article and approved the submitted version.
Ethical Statement: The trial was approved by the institutional review board of Shanghai Sixth People’s Hospital (China). Written informed consent to participate in this study was provided by the participants’ legal guardian/next of kin. The ethical approval code number is 2021-161.
Funding Statement: The study was funded by National Natural Science Foundation of China (Grant No. 81900189). The funder had no role in the study design, data collection, or analysis. The corresponding authors had full access to the data and had final responsibility for the decision to submit the manuscript for publication.
Conflicts of Interest: The authors declare that they have no conflicts of interest to report regarding the present study.
References
1. Geller, D. S., Gorlick, R. (2010). Osteosarcoma: A review of diagnosis, management, and treatment strategies. Clinical Advances in Hematology & Oncology, 8(10), 705–718. [Google Scholar]
2. Isakoff, M. S., Bielack, S. S., Meltzer, P., Gorlick, R. (2015). Osteosarcoma: Current treatment and a collaborative pathway to success. Journal of Clinical Oncology, 33(27), 3029–3035. [Google Scholar]
3. Brookes, M. J., Chan, C. D., Baljer, B., Wimalagunaratna, S., Crowley, T. P. et al. (2021). Surgical advances in osteosarcoma. Cancers, 13(3), 388. [Google Scholar]
4. Mateu-Sanz, M., Tornin, J., Ginebra, M. P., Canal, C. (2021). Cold atmospheric plasma: A New strategy based primarily on oxidative stress for osteosarcoma therapy. Journal of Clinical Medicine, 10(4), 893. [Google Scholar]
5. Min, L., Choy, E., Tu, C., Hornicek, F., Duan, Z. (2017). Application of metabolomics in sarcoma: From biomarkers to therapeutic targets. Critical Reviews in Oncology/Hematology, 116, 1–10. [Google Scholar]
6. Laskar, S., Kakoti, S., Khanna, N., Manjali, J. J., Mangaj, A. et al. (2021). Outcomes of osteosarcoma, chondrosarcoma and chordoma treated with image guided-intensity modulated radiation therapy. Radiotherapy and Oncology, 164, 216–222. [Google Scholar]
7. Whelan, J. S., Davis, L. E. (2018). Osteosarcoma, chondrosarcoma, and chordoma. Journal of Clinical Oncology, 36(2), 188–193. [Google Scholar]
8. Dela Cruz, F. S. (2013). Cancer stem cells in pediatric sarcomas. Frontiers in Oncology, 3, 168. [Google Scholar]
9. Alfranca, A., Martinez-Cruzado, L., Tornin, J., Abarrategi, A., Amaral, T. et al. (2015). Bone microenvironment signals in osteosarcoma development. Cellular and Molecular Life Sciences, 72(16), 3097–3113. [Google Scholar]
10. Wang, Z. Y., Mei, J., Gao, Y. S., Ni, M., Yao, B. (2013). Primary tumorectomy promotes angiogenesis and pulmonary metastasis in osteosarcoma-bearing nude mice. Acta Cirurgica Brasileira, 28(3), 190–194. [Google Scholar]
11. Song, R., Tian, K., Wang, W., Wang, L. (2015). P53 suppresses cell proliferation, metastasis, and angiogenesis of osteosarcoma through inhibition of the PI3K/AKT/mTOR pathway. International Journal of Surgery, 20, 80–87. DOI 10.1016/j.ijsu.2015.04.050. [Google Scholar] [CrossRef]
12. Li, H., Chen, M., Wang, Z., Fu, H., Sui, X. et al. (2019). Identification of differential genes and signaling pathways in osteosarcoma and lung metastases using bioinformatics analysis. Chinese Medicinal Biotechnology, 14(1), 4–13. [Google Scholar]
13. Zhou, Y., Yang, D., Yang, Q., Lv, X., Huang, W. et al. (2020). Single-cell RNA landscape of intratumoral heterogeneity and immunosuppressive microenvironment in advanced osteosarcoma. Nature Communications, 11(1), 6322. DOI 10.1038/s41467-020-20059-6. [Google Scholar] [CrossRef]
14. da Silva, A. C., Jammal, M. P., Etchebehere, R. M., Murta, E. F. C., Nomelini, R. S. (2018). Role of alpha-smooth muscle actin and fibroblast activation protein alpha in ovarian neoplasms. Gynecologic and Obstetric Investigation, 83(4), 381–387. DOI 10.1159/000488088. [Google Scholar] [CrossRef]
15. Wang, Y., Jing, Y., Ding, L., Zhang, X., Song, Y. et al. (2019). Epiregulin reprograms cancer-associated fibroblasts and facilitates oral squamous cell carcinoma invasion via JAK2-STAT3 pathway. Journal of Experimental & Clinical Cancer Research, 38(1), 274. DOI 10.1186/s13046-019-1277-x. [Google Scholar] [CrossRef]
16. Lee, H. W., Park, Y. M., Lee, S. J., Cho, H. J., Kim, D. H. et al. (2013). Alpha-smooth muscle actin (ACTA2) is required for metastatic potential of human lung adenocarcinoma. Clinical Cancer Research, 19(21), 5879–5889. DOI 10.1158/1078-0432.CCR-13-1181. [Google Scholar] [CrossRef]
17. Liu, L., Liu, L., Yao, H. H., Zhu, Z. Q., Ning, Z. L. et al. (2016). Stromal myofibroblasts are associated with poor prognosis in solid cancers: A meta-analysis of published studies. Public Library of Science One, 11(7), e0159947. DOI 10.1371/journal.pone.0159947. [Google Scholar] [CrossRef]
18. Wang, C., Yang, L., Liang, Z., Liu, Y., Liu, S. (2018). Long-term survival and prognostic factors of pulmonary metastasectomy in liver cancer: A systematic review and meta-analysis. World Journal of Surgery, 42(7), 2153–2163. DOI 10.1007/s00268-017-4431-7. [Google Scholar] [CrossRef]
19. Galun, E. (2016). Liver inflammation and cancer: The role of tissue microenvironment in generating the tumor-promoting niche (TPN) in the development of hepatocellular carcinoma. Hepatology, 63(2), 354–356. DOI 10.1002/hep.28344. [Google Scholar] [CrossRef]
20. Hu, G. X., Wan, Z. Y., Shao, J. L., Zhang, Y., Zhang, L. L. et al. (2012). Effects of hydroxycamptothecin on TGFb1, a-SMA and collagen I expression in rat hepatic satellite cells. Zhonghua Gan Zang Bing Za Zhi, 20(6), 453–457. [Google Scholar]
21. Ramsey, D., Scoto, M., Mayhew, A., Main, M., Mazzone, E. S. et al. (2017). Revised hammersmith scale for spinal muscular atrophy: A SMA specific clinical outcome assessment tool. Public Library of Science One, 12(2), e0172346. DOI 10.1371/journal.pone.0172346. [Google Scholar] [CrossRef]
22. Tsujino, T., Seshimo, I., Yamamoto, H., Ngan, C. Y., Ezumi, K. et al. (2007). Stromal myofibroblasts predict disease recurrence for colorectal cancer. Clinical Cancer Research, 13(7), 2082–2090. DOI 10.1158/1078-0432.CCR-06-2191. [Google Scholar] [CrossRef]
23. Jeon, M., You, D., Bae, S. Y., Kim, S. W., Nam, S. J. et al. (2017). Dimerization of EGFR and HER2 induces breast cancer cell motility through STAT1-dependent ACTA2 induction. Oncotarget, 8(31), 50570–50581. DOI 10.18632/oncotarget.10843. [Google Scholar] [CrossRef]
24. Kieswich, J. E., Chen, J., Alliouachene, S., Caton, P. W., McCafferty, K. et al. (2020). Immunohistochemistry of kidney a-SMA, collagen 1, and collagen 3, in a novel mouse model of reno-cardiac syndrome. Bio-Protocol, 10(18), e3751. DOI 10.21769/BioProtoc.3751. [Google Scholar] [CrossRef]
25. Anggorowati, N., Ratna Kurniasari, C., Damayanti, K., Cahyanti, T., Widodo, I. et al. (2017). Histochemical and immunohistochemical study of alpha-SMA, collagen, and PCNA in epithelial ovarian neoplasm. Asian Pacific Journal of Cancer Prevention, 18(3), 667–671. [Google Scholar]
26. Wang, Z., Dabrosin, C., Yin, X., Fuster, M. M., Arreola, A. et al. (2015). Broad targeting of angiogenesis for cancer prevention and therapy. Seminars in Cancer Biology, 35, S224–S243. [Google Scholar]
Cite This Article
 Copyright © 2022 The Author(s). Published by Tech Science Press.
This work is licensed under a Creative Commons Attribution 4.0 International License , which permits unrestricted use, distribution, and reproduction in any medium, provided the original work is properly cited.
 Downloads
 Citation Tools