
 Submit a Paper
 Propose a Special lssue
 Open Access
ARTICLE

RCN3 Expression Indicates Prognosis in Colorectal Cancers
1
Department of Colorectal Surgery, Changhai Hospital, Shanghai, 200433, China
2
Department of Environmental Health, Naval Medical University, Shanghai, 200433, China
3
Jiahui International Cancer Center, Jiahui International Hospital, Shanghai, 200433, China
* Corresponding Authors: Jinke Sui. Email: ; Wenjun Chang. Email:
; Wei Zhang. Email:
# Contributed equally to this work
Oncologie 2022, 24(4), 823-833. https://doi.org/10.32604/oncologie.2022.025411
Received 10 July 2022; Accepted 22 September 2022; Issue published 31 December 2022
 View Full Text
 Download PDF
Abstract
Background: Reticulocalbin 3 (RCN3) has been associated with several malignancies. However, its role in colorectal cancer (CRC) remains controversial. Thus, this study aimed to investigate the role of RCN3 in CRC prognosis. Methods: The clinical significance of RCN3 expression in CRC was evaluated in a large cohort of 483 patients. Normal tissues, carcinoma, para-carcinoma, adenoma, and metastatic tissues were evaluated by immunohistochemistry. We investigated the association between RCN3 expression and CRC occurrence in tumors and other tissues. Prognostic factors were also evaluated by Kaplan-Meier survival analysis and the Cox regression model. Results: RCN3 was significantly overexpressed in CRC and metastatic tissues. Patients with high RCN3 expression had shorter disease-free survival than those with low RCN3 expression. Multivariate Cox regression analysis showed a risk ratio HR], 0.607; confidence interval [CI], 0.362–1.016; p < 0.05 after adjusting for other prognostic factors. HighRCN3 expression was also associated with a worse chemotherapeutic response in the colon (p < 0.01) or rectal (p < 0.05) cancer patients who received adjuvant chemotherapy. Conclusion: RCN3 expression level is an independent risk factor and serves as a prognostic biomarker for CRC. High RCN3 expression predicts poor prognosis and chemotherapeutic response.Keywords
Reticulocalbin 3 (RCN3), belonging to the CREC protein family, is a promising biomarker or target for therapeutic intervention in various diseases. They are localized in the cytoplasm and interact with several ligands to inhibit proteins in the endoplasmic reticulum (ER) or sarcoplasmic reticulum, including calcium transport ATPase, cyclooxidoreductase of vitamin K [1]. RCN3 plays a role in cell secretion, molecular chaperone activity, signal transduction, and various other processes. They are also expressed and localized to the secretory pathways of mammalian cells [1,2]. RCN3 also prevents tissue destruction by collagen biosynthesis, positive regulation of peptidase activity, and protein kinase B signaling, thus maintaining intestinal homeostasis [2]. Recently, alterations in RCN3 protein expression have been observed in various types of cancers, including cervical squamous cell carcinoma, melanoma, glioma, and non-small cell lung cancer [3–7]. In a single-cell multi-omics sequencing study, alterations in RCN3 were implicated in the ubiquitous alterations in human CRC tumor stroma [3]. Thus, we analyzed RCN3 protein expression in CRC and its matched adjacent tissues to decipher its role in predicting CRC prognosis and chemotherapy response, laying the foundation for subsequent studies.
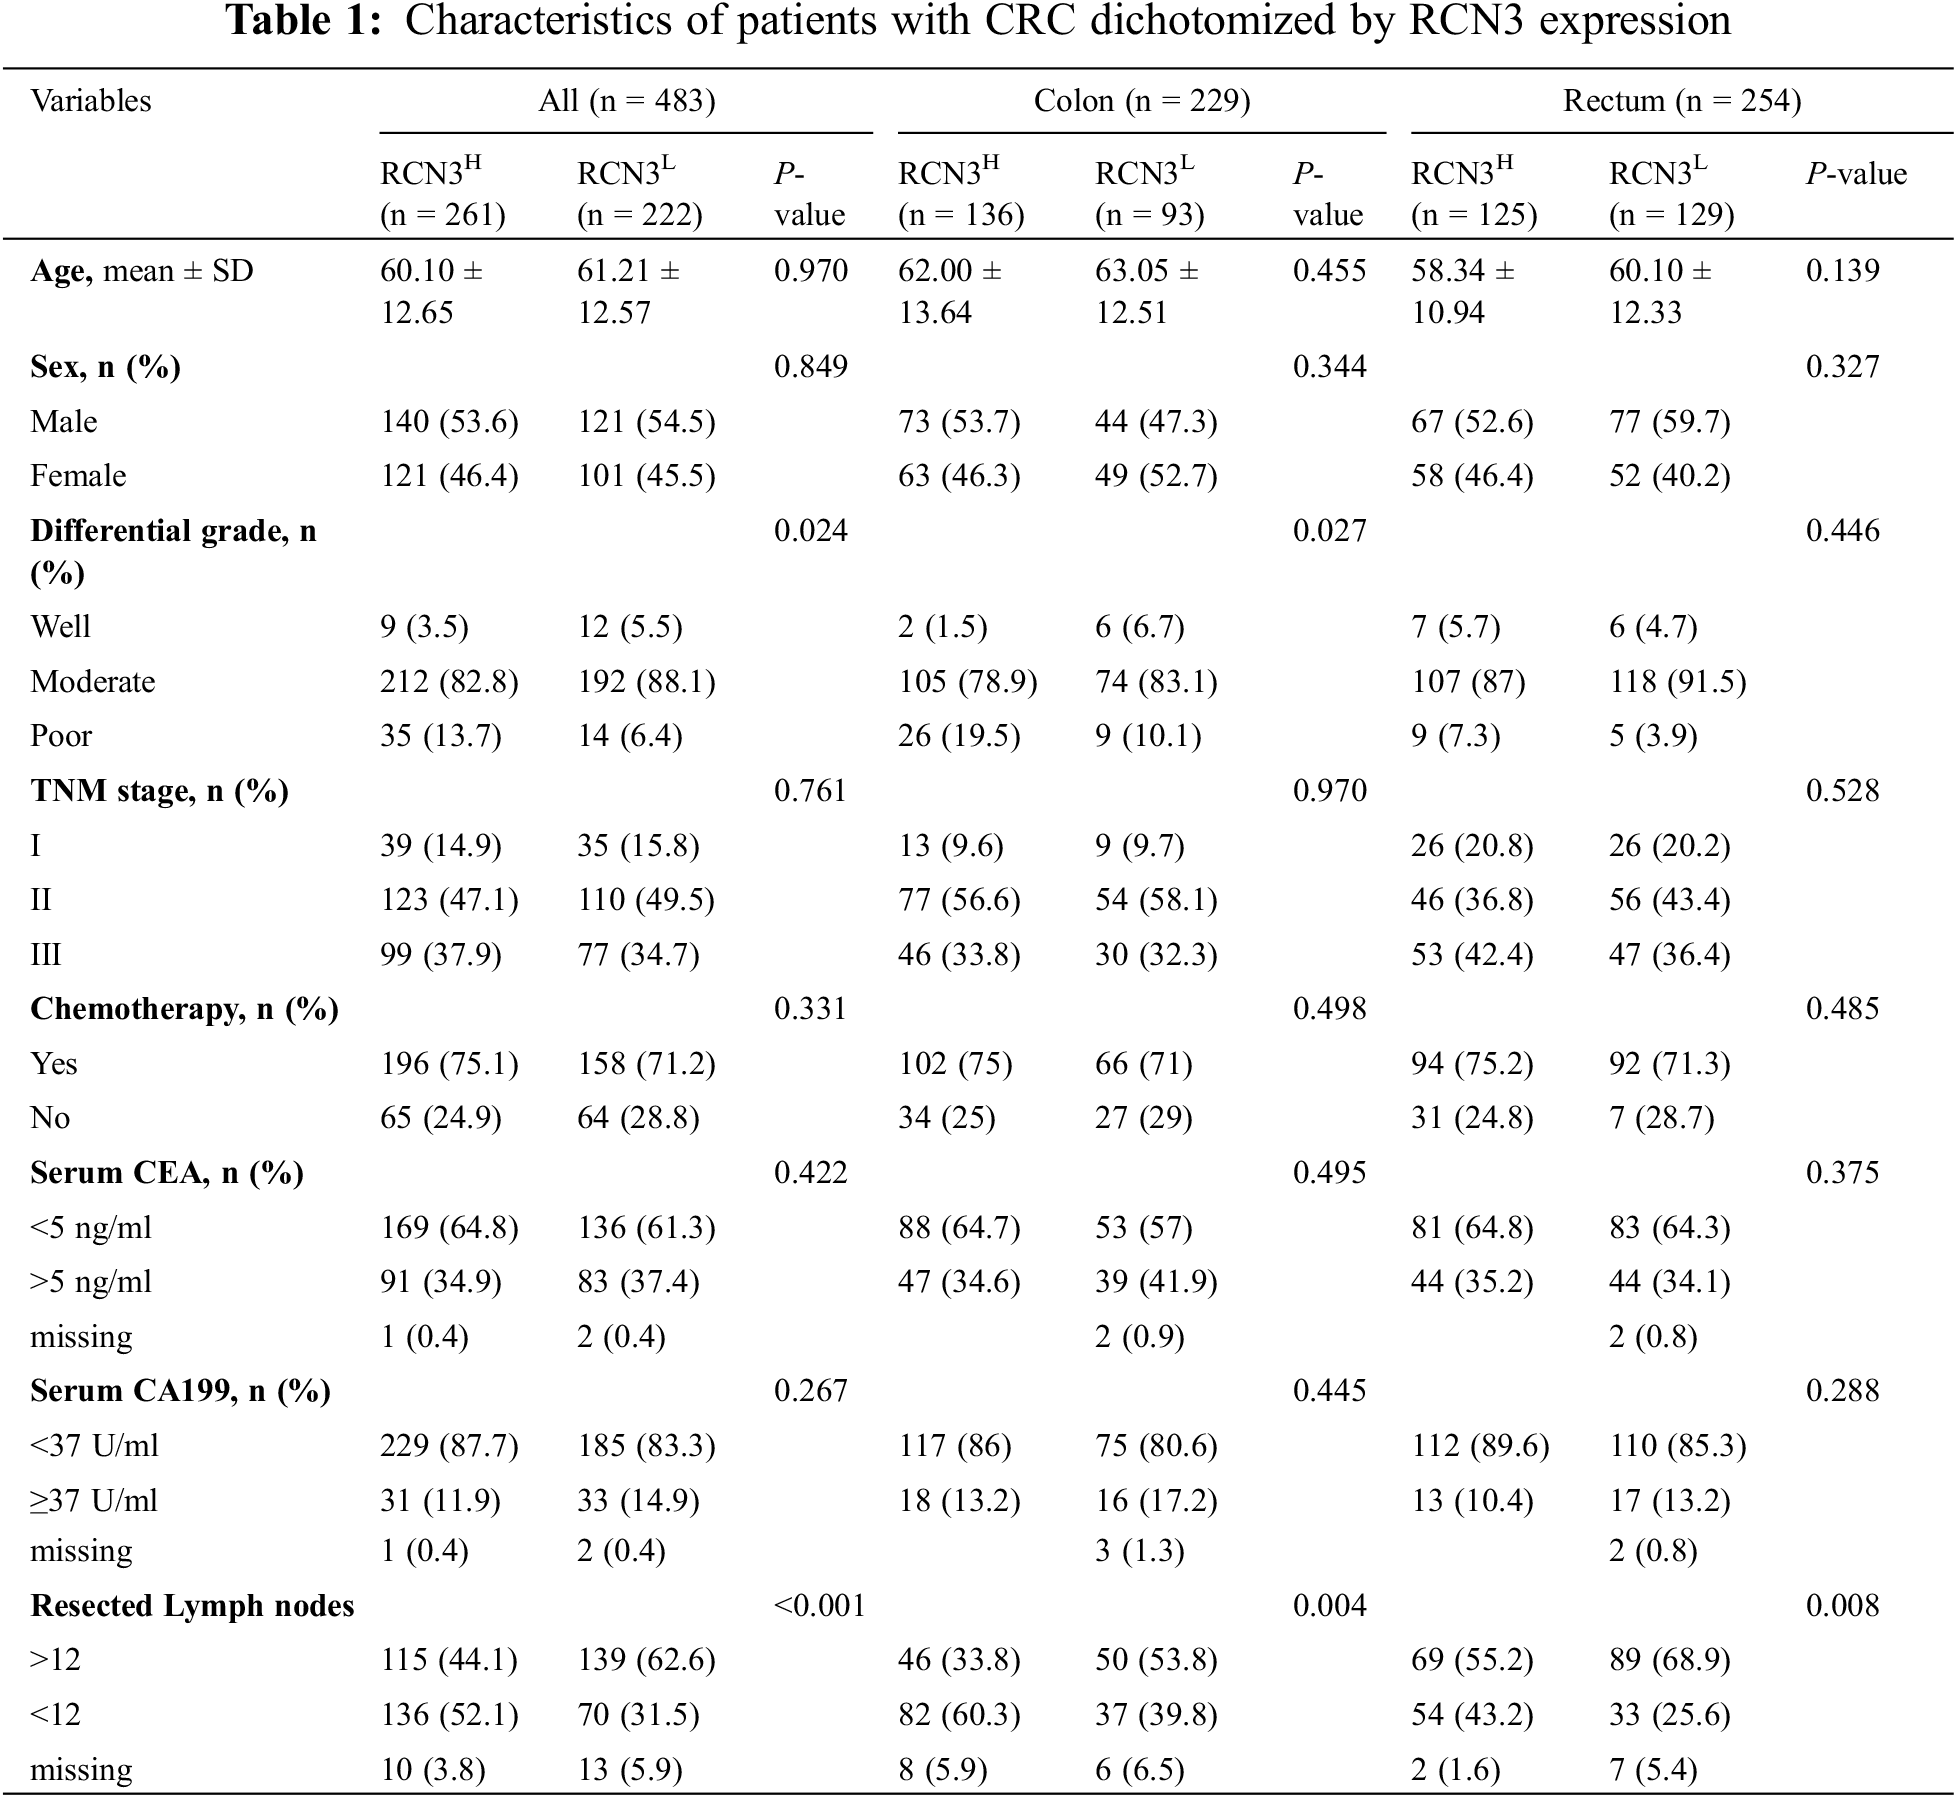
We analyzed the differences in RCN3 gene expression in the TCGA database between colon or rectal cancers, other pathology tissue types, and different grades and sites using the GEPIA2 website (http://gepia2.cancer-pku.cn/). Simultaneously, we also explored the relationship between RCN3 gene expression and pathology types in the GEO cohort (GSE37364 and GSE41258). Further, we recruited 483 CRC patients (rectal cancer = 254 and colon cancer = 229) who were surgically treated between 2001 and 2011 at Changhai Hospital of Naval Medical University (Shanghai, China). The baseline characteristics these, including age, sex, disease location, TNM stage, histological grade, number of lymph nodes removed at surgery, standard postoperative chemotherapy (FOLFOX regimen), serum cancer Embryonic antigen (CEA), and carbohydrate antigen 199 (CA199) were noted (Table 1). This study was approved by the Changhai Hospital Institutional Review Board. All participants signed a written informed consent form.
2.2 Immunohistochemistry (IHC)
IHC was performed according to the previously reported protocol [8]. Briefly, thick sections were (4 μm) obtained from the Department of Environmental Health, Naval Medical University, China. The sections were treated with rabbit anti-human RCN3 polyclonal antibodies (1:2500, ab204178, Abcam, Cambridge, UK), validated in the Human Protein Atlas (http://www.proteinatlas.org/). Epitope retrieval and immunostaining were carried out on the tissue microarray (TMA) sections by following the instructions of the pathological department. All TMAs were stained simultaneously by the technician to eliminate inter-assay variation.
2.3 Quantitative Evaluation of RCN3 Immunostaining
IHC staining was performed for semi-quantitative analysis of RCN3 based on the percentage of positive cells and the comprehensive score of staining intensity. Dark brown in the cytoplasm indicated a positive RCN3 marker. The intensity was scored according to the staining characteristics: 0 (colorless), 1 (pale yellow), 2 (light brown), and 3 (brown). The percentage of positive cells is the average number of positive cells in five fields of a certain type of cell (100 cells per 400X high-power field). They were assigned a score of 0 (negative), 1 (<10%), 2 (11%–50%), 3 (51%–75%), and 4 (>75%). The product of the percentage of positive cells and the staining intensity was considered the final score. All the assessments were conducted by two independent observers for further study.
Statistical analysis was performed using SPSS 25 software for Windows (IBM Corporation, Armonk, NY, USA). Pearson’s chi-square test (categorical variables) and two-sample Student’s t-test (continuous variables) were used to analyze the relationship between RCN3 and clinicopathological characteristics. Overall survival and disease-free survival curves were plotted using the Kaplan-Meier method, and the log-rank sum test was used to detect the differences. Univariate Cox proportional hazards models were used to determine all the possible prognostic factors, and significant ones were further verified by multivariate analysis. P < 0.05 was considered statistically significant for a two-sided test.
3.1 Bioinformatics Analysis of RCN3 in CRC
The expression profiles of RCN3 in the related specimens were extracted from the processed data and compared with different pathological types of colorectal tissues (Fig. 1A). We found that high RCN3 expression predicted worse disease-free survival in CRC in the TCGA cohort, according to the GEPIA database. Moreover, the expression of RCN3 was higher in the carcinoma than in the normal colon. Higher RCN3 expression was also found to be related to the advanced stages (III and IV) than the early stages (І and II). Similar conclusions were drawn from the GEO cohort with a lower RCN3 expression in the normal colon than in the carcinoma tissues (Figs. 1E and 1F).
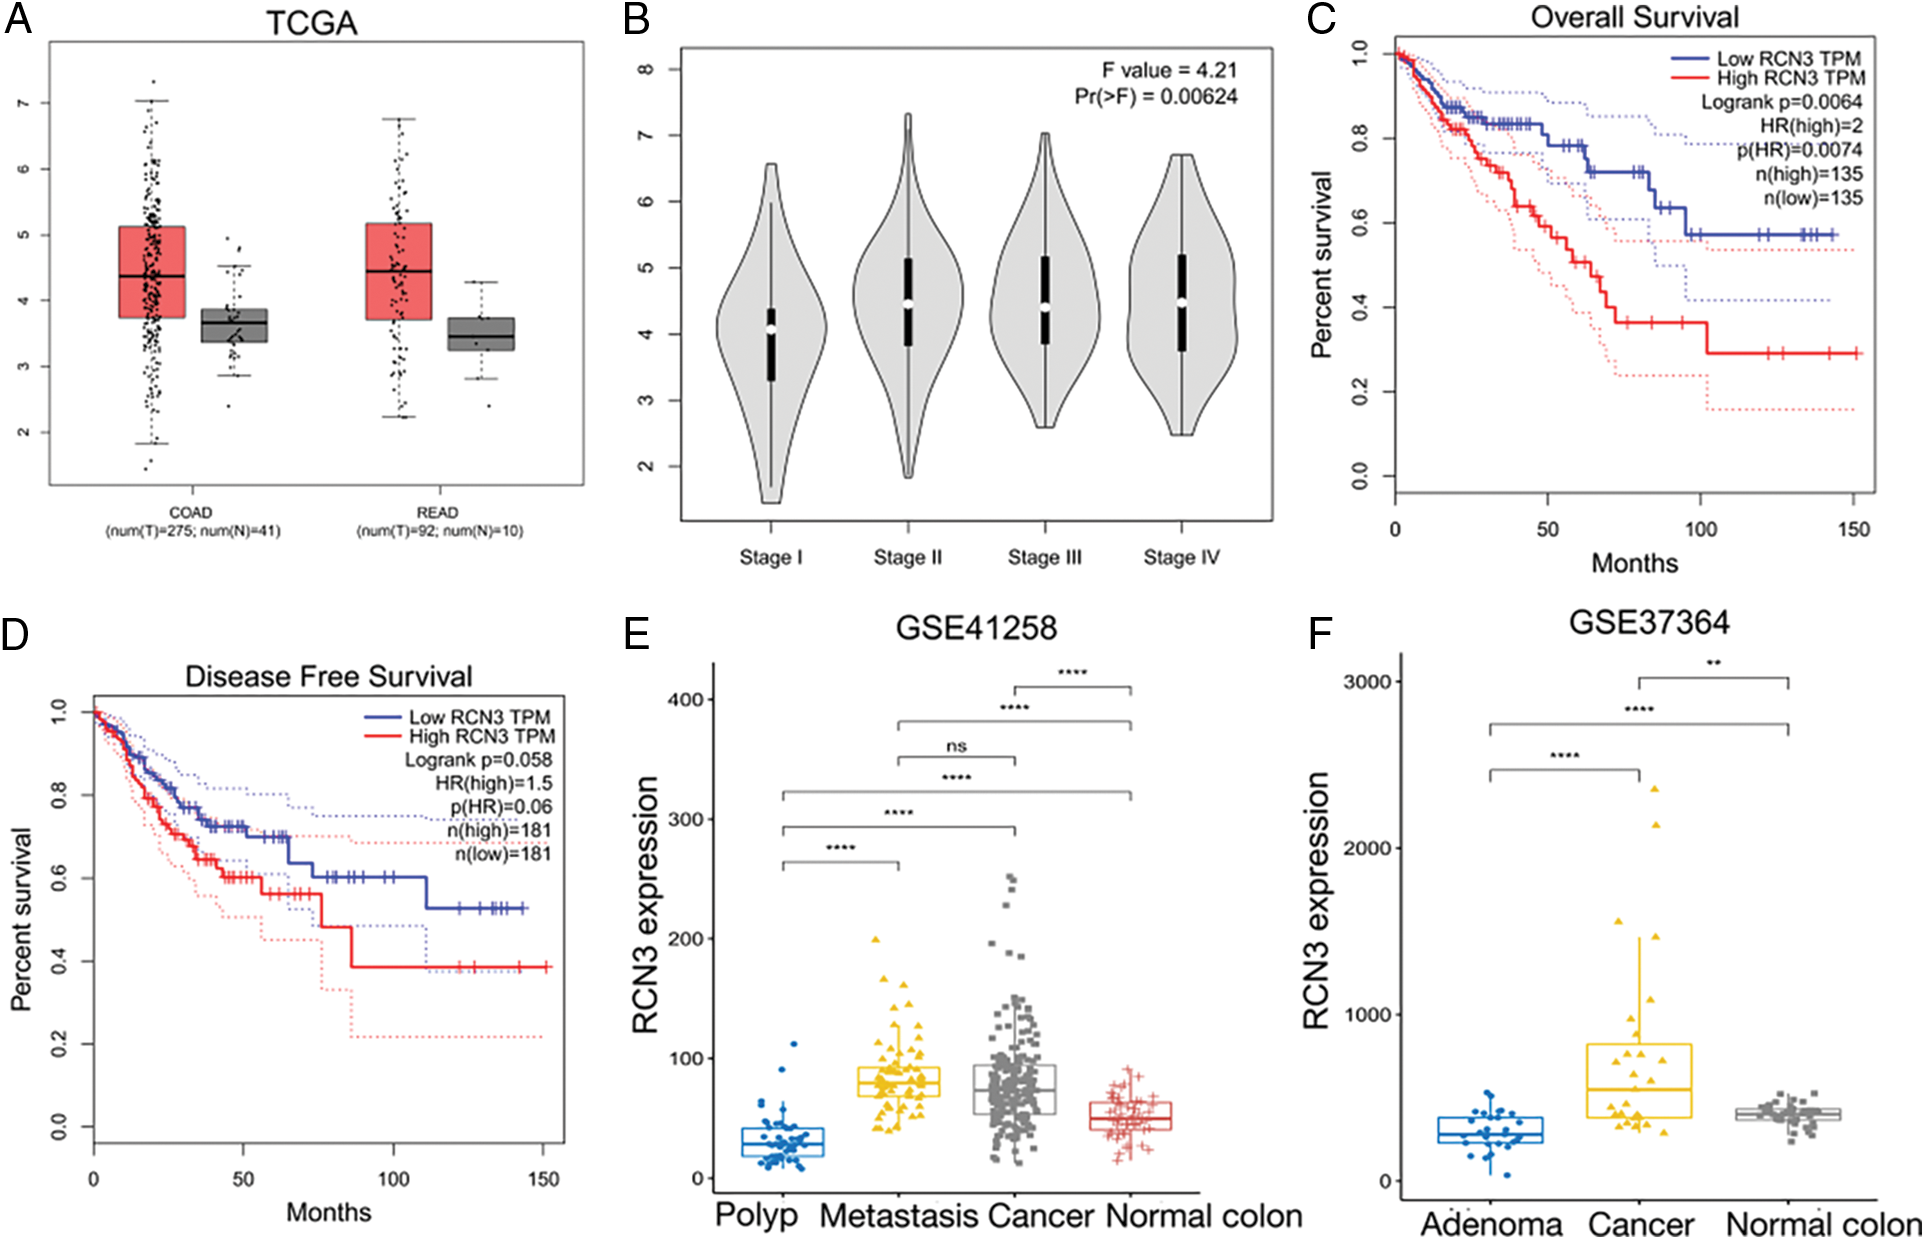
Figure 1: Exploration of RCN3 expression in CRC. A) Different expression levels of RCN3 in the TCGA cohort. B) Expression levels of RCN3 in different stages in CRC. C) Relations between overall survival and RCN3 expression in the TCGA cohort. D)Relations between disease-free survival and RCN3 expression in the TCGA cohort. E) Bioinformatics analyses of RCN3 mRNA expression in normal tissue and CRC in the GSE41258 cohort. F) Bioinformatics analyses of RCN3 mRNA expression in normal tissue and CRC in the GSE37364 cohort. The error bar represents the means ± SD
Note: *p < 0.05, **p < 0.01, ***p < 0.001, ****p < 0.0001.
3.2 RCN3 Expression Detected in Clinical Specimens
In this study, we examined RCN3 expression in 483 colorectal cancer specimens by immunohistochemistry. The optimal RCN3 expression cutoff value of 260 was considered based on the overall survival of the receiver operating characteristic curve. Therefore, 222 cases were classified as low RCN3 expression and 262 cases as high RCN3 expression. Regarding its subcellular localization, RCN3 was found to be localized in the ER lumen. The IHC analysis demonstrated that the positive rate of RCN3 was significantly increased in CRC specimens compared with that in the paired adjacent nontumor specimens or normal intestinal mucosa (Figs. 2A–2D). These results suggested upregulation of RCN3 in CRC. Meanwhile, abnormal RCN3 expression might be related to the chronic progression of colorectal malignancies.
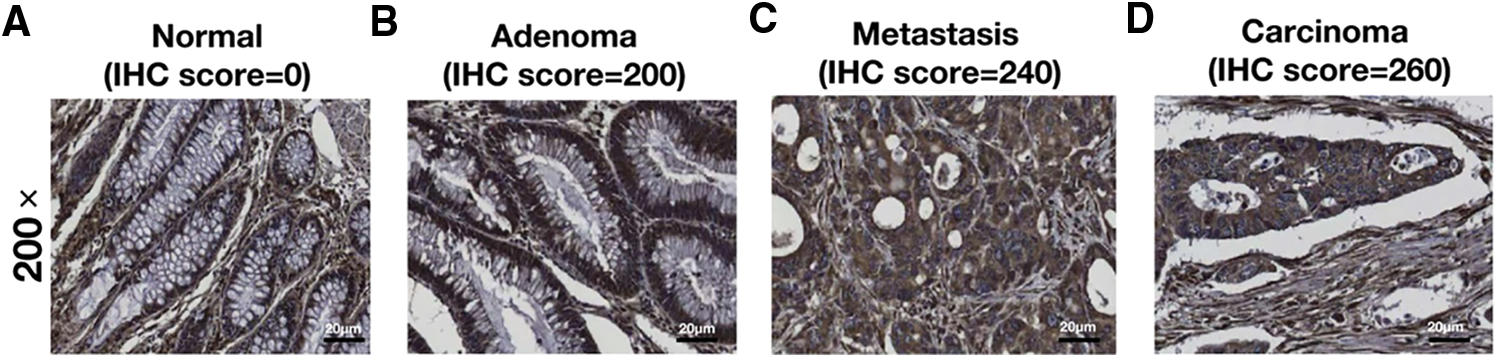
Figure 2: Representative IHC images of (A) normal, (B) adenoma, (C) metastasis, and (D) carcinoma (200X magnification, Scalebar, 200 μm)
3.3 Association of RCN3 Levels with Clinicopathologic Characteristics
As an elevated expression pattern of RCN3 was observed in the malignant tissues, we next analyzed the relationship between RCN3 risk and the clinicopathological factors from the patients. The statistical analysis showed that RCN3 was significantly associated with the tumor site (p < 0.05) (Fig. 3A). Moreover, a significant relationship was identified between RCN3 and grade (p < 0.05) or the number of resected lymph nodes (p < 0.001) (Figs. 3B and 3C). Nevertheless, no remarkable correlations were observed between RCN3 and gender, age at diagnosis, CEA level, CA199 level, TNM stage, or the history of adjuvant chemotherapy.
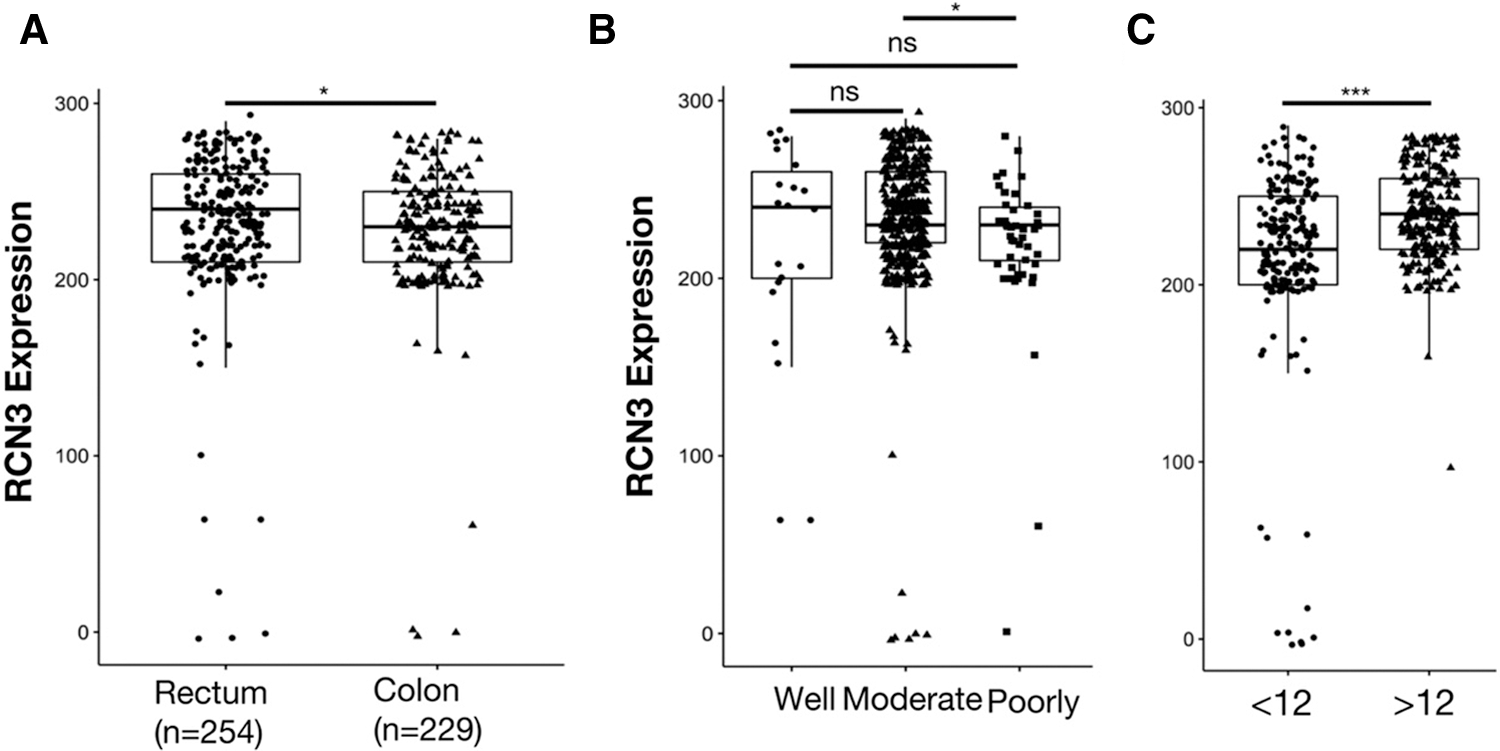
Figure 3: Comparison of epithelial RCN3 expression in (A) different tissues, (B) grades, and (C) different numbers of resected lymph nodes
Note: *p < 0.05, **p < 0.01, ***p < 0.001, ****p < 0.0001.
3.4 High Expression of RCN3 Protein Predicted a Poor Prognosis in CRC
The correlation between disease-free survival and RCN3 expression was evaluated in 483 patients using Kaplan-Meier analysis. The results showed that patients with high RCN3 tumor expression had unfavorable disease-free survival compared with those with low expression (Fig. 4A, p < 0.01). This survival pattern indicated that CRC patients with high RCN3 had a higher risk of tumor relapse than those with low RCN3 expression. In univariate survival analysis, RCN3 risk classification (p < 0.01), tumor grade (p < 0.01), TNM stage (p < 0.01), tumor location (p < 0.05), and the number of resected lymph nodes (p < 0.01) were also proved to be associated with disease-free survival of these patients. These results indicated that CRC patients with higher RCN3 expression tumor grade, and TNM stage, with more than 12 resected lymph nodes have a higher risk of tumor reoccurrence than their counterparts (Table 2).
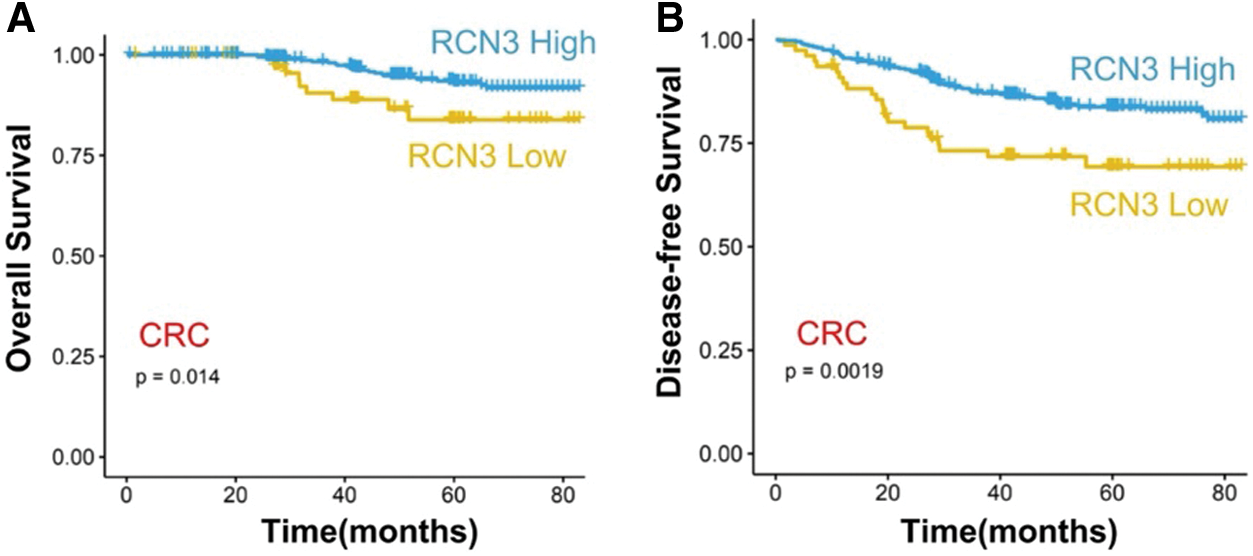
Figure 4: Survival analysis (A) association between RCN3 expression and overall survival (OS) or (B) disease-free survival (DFS) in 483 patients
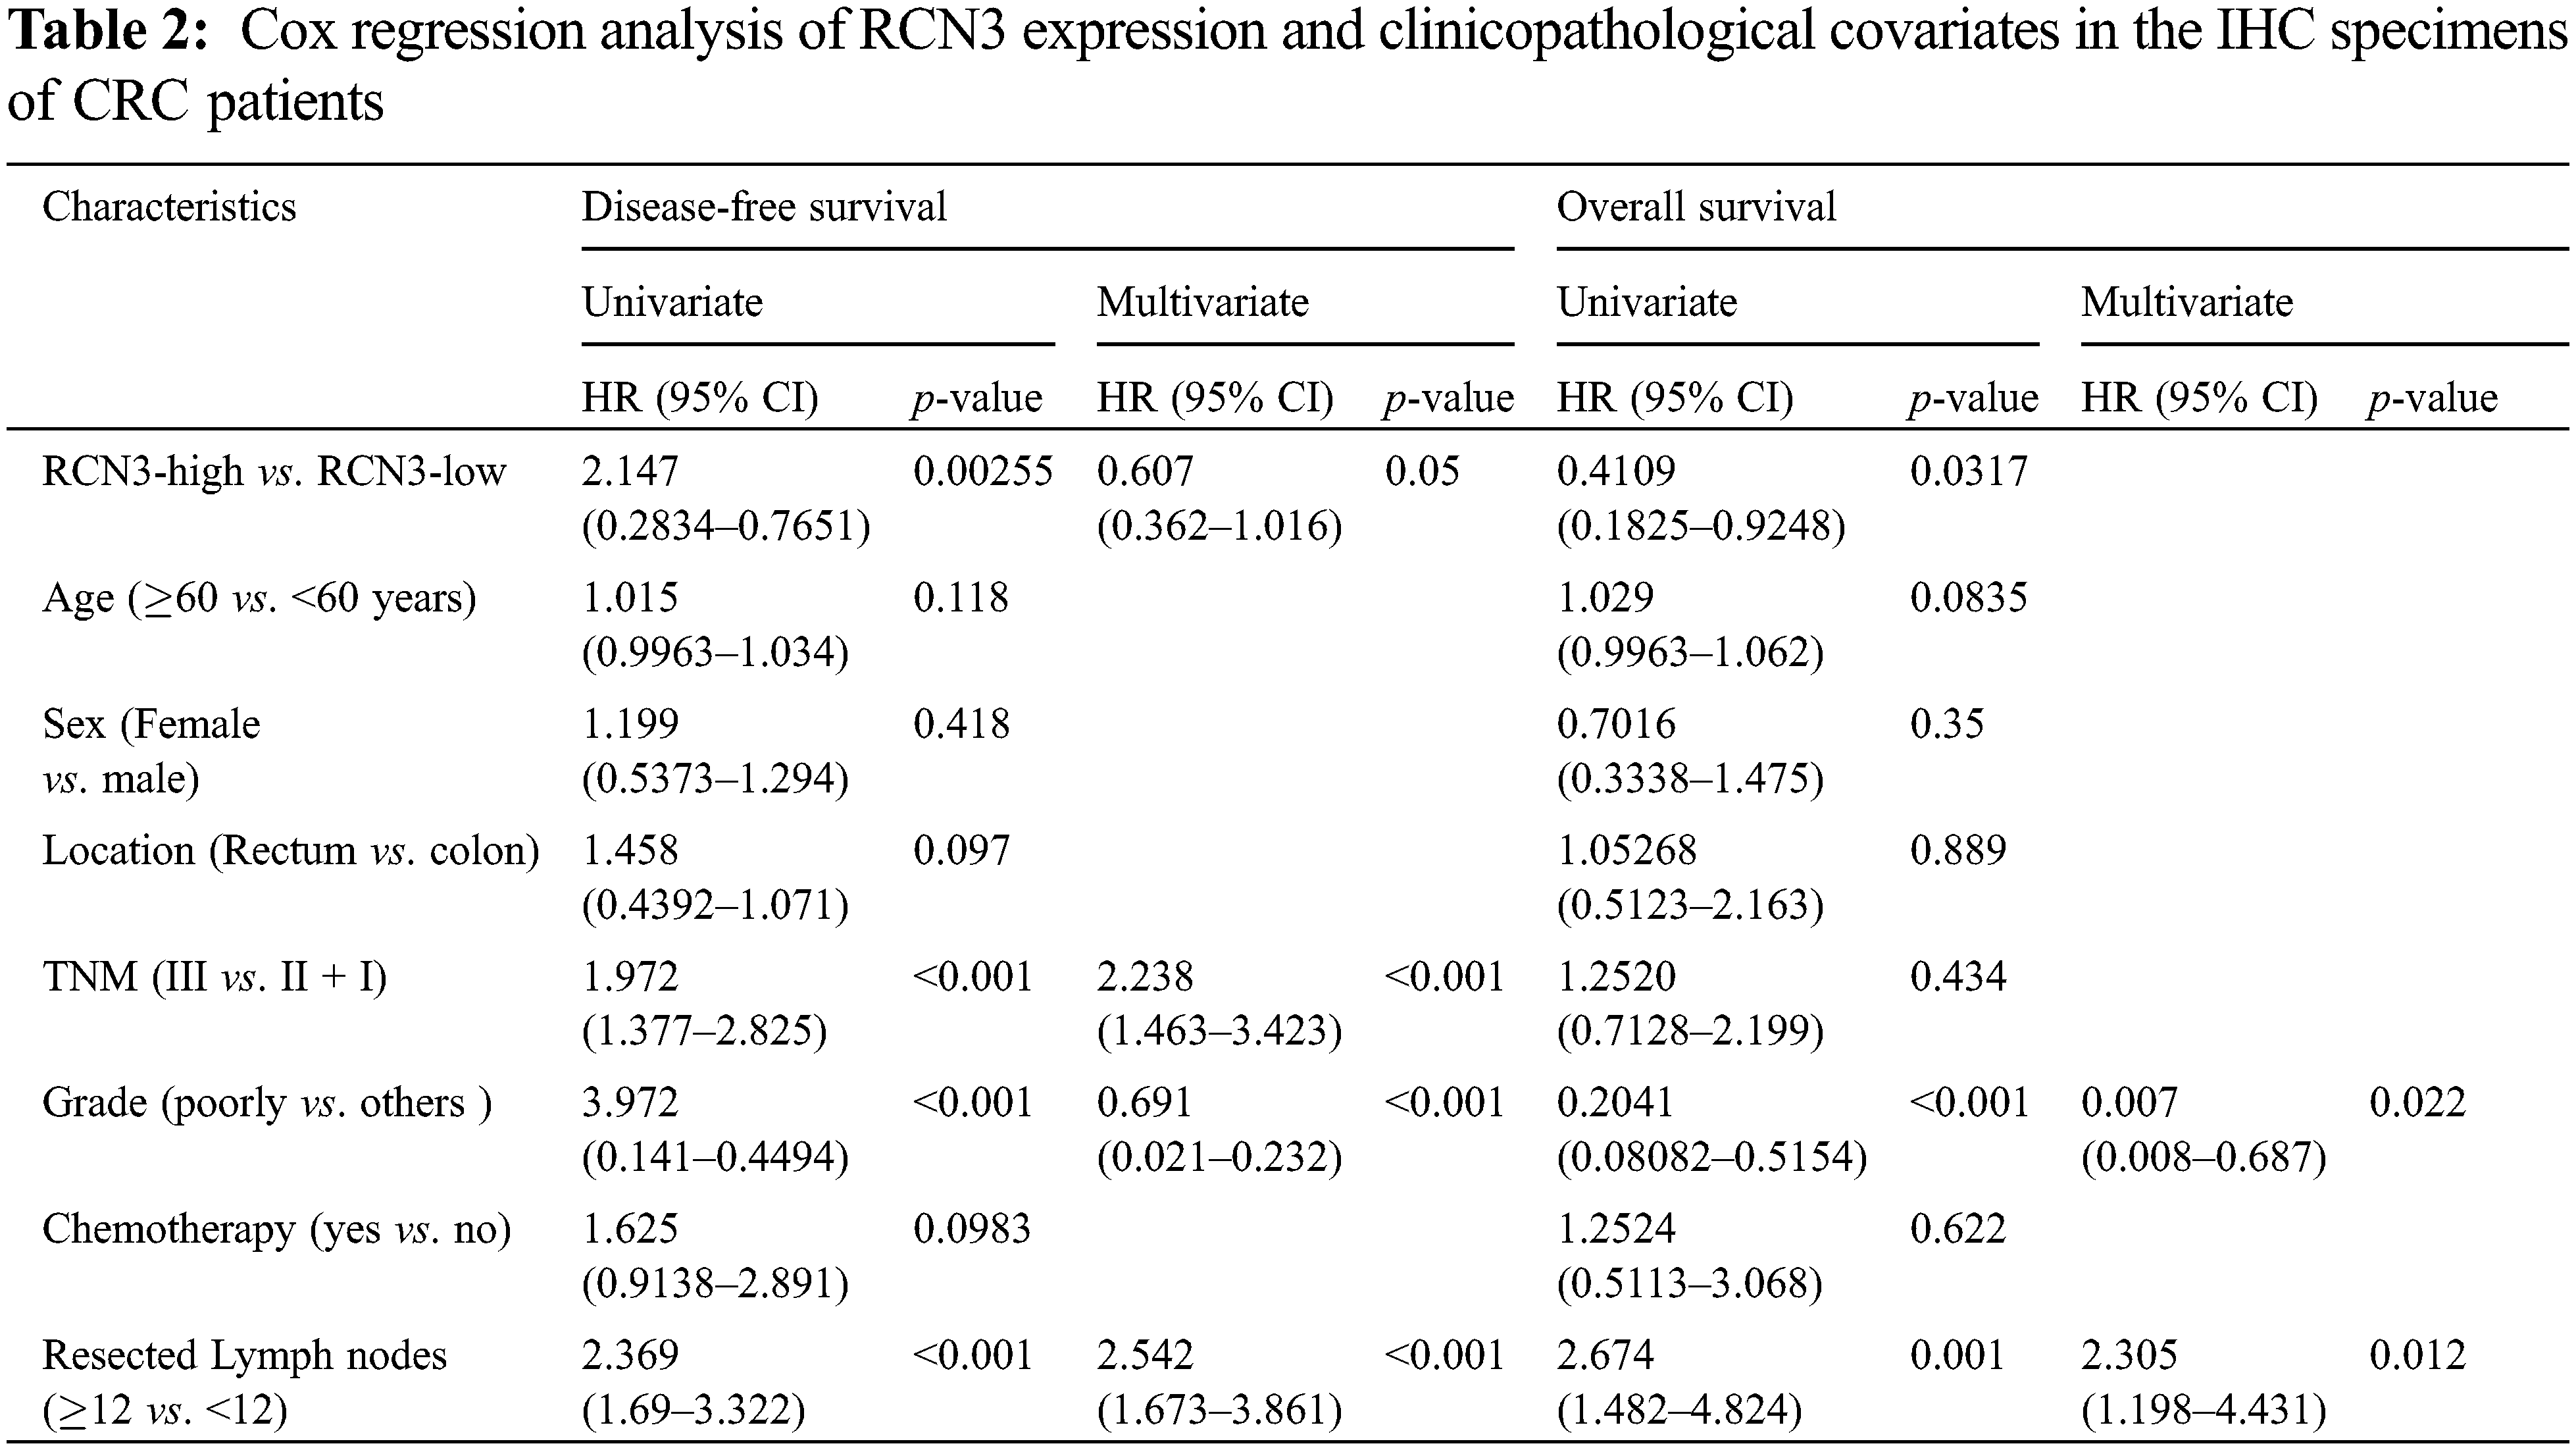
Furthermore, to validate the independent effect of RCN3 expression on disease-free survival, we performed Cox proportional hazards model analysis adjusting for gender, age, tumor grade, location, history of chemotherapy, the number of resected lymph nodes, and TNM stage, which aimed to control confounding paraments. The hazard ratio (HR) of the high RCN3 risk in 483 patients was found to be 0.606 (95% CI: 0.362–1.015, p < 0.05) than those with RCN3 low expression tumors (Table 2). Moreover, tumor grade, TNM stage, and the number of resected lymph nodes were also found to be independently associated with disease-free survival of patients in multivariate analysis. These results suggested that patients with high RCN3 expression have a higher risk of tumor reoccurrence than those with a low level of RCN3.
Similar to the results of disease-free survival, the RCN3 expression level was found to be statistically correlated to the overall survival of patients. Univariate survival analysis showed that patients with high RCN3 tumor expression had unfavorable overall survival compared with those with low RCN3 tumor expression (Table 2). However, in multivariate analysis, RCN3 risk was not found to be correlated to the overall survival of the patients.
3.5 RCN3 Expression May Predict the Prognosis of Patients with Early-Stage Rectal Cancer
We performed subgroup analysis based on the cancer site, one with rectal cancer (n = 254) and one with colon cancer (n = 229). In rectal cancer, high expression of RCN3 was associated with worse disease-free survival (Fig. 5A, p < 0.05). However, in colon tumors, there was a relationship between high expression of RCN3 and overall survival (Fig. 5B, p < 0.05). To further explore the relationship between RCN3 and tumors at different sites, patients were divided into early (stages І and II) and advanced (stage III) groups. We found that RCN3 predicted disease-free survival in the early stage of rectal cancer (p < 0.05). However, in colon cancer, the expression of RCN3 was not significantly associated with the survival outcomes in the early or late stages (Figs. 6A–6D).
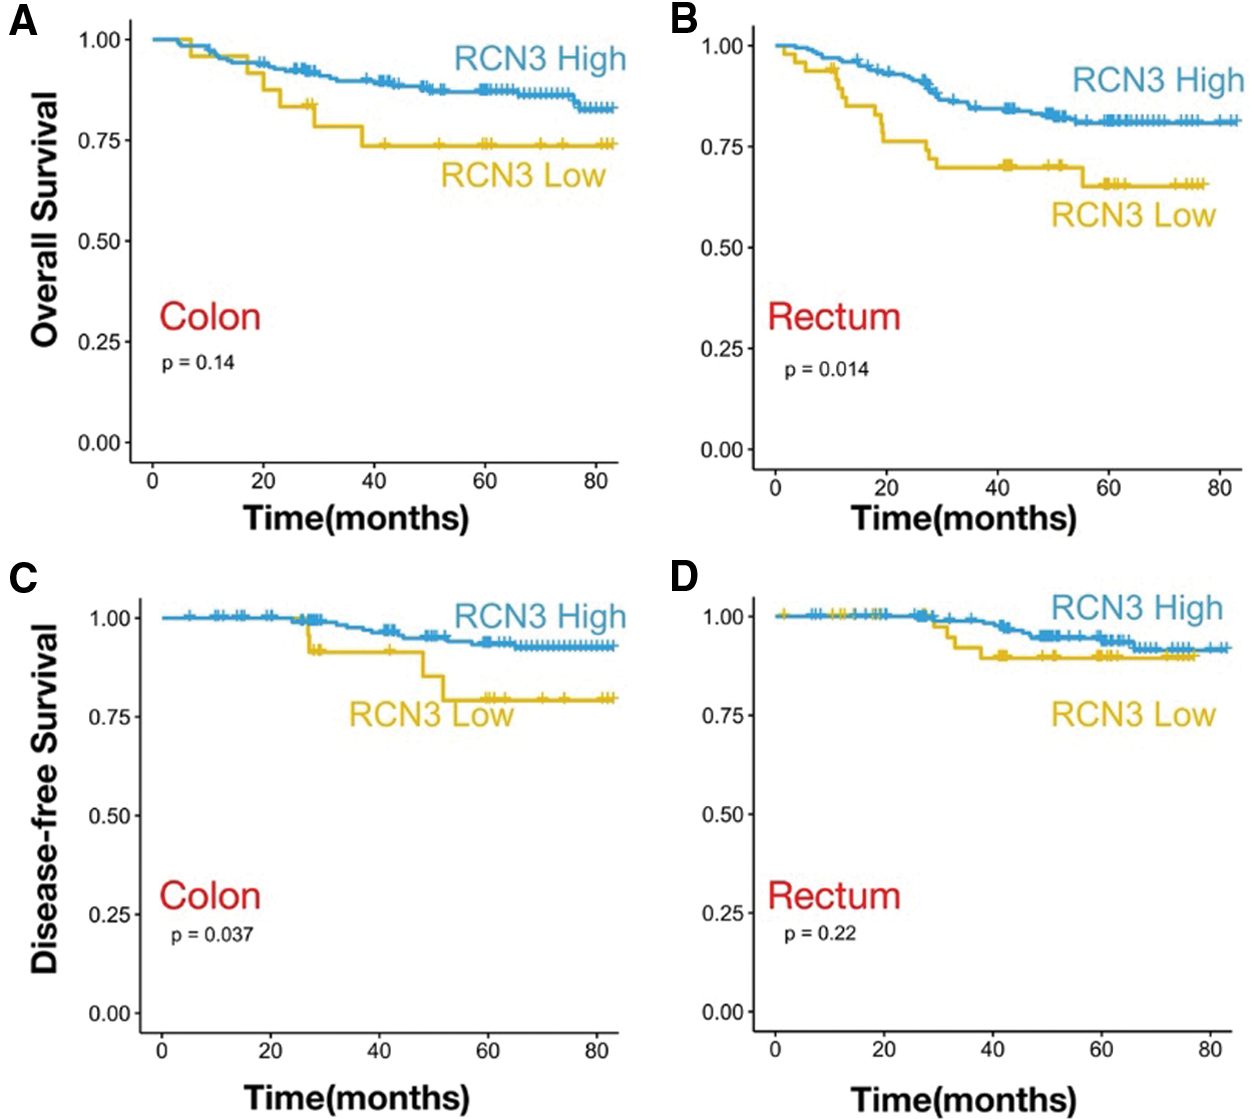
Figure 5: The analysis of different tumor sites. Kaplan–Meier survival curves with OS in patients with (A) colon cancer and (B) rectal cancer. Kaplan–Meier survival curves with DFS in patients with (C) colon cancer and (D) rectal cancer
Note: p values are from Kaplan–Meier analysis with the log-rank test.
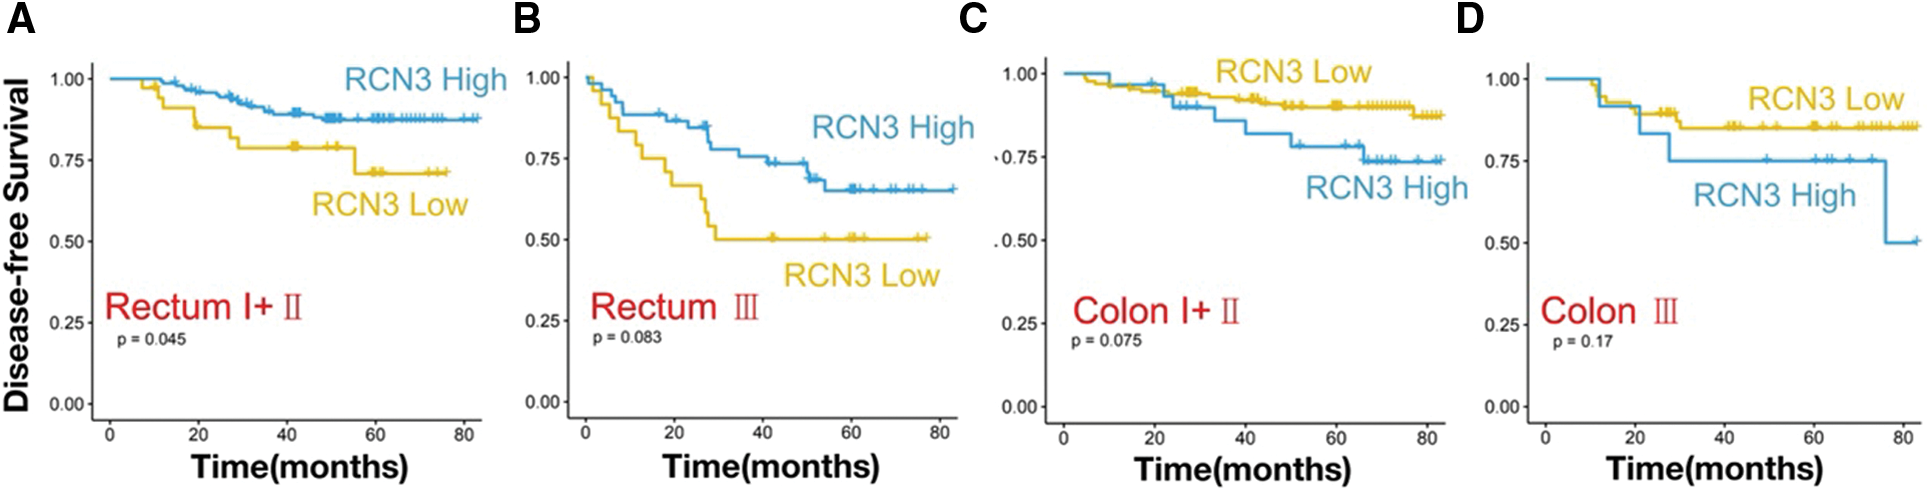
Figure 6: Kaplan–Meier survival curves with DFS of the colon (C–D) or rectal cancer (A–B) patients in early (stages І and II) and advanced (stage III)
3.6 RCN3 Expression is Associated with Chemotherapy in the Colon or Rectal Cancer
We collected follow-up data on patients with colon or rectal cancer. The Kaplan-Meier survival analysis showed that colon cancer patients who received chemotherapy RCN3 expression predicted overall survival (p < 0.01). In rectal cancer patients receiving chemotherapy, high RCN3 expression was also associated with undesirable disease-free survival (p < 0.05). These results indicated that RCN3 predicted not only the prognosis of patients but also chemotherapy sensitivity (Figs. 7A–7D).
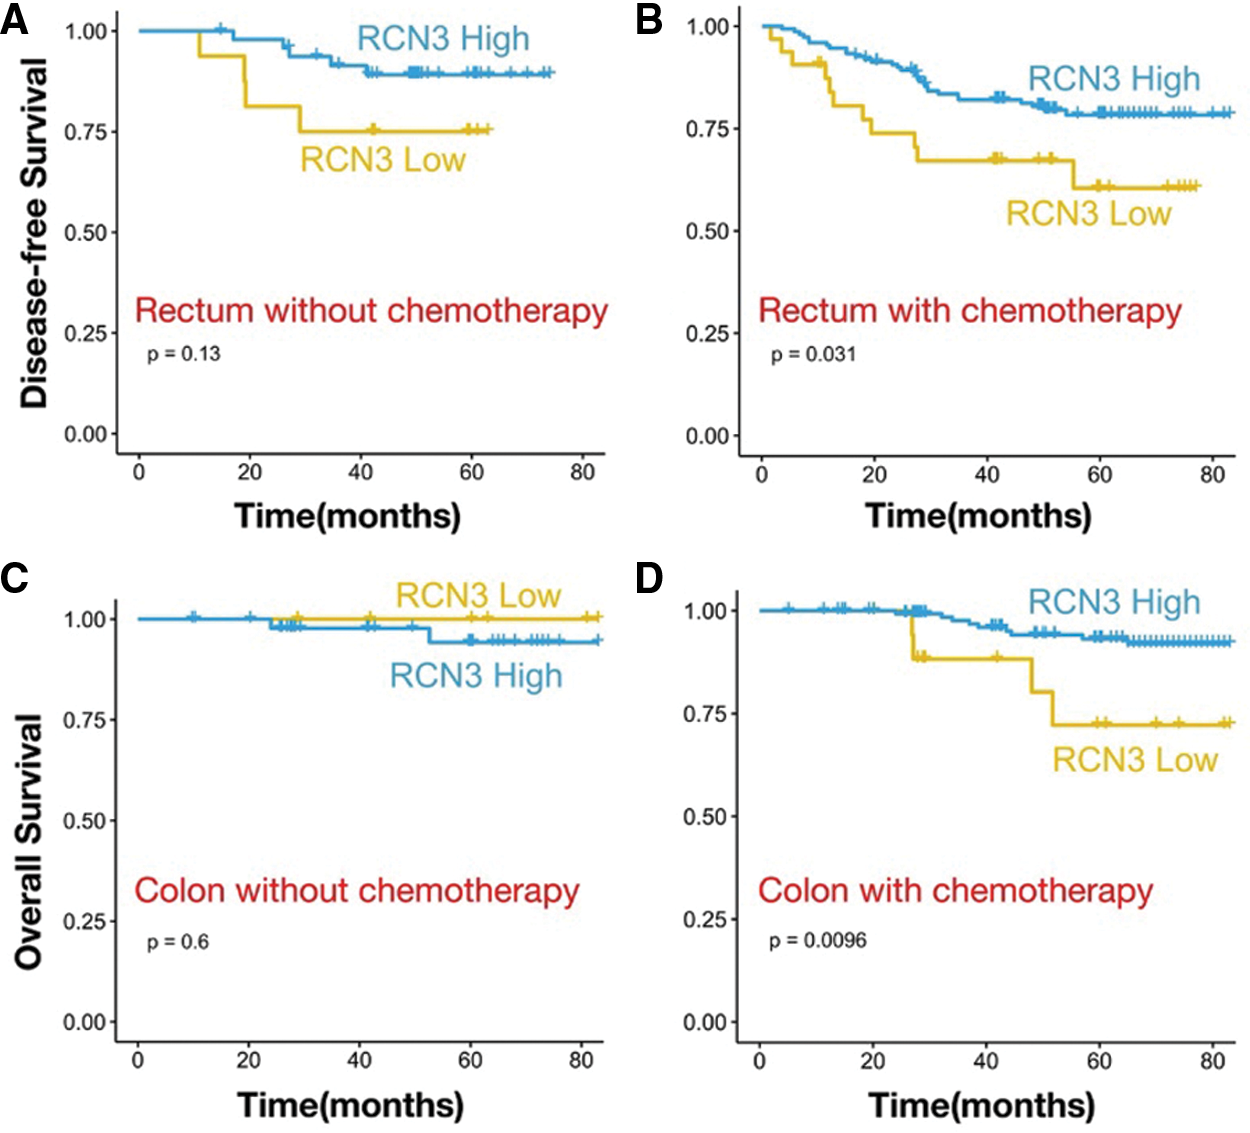
Figure 7: Kaplan–Meier survival curves with OS and DFS in patients with (A) history of taking chemotherapy in rectal cancer or (B) without chemotherapy. Kaplan–Meier survival curves with OS and DFS in patients with (C) history of taking chemotherapy in colon cancer or (D) without chemotherapy
Note: p values are from Kaplan–Meier analysis with the log-rank test.
In the present study, the expression patterns of RCN3 in CRC and adjacent normal tissues were first compared using published gene expression profiles. We found that RCN3 transcript levels were consistently higher in CRC than in adjacent normal tissues in three datasets of the TCGA and GEO. The tissue specimens from the CRC cohort were then studied. The IHC analysis showed that RCN3 protein was mainly distributed in the ER lumen of colorectal epithelial cells. RCN3 protein expression was higher in cancer tissues as compared to normal tissues. Moreover, the epithelial RCN3 expression was significantly lower in colorectal polyps than in normal tissues. This suggested that reduced expression of RCN3 in the epithelium was associated with the development of CRC and maybe an early event.
In contrast to colon cancer, the role of adjuvant chemotherapy in the modern management of rectal cancer remains controversial [9,10]. Several randomized controlled studies have demonstrated that colon cancer patients can benefit from adjuvant chemotherapy [11,12]. However similar conclusion could not be drawn for rectal cancer patients [13]. Rectal cancer patients who received neoadjuvant chemoradiation followed by surgery and adjuvant chemotherapy did not survive longer than those who received surgery alone [9]. In the present study, patients were divided into rectal and colon groups according to tumor location. The relationship between receiving or not receiving adjuvant chemotherapy and RCN3 immunohistochemical score was analyzed. The RCN3 immunohistochemical score was associated with overall survival in colon cancer patients receiving chemotherapy. This suggested that RCN3 predicted survival outcomes in different tumor site subgroups. Thus, RCN3 can also be used as a potential marker to predict chemotherapy sensitivity.
RCN3 is a promising molecular chaperone assisting in protein biosynthesis and transport in ER [14–17]. RCN3 is also related to the occurrence and development of tumors in the lung and cervical cancers [7,18]. According to the Uniprot database, GO analysis showed that RCN3 is closely related to the process of collagen fiber synthesis. It has also been reported that RCN3 deficiency in the alveolar epithelium exacerbates bleomycin-induced pulmonary fibrosis [19]. In human cardiac fibroblasts, RCN3 was identified as a novel negative mediator of collagen production. Moreover, as a member of the CREC protein family, RCN3 may gently cause intestinal malignancy by intervening with the cell secretion process or abnormal functioning as the molecular chaperone of the endothelial cells [3,6,17,20–22]. Further studies are warranted to explore possible mechanisms of the RCN3 in CRC.
There have been relevant studies on the expression of RCN3 in CRC, however, the research on the correlation between the two and their combined effect on the CRC prognosis was lacking. Our study is the first to propose that RCN3 is involved in the early occurrence and development of CRC and its role in accurately predicting the prognosis and facilitating the screening of subgroups of patients. In addition, from a therapeutic point of view, the increased expression level of RCN3 may have an indicative effect on the prognosis of tumor patients. Therefore, an in-depth understanding of the role of RCN3 CRC will help adopt various strategies from multiple perspectives to improve the prognosis and survival level, which aligns with the concept of multidisciplinary comprehensive CRC treatment. Further mechanistic studies may provide a depth understanding of CRC prognosis.
Author Contributions: MSZ and ZXM contributed to data analysis, interpretation, and manuscript writing. WJC and XC were responsible for the experimental design and carrying out the experiments. FAC, MNX, and XLH performed data acquisition. JKS, WJC, and WZ conceived the study, supervised, and secured funding. All authors contributed to the article and approved the submitted version.
Ethics Approval and Informed Consent Statement: The ethics committee of Changhai Hospital ruled that no formal ethics approval was required in this particular case. The study was performed in accordance with the Declaration of Helsinki.
Funding Statement: This work was supported by the National Natural Science Foundation of China (82072750, 81972302), the Natural Science Fund of Shanghai (20ZR1457200), and the Shanghai Sailing Program (21YF1459300).
Conflicts of Interest: The authors declare that the research was conducted in the absence of any commercial or financial relationships that could be construed as a potential conflict of interest.
References
1. Honoré, B. (2009). The rapidly expanding CREC protein family: Members, localization, function, and role in disease. BioEssays, 31(3), 262–277. DOI 10.1002/bies.200800186. [Google Scholar] [CrossRef]
2. Park, N., Shetye, S., Bogush, I., Keene, D., Tufa, S. et al. (2021). Reticulocalbin 3 is involved in postnatal tendon development by regulating collagen fibrillogenesis and cellular maturation. Scientific Reports, 11(1), 10868. DOI 10.1038/s41598-021-90258-8. [Google Scholar] [CrossRef]
3. Zhou, Y., Bian, S., Zhou, X., Cui, Y., Wang, W. et al. (2020). Single-cell multiomics sequencing reveals prevalent genomic alterations in tumor stromal cells of human colorectal cancer. Cancer Cell, 38(6), 818–828.e815. DOI 10.1016/j.ccell.2020.09.015. [Google Scholar] [CrossRef]
4. Hagedorn, M., Siegfried, G., Hooks, K., Khatib, A. (2016). Integration of zebrafish fin regeneration genes with expression data of human tumors in silico uncovers potential novel melanoma markers. Oncotarget, 7(44), 71567–71579. DOI 10.18632/oncotarget.12257. [Google Scholar] [CrossRef]
5. Hou, Y., Li, Y., Gong, F., Jin, J., Huang, A. et al. (2016). A preliminary study on RCN3 protein expression in non-small cell lung cancer. Clinical Laboratory, 62(3), 293–300. [Google Scholar]
6. Drucker, K., Kitange, G., Kollmeyer, T., Law, M., Passe, S. et al. (2009). Characterization and gene expression profiling in glioma cell lines with deletion of chromosome 19 before and after microcell-mediated restoration of normal human chromosome 19. Genes, Chromosomes & Cancer, 48(10), 854–864. DOI 10.1002/gcc.20688. [Google Scholar] [CrossRef]
7. Ramírez-Torres, A., Gil, J., Contreras, S., Ramírez, G., Valencia-González, H. et al. (2022). Quantitative proteomic analysis of cervical cancer tissues identifies proteins associated with cancer progression. Cancer Genomics & Proteomics, 19(2), 241–258. DOI 10.21873/cgp.20317. [Google Scholar] [CrossRef]
8. Zheng, J., Cao, F., Huang, X., Ramen, K., Xu, X. et al. (2018). Eyes absent homologue 2 predicts a favorable prognosis in colorectal cancer. OncoTargets and Therapy, 11, 4661–4671. DOI 10.2147/OTT. [Google Scholar] [CrossRef]
9. Duraes, L., Steele, S., Valente, M., Lavryk, O., Connelly, T. et al. (2022). Right colon, left colon, and rectal cancer have different oncologic and quality of life outcomes. International Journal of Colorectal Disease, 37(4), 939–948. DOI 10.1007/s00384-022-04121-x. [Google Scholar] [CrossRef]
10. Tamas, K., Walenkamp, A., de Vries, E., van Vugt, M., Beets-Tan, R. et al. (2015). Rectal and colon cancer: Not just a different anatomic site. Cancer Treatment Reviews, 41(8), 671–679. DOI 10.1016/j.ctrv.2015.06.007. [Google Scholar] [CrossRef]
11. Kornmann, M., Staib, L., Wiegel, T., Kron, M., Henne-Bruns, D. et al. (2013). Long-term results of 2 adjuvant trials reveal differences in chemosensitivity and the pattern of metastases between colon cancer and rectal cancer. Clinical Colorectal Cancer, 12(1), 54–61. DOI 10.1016/j.clcc.2012.07.005. [Google Scholar] [CrossRef]
12. Glimelius, B. (2020). Adjuvant chemotherapy in rectal cancer: State of the art and future perspectives. Current Opinion in Oncology, 32(4), 377–383. DOI 10.1097/CCO.0000000000000641. [Google Scholar] [CrossRef]
13. Bregni, G., Akin Telli, T., Camera, S., Deleporte, A., Moretti, L. et al. (2020). Adjuvant chemotherapy for rectal cancer: Current evidence and recommendations for clinical practice. Cancer Treatment Reviews, 83(6), 101948. DOI 10.1016/j.ctrv.2019.101948. [Google Scholar] [CrossRef]
14. Liu, J., Yang, C., Zhang, H., Hu, W., Bergquist, J. et al. (2022). Quantitative proteomics approach reveals novel biomarkers and pathological mechanism of keloid. Proteomics. Clinical Applications, 16(4), e2100127. DOI 10.1002/prca.202100127. [Google Scholar] [CrossRef]
15. He, K., Kelly, T., Wang, H., Liang, J., Zhu, L. et al. (2022). Rare coding variants in RCN3 are associated with blood pressure. BMC Genomics, 23(1), 148. DOI 10.1186/s12864-022-08356-4. [Google Scholar] [CrossRef]
16. Shi, X., An, X., Yang, L., Wu, Z., Zan, D. et al. (2021). Reticulocalbin 3 deficiency in alveolar epithelium attenuated LPS-induced ALI via NF-κB signaling. American Journal of Physiology. Lung Cellular and Molecular Physiology, 320(4), L627–L639. DOI 10.1152/ajplung.00526.2020. [Google Scholar] [CrossRef]
17. Zhang, Q., Wang, T., Jin, J., Shi, X., Huang, A. et al. (2021). Rcn3 suppression was responsible for partial relief of emphysema as shown by specific type II alveolar epithelial cell Rcn3 CKO mouse model. International Journal of Chronic Obstructive Pulmonary Disease, 16, 147–158. DOI 10.2147/COPD.S272711. [Google Scholar] [CrossRef]
18. Jin, J., Li, Y., Ren, J., Man Lam, S., Zhang, Y. et al. (2016). Neonatal respiratory failure with retarded perinatal lung maturation in mice caused by reticulocalbin 3 disruption. American Journal of Respiratory Cell and Molecular Biology, 54(3), 410–423. DOI 10.1165/rcmb.2015-0036OC. [Google Scholar] [CrossRef]
19. Jin, J., Shi, X., Li, Y., Zhang, Q., Guo, Y. et al. (2018). Reticulocalbin 3 deficiency in alveolar epithelium exacerbated bleomycin-induced pulmonary fibrosis. American Journal of Respiratory Cell and Molecular Biology, 59(3), 320–333. DOI 10.1165/rcmb.2017-0347OC. [Google Scholar] [CrossRef]
20. Xu, M., Che, L., Yang, Z., Zhang, P., Shi, J. et al. (2017). Proteomic analysis of fetal ovaries reveals that primordial follicle formation and transition are differentially regulated. BioMed Research International, 2017(2), 6972030. DOI 10.1155/2017/6972030. [Google Scholar] [CrossRef]
21. Li, Y., Liang, Q., Wen, Y., Chen, L., Wang, L. et al. (2010). Comparative proteomics analysis of human osteosarcomas and benign tumor of bone. Cancer Genetics and Cytogenetics, 198(2), 97–106. DOI 10.1016/j.cancergencyto.2010.01.003. [Google Scholar] [CrossRef]
22. Rasaputra, K., Liyanage, A., Lay, J., McCarthy, F., Rath, N. (2010). Tibial dyschondroplasia-associated proteomic changes in chicken growth plate cartilage. Avian Diseases, 54(4), 1166–1171. DOI 10.1637/9384-050110-Reg.1. [Google Scholar] [CrossRef]
Cite This Article
 Copyright © 2022 The Author(s). Published by Tech Science Press.
This work is licensed under a Creative Commons Attribution 4.0 International License , which permits unrestricted use, distribution, and reproduction in any medium, provided the original work is properly cited.
 Downloads
 Citation Tools