| Oncologie |
DOI: 10.32604/oncologie.2022.022838
ARTICLE
The Transcriptional and Immunological Roles of Six2 in Clear Cell Renal Cell Carcinoma
1The Ministry of Education Key Laboratory of Laboratory Medical Diagnostics, College of Laboratory Medicine, Chongqing Medical University, Chongqing, 400016, China
2Department of Laboratory Medicine, Women and Children’s Hospital of Chongqing Medical University, Chongqing, 400016, China
*Corresponding Authors: Tao Song. Email: CQSFYsongtao@163.com; Qianyin Li. Email: liqianyin904@cqmu.edu.cn
Received: 28 March 2022; Accepted: 25 May 2022
Abstract: Background: Six2, a transcription factor, exerts an oncogenic role in clear cell renal cell carcinoma (ccRCC). Increased Six2 expression could enhance cancer metastasis. However, the regulatory mechanism of Six2 in promoting metastasis remains unclear. The purpose of this study is to analyze the regulatory pattern of Six2 and the potential role of Six2 in the tumor immune microenvironment. Materials and Methods: Firstly, transcriptional data in TCGA-KIRC cohorts was used to analyze the relationship between Six2 expression and clinical information. Secondly, we detect the association between Six2 and the tumor immune microenvironment in ccRCC. Then, we analyzed Six2-related differentially expressed genes (DEGs) and constructed a prognostic model using the Lasso-Cox algorithm by integrating Six2 ChIP data and co-expressed genes. Next, we analyzed the clinical significance and immunotherapy sensitivity of this model. Results: Six2 was overexpressed in RCC cells compared with normal kidney cells and upregulated Six2 was positively linked with clinical stage, grade, T stage, M stage, and poor survival. And Six2 was correlated with the remodeling of the tumor microenvironment. Potential downstream effectors and biological functions regulated by Six2 were identified using in silico analysis. Meanwhile, a risk model based on 8 Six2 target genes was established to classify ccRCC patients into high-and-low risk groups. This risk model showed a reliable ability to forecast the overall survival of ccRCC patients and predict the susceptibility to immunotherapy. Conclusions: Our findings provide a promising prognostic indicator for ccRCC patients and help better understand the transcriptional and immunological role of Six2 in ccRCC.
Keywords: Six2; ccRCC; TCGA; tumor immune environment
Renal cell carcinoma (RCC) is one of the 10 most common cancers in both sexes, accounting for about 4% of human malignancies. An expected 76,080 new cases of kidney & renal pelvis cancer and 13780 deaths from these diseases were predicted in the United States in 2021 [1]. RCC is classified into different pathological groups according to genomic and clinical features, with clear cell RCC (ccRCC) being the most common subtype [2]. Although the therapy landscape is improving by introducing targeted treatment and immunotherapy, approximately one-quarter of patients receiving nephrectomy finally show disease relapse and metastasis. However, few reliable genetic biomarkers indicate treatment outcomes in both localized and metastatic tumors [3,4]. Therefore, RCC-specific diagnostic biomarkers for early detection and tumor progression monitoring are highly needed in the clinical management of RCC patients [5].
Transcription factor Six2 plays a pivotal role in maintaining the mesenchymal progenitor population as undifferentiated (MET) [6,7]. Recent studies found that Six2 promotes metastasis by decreasing E-cadherin to facilitate epithelial-mesenchymal transition (EMT) and upregulating SOX2 and NANOG expression to enable metastatic tumor colonization [8,9]. Apart from the metastatic ability of carcinoma cells, it is also well-established that cancer metastasis frequently accompanies the deposition and remodeling of the extracellular matrix, an important component of the tumor microenvironment [10]. However, the potential role of Six2 in the immune microenvironment remains unclear. Although several downstream targets of Six2 were identified, there is still an urgent need to better understand the additional target genes regulated by Six2.
In this study, we discovered that Six2 expression showed a significant increase in ccRCC cells, and abnormal expression of Six2 was correlated with worse clinical outcomes and immune environment. Then, Gene Ontology (GO), Kyoto Encyclopedia of Genes (KEGG), and Gene set enrichment analysis (GSEA) of Six2-related DEGs were performed. Next, we integrated Six2-associated DEGs, ChIP-seq data from the GTRD database, and co-expression genes of Six2 to generate a prognostic model. After validation of this model, we assessed its susceptibility to immunotherapy. Our data provided a comprehensive analysis of the potential regulatory network and immunological role of Six2. The workflow diagram is depicted in Fig. S1.
2.1 Patient Sample Collection and Processing
Transcriptome data (FPKM) and clinical and pathological information for KIRC were downloaded from The Cancer Genome Atlas (TCGA) public database, which includes 72 normal samples and 539 tumor samples. All RNA-seq data were normalized before analysis.
The relationship between the Six2 expression level and clinic-pathological information, including TNM stage and Fuhrman grade, was analyzed and visualized by R. The survival data and survival curve were analyzed by R software (version 3.6.3) using survival package. Cancer samples were separated into two groups according to Six2 median mRNA level: Low (lower than median expression level) and high (higher than median expression level). R packages (survival, survminer) were utilized to establish KM survival curves.
2.2 Six2-Related Differentially Expressed Genes (DEGs)
RNA expression data was divided into two degrees by Six2 median expression levels: High (263) and low (263). Then DEGs between high and low groups were identified by package limma in Rstudio. The adjust p < 0.05 and |FC| > 1.2 were seen as DEGs. Packages ggpubr, ggthemes mapped volcano plot and heatmap of Six2-related DEGs.
2.3 Immune Microenvironment Analysis
The stromal score, immune score, and estimate score were analyzed by the Estimate R package. CIBERSORT (https://cibersort.stanford.edu/) was used to quantify the relative proportion of human immune cells. The correlation analysis detected the potential immune cells affected by Six2.
Subsequently, gene ontology (GO), including biological process (BP), cellular component (CC), and molecular function (MF), KEGG pathway, Gene set enrichment analysis (GSEA) for DEGs were performed in R using R packages “clusterprofiler.” R package ggplot2 was used for graphical plotting.
2.5 CHIP Data Collection and Screening Core Genes
The target genes of Six2 were projected based on The Gene Transcription Regulation Database (GTRD; http://gtrd.biouml.org/) [11]. Cytoscape was used to visualize the network of Six2 target genes. We obtained the highly correlated genes by analyzing the Pearson correlation coefficient in TCGA KIRC samples. Then the shared genes among DEGs (|FC| > 1.2), co-expressed genes (|correlation coefficient| > 0.2, p < 0.05), and Six2 potential regulating genes were selected to further model construction.
2.6 Six2-Related Risk Model Construction and Validation
The 48 core genes were used for establishing a risk score model. The lasso-Cox regression algorithm was employed to narrow down the number of candidate genes. R “glmnet” package was utilized to decide the Lasso-Cox coefficients of constructed nine-gene model. TCGA datasets were divided into two groups equally for training sessions and testing sessions to examine the robustness of this model. The risk score of each ccRCC patient was calculated based on our equation. Then, the KIRC samples were assigned to high or low-risk groups according to the median risk score. KM survival and ROC curves were done in R software. R package “rms” was utilized to generate a scoring nomogram to assess the risk status of patients. The Cancer Immunome Atlas (TCIA, https://tcia.at/) provides the results of immunophenoscore (IPS) of KIRC patients.
2.7 Cell Culture and Antibodies
HEK293T, HK2, and 786-O cells were cultured in Dulbecco’s Modified Eagle Medium (DMEM), DMEM/F12 -Dulbecco’s Modified Eagle Medium: F-12, RMPI 1640 medium (Gibco, Carlsbad, CA, USA), respectively. 10% fetal bovine serum (ExCell Bio, China) and 1% penicillin/streptomycin (PS) (Invitrogen, Grand Island, NY, USA) were added to these media. The cells mentioned above were grown at 37°C in an incubator with 5% CO2.
Cells were lysed in 1% SDS lysis buffer and transferred into 1.5 ml eppendorf tubes for 10-min boiling at 95°C. Lysates were centrifuged at 12,000 rpm, at RT for 10 min, and the supernatants were collected. Then BCA Kit was used to determine the concentration of each sample. The proteins (10 μg each sample) were separated on 10% SDS-PAGE. Gels were electrically transferred to the PVDF membrane and blocked with 5% skim milk diluted in TBST. All blots were incubated with prim y antibodies anti-Six2 (Proteintech) and anti-Tubulin (TRANSGEN) at 4°C overnight. After washing with TBST, the corresponding HRP-conjugated secondary antibodies were applied to detect proteins. The signals were visualized by ECL Reagents (Merck, Billerica, MA, USA).
2.9 The Human Protein Atlas(HPA)
The Human Protein Atlas (https://HumanProteinAtlasproteinatlas.org/) provides a large amount of omics data by integrating proteomics, transcriptomics, and pathology data. This database contains pathology information from 20 different common cancer types. In this study, the protein expression of CKAP4, CUBN, IQGAP2, SLC12A8, and SLC47A1 were downloaded from the Human Protein Atlas.
Chi-squared test was applied to compare the differences in clinical information. Differences in overall survival (OS), disease-specific survival (DSS), and progression-free interval (PFI) were determined by Kaplan–Meier and the log-rank test. R “timeROC” package plotted the receiver operating characteristic (ROC) curves. The effectiveness of the risk score for predicting OS was assessed by the section under the ROC curve. Two-sided p-values with p < 0.05 were viewed as statistically significant. Data processing, analysis, and plot were performed in R software and GraphPad Prism 8.
3.1 Correlation Between Six2 Expression and Clinicopathological Characteristics in ccRCC
To determine the Six2 expression pattern in ccRCC, we detected Six2 protein expression levels in 293T, HK2, and 786-O cells. Higher Six2 expression was observed in 293T and 786-O cells compared with that of HK2 cells (Fig. 1A). Then the impact of Six2 on prognosis in TCGA cohorts was evaluated. It suggested that elevated Six2 expression remarkably predicted poor overall survival, disease-specific survival, and progression-free interval (Figs. 1B–1D).
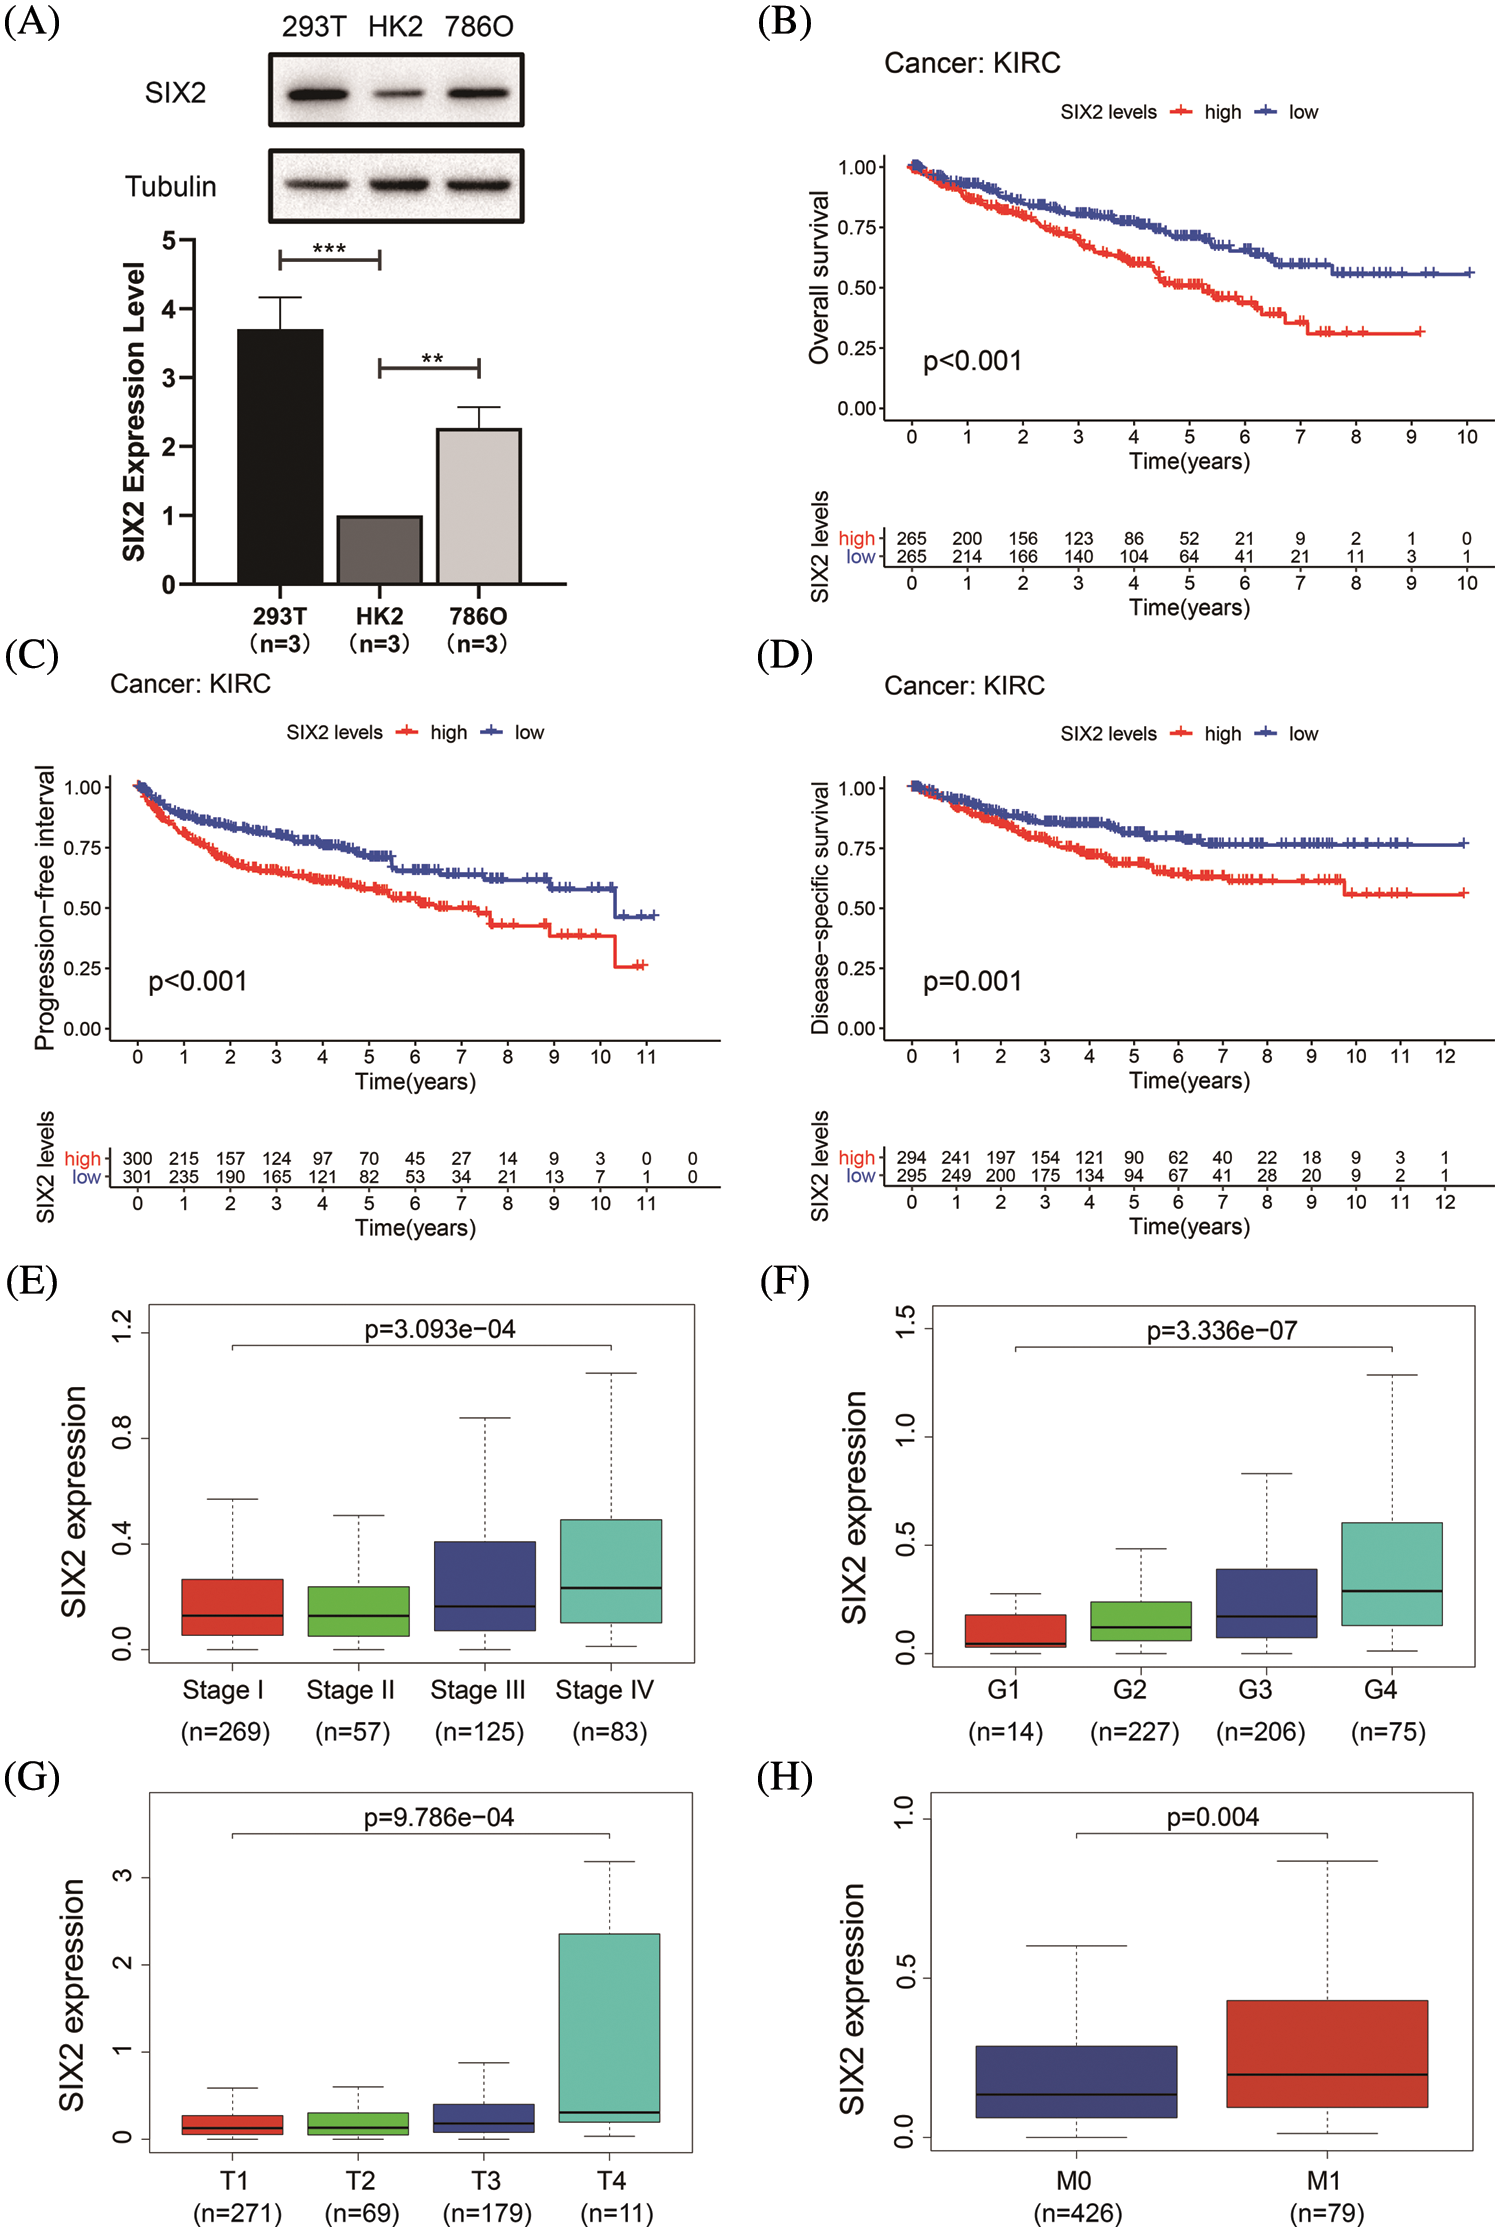
Figure 1: Six2 expression pattern and its clinical significance in ccRCC. (A) The Six2 expression level in 293T, HK2, and 786-O cells. *p < 0.05, **p < 0.01, ***p < 0.001 (B–D) Overall survival, progression-free interval, and disease-specific survival of Six2 expression for KIRC patients. (E–H) Six2 mRNA level in different clinical stage, grade, T stage and M stage
Next, we assessed the relations between Six2 expression and clinicopathological characteristics in TCGA datasets. It was found that the progression of the clinical stage, grade, T stage, and M stage of the tumor was in line with the Six2 expression increase (Figs. 1E–1H), which may indicate Six2 can be a potential biomarker of ccRCC.
3.2 Six2-Related Immune Cell Infiltration Analysis
To comprehensively understand the role of Six2, we also analyzed the role of Six2 in the tumor microenvironment. The results showed that higher Six2 expression was correlated with higher stromal scores, immune scores, and estimate scores among ccRCC patients (Figs. 2A–2C). To be more specific, we then analyzed the immune cells’ differences in different Six2 expression groups (Fig. S2). We observed higher activated CD4 memory T cells, regulatory T cells, and M0 macrophages in the Six2 high expression group and lower M1 macrophages, resting Dendritic cells, and resting Mast cells in the Six2 low expression group (Fig. 2D).
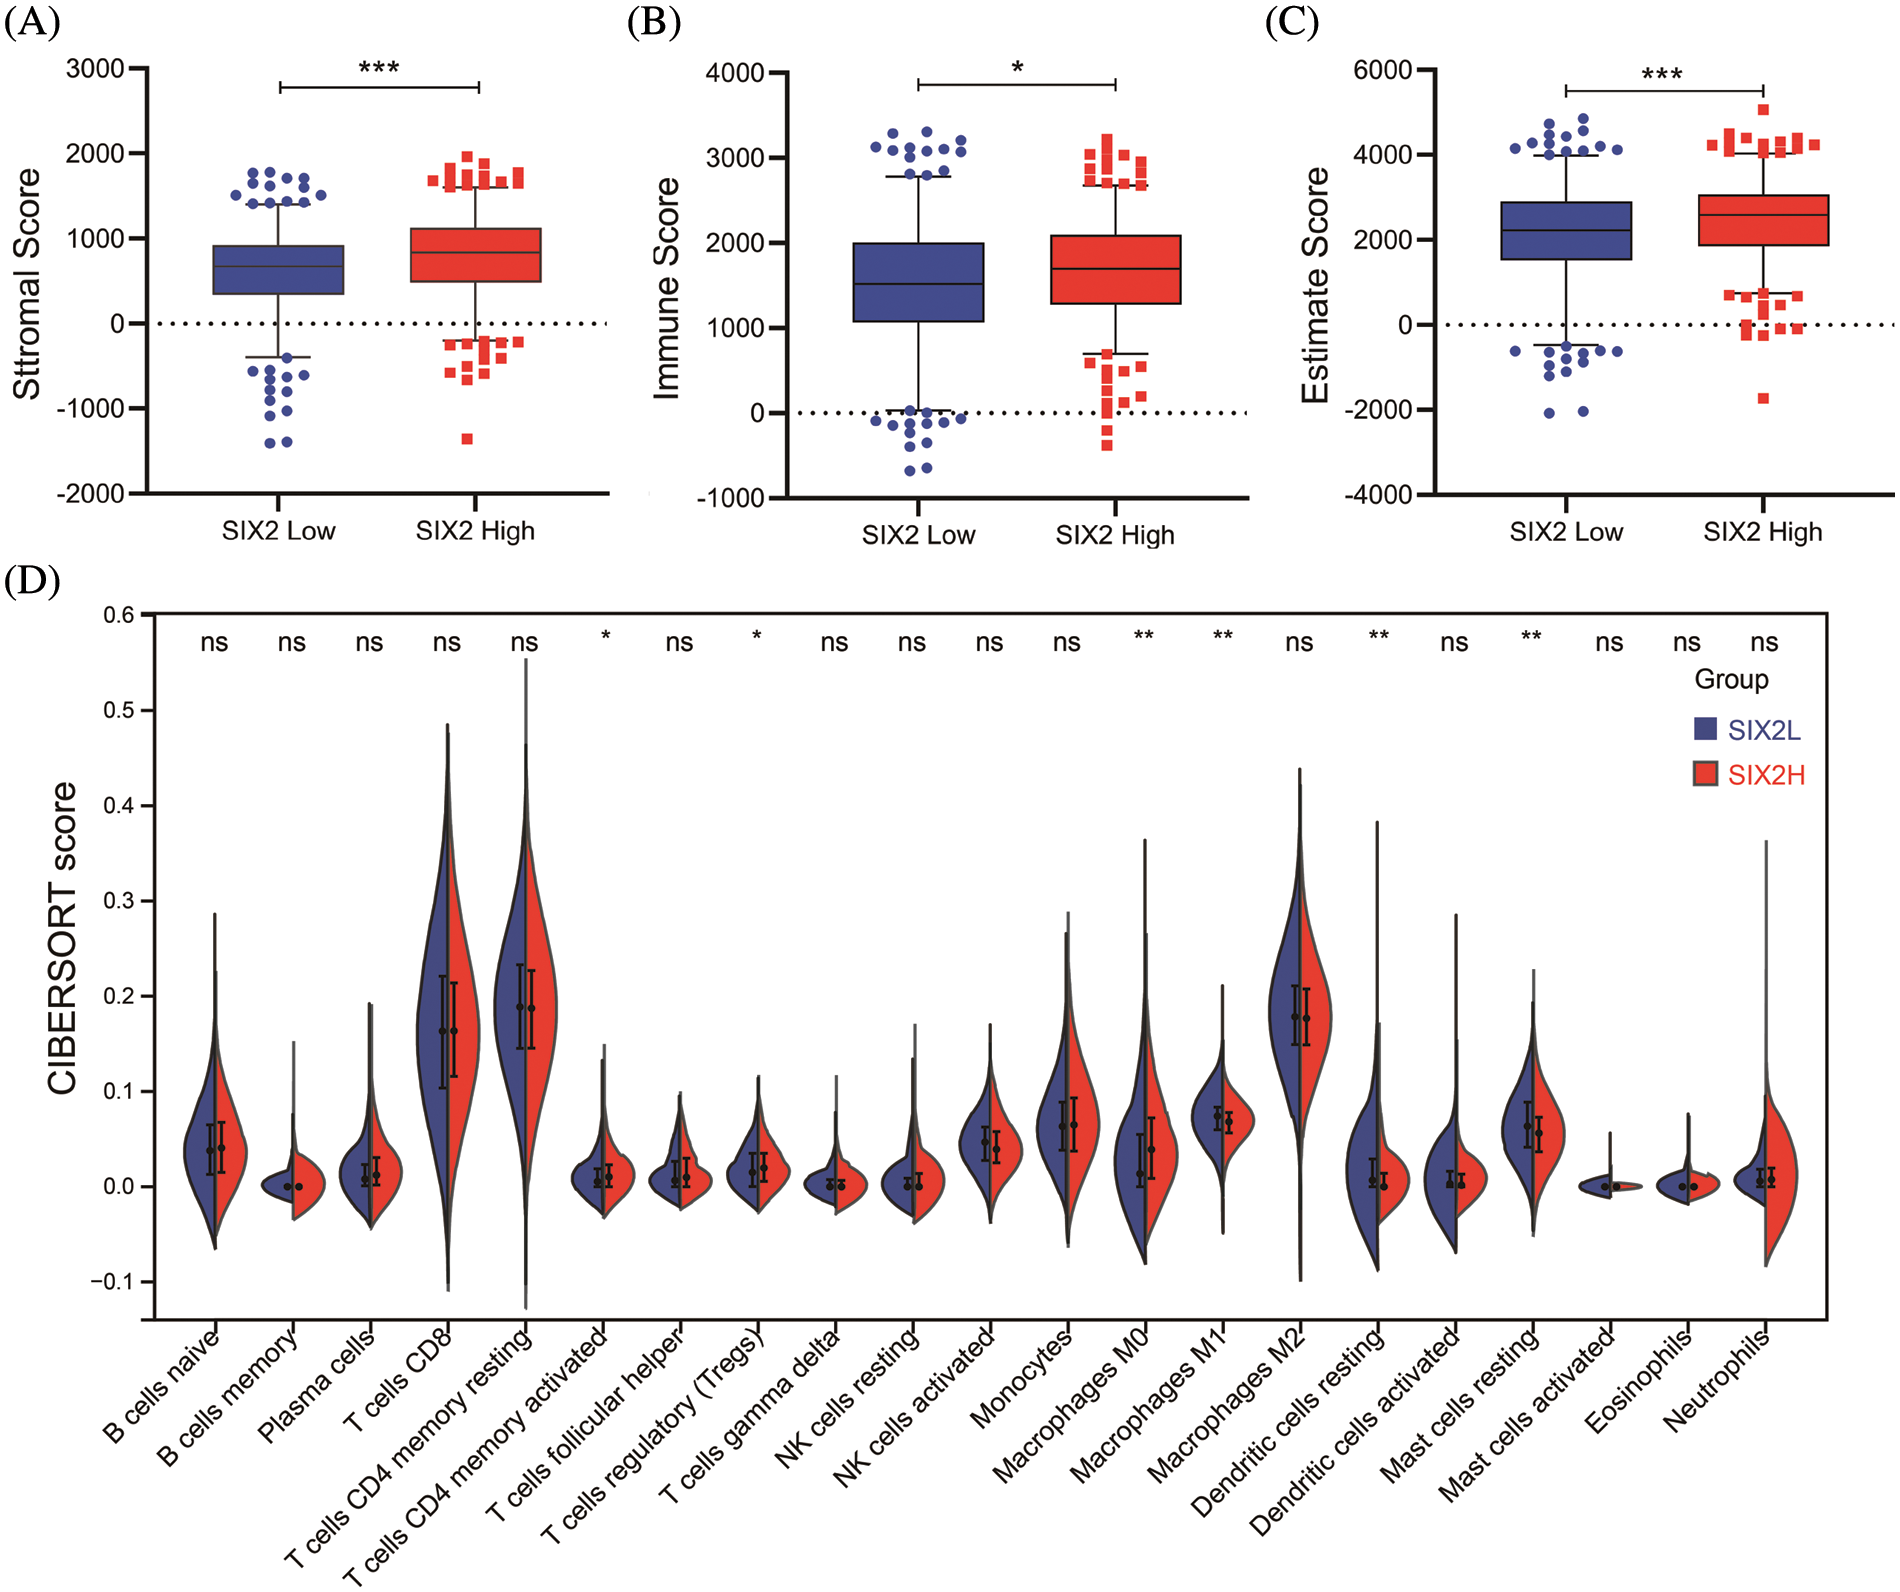
Figure 2: Six2 expression level was associated with immune microenvironment in KIRC. (A–C) StromalScore, ImmuneScore, and EstimateScore in different Six2 expression groups. (D) The CIBERSORT score of immune cells in Six2 high and low expression groups (ns, p ≥ 0.05, *p < 0.05, **p < 0.01, ***p < 0.001)
3.3 Identification of DEGs Based on the Six2 Expression Level
To find genes closely related to Six2, the tumor samples in TCGA-KIRC datasets were analyzed with limma package, and 796 DEGs (498 up-regulated genes and 298 down-regulated genes) were identified from Six2 high and low expression groups. The heatmap and volcano map displaying DEGs wereshown in Figs. 3A, 3B. Then, we performed GO and KEGG pathway analysis to clarify the function of Six2 in ccRCC. GO analysis suggested that these DEGs mainly participated in extracellular structure organization, extracellular matrix, and leukocyte migration. For molecular function (MF), Six2 was significant in functions associated with extracellular matrix structural constituent, glycosaminoglycan binding, and heparin binding. The following terms related to cellular component (CC) were mainly enriched in collagen-containing extracellular matrix, apical part of cell, and endoplasmic reticulum lumen (Fig. 3C). Furthermore, the following KEGG enrichment results included PI3K-Akt signaling pathway, cytokine-cytokine receptor interaction, tight junction, and ECM-receptor interaction (Fig. 3D). GSEA analysis for Six2 showed that Six2 was involved in angiogenesis, apical junction, epithelial-mesenchymal transition, hypoxia, ECM regulators, extracellular matrix organization, ECM-receptor interaction, and cytokine-cytokine receptor interaction (Fig. 3E).
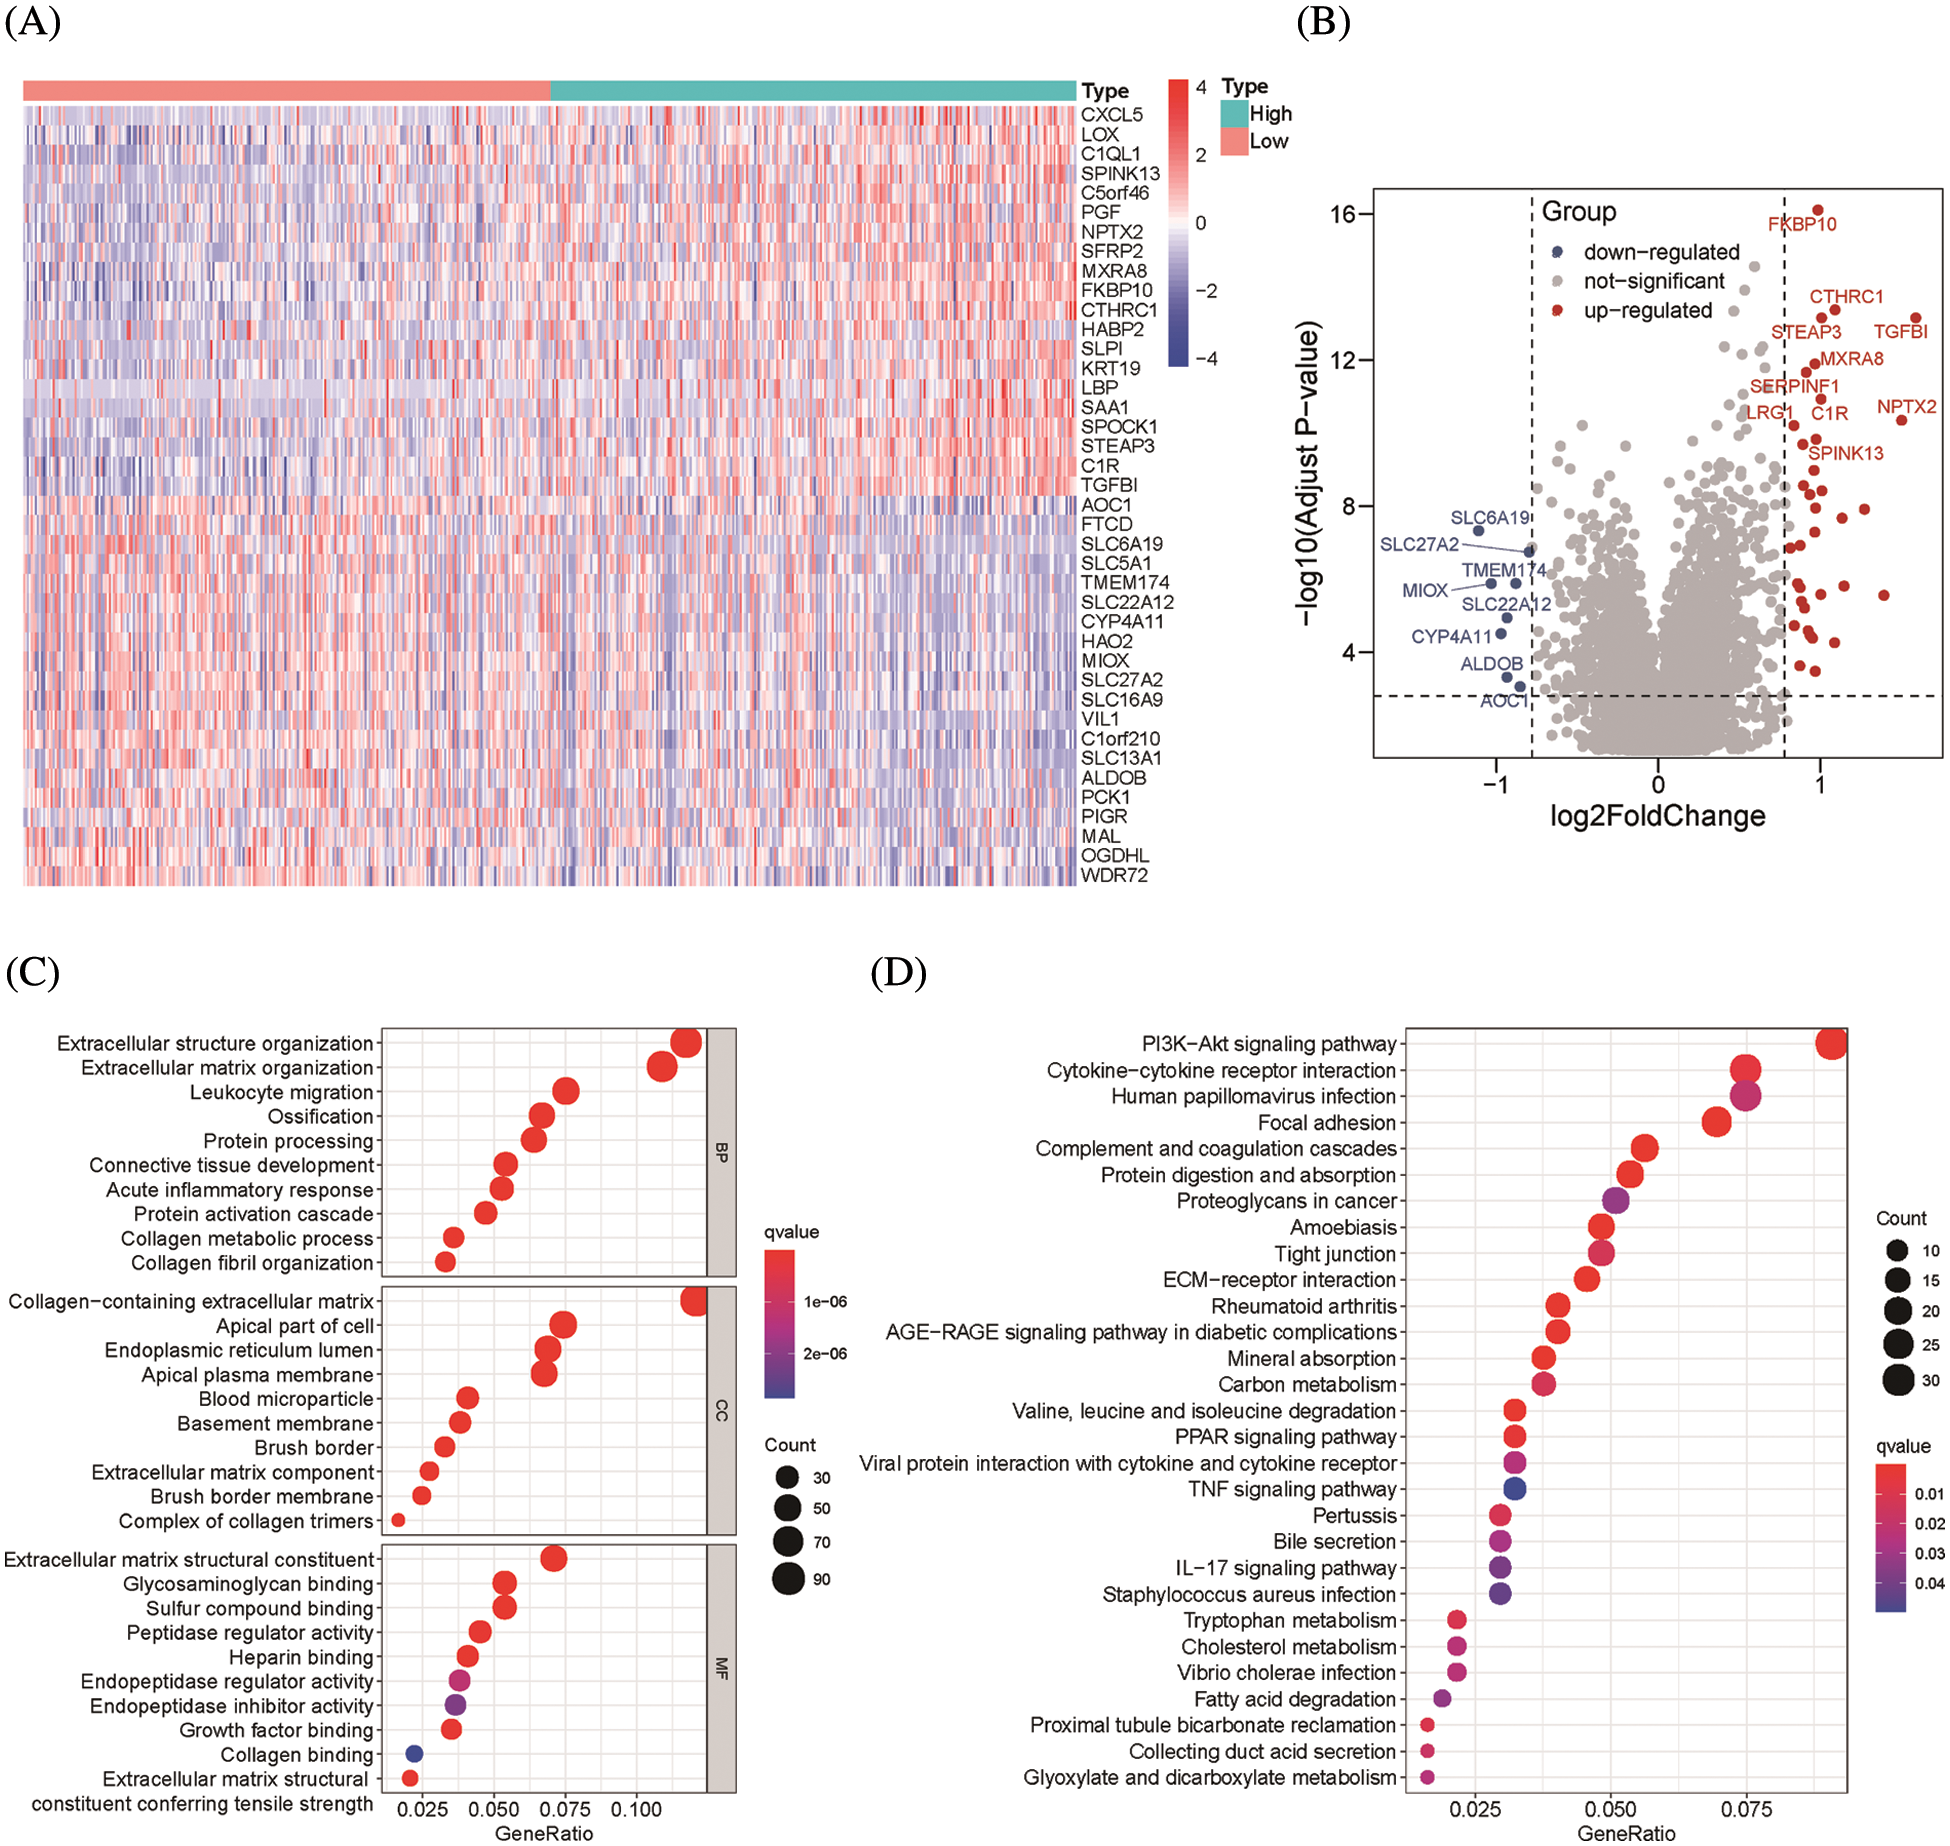
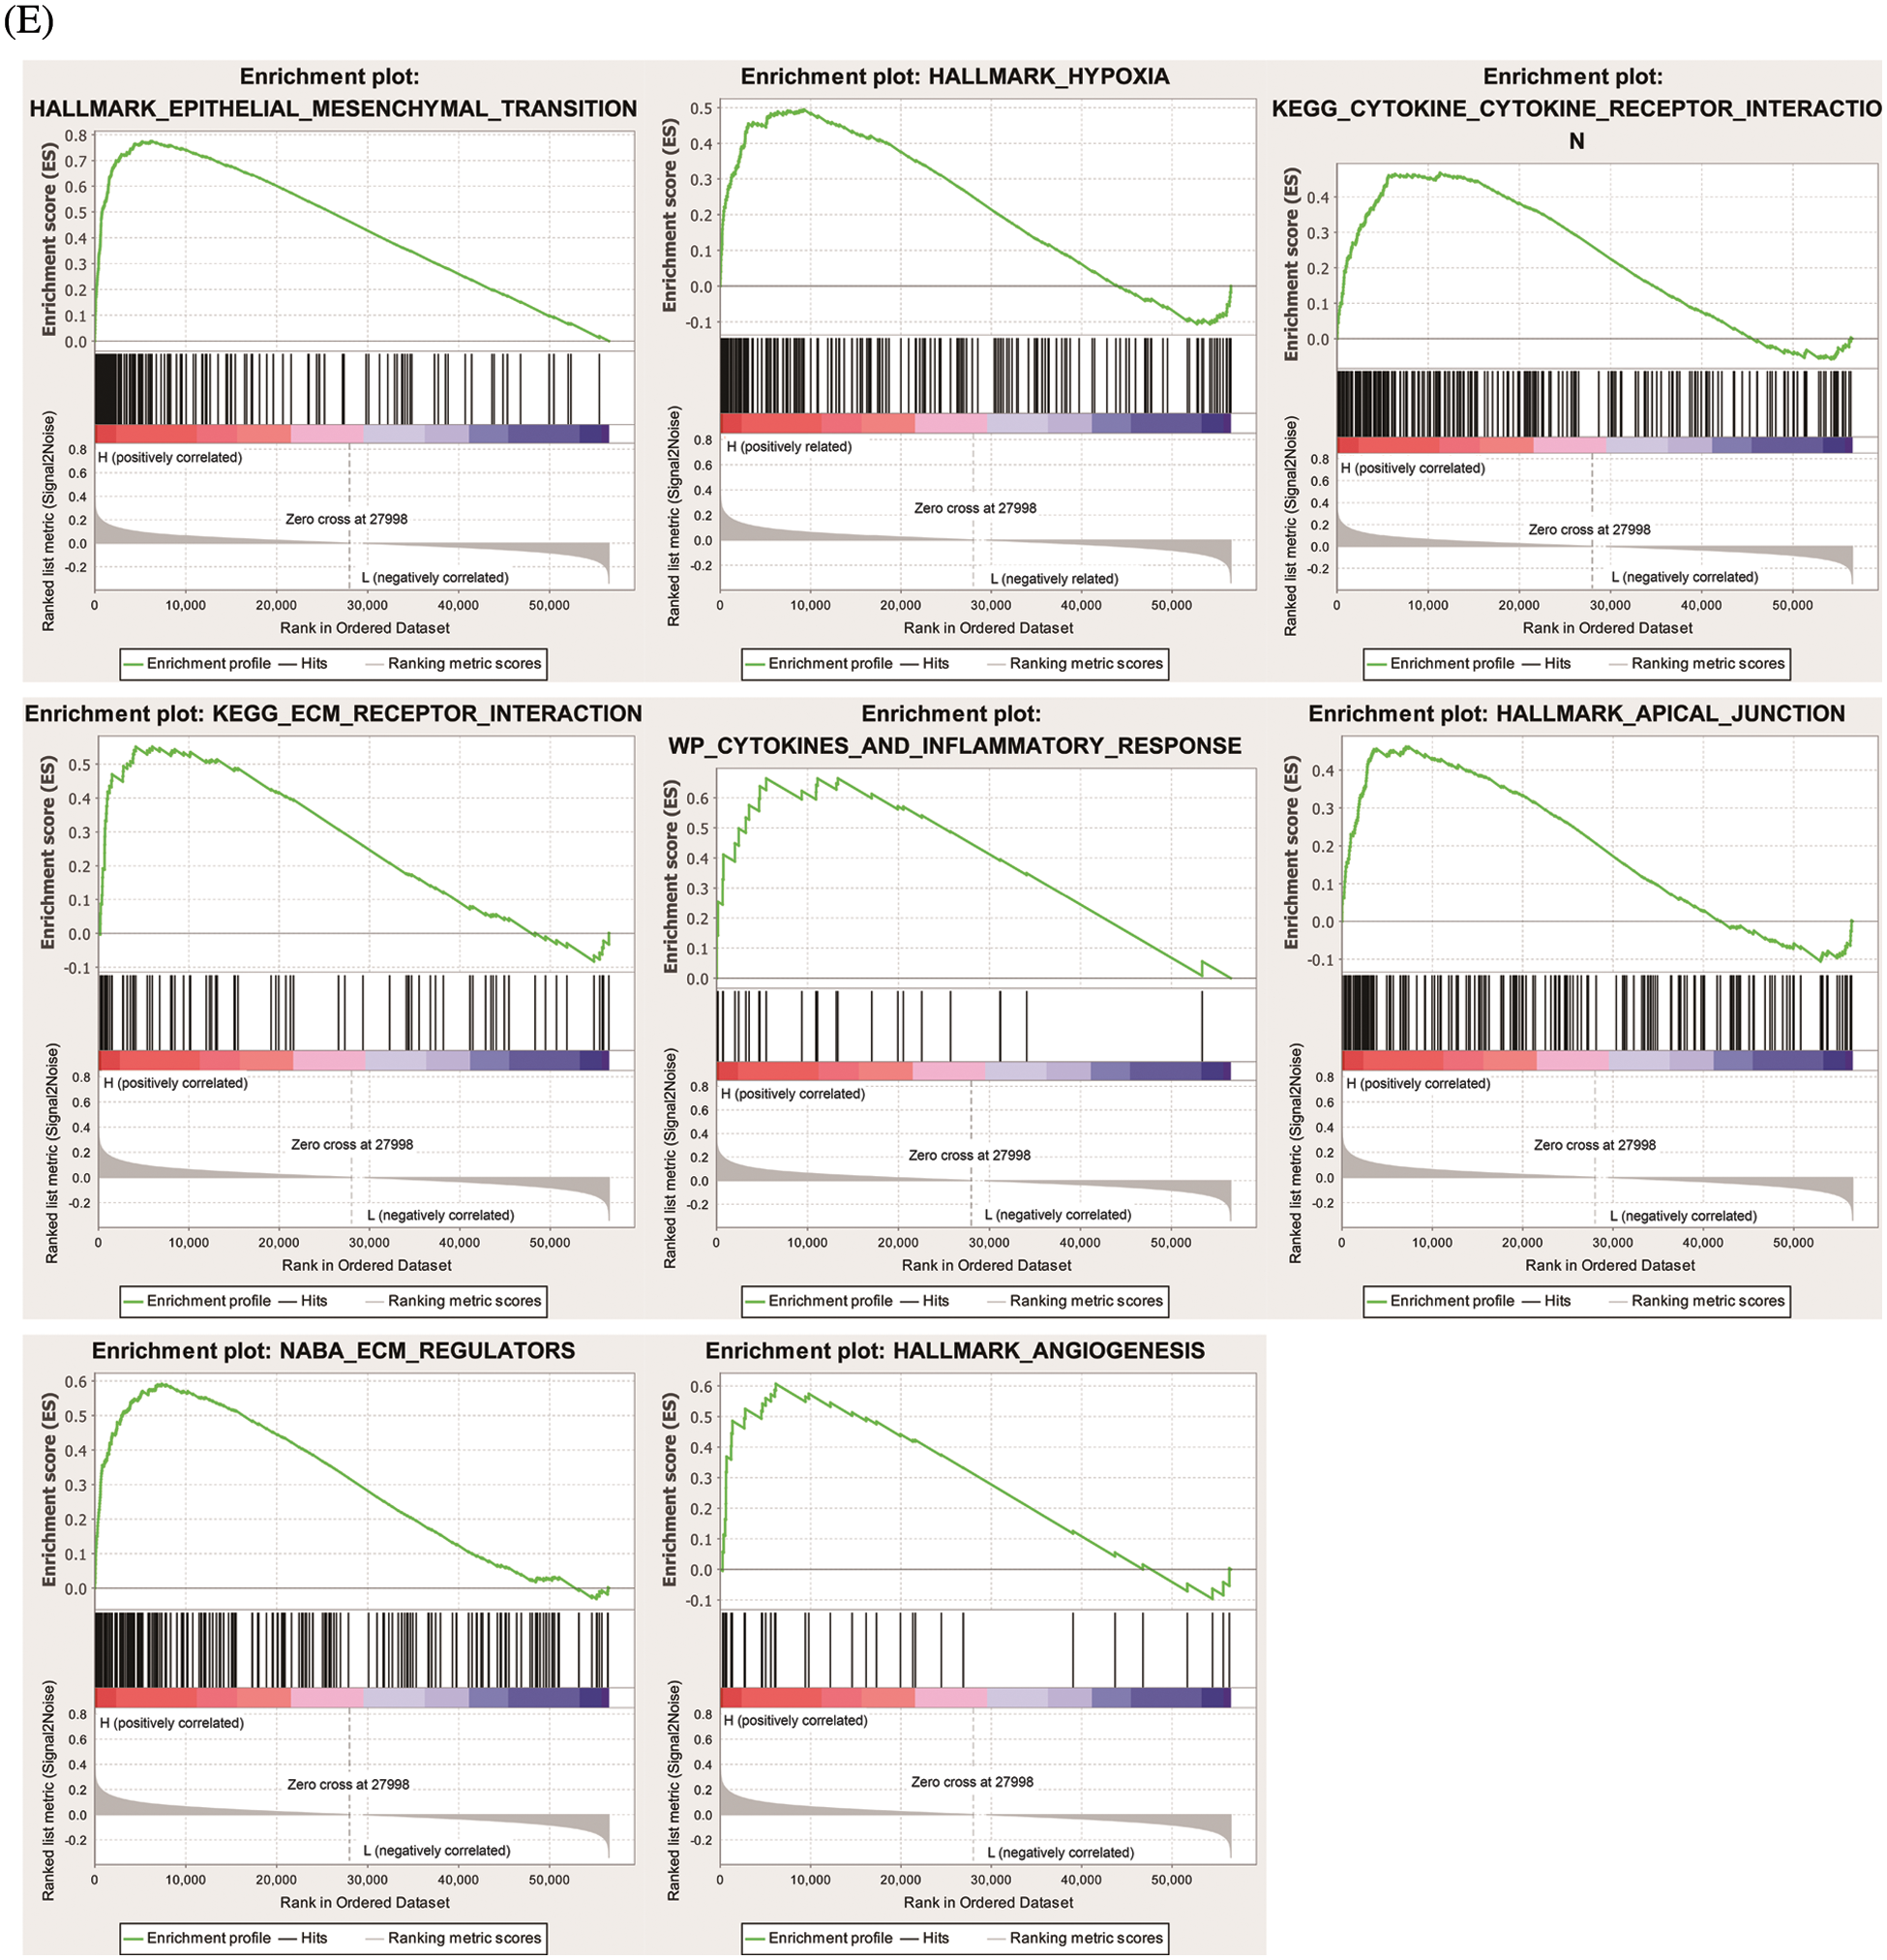
Figure 3: Functional enrichment of Six2-related DEGs. (A, B) Heatmap and volcano plot of DEGs in Six2 high and low expression group. (C, D) GO and KEGG analysis of DEGs. (E) Significantly related KEGG pathways and hallmark pathways using GSEA in ccRCC
3.4 Construction and Validation of an Integrated-Gene Signature Model
ChIP-seq is a technique for understanding transcriptional regulation. To fully understand the regulatory patterns of Six2, we obtained Six2 ChIP-seq data from GTRD (Fig. 4A) and used R studio to analyze co-expressed genes of Six2 (Fig. S3A). Then, 48 genes were selected for Lasso-Cox regression analysis to produce the optimal model (Fig. 4B). An eight-gene risk signature was generated, and the risk score of every sample was figured out based on mRNA levels of eight Six2-related genes: Risk score = 0.0871348 * CLMP + 0.0420739 * CKAP4 + 0.0962748 * COL22A1 + 0.1474064 * SLC12A8–0.3146996 * MOB3B-0.0329607 * IQGAP2-0.0853117 * CUBN−0.0955748 * SLC47A1. And the survival curves, sitecount (TF binding sites in promoter region), and immunochemistry results of these genes were depicted in Figs. S3B, S3C, and Fig. S4A. KIRC samples were classified into low-and high-risk groups formulated on the median value of the risk score. Figs. 4C–4E displayed the expression profile of prognostic genes, risk patterns, and survival status between the high-and low-risk groups. It was also presented that patients in the high-risk group had a worse clinical outcome than the low-risk groups (Figs. 4G, 4H). To further assess the prognostic value of the risk subgroup in KIRC patients, we performed univariate and multivariate analyses and found out the risk score could be an independent risk factor in ccRCC (Fig. 5A). Furthermore, the clinicopathologic information was also analyzed between high-and low-risk groups. It was shown that the low-risk group has better OS than that of the high-risk group in terms of age, gender, stage, and tumor stage (Fig. 5B).
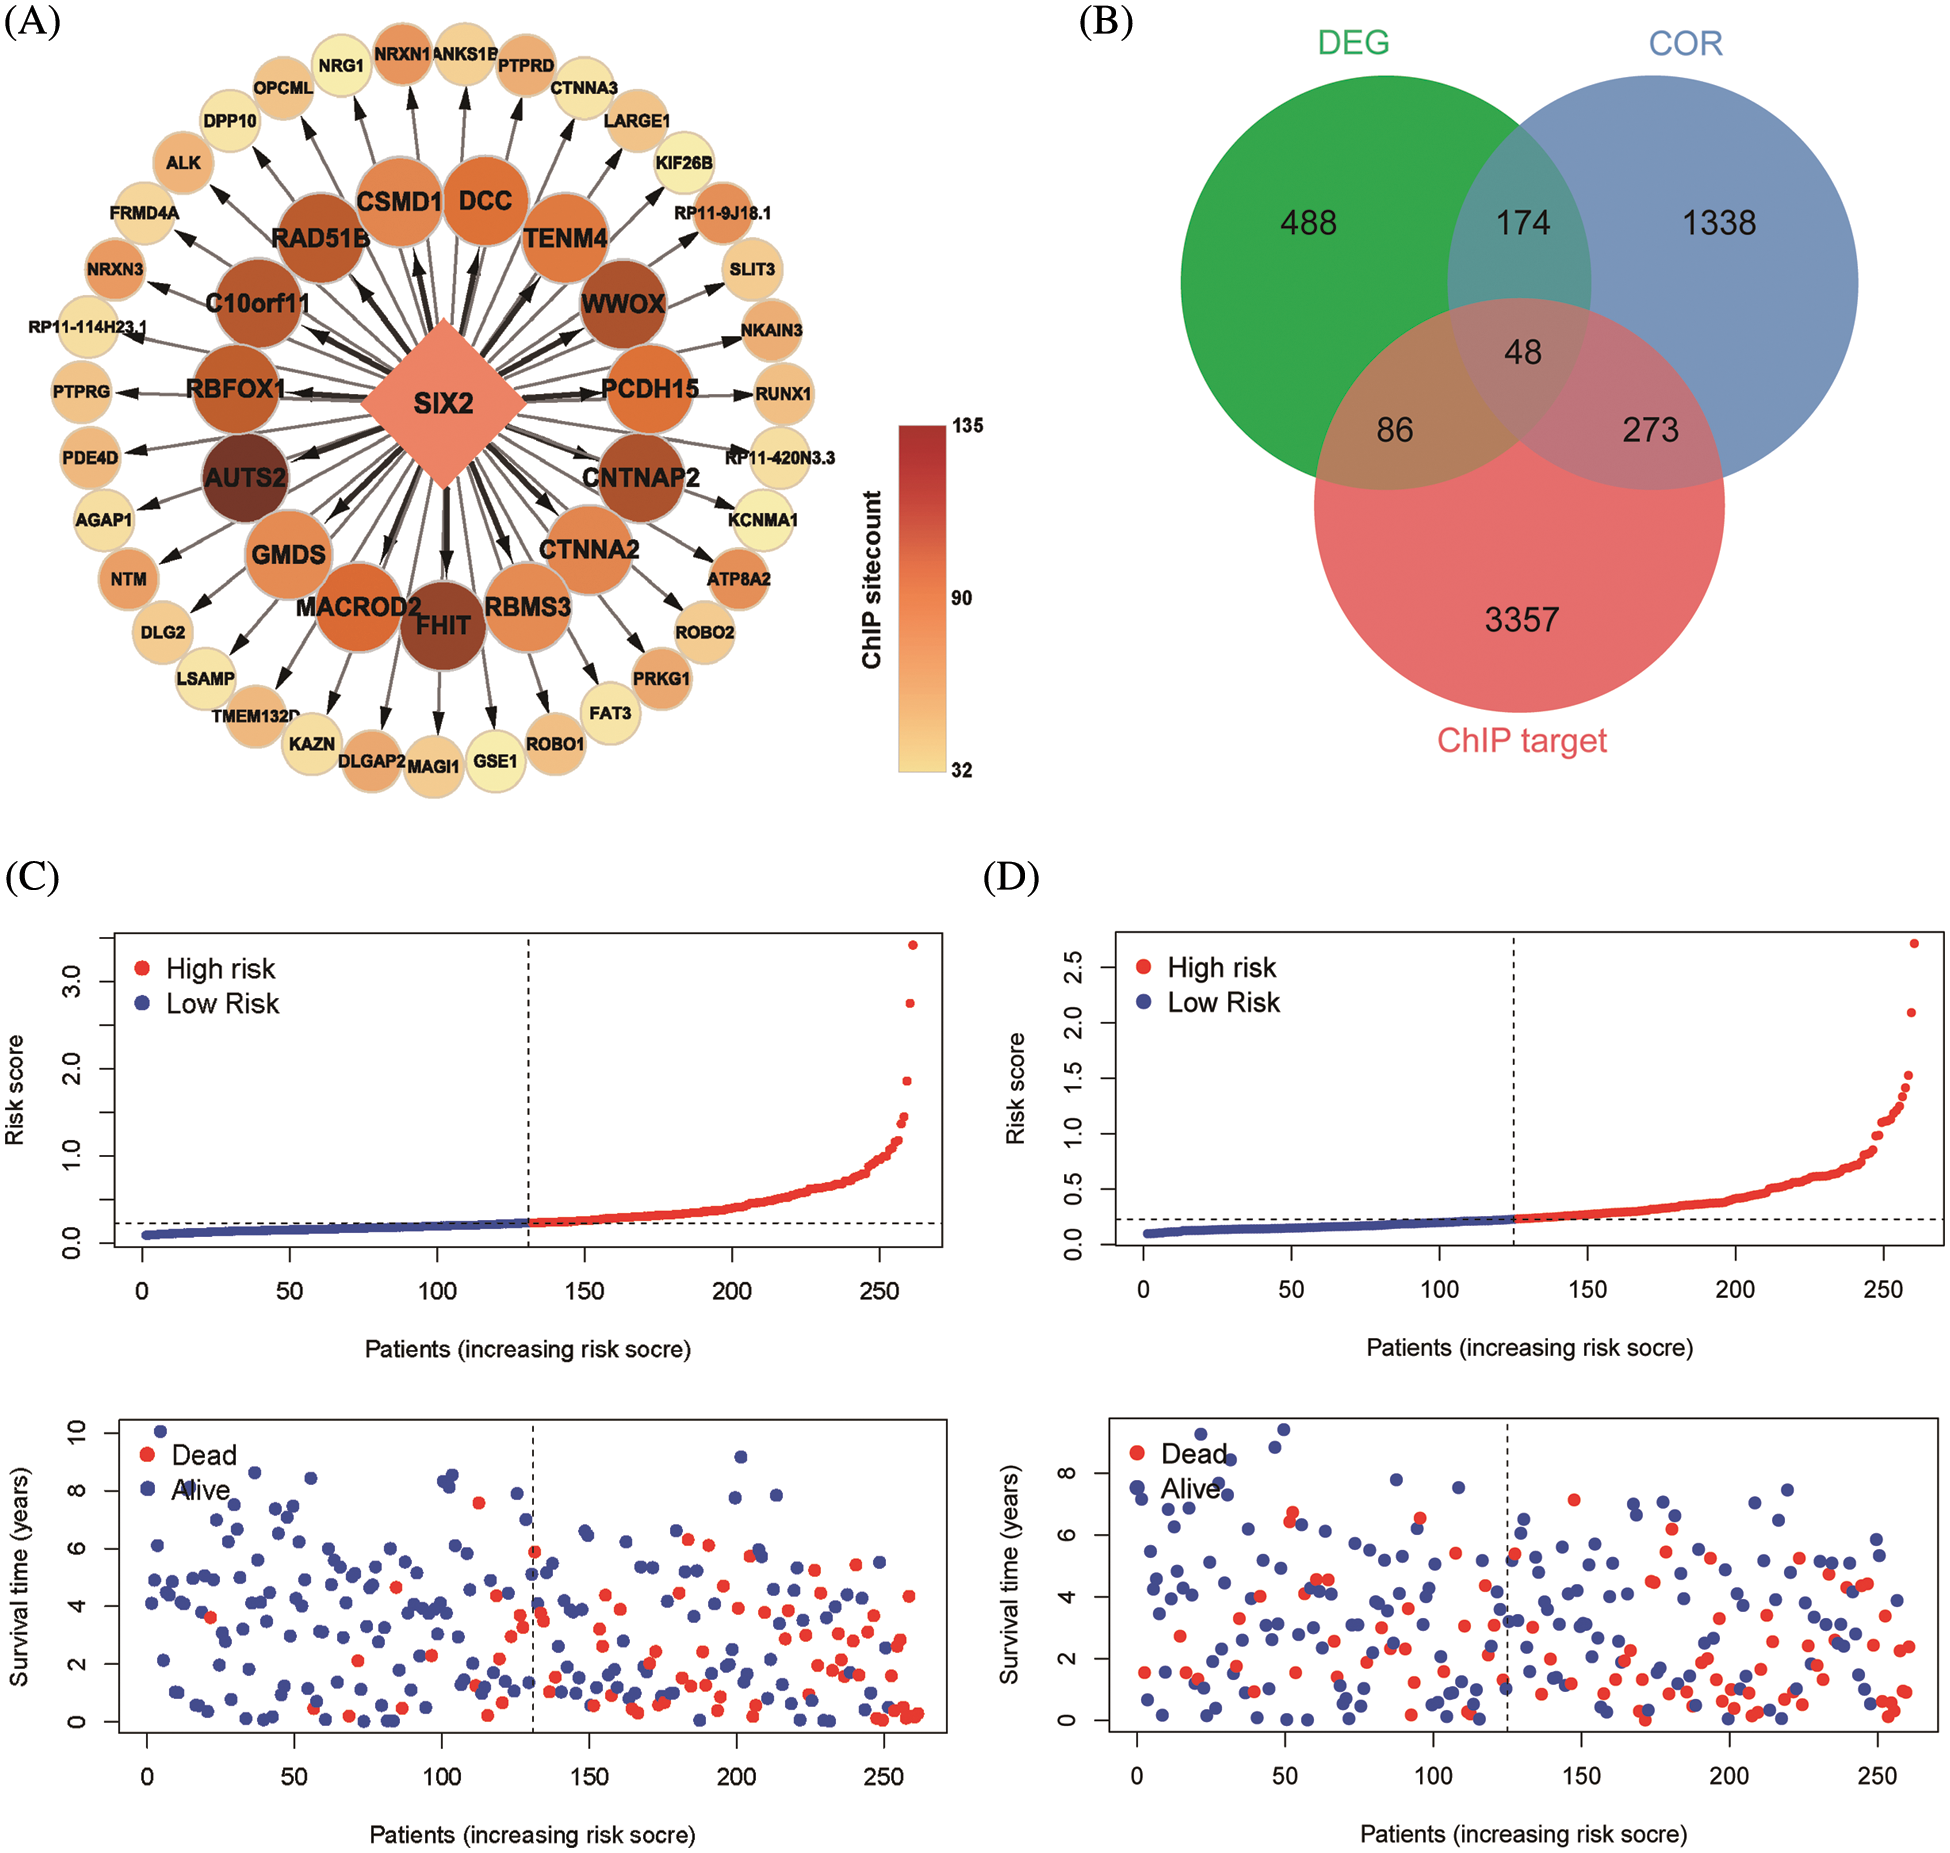
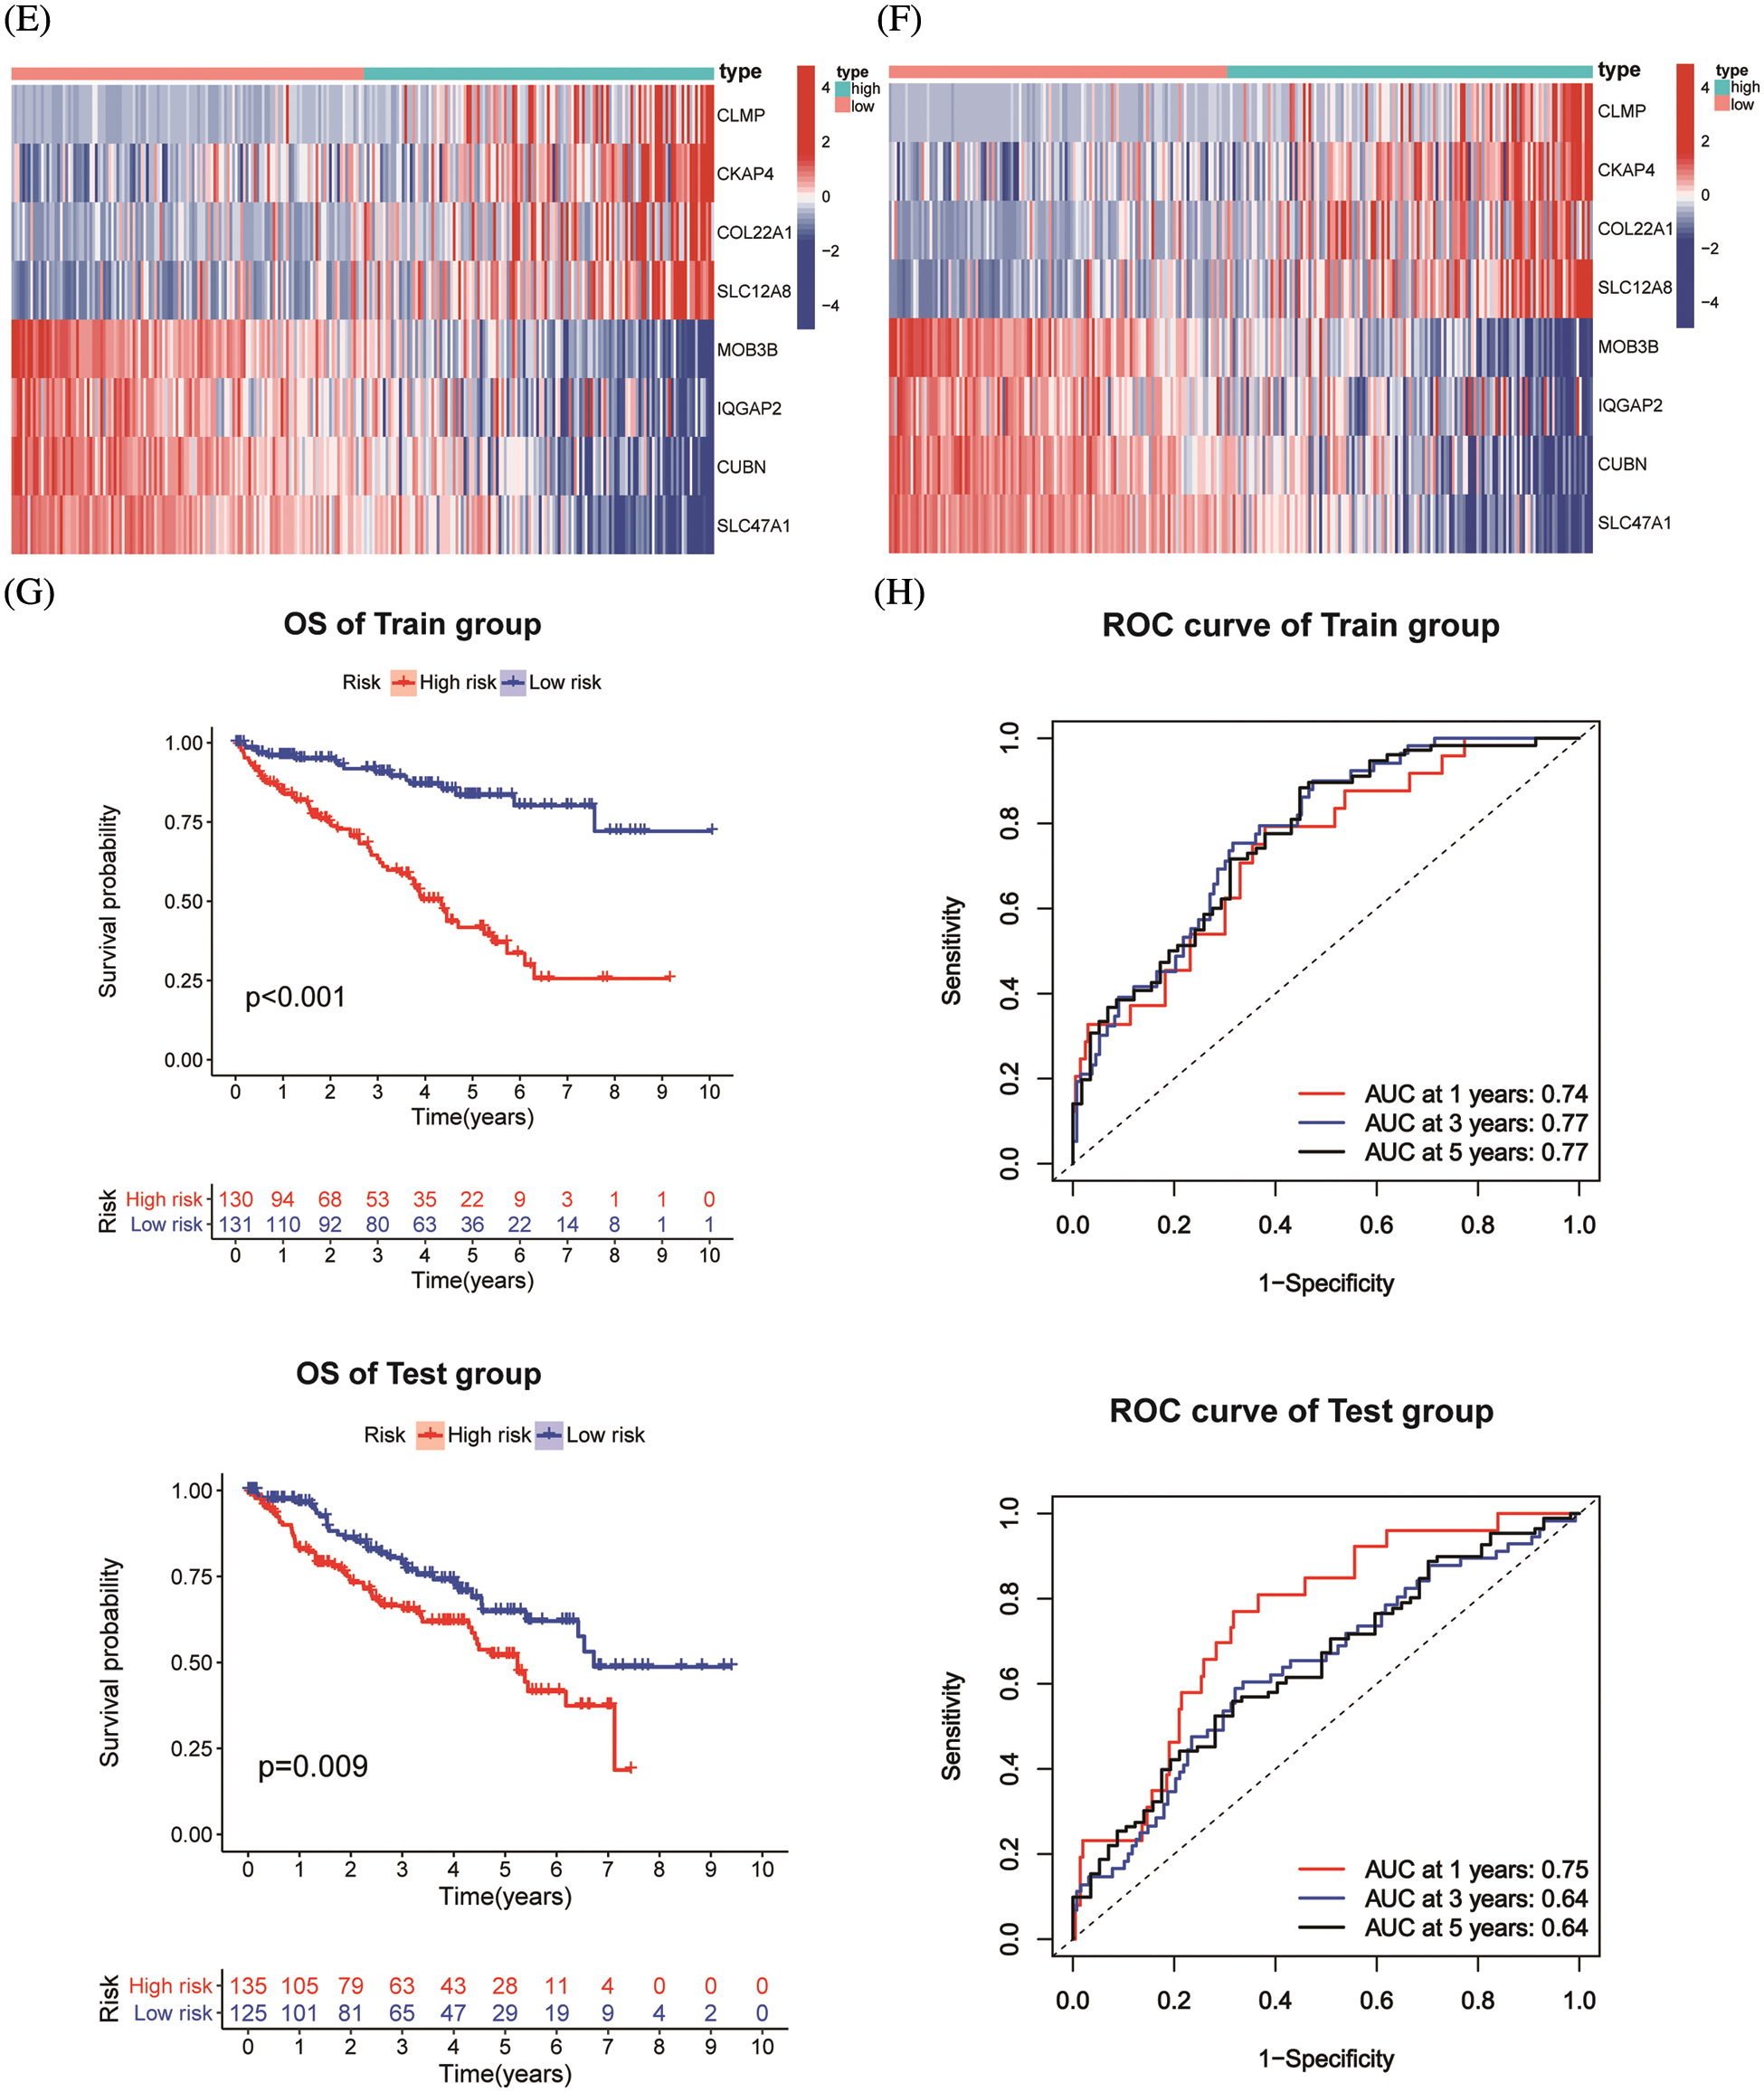
Figure 4: Construction of Six2-related risk model. (A) Top50 (sitecount) Six2 transcriptional downstream targets from GTRD. (B) Venn diagram identifying the overlapping genes among Six2-related DEGs, downstream targets, and co-expressed genes. (C, D) Survival statuses of patients in training (left) and testing groups (right). (E, F) Gene expression heatmap of 8 genes in training (left) and testing (right) groups. (G, H) OS and corresponding ROC curves of train and test groups
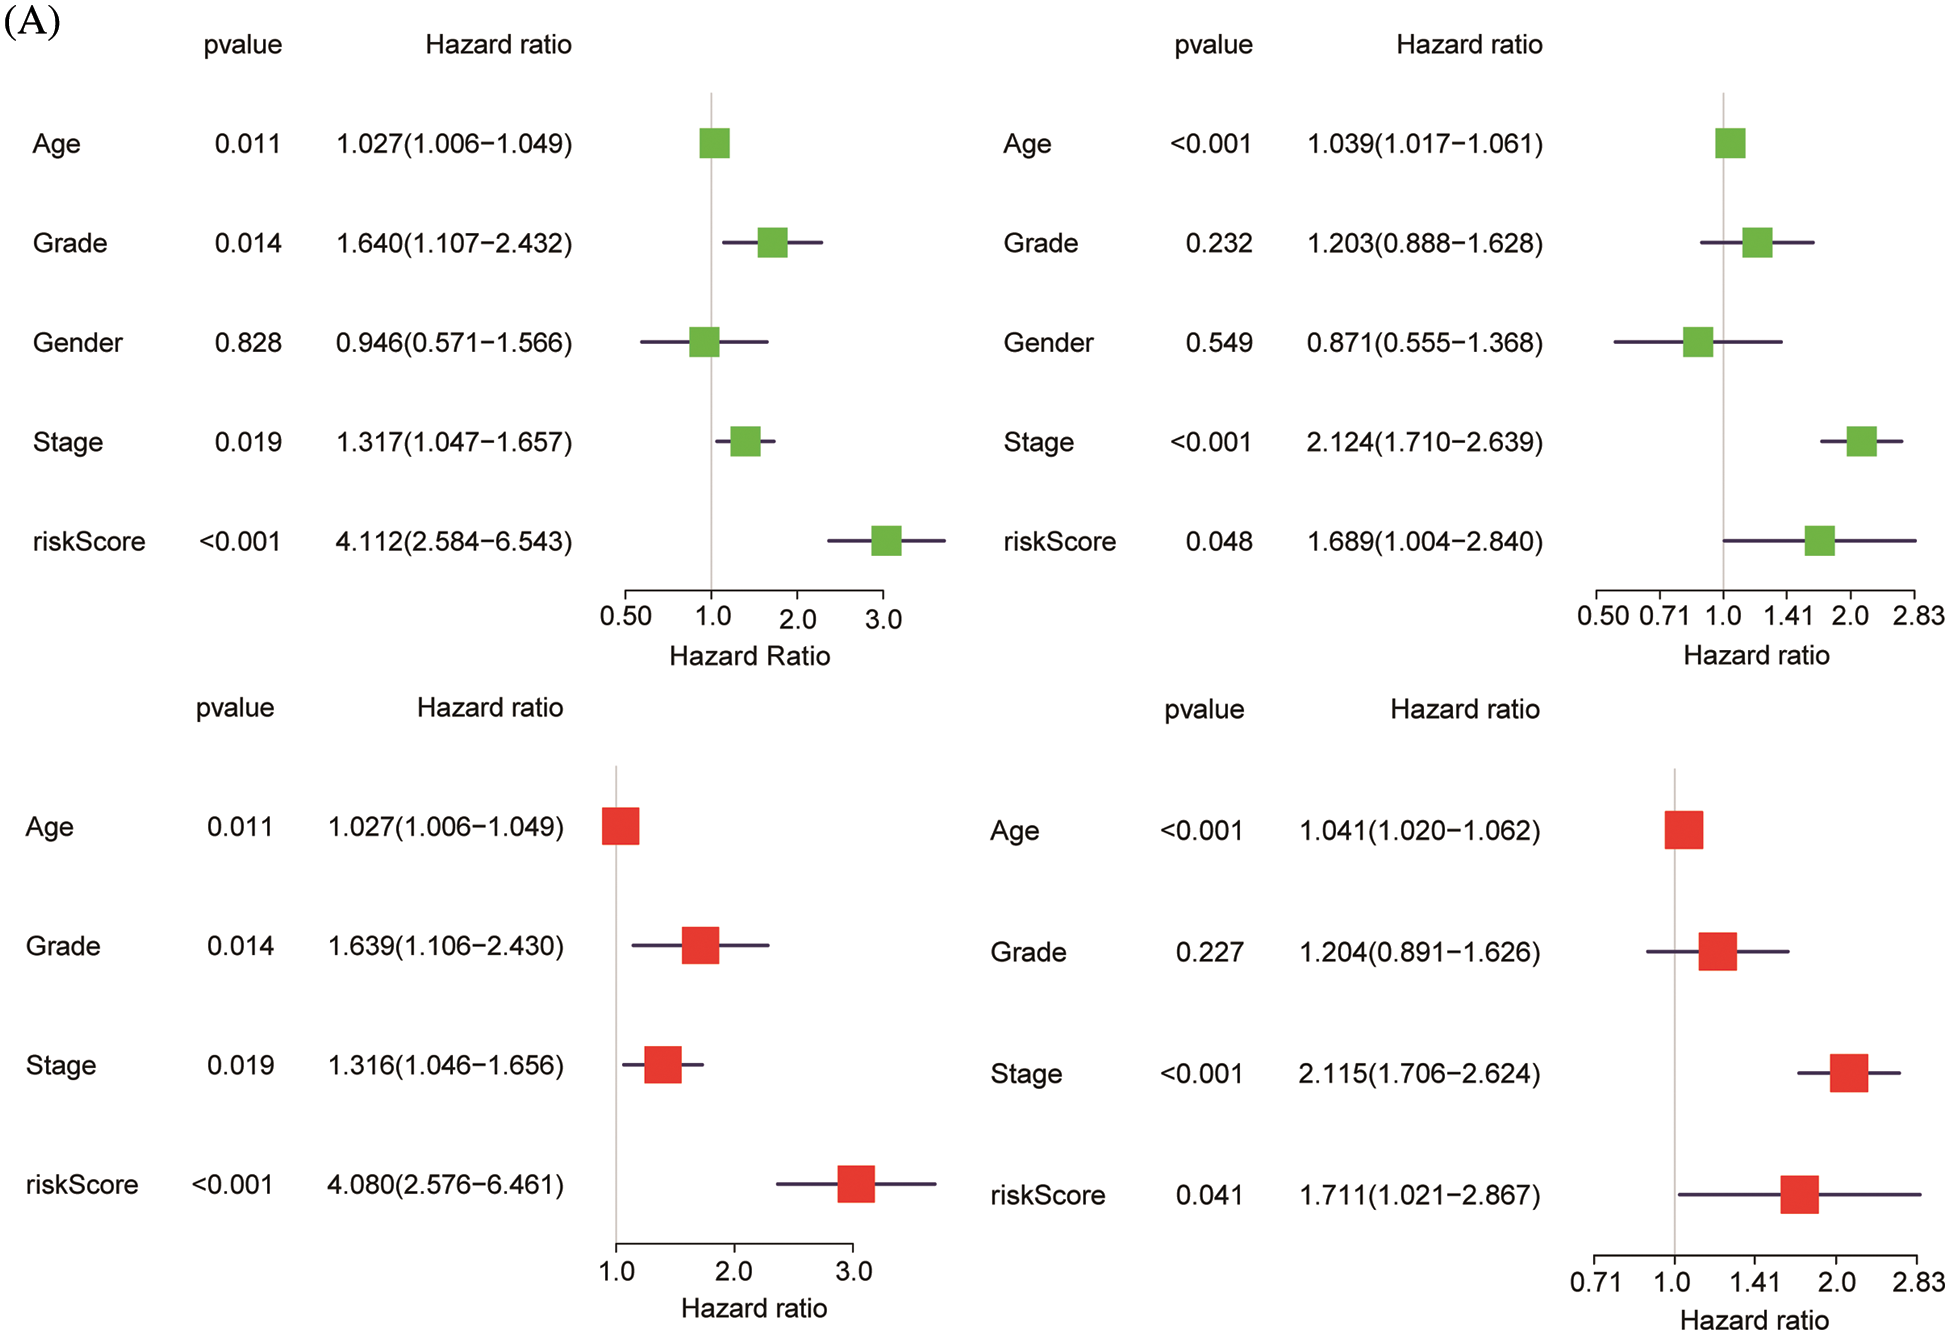
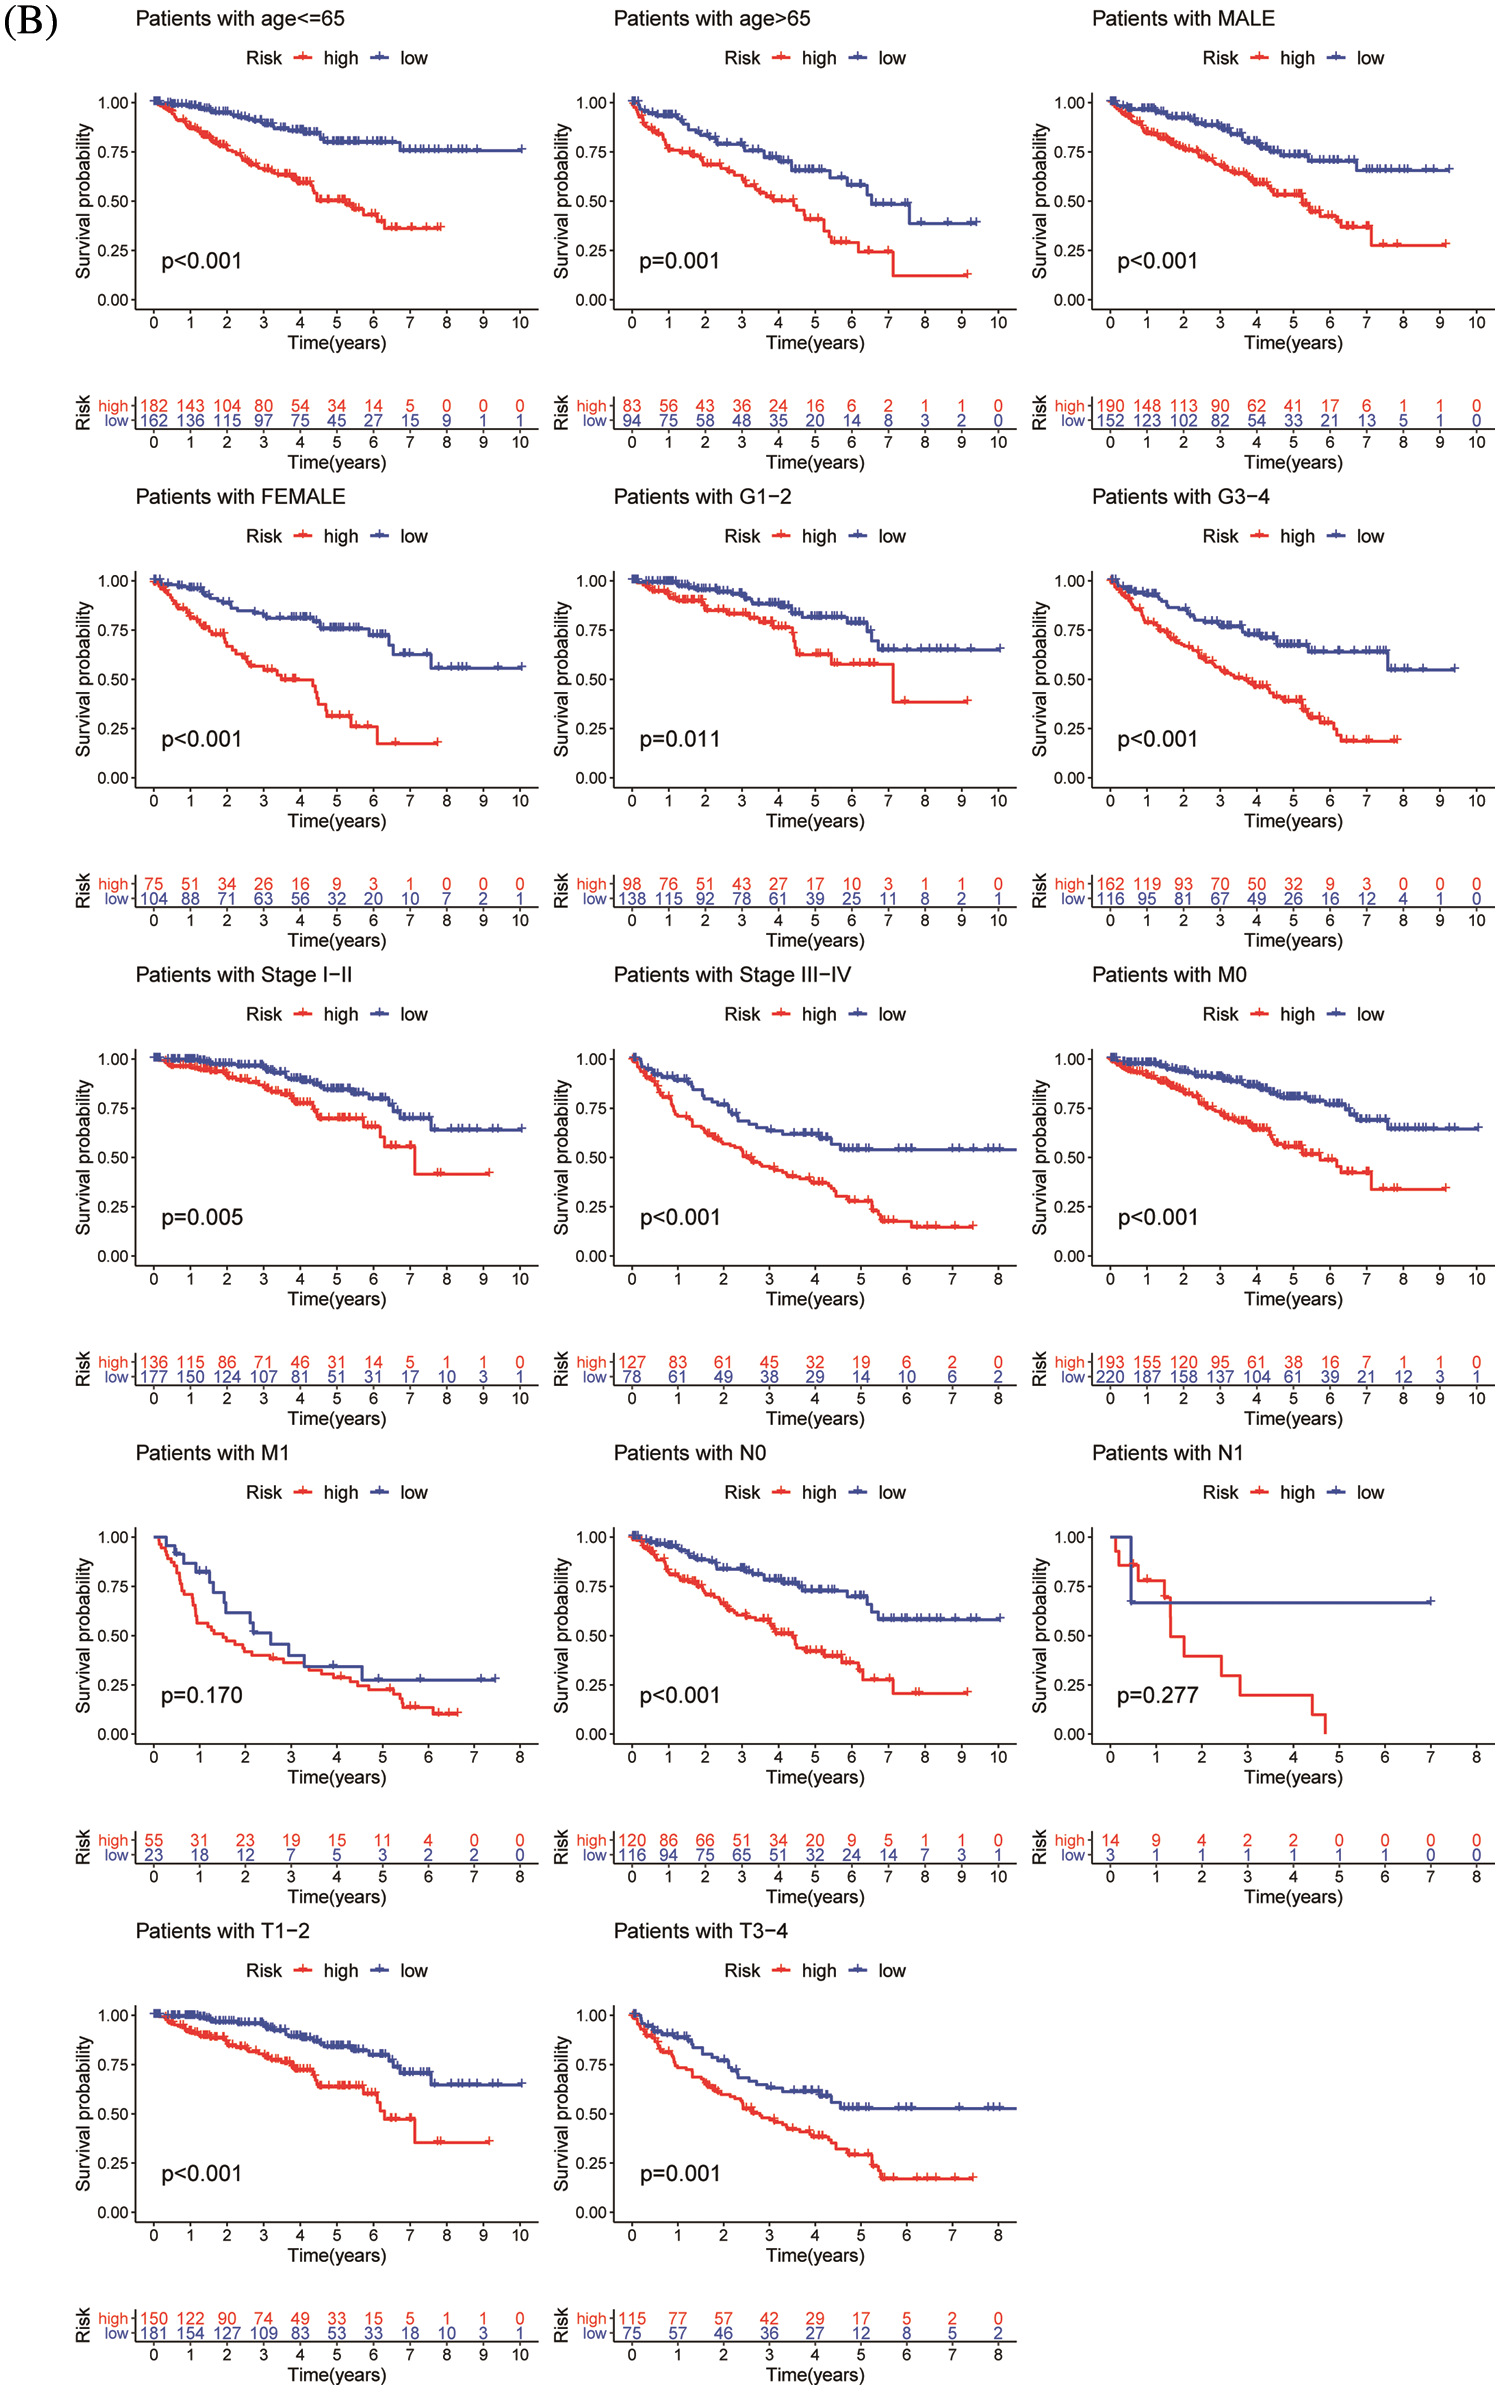
Figure 5: Validation of risk model. (A) Univariate and multivariate analysis of risk model in the training group (left) and testing group (right). (B) OS differences in TCGA set regarding age, gender, grade, M stage, N stage, and T stage
3.5 Predicting Risk and Response of Immunotherapy for Individual Patients
To quantify the risk evaluation of each KIRC patient, a nomogram was constructed to predict 1-, 3- and 5-year survival probability with eight parameters (Fig. 6A). After scoring each patient, we examined several representative immune checkpoints, and found that the low-risk group showed higher PD-L1 expression, which may provide hints for potentially applicable drugs for ccRCC patients (Fig. S5). Then, we applied TCIA to predict the sensitivity of patients to immunotherapy (Fig. 6B). We discovered that the low-risk group showed better IPS than the high-risk group, which means that the low-risk group might be more susceptible to immune checkpoint inhibitors.
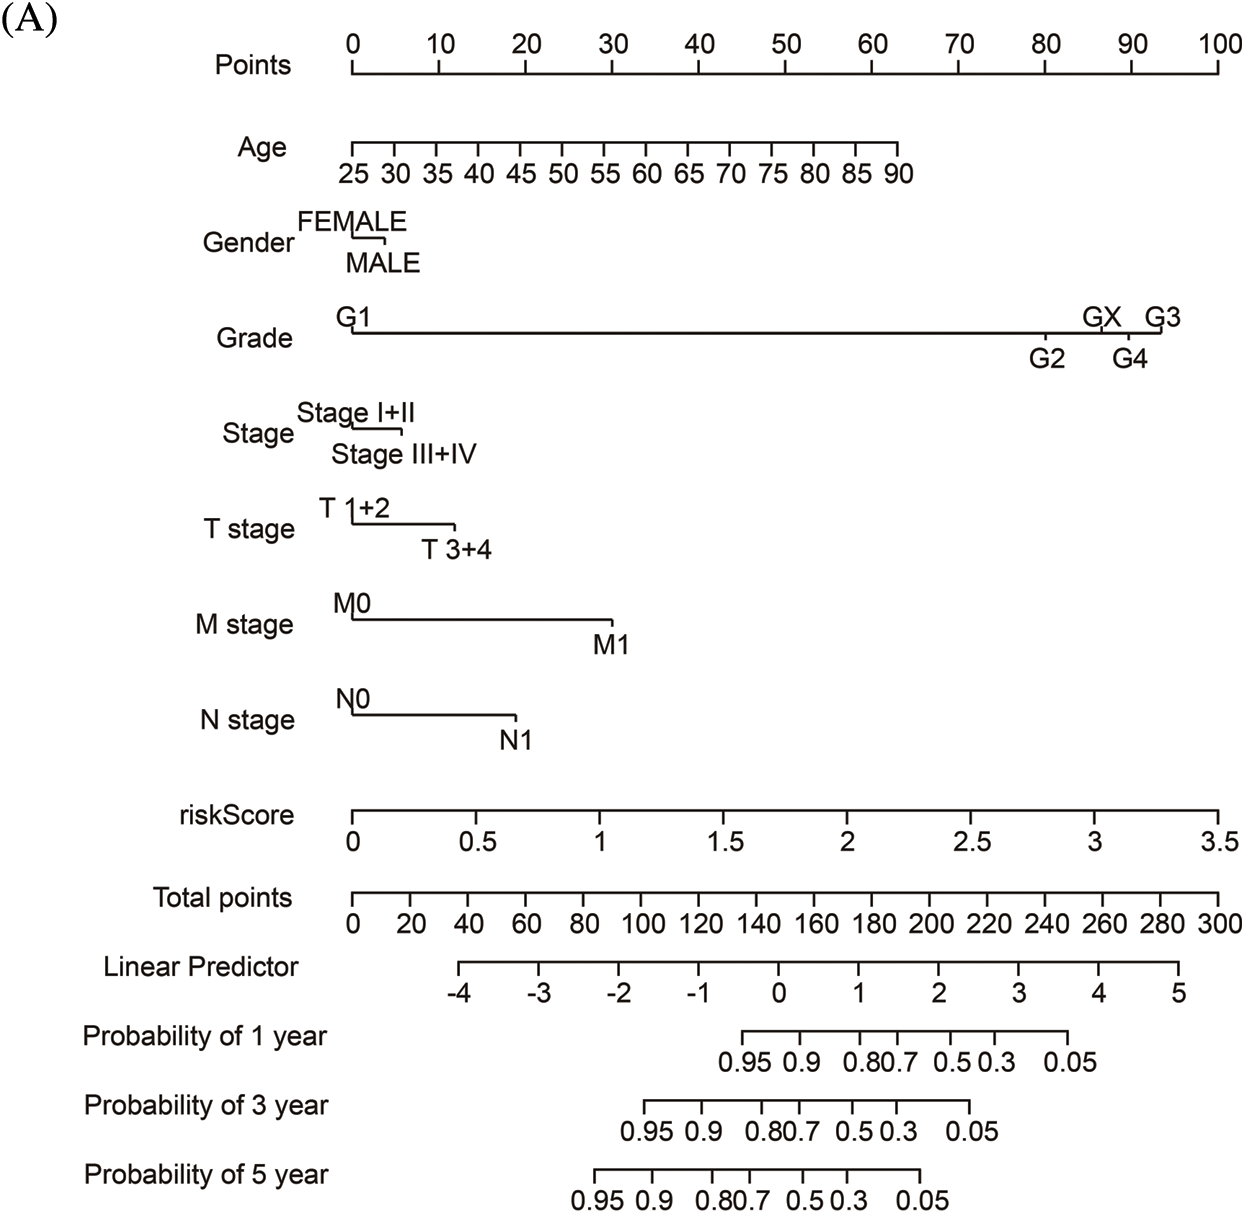
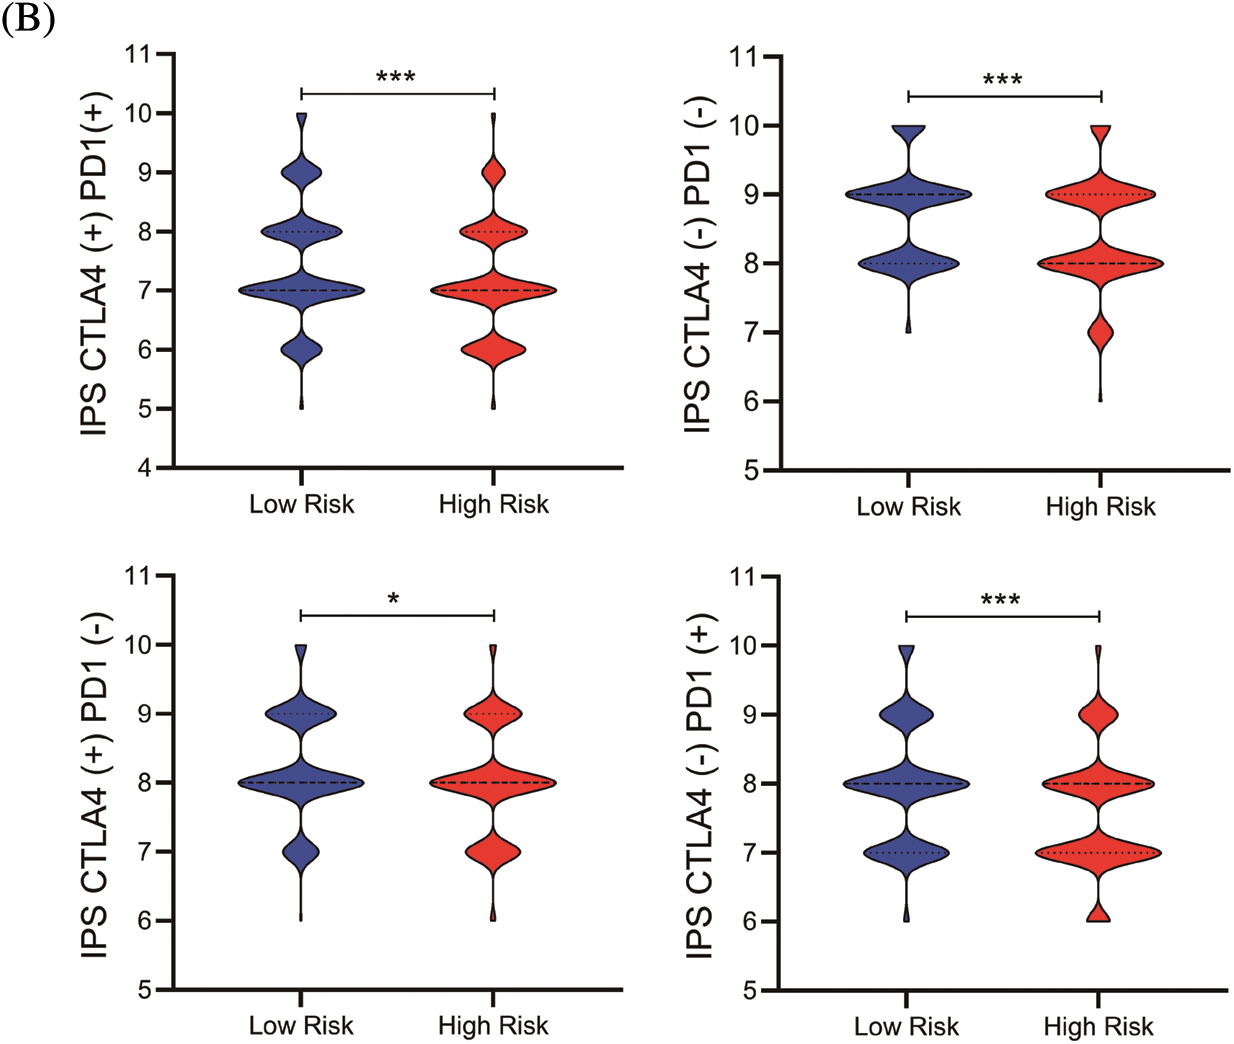
Figure 6: The nomogram and immunotherapy sensitivity of the risk model. (A) A personalized scoring nomogram with eight parameters. (B) The relative probability of response to anti-CTLA4 and anti-PDL1/PD-1 antibodies in the low-and high-risk groups (ns, p ≥ 0.05, *p < 0.05, **p < 0.01, ***p < 0.001)
Initially found to be highly expressed in nephron progenitor cells, Six2 has been found to be highly expressed in nearly every cancer type examined, such as colorectal cancer and lung cancer [12,13]. Silenced Six2 in adult kidneys was found reactivated in renal carcinoma, and its misexpression has been linked to the etiology of renal cancer [14]. It was demonstrated that Six2 promotes distant metastasis through downregulating E-cadherin levels and upregulating Sox2 expression by directly binding with the Srr2 enhancer of Sox2. Undoubtedly, a high expression level of Six2 could promote EMT and enhance the metastatic capacity of cancer cells. Beyond cell property change of malignant cells, the tumor immune microenvironment also contributed to cancer metastasis [15]. However, the downstream effectors and immunological role of Six2 in kidney cancer have not been comprehensively examined.
In the present study, we analyzed the potential downstream targets of Six2 using transcriptomic data in TCGA and ChIP data in GTRD [11]. Firstly, an elevated expression of Six2 was detected in RCC cell lines and was positively correlated with malignant behavior. Then, the role of Six2 in the tumor microenvironment was explored. Thirdly, we divided TCGA patients into two groups by Six2 expression and identified DEGs and their related function by GO and KEGG analysis. In addition, we further constructed a Six2-related risk model based on the overlapping gene signature among DEGs, ChIP data, and co-expressed genes. After evaluating the model, we established a personalized risk assessment nomogram and predicted response to immunotherapy of KIRC patients.
RCC affects 400,000 more people worldwide every year. Although it can be effectively treated with nephrectomy in the early stage, more than a third of patients finally develop into metastatic RCC, which has high mortality rates and shows different biological features from the localized disease [16]. Our data revealed that patients with higher Six2 levels showed advanced pathological stage, and metastasis status, indicating that Six2 may influence cancer metastasis. It was suggested that cancer-cell invasion is the first step of metastasis cascades, whereas the EMT program has been reported to play a pivotal role in tumor invasion [17,18]. Interestingly, previous studies hadshown the promoting role of Six2 in the EMT process. Wan et al. found that Six2 was upregulated and boosted EMT under TGF-β treatment [19]. Next, we found that Six2 expression was correlated with the proportion of M1 macrophage and regulatory T cells. Regulatory T cells are one of the primary immunosuppressive cells in the tumor microenvironment, whereas M1 macrophages produce high level of inflammatory cytokines and play an anti-tumor role in cancer [20,21].
Our data also noticed that most of the DEGs shown in the heatmap showed a pro-metastatic role in various cancers, including CTHRC1, CXCL5, LOX, etc. [22–24]. Further studies could analyze the relationship or correlating role between these genes and Six2 in EMT development. Then, GO, KEGG, and GSEA methods were used to analyze Six2-related DEGs. PI3K-Akt signaling pathway, focal adhesion, leukocyte migration, ECM-receptor interaction, and cytokine-cytokine receptor interaction were enriched in our analysis. It has been shown that EMT companies with loss and reconstruction of cell-cell junctions, cell-matrix interactions, and cytoskeleton. PI3K-Akt signaling pathway has also been verified to participate in the EMT process [25]. Six2 may also have a latent function in ECM remodeling and further regulating tumor immune microenvironment since hypoxia and ECM-regulators were enriched. All of these implicated that Six2 could be an important regulator in EMT and immune microenvironment, which are two important factors in triggering tumor metastasis [26].
It was noticed that dysregulation of gene expression programs controlled by transcription factors can cause a wide range of diseases, including cancer. Mutation and amplification in transcription factors have been known to facilitate carcinogenesis [27]. However, the direct inhibition of transcription factors is untractable due to the difficulties of targeting protein-DNA interactions [28]. Thus, identifying novel downstream effectors or pathways may provide ideal therapeutic targets controlled by Six2. In the present study, we combined the transcriptomic data, ChIP data, and co-expression analysis data in the public database to analyze potential downstream effectors of Six2. Moreover, a novel Six2-related gene risk model was constructed to predict the OS of KIRC patients in training and testing sessions. As cancer immunotherapy successfully treats multiple neoplasms by activating the immune response, we also tested the potential sensitivity of patients to immunotherapy and found out that the risk score model may be an available predictor of immunotherapy [29–32].
There are still several limitations in our study. Firstly, using TCGA transcriptomic data cannot well simulate the gene expression profile acquired from Six2 overexpression or knockdown treatment. Secondly, the ChIP-seq data of Six2 is mainly based on human fetal kidney tissues rather than kidney cancer tissues. Although there are some common features between embryogenesis and tumorigenesis, the data cannot fully reflect the overall regulatory change of Six2 in cancer [33]. Besides, detailed experiments should be done to get a comprehensive understanding of the immunological function of Six2 in ccRCC.
Our study revealed that elevated Six2 expression was closely related to unfavorable survival and cancer progression. Six2 also played an essential part in the tumor immune microenvironment. Novel potential downstream targets of Six2 were selected by integrating transcriptomic data and ChIP-seq data of Six2, and a Six2-related prognostic model was established. Our findings provide insight into the significant transcriptional and immunological role of Six2 in ccRCC.
Acknowledgement: The authors would like to appreciate data availability in the TCGA database.
Authorship: Dayu Tian and Yang Shi have contributed equally to this work. Tao Song and Qianyin Li conceptualized and designed this study. Lei Li, Xiangmin Qiu wrote the first draft of the manuscript.
Ethics Approval and Informed Consent Statement: TCGA is a public database. The information of patients in the database has obtained ethical approval. Users have free access to the data for research and publishing relevant articles. Our study analyzed open-source data, so there are no ethical issues.
Availability of Data and Materials: The datasets in this study are available in the Cancer Genome Atlas (https://portal.gdc.cancer.gov/) and GTRD (http://gtrd.biouml.org/). Further inquiries can be directed to the corresponding authors.
Funding Statement: This study was funded by the National Natural Science Foundation of China (Grant No. 81873932), the Natural Science Foundation of Chongqing (Grant No. cstc2021jcyj-msmX0019), the Science and Technology Research Project of Chongqing Municipal Education Commission of China (Grant No. KJQN202000438), and Chongqing Science and Technology Bureau Technology Innovation and Application Development Special Key Projects (Grant No. cstc2019jscx-dxwtBX0032).
Conflicts of Interest: There is no conflict of interest. The authors have no relevant financial or non-financial interests to disclose.
1. Siegel, R. L., Miller, K. D., Fuchs, H. E., Jemal, A. (2021). Cancer statistics, 2021. CA: A Cancer Journal for Clinicians, 71(1), 7–33. DOI 10.3322/caac.21654. [Google Scholar] [CrossRef]
2. Jonasch, E., Gao, J., Rathmell, W. K. (2014). Renal cell carcinoma. BMJ, 349, g4797. DOI 10.1136/bmj.g4797. [Google Scholar] [CrossRef]
3. Posadas, E. M., Limvorasak, S., Figlin, R. A. (2017). Targeted therapies for renal cell carcinoma. Nature Reviews Nephrology, 13(8), 496–511. DOI 10.1038/nrneph.2017.82. [Google Scholar] [CrossRef]
4. Kotecha, R. R., Motzer, R. J., Voss, M. H. (2019). Towards individualized therapy for metastatic renal cell carcinoma. Nature Reviews Clinical Oncology, 16(10), 621–633. DOI 10.1038/s41571-019-0209-1. [Google Scholar] [CrossRef]
5. Barata, P. C., Rini, B. I. (2017). Treatment of renal cell carcinoma: Current status and future directions. CA: A Cancer Journal for Clinicians, 67(6), 507–524. DOI 10.3322/caac.21411. [Google Scholar] [CrossRef]
6. Xu, J., Li, J., Ramakrishnan, A., Yan, H., Shen, L. et al. (2022). Six1 and Six2 of the sine oculis homeobox subfamily are not functionally interchangeable in mouse nephron formation. Frontiers in Cell and Developmental Biology, 10, 815249. DOI 10.3389/fcell.2022.815249. [Google Scholar] [CrossRef]
7. Park, J. S., Ma, W., O’Brien, L. L., Chung, E., Guo, J. J. et al. (2012). Six2 and Wnt regulate self-renewal and commitment of nephron progenitors through shared gene regulatory networks. Developmental Cell, 23(3), 637–651. DOI 10.1016/j.devcel.2012.07.008. [Google Scholar] [CrossRef]
8. Oliphant, M. U. J., Vincent, M. Y., Galbraith, M. D., Pandey, A., Zaberezhnyy, V. et al. (2019). SIX2 mediates late-stage metastasis via direct regulation of SOX2 and induction of a cancer stem cell program. Cancer Research, 79(4), 720–734. DOI 10.1158/0008-5472.CAN-18-1791. [Google Scholar] [CrossRef]
9. Wang, C. A., Drasin, D., Pham, C., Jedlicka, P., Zaberezhnyy, V. et al. (2014). Homeoprotein Six2 promotes breast cancer metastasis via transcriptional and epigenetic control of E-cadherin expression. Cancer Research, 74(24), 7357–7370. DOI 10.1158/0008-5472.CAN-14-0666. [Google Scholar] [CrossRef]
10. Binnewies, M., Roberts, E. W., Kersten, K., Chan, V., Fearon, D. F. et al. (2018). Understanding the tumor immune microenvironment (TIME) for effective therapy. Nature Medicine, 24(5), 541–550. DOI 10.1038/s41591-018-0014-x. [Google Scholar] [CrossRef]
11. Kolmykov, S., Yevshin, I., Kulyashov, M., Sharipov, R., Kondrakhin, Y. et al. (2021). GTRD: An integrated view of transcription regulation. Nucleic Acids Research, 49, D104–D111. DOI 10.1093/nar/gkaa1057. [Google Scholar] [CrossRef]
12. Jiang, Y., Zhou, B., Liang, B., Zeng, F., Zou, Z. (2020). Overexpression of sine oculis homeobox homolog 2 predicts poor survival and clinical parameters of patients with colon adenocarcinoma. Annals of Clinical and Laboratory Science, 50(6), 717–725. [Google Scholar]
13. Pierce, J., Murphy, A. J., Panzer, A., de Caestecker, C., Ayers, G. D. et al. (2014). SIX2 effects on wilms tumor biology. Translational Oncology, 7(6), 800–811. DOI 10.1016/j.tranon.2014.09.005. [Google Scholar] [CrossRef]
14. Christensen, K. L., Patrick, A. N., McCoy, E. L., Ford, H. L. (2008). The six family of homeobox genes in development and cancer. Advances in Cancer Research, 101, 93–126. DOI 10.1016/S0065-230X(08)00405-3. [Google Scholar] [CrossRef]
15. El-Kenawi, A., Hänggi, K., Ruffell, B. (2020). The immune microenvironment and cancer metastasis. Cold Spring Harbor Perspectives in Medicine, 10(4), a037424. DOI 10.1101/cshperspect.a037424. [Google Scholar] [CrossRef]
16. Jonasch, E., Walker, C. L., Rathmell, W. K. (2021). Clear cell renal cell carcinoma ontogeny and mechanisms of lethality. Nature Reviews Nephrology, 17(4), 245–261. DOI 10.1038/s41581-020-00359-2. [Google Scholar] [CrossRef]
17. Mittal, V. (2018). Epithelial mesenchymal transition in tumor metastasis. Annual Review of Pathology, 13, 395–412. DOI 10.1146/annurev-pathol-020117-043854. [Google Scholar] [CrossRef]
18. Pastushenko, I., Blanpain, C. (2019). EMT transition states during tumor progression and metastasis. Trends in Cell Biology, 29(3), 212–226. DOI 10.1016/j.tcb.2018.12.001. [Google Scholar] [CrossRef]
19. Wan, Z. H., Ma, Y. H., Jiang, T. Y., Lin, Y. K., Shi, Y. Y. et al. (2019). Six2 is negatively correlated with prognosis and facilitates epithelial-mesenchymal transition via TGF-β/Smad signal pathway in hepatocellular carcinoma. Hepatobiliary & Pancreatic Diseases International, 18(6), 525–531. DOI 10.1016/j.hbpd.2019.09.005. [Google Scholar] [CrossRef]
20. Xie, J., Chen, L., Sun, Q., Li, H., Wei, W. et al. (2022). An immune subtype-related prognostic signature of hepatocellular carcinoma based on single-cell sequencing analysis. Aging, 14(7), 3276–3292. DOI 10.18632/aging.204012. [Google Scholar] [CrossRef]
21. Lin, E., Liu, X., Liu, Y., Zhang, Z., Xie, L. et al. (2021). Roles of the dynamic tumor immune microenvironment in the individualized treatment of advanced clear cell renal cell carcinoma. Frontiers in Immunology, 12, 653358. DOI 10.3389/fimmu.2021.653358. [Google Scholar] [CrossRef]
22. Zhang, X. L., Hu, L. P., Yang, Q., Qin, W. T., Wang, X. et al. (2021). CTHRC1 promotes liver metastasis by reshaping infiltrated macrophages through physical interactions with TGF-β receptors in colorectal cancer. Oncogene, 40(23), 3959–3973. DOI 10.1038/s41388-021-01827-0. [Google Scholar] [CrossRef]
23. Miller, B. W., Morton, J. P., Pinese, M., Saturno, G., Jamieson, N. B. et al. (2015). Targeting the LOX/hypoxia axis reverses many of the features that make pancreatic cancer deadly: Inhibition of LOX abrogates metastasis and enhances drug efficacy. EMBO Molecular Medicine, 7(8), 1063–1076. DOI 10.15252/emmm.201404827. [Google Scholar] [CrossRef]
24. Zhao, J., Ou, B., Han, D., Wang, P., Zong, Y. et al. (2017). Tumor-derived CXCL5 promotes human colorectal cancer metastasis through activation of the ERK/Elk-1/Snail and AKT/GSK3β/β-catenin pathways. Molecular Cancer, 16(1), 70. DOI 10.1186/s12943-017-0629-4. [Google Scholar] [CrossRef]
25. Xu, W., Yang, Z., Lu, N. (2015). A new role for the PI3K/Akt signaling pathway in the epithelial-mesenchymal transition. Cell Adhesion & Migration, 9(4), 317–324. DOI 10.1080/19336918.2015.1016686. [Google Scholar] [CrossRef]
26. Mohan, V., Das, A., Sagi, I. (2020). Emerging roles of ECM remodeling processes in cancer. Seminars in Cancer Biology, 62, 192–200. DOI 10.1016/j.semcancer.2019.09.004. [Google Scholar] [CrossRef]
27. Lee, T. I., Young, R. A. (2013). Transcriptional regulation and its misregulation in disease. Cell, 152(6), 1237–1251. DOI 10.1016/j.cell.2013.02.014. [Google Scholar] [CrossRef]
28. Bushweller, J. H. (2019). Targeting transcription factors in cancer-from undruggable to reality. Nature Reviews. Cancer, 19(11), 611–624. DOI 10.1038/s41568-019-0196-7. [Google Scholar] [CrossRef]
29. Xie, J., Li, H., Chen, L., Cao, Y., Hu, Y. et al. (2021). A novel pyroptosis-related lncRNA signature for predicting the prognosis of skin cutaneous melanoma. International Journal of General Medicine, 14, 6517–6527. DOI 10.2147/IJGM.S335396. [Google Scholar] [CrossRef]
30. Qiu, Y., Li, H., Zhang, Q., Qiao, X., Wu, J. (2022). Ferroptosis-related long noncoding RNAs as prognostic marker for colon adenocarcinoma. Applied Bionics and Biomechanics, 2022, 5220368. DOI 10.1155/2022/5220368. [Google Scholar] [CrossRef]
31. Pardoll, D. M. (2012). The blockade of immune checkpoints in cancer immunotherapy. Nature Reviews Cancer, 12(4), 252–264. DOI 10.1038/nrc3239. [Google Scholar] [CrossRef]
32. He, X., Xu, C. (2020). Immune checkpoint signaling and cancer immunotherapy. Cell Research, 30(8), 660–669. DOI 10.1038/s41422-020-0343-4. [Google Scholar] [CrossRef]
33. O’Brien, L. L., Guo, Q., Lee, Y., Tran, T., Benazet, J. D. et al. (2016). Differential regulation of mouse and human nephron progenitors by the Six family of transcriptional regulators. Development, 143(4), 595–608. DOI 10.1242/dev.127175. [Google Scholar] [CrossRef]
Appendix
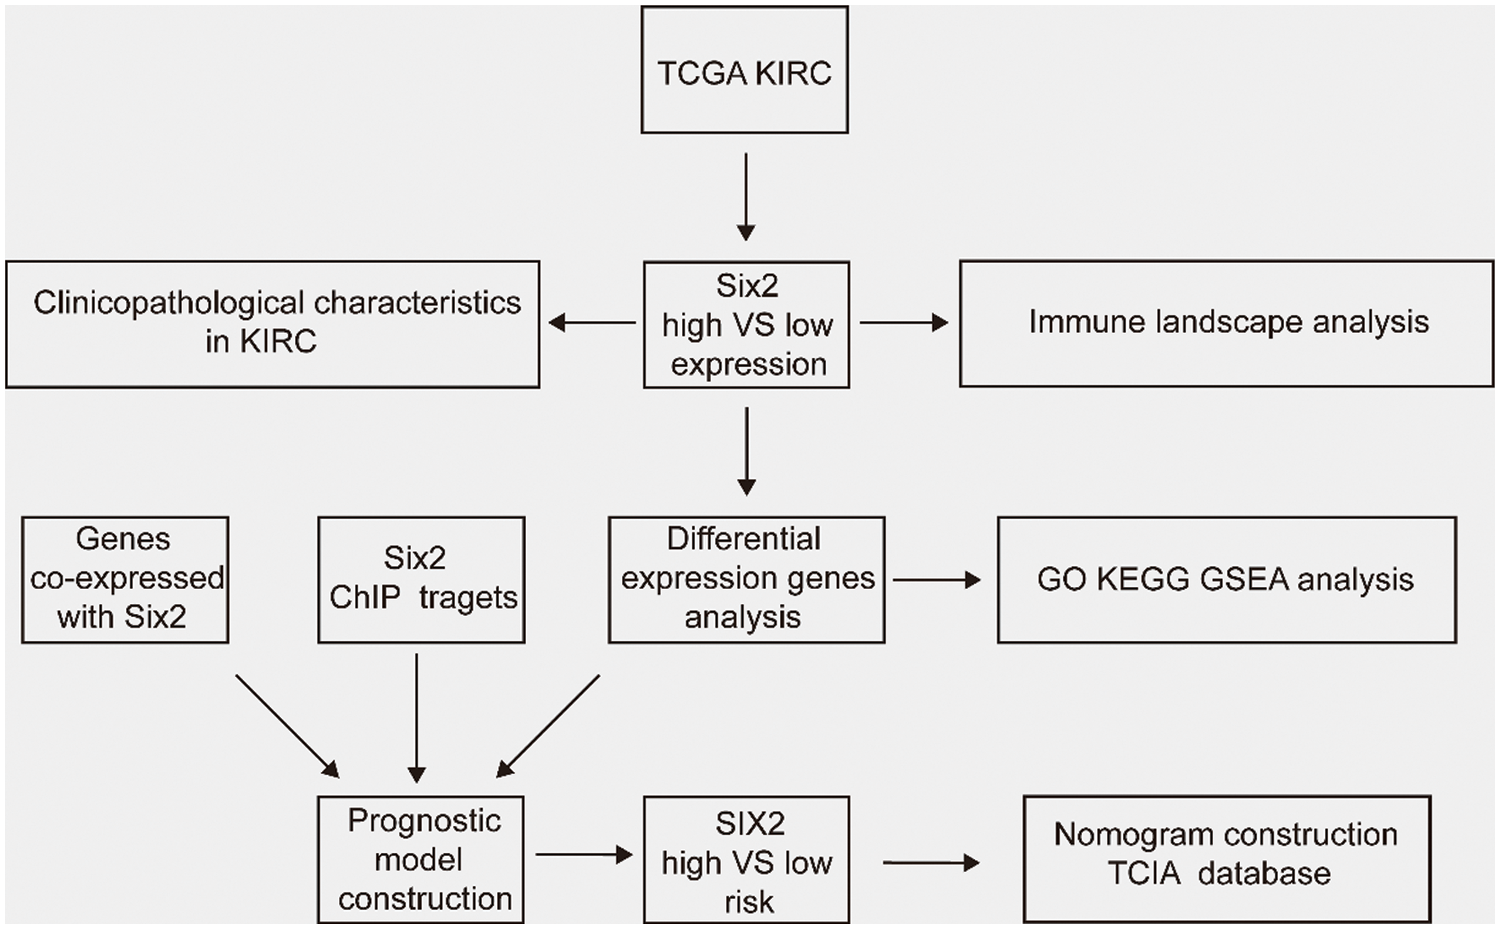
Figure S1: The workflow of this study
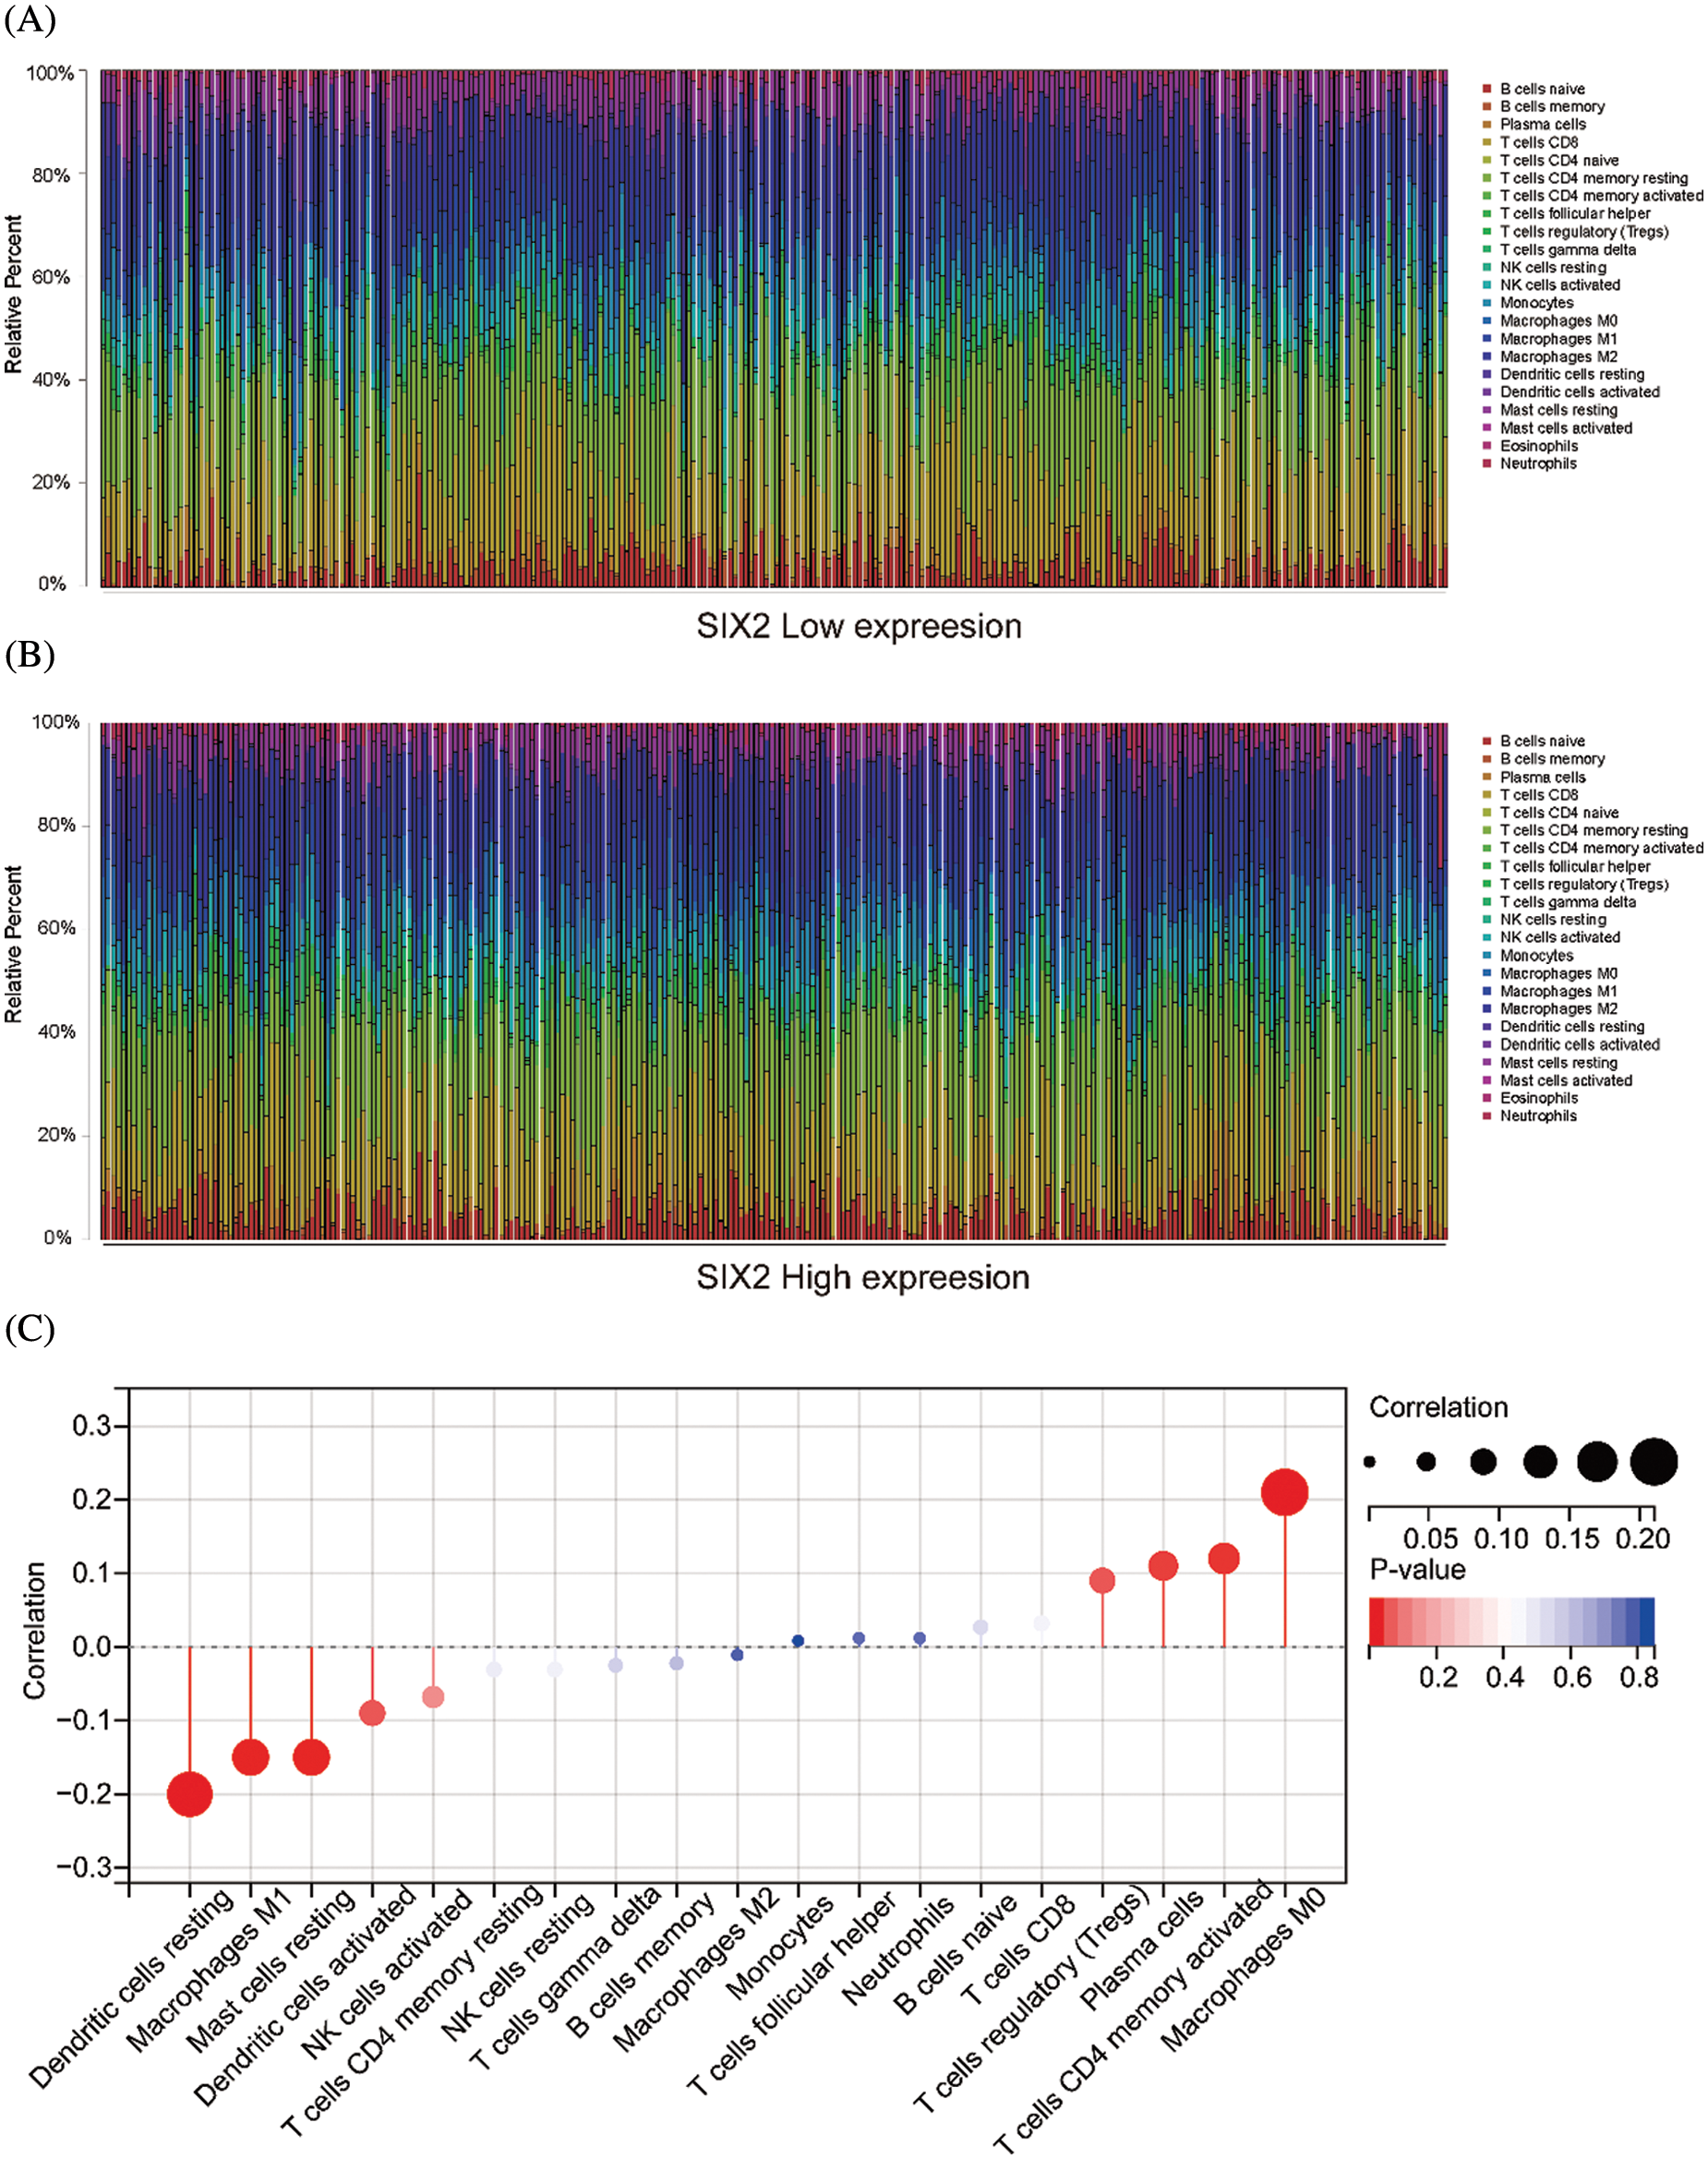
Figure S2: The relationship between Six2 and immune cells. (A, B) The immune cell landscape in Six2 high and low expression groups. (C) The correlation between Six2 and CIBERSORT score of the immune cells
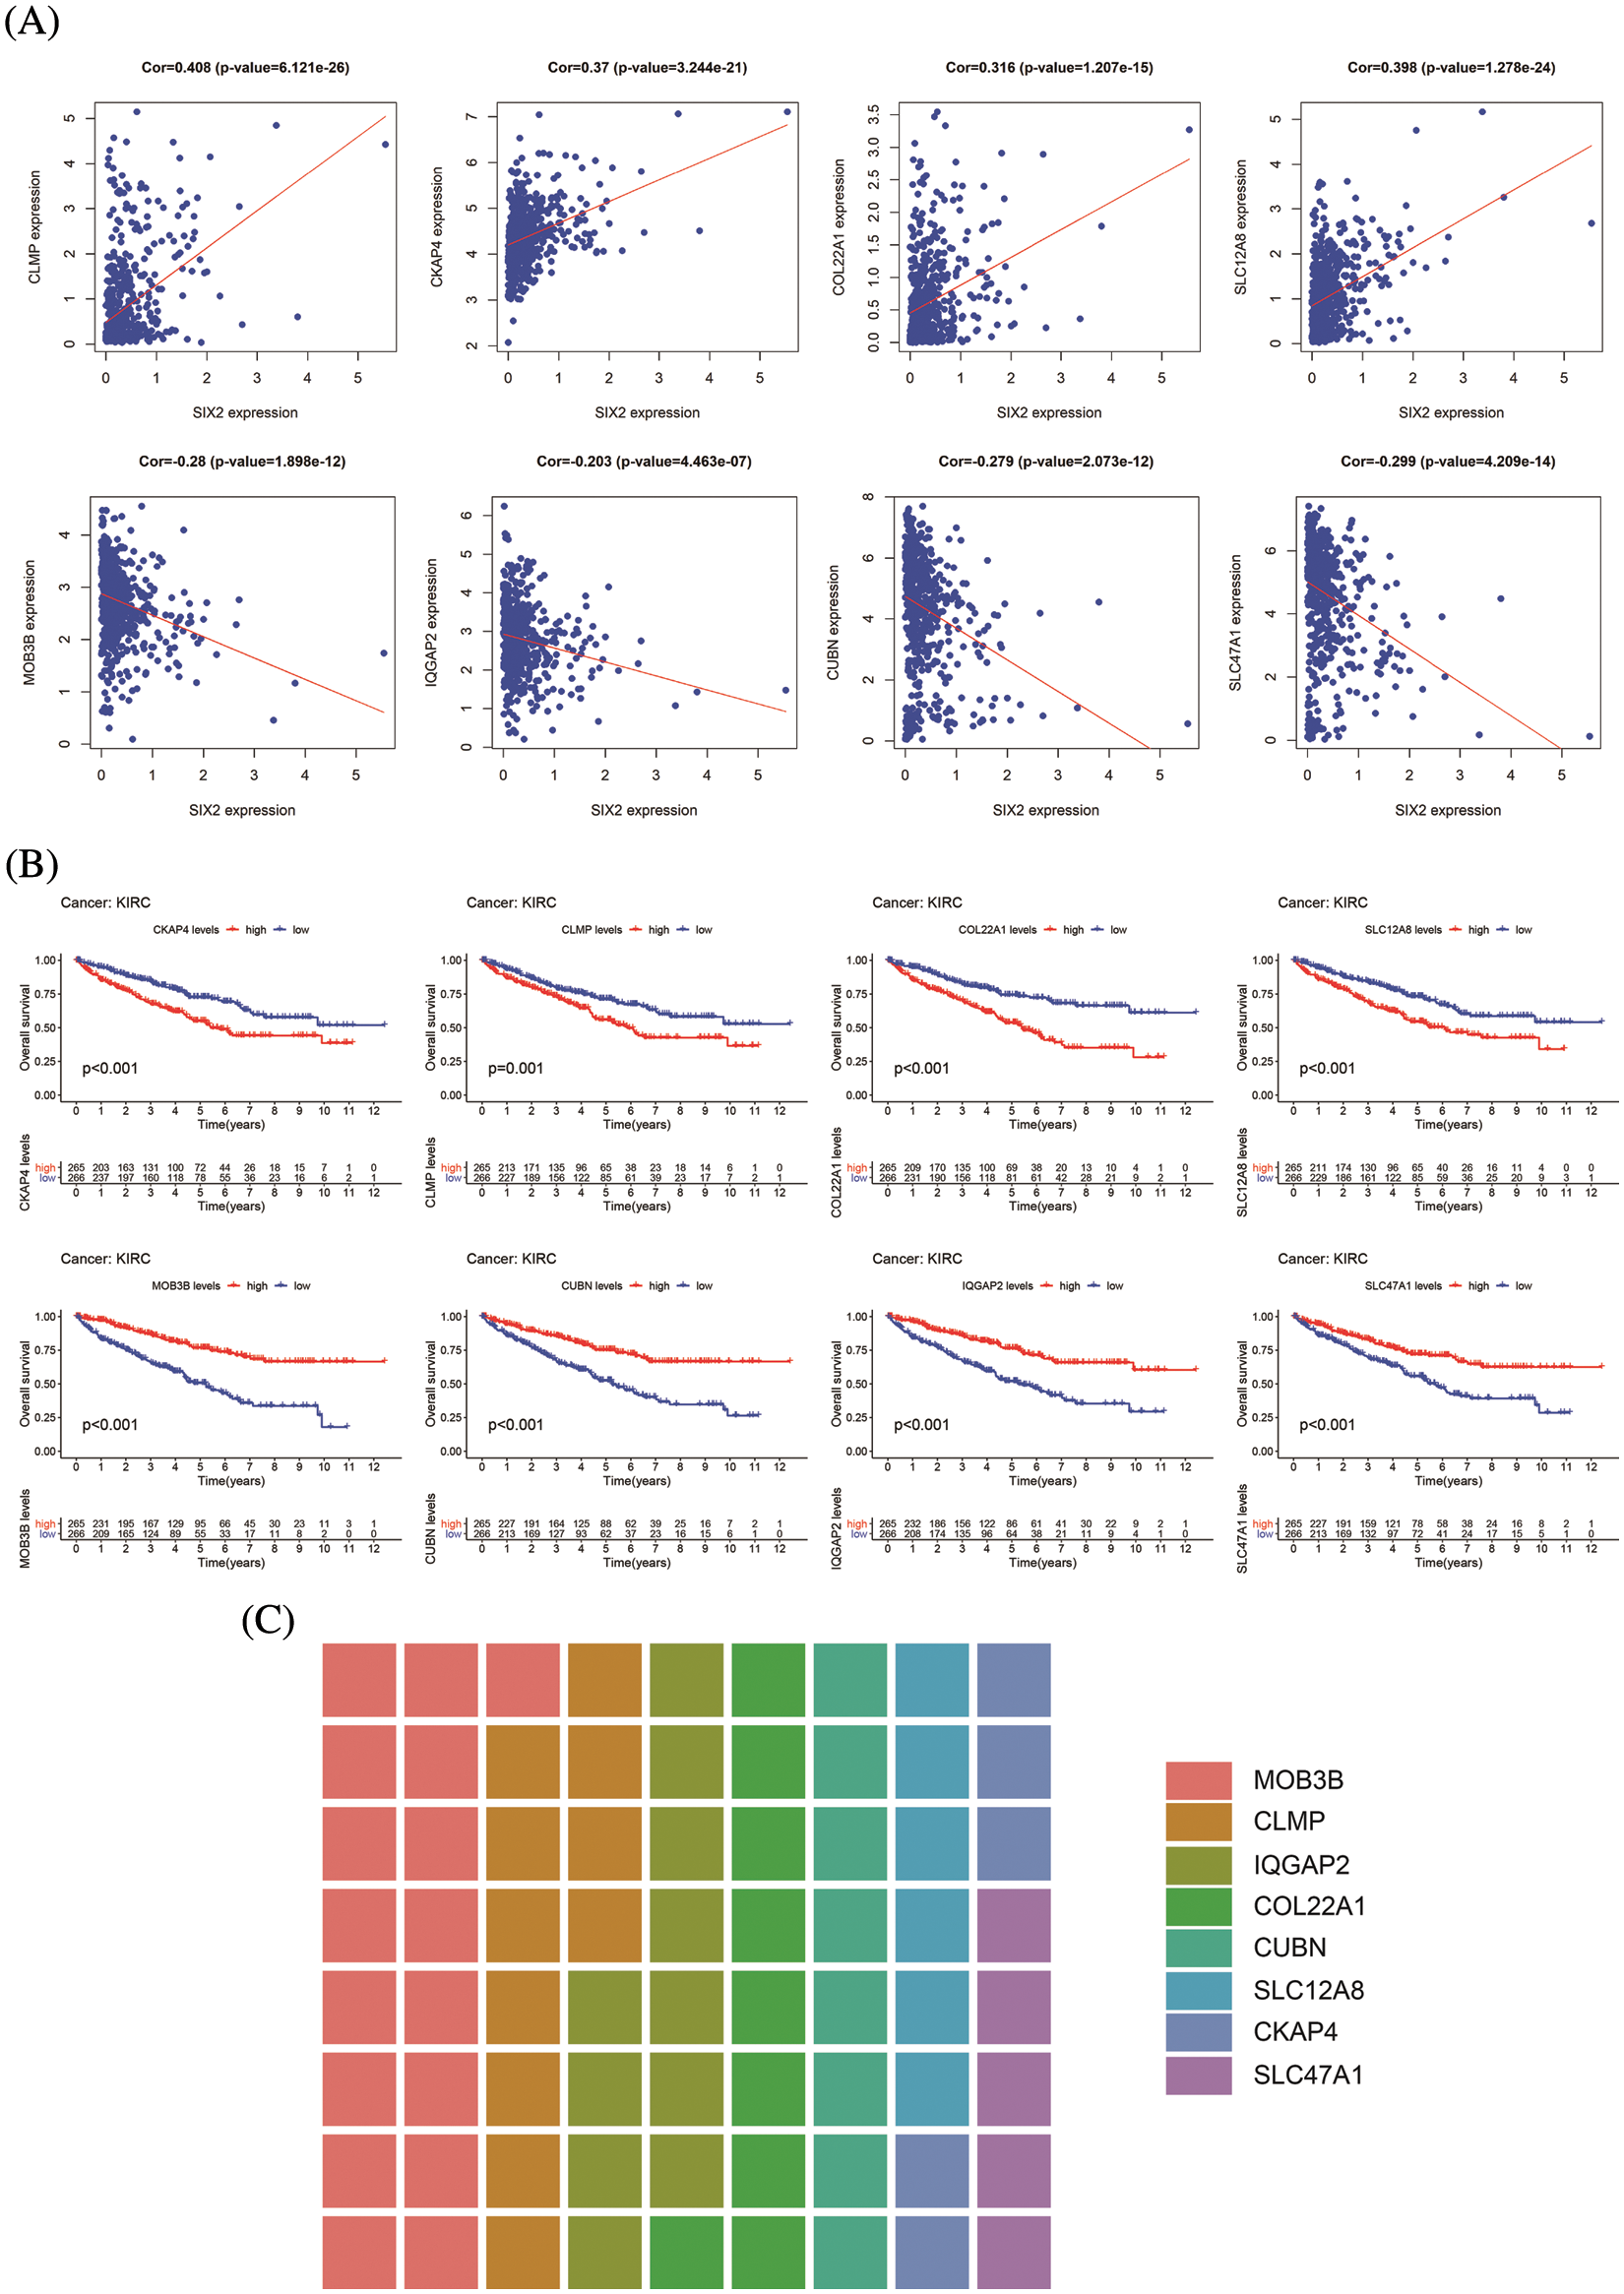
Figure S3: Information of eight hub genes. (A) The correlation between Six2 and eight hub genes. (B) The overall survival analysis of eight core genes. (C) The sitecount of eight genes
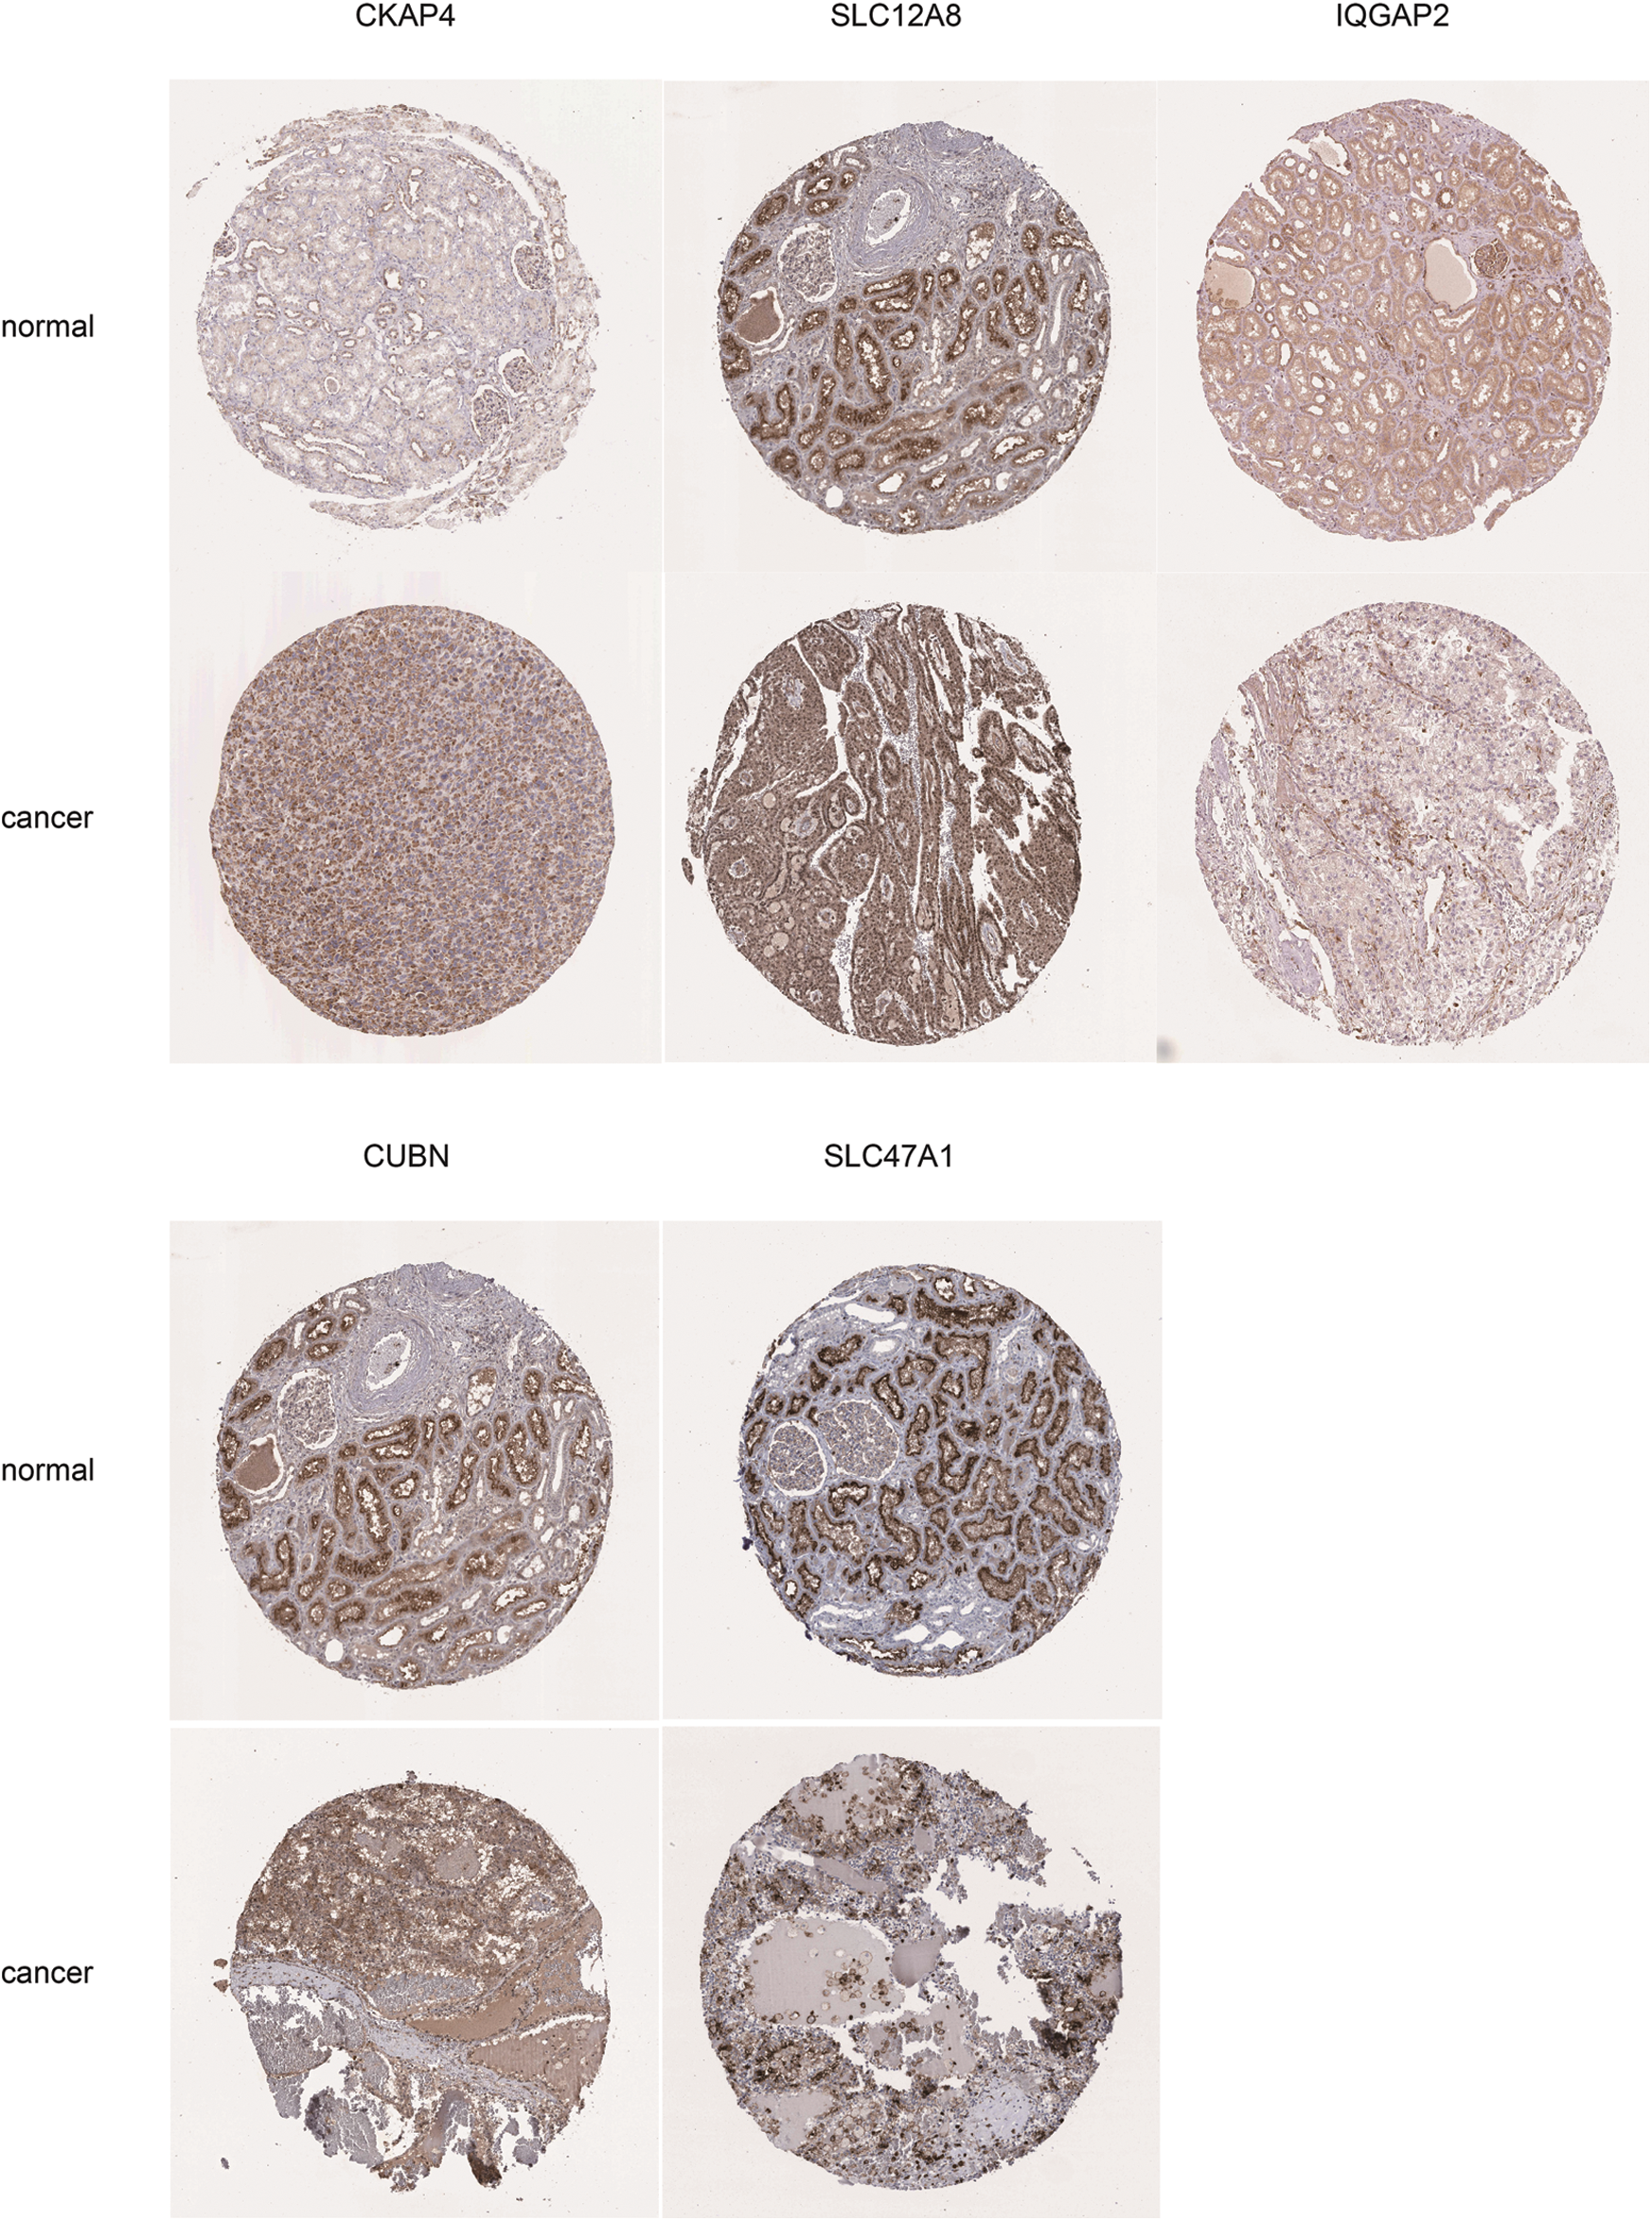
Figure S4: Immunochemistry results of key genes. The key genes expression level in normal kidney and cancer tissues from HPA, including CKAP4, SLC12A8, IQGAP2, CUBN, and SLC47A1
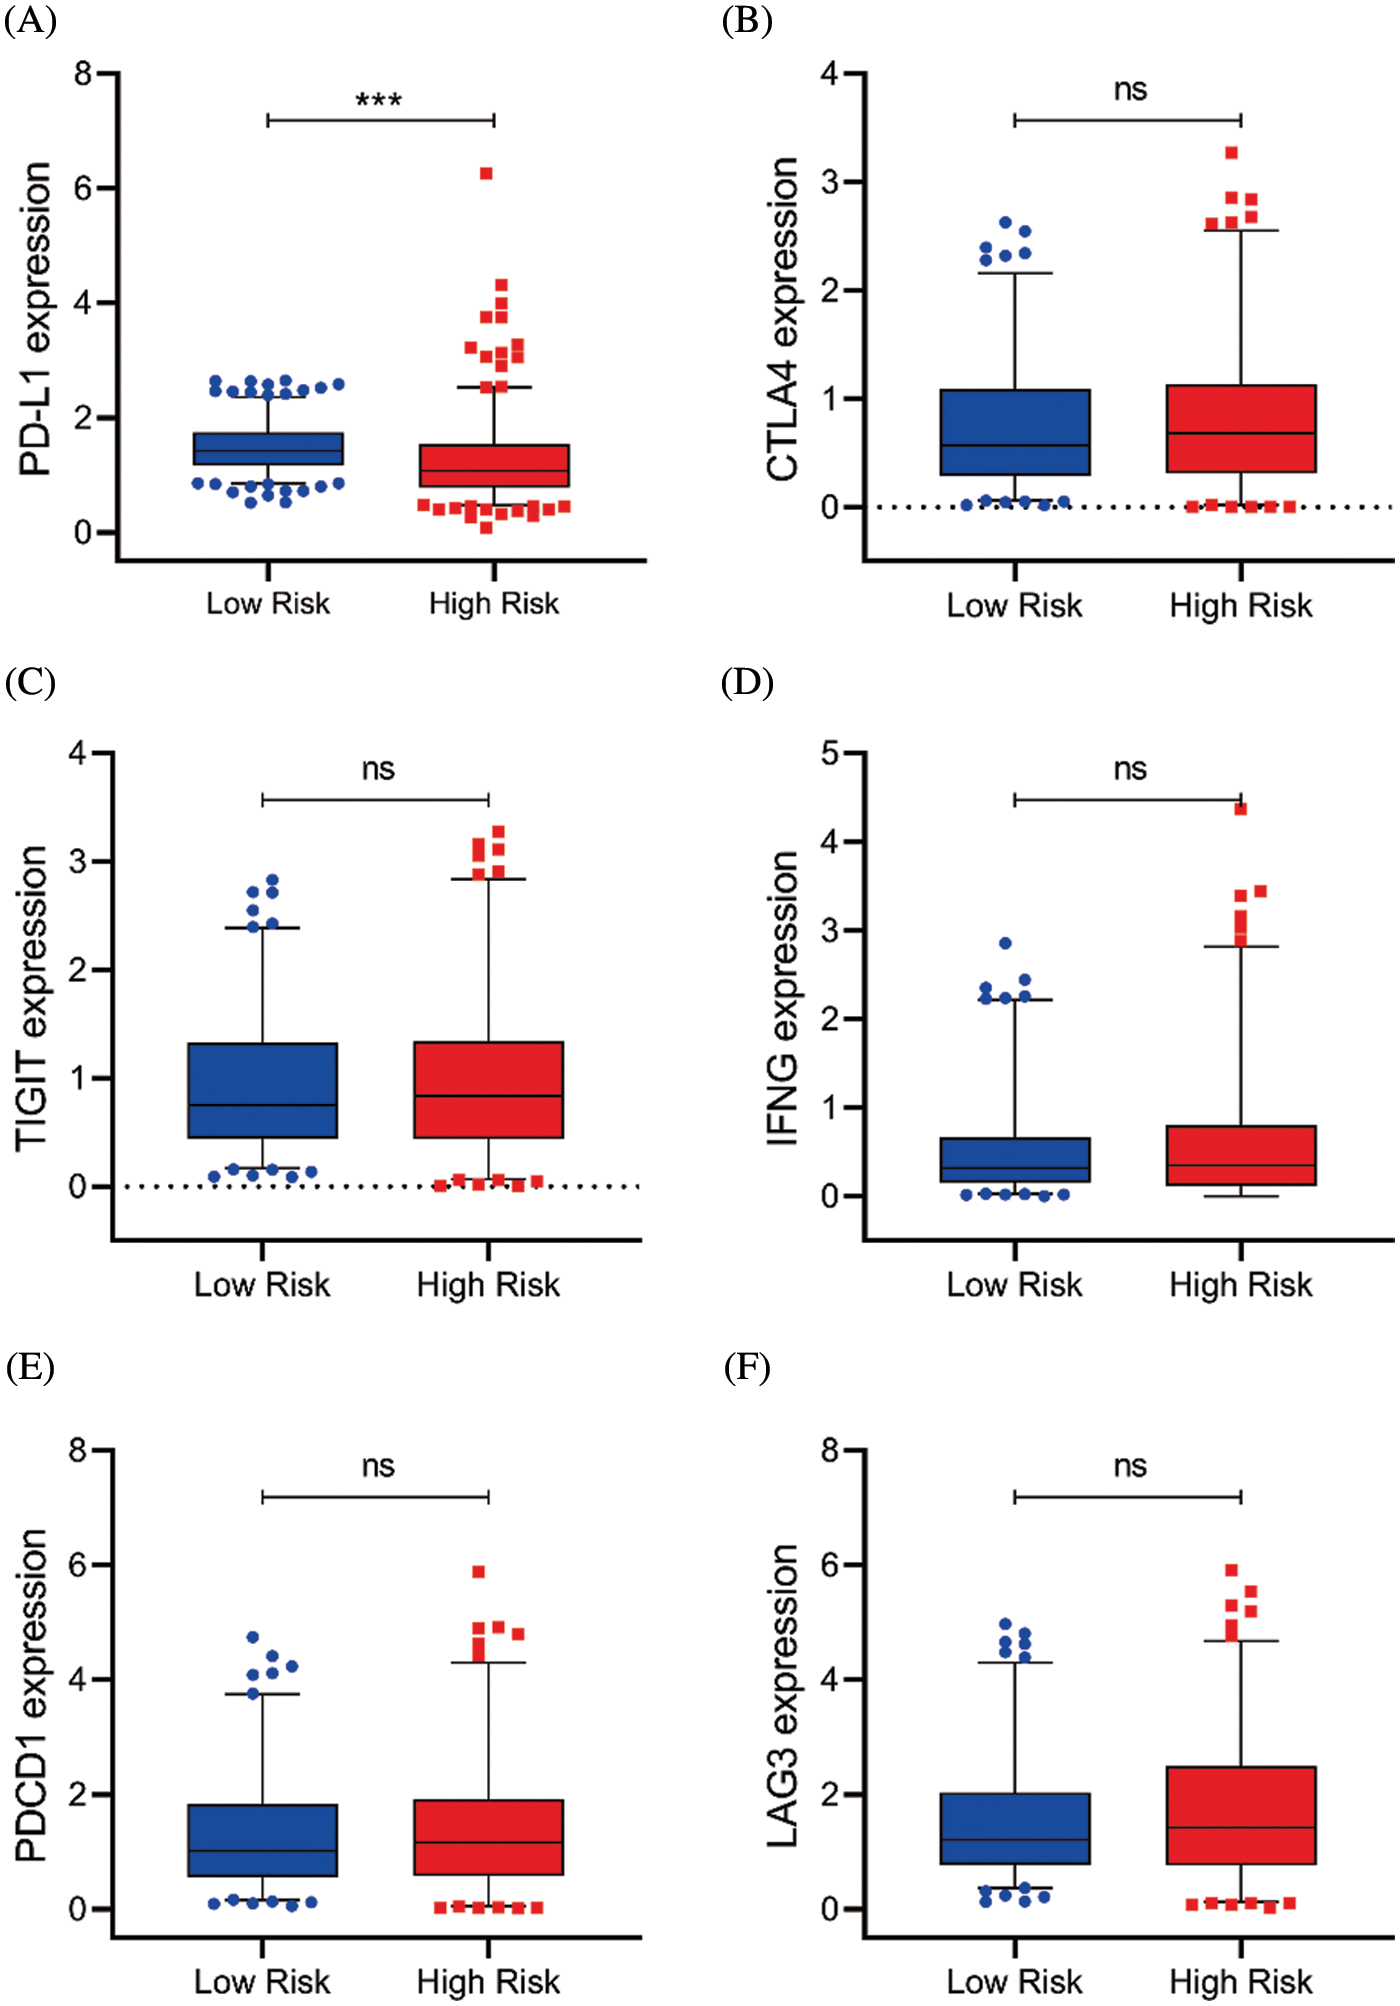
Figure S5: Serval representative immune checkpoints expression between the high and low-risk group. (A–F) The PD-L1, CTLA4, TIGIT, IFNG, PDCD1, and LAG3 expression in risk subgroups (ns, p ≥ 0.05, *p < 0.05, **p < 0.01, ***p < 0.001)
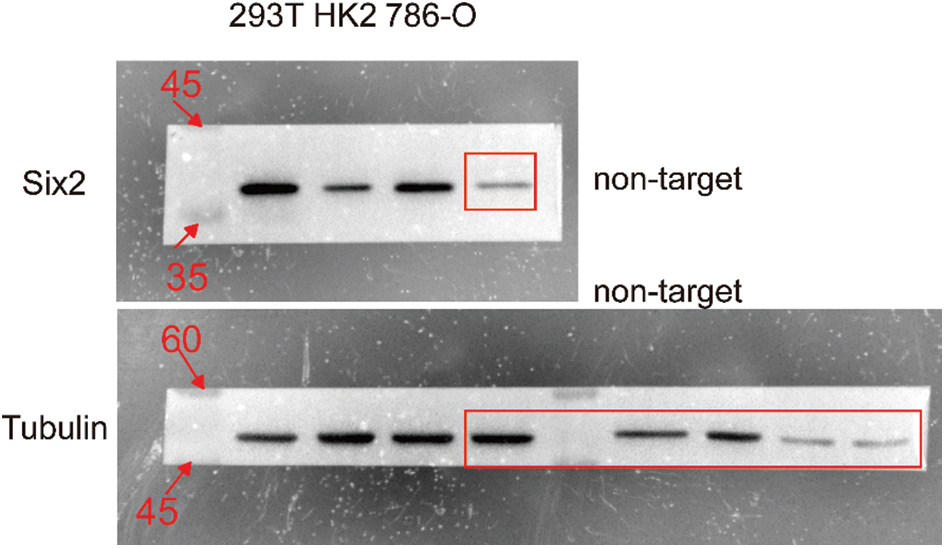
Figure S6: The uncropped blots shown in Fig. 1A
 | This work is licensed under a Creative Commons Attribution 4.0 International License, which permits unrestricted use, distribution, and reproduction in any medium, provided the original work is properly cited. |