| Oncologie |
DOI: 10.32604/Oncologie.2021.014764
ARTICLE
Comparison of Amino Acid Metabolisms in Normal Prostate (PNT-1A) and Cancer Cells (PC-3)
1Department of Urology, Usak University, Usak, Turkey
2Department of Medical Biochemistry, Harran University, Sanliurfa, Turkey
*Corresponding Author: Erkan Arslan. Email: arslan.20.erkan@gmail.com
Received: 27 October 2020; Accepted: 28 January 2021
Abstract: Prostate cancer is the second most common cancer in men. Prostate-specific antigen (PSA) levels, commonly used in the diagnosis of prostate cancer, are increased in both malign and benign conditions, such as prostate hyperplasia (BPH) and prostatitis. Thus, more specific markers are urgently needed to discriminate between prostate cancer and benign diseases of the prostate. The purpose of this study is to examine both the intracellular and extracellular free amino acid profiles of metastatic prostate cancer cells (PC-3), normal prostate cells (PNT-1A), and metabolic changes (e.g., pH). In this study, cancer and normal cells were incubated in the appropriate medium. Then, the cells were collected and lysed in a cold medium. Finally, intracellular and extracellular free amino acid profiles were analyzed using the liquid chromatography-tandem mass spectrometry (LC-MS/MS) method. Extracellular metabolites were analyzed via blood gas measurements, including pH, CO2, and O2. We determined that intracellular prostate cancer cells include high amounts of glutamic acid, aspartic acid, glutamine, alpha aminobutyric acid, glycine, and proline, while cancer cells mostly use hydroxyproline, serine, alpha aminobutyric acid, ethanolamine, and valine from the extracellular medium. It was also determined that the extracellular pH of cancer cells is more acidic than that of normal cells, and normal cells have higher levels of Ca+, Cl-, and Glu. In this study, we found that group amino acids have significant potential in prostate cancer pathogenesis; therefore, they have potential usefulness as a biomarker in the diagnosis of prostate cancer.
Keywords: Prostate cancer; PNT-1A; PC-3; free amino acid; metabolism
After skin cancer, prostate cancer is the most common type of cancer diagnosed in males. It is diagnosed more frequently after the age of 50. It is rarely diagnosed in individuals younger than age 50, which means that risk increases with age. Prostate cancer is the second most fatal type of cancer in males. More than 1.1 million cases are diagnosed globally each year, with 270,000 of them resulting in death [1].
Most early-stage prostate cancer patients are asymptomatic. However, terminal and metastatic prostate cancer can cause lower urinary tract symptoms, which can also be caused by benign hyperplasis of the prostate gland [2]. A stage 1 prostate cancer diagnosis is made based on the results of a rectal examination and the patient’s serous prostate-specific antigen (PSA) levels. Although these parameters can improve the accuracy of prostate cancer diagnosis and increase awareness, they may also render false positive/negative results. They may also prove inefficient in differentiating more aggressive forms of prostate cancer [3].
Studies also show that PSA increases in both cancer and benign cases, such as benign prostate hyperplasis (BPH) and prostatitis [4]. Therefore, it is now commonly agreed that PSA is not a cancer-specific protein but a protein specific to the organ itself (i.e., the prostate gland). Consequently, more specific methods and instruments are urgently needed to discriminate prostate cancer from benign diseases [5].
Cancer cells demonstrate metabolic changes that differentiate them from normal cells and make them vulnerable to anticancer agents. Metabolism, biosynthesis, and proteinogenic and non-proteinogenic amino acids change considerably in prostate cancer. These metabolic changes help meet cancerous prostate cells’ high energy demands, even under unfavourable conditions, such as hypoxia and oxidative stress [6]. Rapid developments in molecular technology, such as metabolomic profiling, have recently provided a way to identify various potential biomarkers for prostate cancer [7].
Metabolites make good biomarkers for diagnoses. Biomarkers are substances, such as amino acids, carnitin, and organic acids. They are produced by the body, are found in the blood, and can indicate a specific process, condition, or disease. Some studies suggest that tumor cells indicate various metabolic signs [8]. In the past decade, the number of studies focused on detecting metabolomic biomarkers for prostate cancer has increased significantly [9,10]. Reserchers have been studying the usefulness of small metabolites, such as caveolin-1, annexin-3, circulatory RNAs, 8-hydroxy, 2-deoxyguanosine, and amino acids, with promising findings [11,12]. These studies typically focus on central carbon metabolism, including cancer metabolism, glycolysis, and tricarboxylic acid cycle (e.g., the citric acid cycle or tricarboxylic acid [TCA] cycle); newer studies, however, strive to shed light on the significant role of amino acids in cancer metabolism. Its extensive metabolic activity has made amino acid metabolism even more popular in cancer research [13,14].
Amino acids are known to play a significant role in facilitating modifications emerging after epigenetic regulation and transcription, as well as in regulating energy, providing biosynthetic support and homeostatic balance, and keeping redox in balance. Methionine, serine, and glycine regulate methionine, which is essential in DNA and histone methylation methylation [15,16], and acetyl-CoA, which plays an important role in tumor cell growth, is derived from branched-chain amino acids and lycine [17,18]. Thus, they are promising targets for this research.
Previous studies have paved the way for developing new cancer treatments by targeting the enzymes that cause amino acids to be synthesized, dissolved, and transported. Enzyme-dissolving amino acids, such as arginase and asparaginase, have shown antitumor effects in both preclinical and clinical environments [19]. Various studies have investigated the metabolomic profiles of prostate cancer patients. In one of these studies, amino acids were found to have high potential for use as prostate cancer biomarkers, concluding that ethanolamine, arginine, and branched-chain amino acid (BCAA) metabolic pathways may be valuable biomarkers for prostate cancer. It has been found that varying concentrations of these metabolites demonstrate their role in the pathogenesis of prostate cancer and should be considered clinically useful markers of prostate cancer [20]. On the cellular level, no significant studies of prostate cancer and the metabolite profile of normal prostate cells have been conducted. Therefore, this study is one the first. We compare the intracellular and extracellular amino acid profiles of cancerous and normal prostate cells and discuss their usefulness in diagnosing and treating prostate cancer.
2.1 Cell Cultures and Cell Cultivation
In this study, two human prostatic cell lines were used. The PNT-1A human cell line is derived from normal adult prostatic epithelial cells immortalized by transfection with a plasmid containing the SV40 genome with a defective replication origin. The primary culture was obtained from the normal prostatic tissue of a 35-year-old male postmortem. PNT-1A is a PTEN-positive nontumorigenic epithelial cell line. The PC-3 human epithelial cell line was established from a grade four prostatic adenocarcinoma, androgen independent, and unresponsive metastatic site in bone tissue. PC-3 is PTEN- and p53-negative. All cell lines used in this study were purchased from ATCC and ECACC Cell Culture Collections.
PNT-1A cells were cultured in RPMI-1640 medium with 10% fetal bovine serum (FBS). PC-3 cells were cultured in DMEM-F12 medium with 10% FBS. Both media were supplemented with 1% L-glutamine and 1% penicillin/streptomycin. Cells were maintained at 37°C in a 95% humidified incubator with 5% CO2 (Thermo, USA). The passages of the PNT-1A and PC-3 cell lines ranged from 15 to 20.
After the cells reached 80% in 25 cm2 flasks, the study was initiated. Intracellular free amino acid profiles were analyzed in accordance with the method used in our previous study [21]. In this method, the remaining medium was removed after the sample was taken from the medium following incubation. After the cells were washed twice with cold phosphate buffer solution (PBS), they were scraped with a cell scraper to remove the remaining medium. The cell suspension was placed in a sterile tube with 1 ml of cold PBS. Pellets were obtained by removing supernatants via centrifuge at 3000 rpm for 5 min. The obtained pellet was washed twice with cold PBS and then lysed with a cold lysis buffer and homogenizer (qiagen tissuelyser) at +4°C for 10 min. The obtained lysate was centrifuged at 14,000 rpm. Analyses were performed with the obtained supernatant. To analyze extracellular metabolites and amino acid changes, flasks with no cells were used in the same medium. Analyses were performed by taking samples at the end of the period.
2.2 Analysis of Free Aminoacid Profiles via LC-MS/MS
The analysis of intracellular and extracellular free amino acid profiles was performed via LC-MS/MS (Shimadzu-8045), as well as by modifying the method previously developed by Celik et al. [22] and applying the commercial kit protocol (Trimaris). The derived method is used in this kit method in the analysis of free amino acids. In this method, the ingredients are prepared in 0.1 M of HCl and consist of amino acids, including 20 atoms signed as C13 and N15. They are mixed with the standard mixture after 100 µL of the sample is taken. During the second phase, organic buffer compounds with basic characters prepared in propanol are added to balance the pH and provide a more productive derivative reaction. During this phase, proteins in the sample are also precipitated. Then, 5% alkyl chloroformate was added to a chloroform/isooctane mixture as an active compound and left at room temperature for 3 min. The derivatized amino acids are taken to the upper phase, including the organic solvents, by centrifugation. Next, 1 µL is injected into the LC-MS/MS system during this phase. As the molecular weight of the esterified amino acids increases after the extraction and derivatization process, they become more volatile, and the signal on the MS device increases. Chromatographic separation was performed on a Trimaris Amino Acid LC-MS/MS column (250 mm × 2 mm, 3 µM) containing a C18 reverse-phase filter. The mobile phase A content was determined as water: MeOH: 1M ammonium formate (85:14:1), and the mobile phase B content was determined as MeOH. Amino acid molecules were analyzed in the multiple reaction monitoring (MRM) mode using the electrospray ionization method.
2.3 Analysis of Extracellular Metabolite Changes
The method previously developed by koyuncu et al. [23] was used in the study to analyze extracellular pH, glucose, Ca, K, CI, lactate, pO2, and pCO2 changes. Extracellular metabolite changes were measured with a commercial blood gas device (ABI-90 Flex Plus, Radiometer, Copenhagen, Denmark), which is routinely used in the hospital’s clinical biochemistry laboratory. After the application of the substance, the media were analyzed directly by the device.
SPSS version 24 software was used in the statistical evaluation of all results obtained. Independent sample-t test (t-table value) and Mann-Whitney U test (Z-table value) statistics were used to compare the two independent variables.
3.1 Analysis of Intracellular Amino Acid Profile
Intracellular free amino acid profiles of prostate cancer (PC-3) and normal prostate (PNT-1A) cells were analyzed using the LC-MS/MS method. The results are presented in Tab. 1 and Fig. 1.
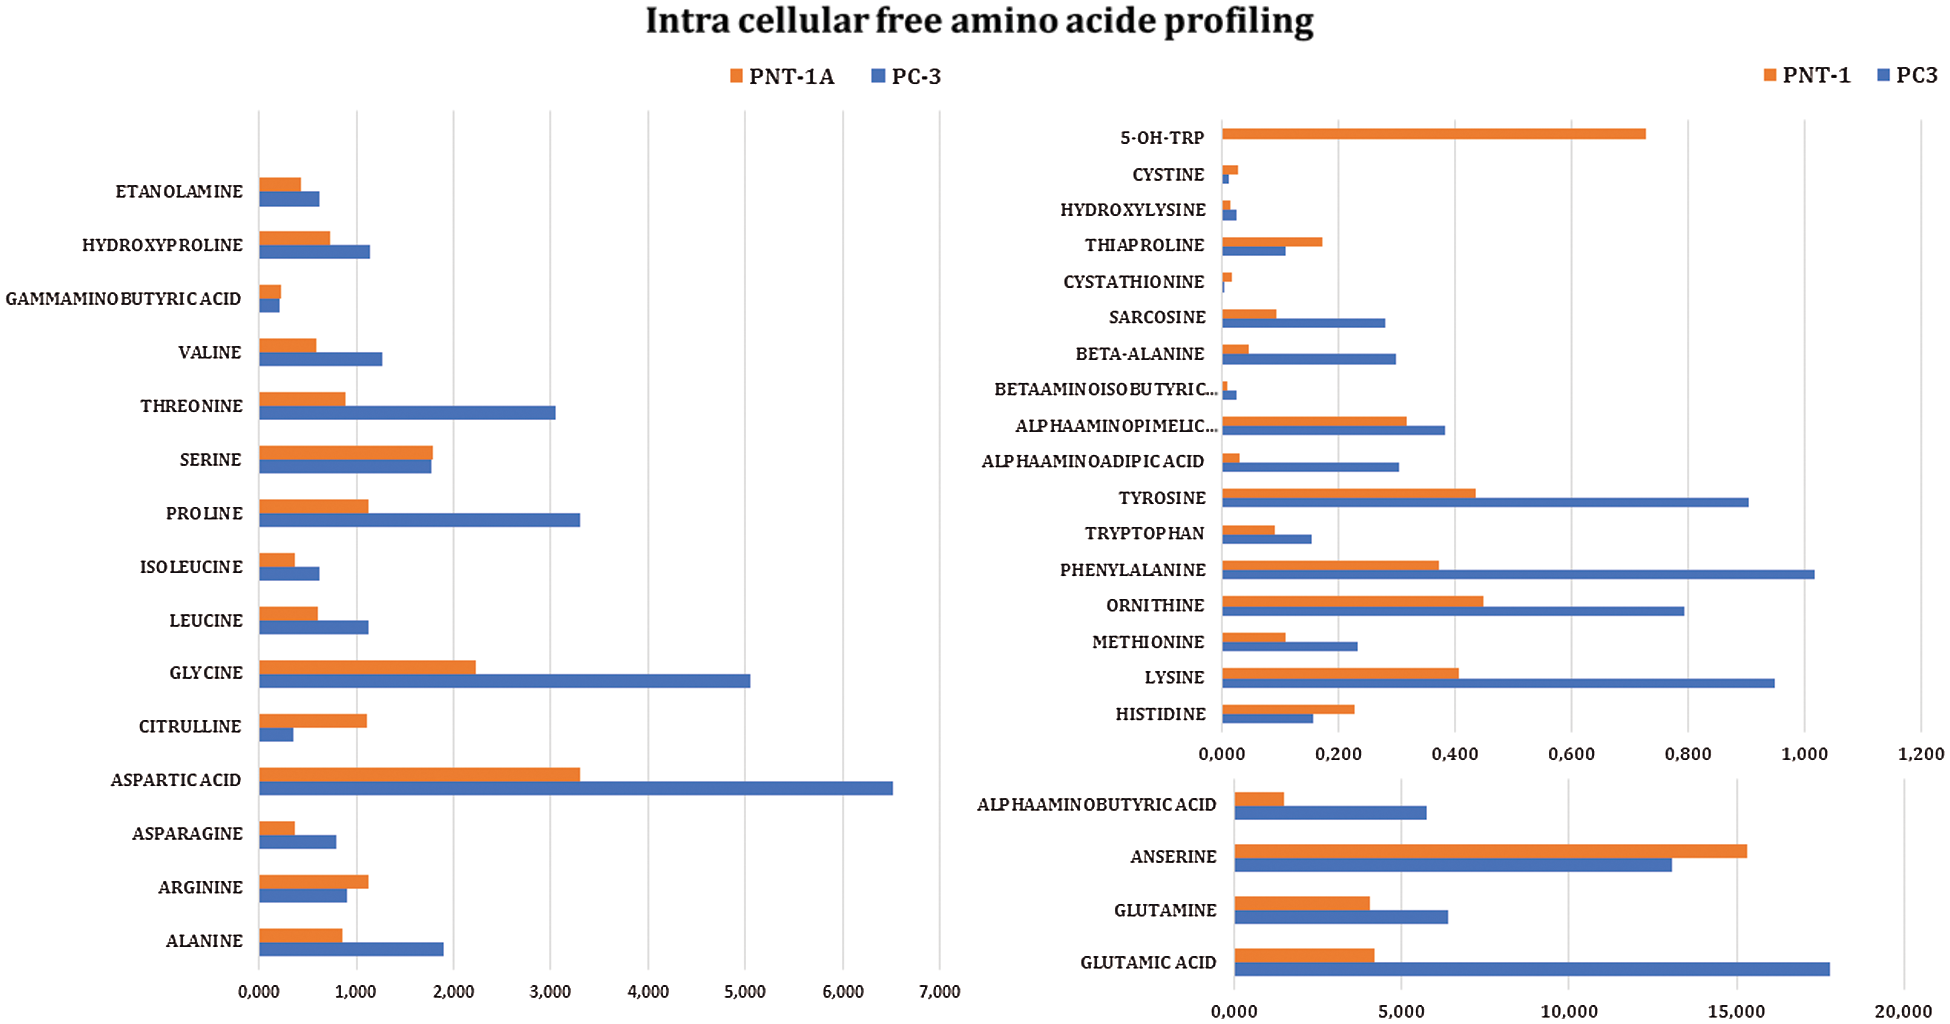
Figure 1: Intracellular free amino acid profiles of prostate cancer (PC-3) and normal (PNT-1A) cells
Table 1: Intracellular free amino acid profiles of prostate cancer (PC-3) and normal cells (PNT-1A). All data are expressed as mean ± SD values from three independent experiments and compared with the control group. *p-values < 0.05 are considered significant
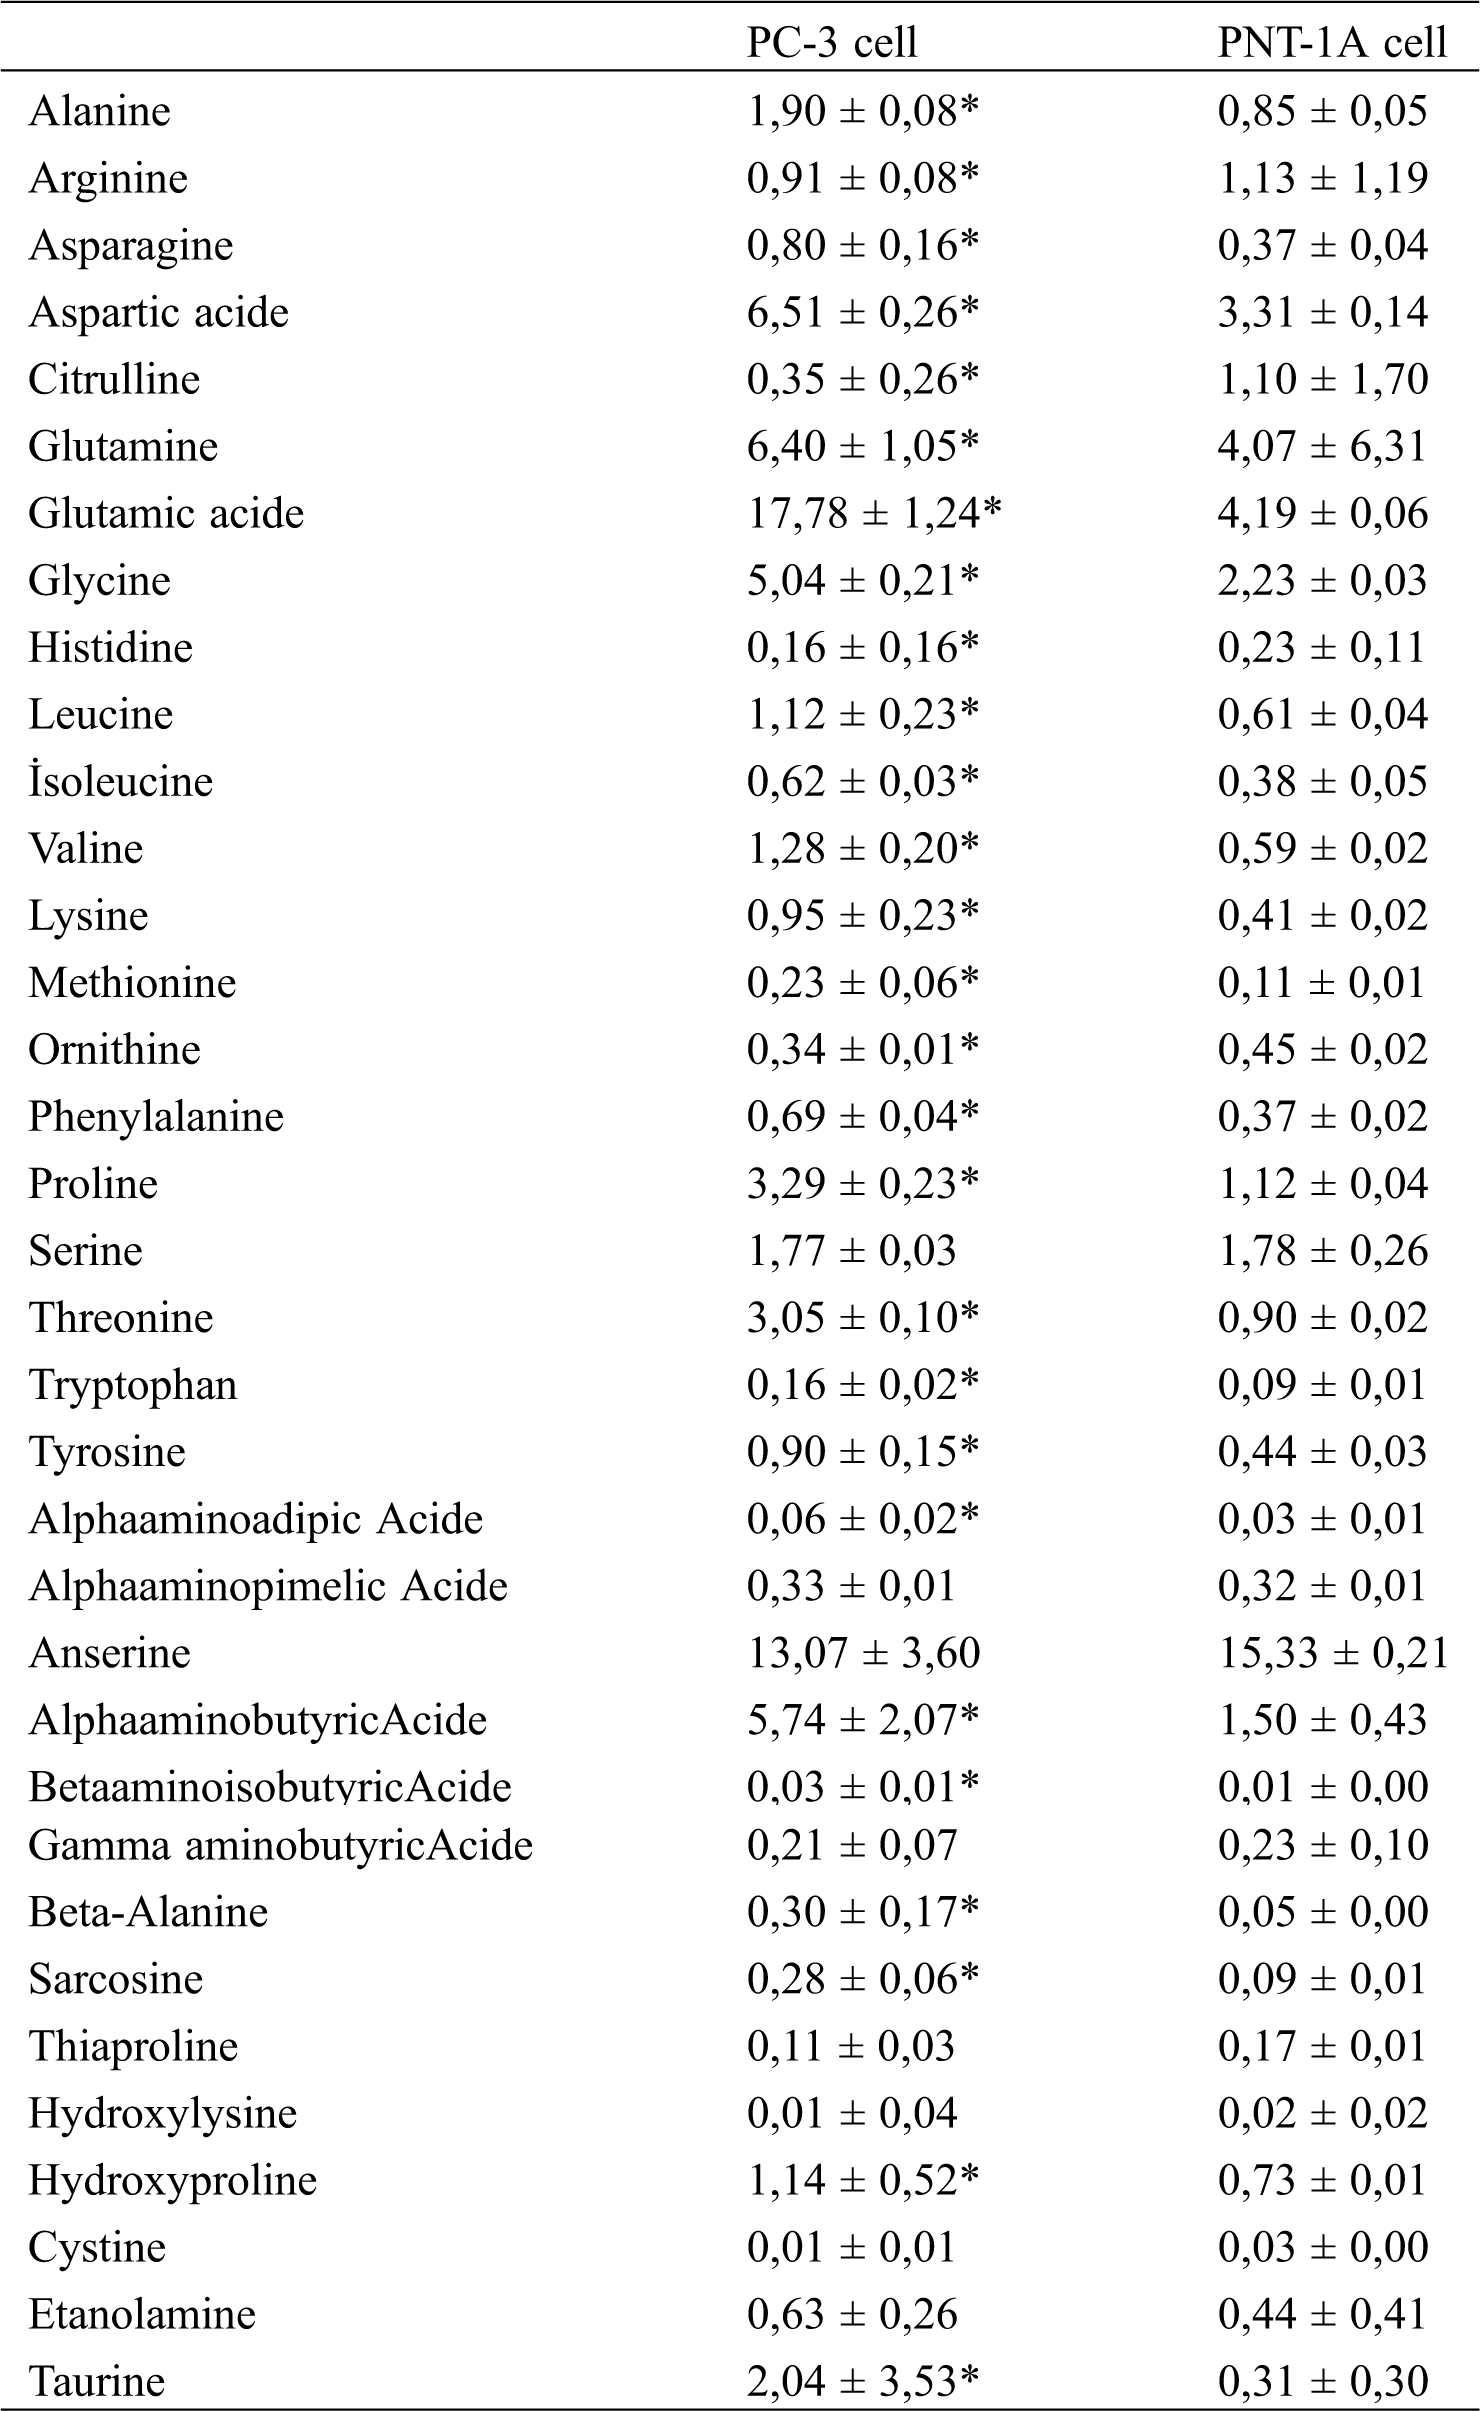
When the results in Tab. 1 were examined, it was observed that the levels of some amino acids were significantly higher in prostate cancer cells than in normal prostate cells, while the levels of other amino acids were significantly lower than in normal cells. From the lowest to the highest ratio, glutamic acid, aspartic acid, glutamine, alpha aminobutyric acid, glycine, and proline are present in prostate cancer cells (PC-3), while anserine, glutamic acid, glutamine, aspartic acid, glycine, serine, and alpha aminobutyric acid are present in normal prostate cells (PNT-1A). When the free amino acid profiles of normal prostate cells were compared to those of prostate cancer cells, it was observed that arginine, citrulline, histidine, ornithine, thiaproline, hydroxy lysine, and cystine amino acids were significantly high in normal cells, whereas no significant changes were observed in serine, alpha-amino pimelic acid, and gamma-aminobutyric acid levels. It is determined that levels of the remaining amino acids are significantly high in prostate cancer cells.
3.2 Extracellular Amino Acid Profile Changes
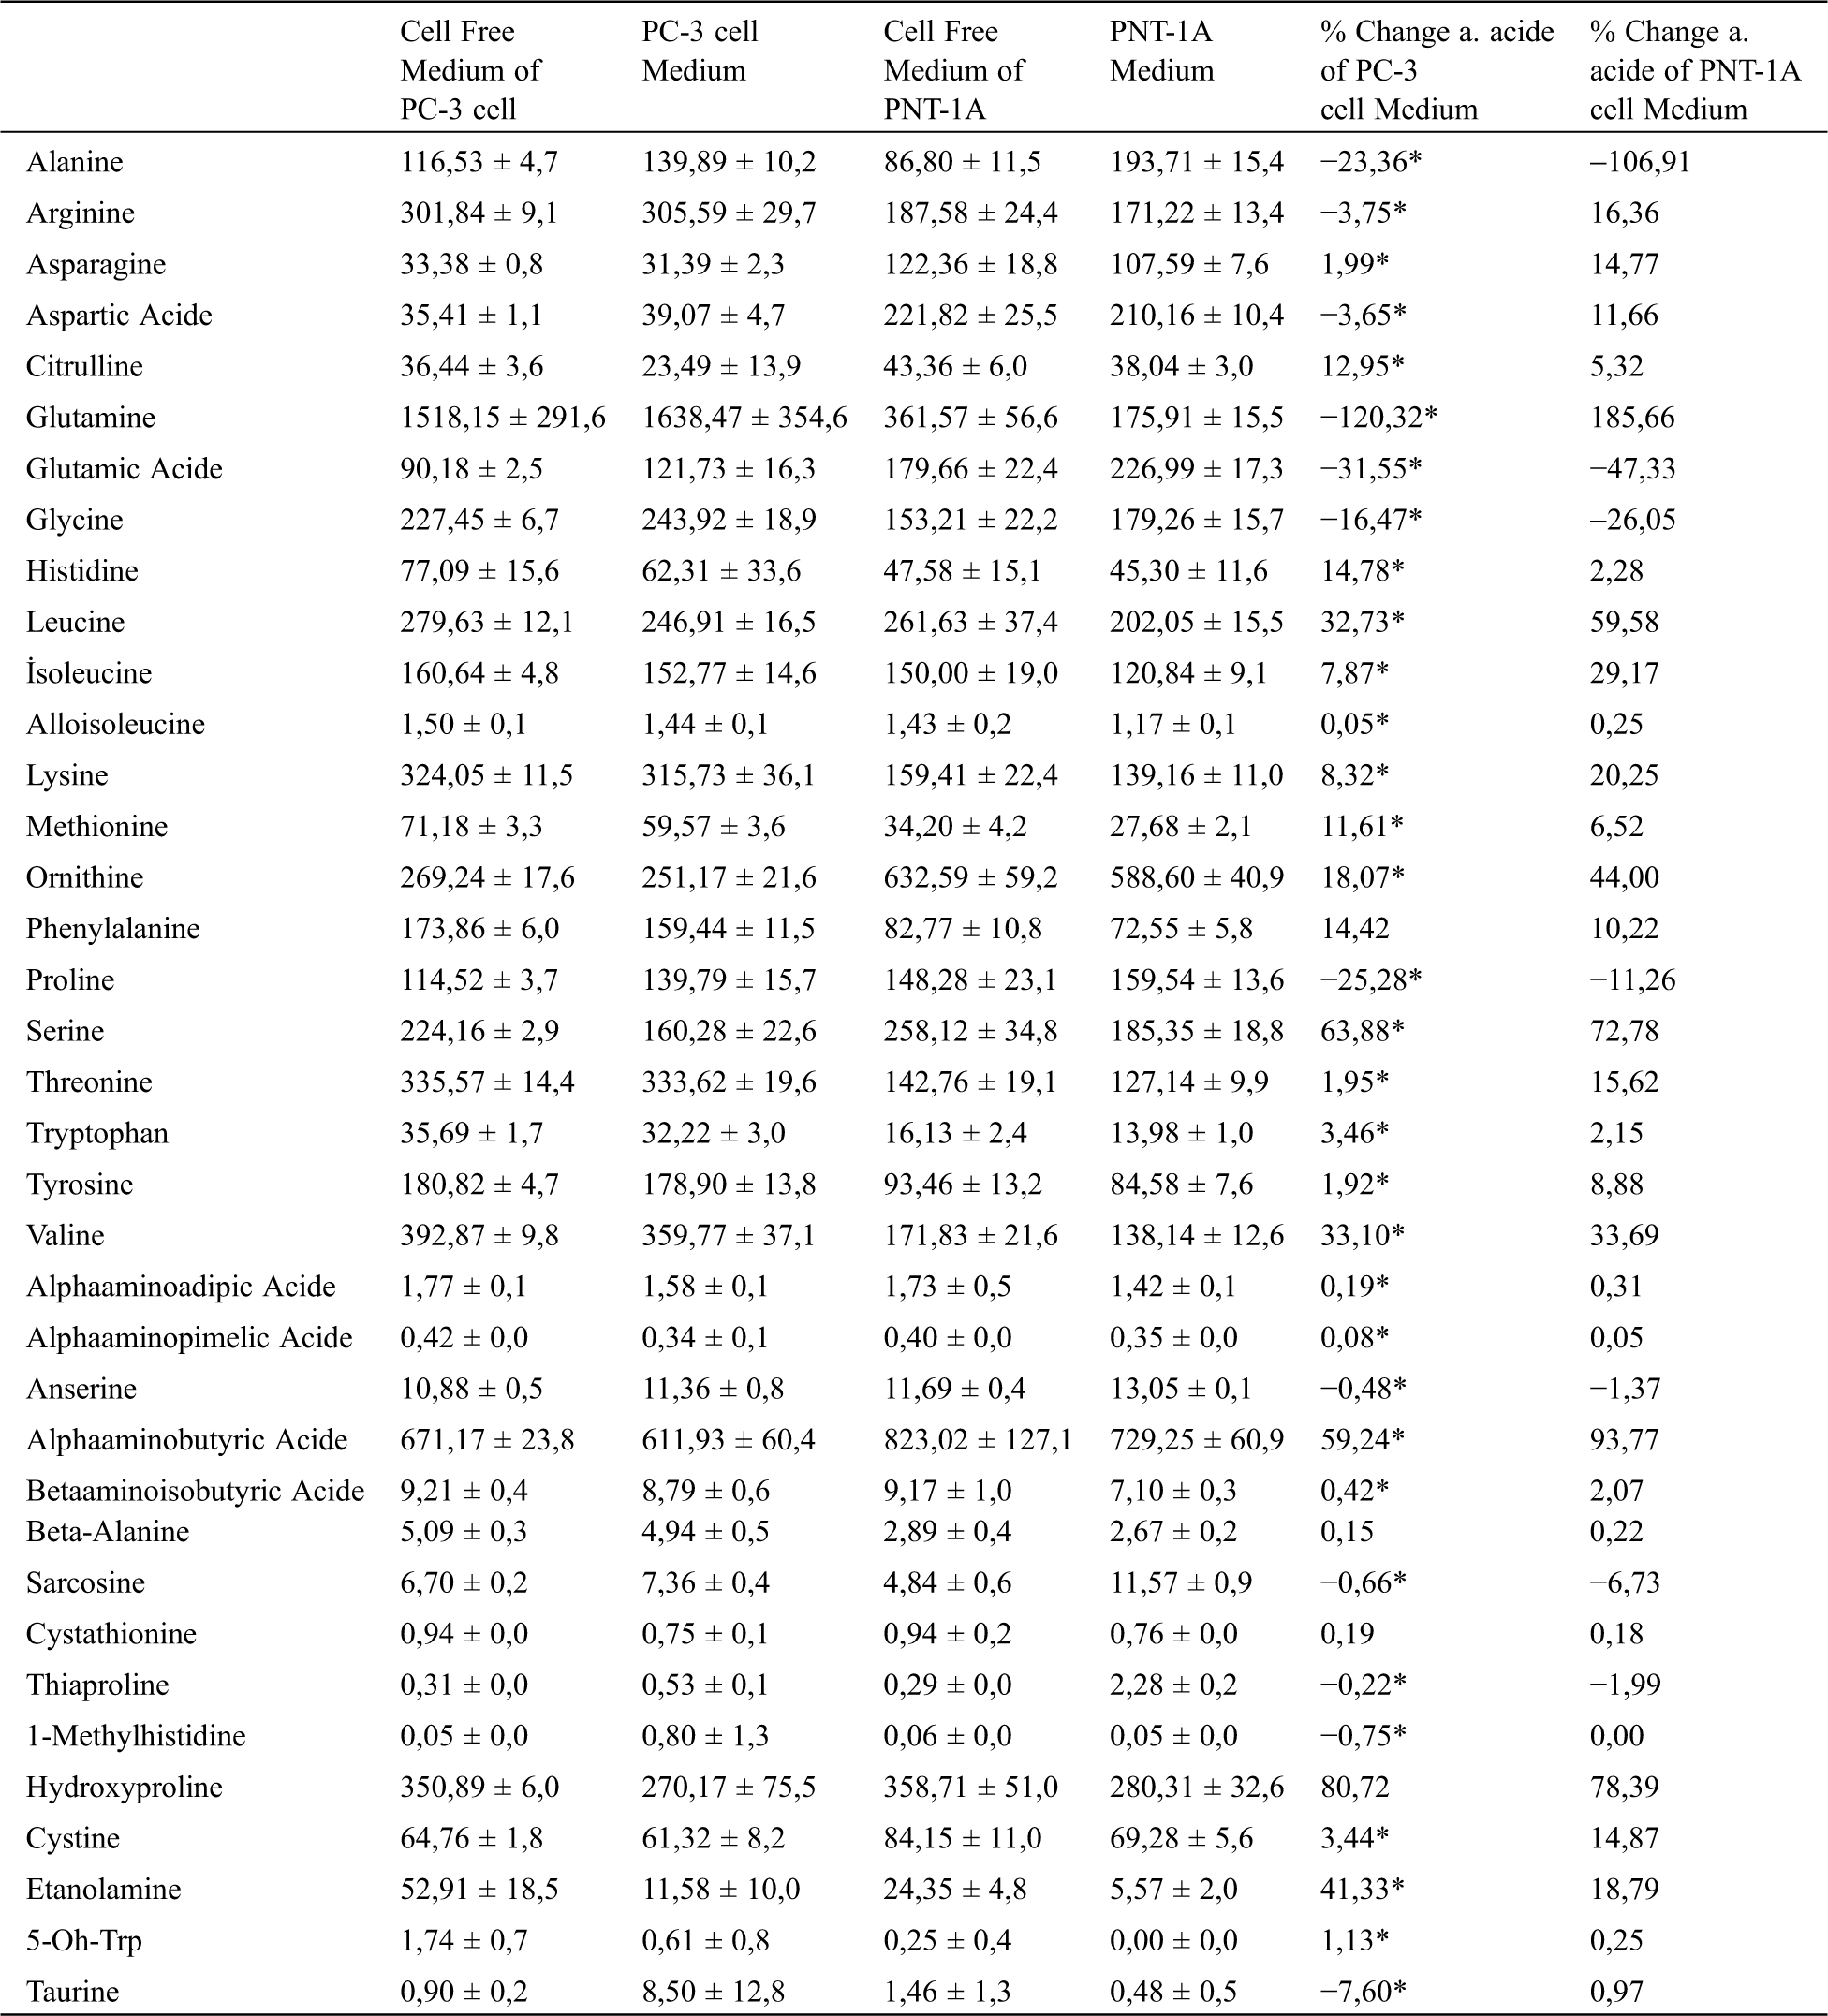
To examine the free amino acid profiles of cells taken from the medium, flasks containing media with and without cells were incubated in the medium. Following incubation, the free amino acid profile of the mediums was analyzed using the supernatant. Amino acid changes in cancer and normal prostate cells in the medium are presented in Tab. 2. The results of the analysis reveal that the cancer cells mostly used hydroxyproline, serine, alpha aminobutyric acid, ethanolamine, valine, leucine, ornithine, histidine, phenylalanine, citrulline, and methionine from the medium. However, normal cells used glutamine, alpha aminobutyric acid, hydroxyproline, serine, leucine, ornithine, valine, isoleucine, lysine, ethanolamine, arginine, threonine, and gamma-aminobutyric acid. It was also determined that cancer cells mostly secreted glutamine, glutamic acid, proline, alanine, glycine, and taurine into the medium, whereas normal cells secreted alanine, glutamic acid, glycine, proline, and sarcosine acid.
Table 2: Extracellular free amino acid profiles of prostate cancer (PC-3) and normal (PNT-1A) cells. All data are expressed as mean ± SD values from three independent experiments and compared with the control group. *p-values < 0.05 are considered significant
3.3 Extracellular Metabolite Changes
Metabolite changes in normal prostate and cancer prostate cells were measured with a blood gas device routinely used in the clinical biochemistry laboratory. Metabolite amounts and changes in cancer and normal prostate cells are presented in Tab. 3. When the extracellular environment (pHe) of prostate cancer cells was compared, it was determined that the pH in PC-3 cells was 7.0, whereas for PNT-1A cells, it was 7.4 (i.e., more alkaline). When changes in the metabolites of prostate cancer cells were examined, it was observed that Ca+, Cl−, and glucose levels were higher compared to normal cells r, but K levels were lower.
Table 3: Extracellular metabolite and pH profiles of prostate cancer (PC-3) and normal (PNT-1A) cells. All data are expressed as mean ± SD values from three independent experiments and compared with the control group. *p-values < 0.05 are considered significant

The lack of a consistent biomarker for the diagnosis and follow-up of prostate cancer highlights the need for new, specific, sensitive, and cost-effective biomarkers to implement the best therapeutic approach in the early stages of the disease [24]. Many findings have been published regarding the discovery of new biomarker candidates to reduce the false-positive rate associated with the PSA test and increase diagnostic accuracy in prostate cancer. These biomarkers constitute various biological components, such as proteins and metabolites [24–26].
Metabolomics can give an idea of the physiological state of a biological system, and therefore, changes in a “normal” metabolome may be a sign of disease. Such changes in the metobolome have the potential to provide new diagnostic markers for the detection and prognosis of diseases and to monitor the response to therapeutic interventions [27]. Moreover, metabolomics have the potential to ascertain the impacts of phenotypic changes derived from genetic modifications and environmental effects [5]. For this reason, metabolites are the most significant indicators of what happens to a cell’s metabolism under physiological or pathophysiological conditions. Identifying the dysfunctional metabolic pathways of cancer cells through metabolomics can be utilized to identify new cancer biomarkers concerning cancer development and its metastasis and to discover new therapeutic targets [28–30]. As cancer cells are associated with various metabolic pathways, the determination of low molecular weight metabolites, such as amino acids, in biological liquids could be used to develop a less invasive and more accurate diagnostic method. Various studies have found that free amino acid profiles vary depending on the type and stage of the cancer [31–33].
In recent studies, it has been determined that amino acids play an important role in cancer metabolism as both a tumor suppressor and tumorigenic. Amino acids are involved in pathways that feed cancer cells and provide building blocks for cancer cell growth. For instance, glutamate, threonine, and BCAA lead ATP to be released and, therefore, the required energy for oncogenic activities by feeding TCA cycle intermediates [34]. Furthermore, amino acids are involved in the biosynthesis of nucleotides, which are critical building materials for growth in both normal and cancer cells. They help regulate lipid biosynthesis and ROS homeostasis and increase metastasis by providing epigenetic regulation in tumor cells via methylation and acetylation. However, some amino acids can contribute to both tumorigenic and anti-tumorigenic activities by taking certain metabolic intermediates from amino acids. For instance, while nitric oxide (NO), a product of arginine metabolism, supports tumor growth by promoting angiogenesis, it can partly act as a tumor suppressor by upregulating p5378 [14,35].
Amino acids have the potential to be used as biomarkers in the treatment of various cancer types, especially prostate cancer, due to their significant properties. There are some articles on amino acid metabolism in prostate cancer; however, there have not been enough studies of amino acid metabolism at the cellular level. When studies of amino acids in prostate cancer were reviewed, we found that when Miyagi et al. [33] used high-performance liquid chromatography-electrospray ionization-mass spectrometry (HPLC-ESI-MS) to analyze 19 plasm free amino acid profiles of prostate cancer patients, most of them were pathogenic. They identified significant differences between prostate cancer patients and controls and concluded that amino acid profiling has significant potential to improve prostate cancer screening [16]. Shamsipur et al. used gas chromatography-mass spectrometry (GC-MS) and LC-MS/MS to analyze amino acid profiles in the urine of prostate cancer patients and determined that some amino acids, such as sarcosine, alanine, leucine, and proline, can be used as biomarkers in prostate cancer. In a similar study of amino acid profiles in urine, Heger et al. [36] determined that non-proteinogenic sarcosine could be used as a biomarker. In Kratochvilova et al.’s [37] study of zinc-resistant prostate cancer cells and normal cells, they concluded that restricting essential amino acid groups, such as threonine or methionine, or inhibiting aspartate synthesis could be a promising approach for prostate cancer treatment with minimal toxic side effects [37].
Changes in both the intracellular and extracellular free amino acid profiles of normal prostate (PNT-1A) and prostate cancer (PC-3) cells and changes in the metabolites (lactate, O2, CO2, pH, etc.) that they release into the extracellular medium were comparatively analyzed in this study for the first time. First, intracellular free amino acid profile changes in normal (PNT-1A) and cancer (PC-3) cells were analyzed. As a result of this analysis, it was determined that the levels of glutamine, glutamic acid, and branched-chain amino acids (leucine, isoleucine, and valine) were higher in cancer cells than in normal cells. It can be regarded that such amino acids are used in the TCA cycle in cancer cells as the most important indicators. Similarly, increased alanine and aspartic acid levels could also be considered important indicators of this increasing metabolism.
While glucose is the most important energy source for cancer growth, amino acids are also important fuels that boost cancer development. For instance, glutamine is significantly anaplerotic, and it leaves two amino groups to boost the TCA cycle [38]. In addition to glutamine, other amino acids can function as opportunistic fuel sources for cells. It is also an alternative organic molecule source that can trigger the TCA cycle in branched-chain amino acids (valine, leucine, and isoleucine) [39].
As bioenergetic pathways, biosynthetic pathways are also based on various amino acid contributions. BCAA catabolism may mediate lipogenesis through acetyl-CoA synthesis [39]. Nucleotide synthesis that can be identified in purine and pyrimidine biosynthesis is another amino acid-dependent process [40]. Glycine, glutamine, and aspartate act as carbon and nitrogen donors for purine biosynthesis [41]. Additional carbon sources for nucleobases as a format shape include glycine, serine, and methionine, which provide one-carbon units through the methionine-folate cycle [42,43].
Glutamine is the main amino acid in cancer cells; it acts as an anaplerosis metabolite and operates the TCA cycle to maintain mitochondrial ATP production. Anaplerotic metabolism of glutamine produces α-ketoglutarate (α-KG), followed by oxaloacetate (OAA), and feeds the TCA cycle through a number of biochemical reactions called glutominolisis [44]. Similarly, the direction of the metabolic flow and the use of glutamine change considerably under hypoxia conditions or in mitochondrial dysfunctional cancer cells. In such cases, α-KG from glutamine can undergo reductive carboxylation to form isocitrate, which is then converted to citrate [45,46]. In our study, it was observed that both intracellular and extracellular glutamine and glutamic acid levels of PC-3 cancer cells were higher when compared to normal cells. Furthermore, it was determined that increasing levels of intracellular glutamine passed into the extracellular medium of PC-3 cells. Cancer cells also use other amino acids as “alternative fuels” to compete with various cells in tumor stroma for energy and optimize the use of nutrients during tumor development [47]. For instance, increased BCAAs in the plasma of pancreas cancer patients can potentially be changed into acetyl-CoA and other organic molecules involved in the TCA cycle [48]. Among the BCAAs, leucine is important in the survival of melanoma cells [49].
In this study, it was determined that BCAA levels were high in both the intracellular and extracellular media of cancer cells. To examine the changes made by cancer cells in the extracellular medium in this study, amino acids with cells and without cell media were analyzed. As a result of this analysis, percentage changes were determined by extracting the media with cells from those without cells. As a result of this analysis, it was determined that prostate cancer cells released high amounts of glutamine, glutamic acid, alanine, and proline into the external medium; however, they consumed hydroxyproline, serine, alpha aminobutyric acid, ethanolamine, and leucine from the external medium. When the extracellular amino acid change rates of normal and cancer cells were compared, a significant change was observed in valine, sarcosine, and hydroxyproline; however, there were no significant changes in other amino acids.
Sarcosine is a metabolite of N-methyl glycine. It takes part in the methylation processes that occur during prostate cancer progression and in the metabolism of amino acids. Researchers suggested that the level of sarcosine increased during the metastasis process of prostate cancer, and therefore, it could be used as a biomarker. However, subsequent studies found that sarcosine in urine was not a marker in the diagnosis of prostate cancer [50,51]. In our study, we found that extracellular sarcosine levels in normal cells were high, although intracellular sarcosine levels are also high in prostate cancer. Therefore, we also determined that sarcosine is not a useful biomarker for prostate cancer.
Although cancer cells have enough oxygen in the mitochondria to further oxidize pyruvate, they increase their glucose uptake and subsequent conversion to lactate, which is known as the Warburg effect [52]. Glucose is not sufficient to satisfy the various metabolic needs of a cancer cell. Thus, cancer cells use glutamine as a nitrogen source for anabolic reactions, which provide ATP for cell energy and add carbon to the cellular biomass, including nucleotide and hexosamine synthesis [53,54]. Therefore, Warburg and hypoxia effects result in lactic acid discharge in accordance with the physiological pH (pH 7.2–7.5) of normal tissue and the acidification of the microtumor circumference (pH 6.5–6.9) [55]. Therefore, acidification, as one of the distinguishing characteristics of solid tumors, plays a direct role in the reinforcement of the malign, aggressive phenotype of cancer cells [56]. When the external pH levels of cancer and normal cells were examined in our study, normal cells were found to have a slightly alkaline external medium pH, although PC-3 cells were observed to have an acidic external medium. While cancer cells have been observed to have lower cK+ and c LAC levels compared to normal prostate cells, their cCa2+, cCl−, and cGlu levels are higher than in normal cells. Cancer cells boosted by the Warburg effect and other variable metabolic activities increase their rate of anabolism, including the synthesis of nucleotides, amino acids, and lipids in their metabolisms, to maintain hemostasis and survival. Cancer cells also change anti-metabolic stress reactions to maintain hemostasis and survival and rearrange gene expression to support their reproduction in a metabolism-dependent manner [57].
Intracellular pH (pHi) is known to be an important regulator of many cell functions. In normal cells, the intracellular pH is lower than the extracellular pH (pHe). pHi and pHe values commonly range between 7.0–7.2 and 7.3–7.4, respectively. However, cancer cells are generally associated with a higher pHi of 7.12–7.65 and a lower pHe of 6.2–6.9. Such a diverse intracellular pH gradient is considered to be the distinctive feature of neoplastic tissue that helps cancer progress [58].
The main focus of this study was on analyzing the metabolic profiles of normal prostate (PNT-1A) and malignant prostate cancer (PC-3) cells. The results reveal that the amino acid profiles of prostate cancer cells, except for a few acids, are higher in cancer cells when compared to normal cells. Thus, amino acids are used extensively for higher metastasis through the activation of regulatory molecules in the proliferation of cancer cells. Therefore, changes in amino acid levels triggered by carcinogenesis or resistance may illuminate the molecular basis of metastatic processes. Moreover, free amino acids may facilitate the diagnosis of prostate cancer and the development of new therapeutic options.
Acknowledgement: The authors would like to thank their colleagues at the Laboratory of Metabolism.
Data Availability Statement: The data are available upon special request.
Author Contributions: ES: Principal investigator, study conception, and design; İK: Sample collection and molecular analysis. Both authors were involved in drafting the article and/or revising it critically for important intellectual content, and both authors approved the final version to be published.
Funding Statement: The authors received no specific funding for this study.
Conflicts of Interest: The authors declare that they have no conflicts of interest to report regarding the present study.
1. van den Broeck, T., Joniau, S., Clinckemalie, L., Helsen, C., Prekovic, S. et al. (2014). The role of single nucleotide polymorphisms in predicting prostate cancer risk and therapeutic decision making. BioMed Research International, 2014(1), 1–16. DOI 10.1155/2014/627510. [Google Scholar] [CrossRef]
2. Jan-Erik Damber, G. A. (2008). Prostate cancer. Lancet, 371(9625), 1710–1721. DOI 10.1016/S0140-6736(08)60729-1. [Google Scholar] [CrossRef]
3. Jamaspishvili, T., Kral, M., Khomeriki, I., Student, V., Kolar, Z. et al. (2010). Urine markers in monitoring for prostate cancer. Prostate Cancer and Prostatic Diseases, 13(1), 12–19. DOI 10.1038/pcan.2009.31. [Google Scholar] [CrossRef]
4. Kdadra, M., Höckner, S., Leung, H., Kremer, W., Schiffer, E. (2019). Metabolomics biomarkers of prostate cancer: A systematic review. Diagnostics, 9(1), 21. DOI 10.3390/diagnostics9010021. [Google Scholar] [CrossRef]
5. Welty, C. J., Carroll, P. R. (2014). The ongoing need for improved risk stratification and monitoring for those on active surveillance for early stage prostate cancer. European Urology, 65(6), 1032–1033. DOI 10.1016/j.eururo.2014.02.044. [Google Scholar] [CrossRef]
6. Strmiska, V., Michalek, P., Eckschlager, T., Stiborova, M., Adam, V. et al. (2019). Prostate cancer-specific hallmarks of amino acids metabolism: Towards a paradigm of precision medicine. Biochimica et Biophysica Acta (BBA)-Reviews on Cancer, 1871(2), 248–258. DOI 10.1016/j.bbcan.2019.01.001. [Google Scholar] [CrossRef]
7. Silberstein, J. L., Pal, S. K., Lewis, B., Sartor, O. (2013). Current clinical challenges in prostate cancer. Translational and Rology Urology, 2(3), 122. [Google Scholar]
8. Asiago, V. M., Alvarado, L. Z., Shanaiah, N., Gowda, G. A., Owusu-Sarfo, K. et al. (2010). Early detection of recurrent breast cancer using metabolite profiling. Cancer Research, 70, 8309–8318. [Google Scholar]
9. Wang, G., Zhao, D., Spring, D. J., DePinho, R. A. (2018). Genetics and biology of prostate cancer. Genes & Development, 32(17–18), 1105–1140. DOI 10.1101/gad.315739.118. [Google Scholar] [CrossRef]
10. Di Donato, M., Giovannelli, P., Cernera, G., Di Santi, A., Marino, I. et al. (2015). Non-genomic androgen action regulates proliferative/migratory signaling in stromal cells. Frontiers in Endocrinology, 5(9), 225. DOI 10.3389/fendo.2014.00225. [Google Scholar] [CrossRef]
11. Gkotsos, G., Virgiliou, C., Lagoudaki, I., Sardeli, C., Raikos, N. et al. (2017). The role of sarcosine, uracil, and kynurenic acid metabolism in urine for diagnosis and progression monitoring of prostate cancer. Metabolites, 7(1), 9. DOI 10.3390/metabo7010009. [Google Scholar] [CrossRef]
12. Čapoun, O., Soukup, V., Kalousová, M., Sobotka, R., Pešl, M. et al. (2015). Diagnostic importance of selected protein serum markers in the primary diagnostics of prostate cancer. Urologia Internationalis, 95(4), 429–435. DOI 10.1159/000431364. [Google Scholar] [CrossRef]
13. Warburg, O., Wind, F., Negelein, E. (1927). The metabolism of tumors in the body. Journal of General Physiology, 8(6), 519–530. DOI 10.1085/jgp.8.6.519. [Google Scholar] [CrossRef]
14. Lieu, E. L., Nguyen, T., Rhyne, S., Kim, J. (2020). Amino acids in cancer. Experimental & Molecular Medicine, 52(1), 1–16. DOI 10.1038/s12276-020-0375-3. [Google Scholar] [CrossRef]
15. Ulanovskaya, O. A., Zuhl, A. M., Cravatt, B. F. (2013). NNMT promotes epigenetic remodeling in cancer by creating a metabolic methylation sink. Nature Chemical Biology, 9(5), 300–306. DOI 10.1038/nchembio.1204. [Google Scholar] [CrossRef]
16. Maddocks, O. D., Athineos, D., Cheung, E. C., Lee, P., Zhang, T. et al. (2017). Modulating the therapeutic response of tumours to dietary serine and glycine starvation. Nature, 544(7650), 372–376. DOI 10.1038/nature22056. [Google Scholar] [CrossRef]
17. Son, S. M., Park, S. J., Lee, H., Siddiqi, F., Lee, J. E. et al. (2019). Leucine signals to mTORC1 via its metabolite acetyl-coenzyme A. Cell Metabolism, 29(1), 192–201. DOI 10.1016/j.cmet.2018.08.013. [Google Scholar] [CrossRef]
18. Wu, Z., Wei, D., Gao, W., Xu, Y., Hu, Z. et al. (2015). TPO-induced metabolic reprogramming drives liver metastasis of colorectal cancer CD110+ tumor-initiating cells. Cell Stem Cell, 17(1), 47–59. DOI 10.1016/j.stem.2015.05.016. [Google Scholar] [CrossRef]
19. Wetzler, M., Sanford, B. L., Kurtzberg, J., DeOliveira, D., Frankel, S. R. et al. (2007). Effective asparagine depletion with pegylated asparaginase results in improved outcomes in adult acute lymphoblastic leukemia: Cancer and Leukemia Group B Study 9511. Blood, 109(10), 4164–4167. DOI 10.1182/blood-2006-09-045351. [Google Scholar] [CrossRef]
20. Dereziński, P., Klupczynska, A., Sawicki, W., Pałka, J. A., Kokot, Z. J. (2017). Amino acid profiles of serum and urine in search for prostate cancer biomarkers: A pilot study. International Journal of Medical Sciences, 14(1), 1–12. DOI 10.7150/ijms.15783. [Google Scholar] [CrossRef]
21. Koyuncu, I., Gonel, A., Kocyigit, A., Temiz, E., Durgun, M. et al. (2018). Selective inhibition of carbonic anhydrase-IX by sulphonamide derivatives induces pH and reactive oxygen species-mediated apoptosis in cervical cancer HeLa cells. Journal of Enzyme Inhibition and Medicinal Chemistry, 33(1), 1137–1149. DOI 10.1080/14756366.2018.1481403. [Google Scholar] [CrossRef]
22. Celik, M., Şen, A., Koyuncu, I., Gönel, A. (2019). Plasma-free amino acid profiling of nasal polyposis patients. Combinatorial Chemistry & High Throughput Screening, 22(9), 657–662. DOI 10.2174/1386207322666190920110324. [Google Scholar] [CrossRef]
23. Koyuncu, I., Gonel, A., Durgun, M., Kocyigit, A., Yuksekdag, O. et al. (2019). Assessment of the antiproliferative and apoptotic roles of sulfonamide carbonic anhydrase IX inhibitors in HeLa cancer cell line. Journal of Enzyme Inhibition and Medicinal Chemistry, 34(1), 75–86. DOI 10.1080/14756366.2018.1524380. [Google Scholar] [CrossRef]
24. Rigau, M., Olivan, M., Garcia, M., Sequeiros, T., Montes, M. et al. (2013). The present and future of prostate cancer urine biomarkers. International Journal of Molecular Sciences, 14(6), 12620–12649. DOI 10.3390/ijms140612620. [Google Scholar] [CrossRef]
25. Velonas, V. M., Woo, H. H., Remedios, C, Assinder, S. J. (2013). Current status of biomarkers for prostate cancer. International Journal of Molecular Sciences, 14(6), 11034–11060. DOI 10.3390/ijms140611034. [Google Scholar] [CrossRef]
26. Kim, Y., Kislinger, T. (2013). Novel approaches for the identification of biomarkers of aggressive prostate cancer. Genome Medicine, 5(6), 56. DOI 10.1186/gm460. [Google Scholar] [CrossRef]
27. Ramautar, R., Berger, R., van der Greef, J.,Hankemeier, T. (2013). Human metabolomics: Strategies to understand biology. Current Opinion in Chemical Biology, 17(5), 841–846. DOI 10.1016/j.cbpa.2013.06.015. [Google Scholar] [CrossRef]
28. Monteiro, M. S., Carvalho, M., de Lourdes Bastos, M., de Pinho, P. G. (2014). Biomarkers in renal cell carcinoma: A metabolomics approach. Metabolomics, 10(6), 1210–1222. DOI 10.1007/s11306-014-0659-5. [Google Scholar] [CrossRef]
29. Aboud, O. A., Weiss, R. H. (2013). New opportunities from the cancer metabolome. Clinical Chemistry, 59(1), 138–146. DOI 10.1373/clinchem.2012.184598. [Google Scholar] [CrossRef]
30. Monteiro, M. S., Carvalho, M., Bastos, M. L., Guedes de Pinho, P. (2013). Metabolomics analysis for biomarker discovery: Advances and challenges. Current Medicinal Chemistry, 20(2), 257–271. DOI 10.2174/092986713804806621. [Google Scholar] [CrossRef]
31. Thapar, R., Titus, A. M. (2014). Recent advances in metabolic profiling and imaging of prostate cancer. Current Metabolomics, 2(1), 53–69. DOI 10.2174/2213235X02666140301002510. [Google Scholar] [CrossRef]
32. Lai, H. S., Lee, J. C., Lee, P. H., Wang, S. T., Chen, W. J. (2005). Plasma free amino acid profile in cancer patients. Seminars in Cancer Biology, 15(4), 267–276. DOI 10.1016/j.semcancer.2005.04.003. [Google Scholar] [CrossRef]
33. Miyagi, Y., Higashiyama, M., Gochi, A., Akaike, M., Ishikawa, T. et al. (2011). Plasma free amino acid profiling of five types of cancer patients and its application for early detection. PLoS One, 6(9), e24143. DOI 10.1371/journal.pone.0024143. [Google Scholar] [CrossRef]
34. Mayers, J. R., Torrence, M. E., Danai, L. V., Papagiannakopoulos, T., Davidson, S. M. et al. (2016). Tissue of origin dictates branched-chain amino acid metabolism in mutant Kras-driven cancers. Science, 353(6304), 1161–1165. DOI 10.1126/science.aaf5171. [Google Scholar] [CrossRef]
35. Choudhari, S. K., Chaudhary, M., Bagde, S., Gadbail, A. R., Joshi, V. (2013). Nitric oxide and cancer: A review. World Journal of Surgical Oncology, 11(1), 1–11. DOI 10.1186/1477-7819-11-1. [Google Scholar] [CrossRef]
36. Heger, Z., Cernei, N., Gumulec, J., Masarik, M., Eckschlager, T. et al. (2014). Determination of common urine substances as an assay for improving prostate carcinoma diagnostics. Oncology Reports, 31(4), 1846–1854. DOI 10.3892/or.2014.3054. [Google Scholar] [CrossRef]
37. Kratochvilova, M., Raudenska, M., Heger, Z., Richtera, L., Cernei, N. et al. (2017). Amino acid profiling of zinc resistant prostate cancer cell lines: Associations with cancer progression. Prostate, 77(6), 604–616. DOI 10.1002/pros.23304. [Google Scholar] [CrossRef]
38. Hensley, C. T., Wasti, A. T., DeBerardinis, R. J. (2013). Glutamine and cancer: Cell biology, physiology, and clinical opportunities. Journal of Clinical Investigation, 123(9), 3678–3684. DOI 10.1172/JCI69600. [Google Scholar] [CrossRef]
39. Green, C. R., Wallace, M., Divakaruni, A. S., Phillips, S. A., Murphy, A. N. et al. (2016). Branched-chain amino acid catabolism fuels adipocyte differentiation and lipogenesis. Nature Chemical Biology, 12(1), 15–21. DOI 10.1038/nchembio.1961. [Google Scholar] [CrossRef]
40. Moffatt, B. A., Ashihara, H. (2002). Purine and pyrimidine nucleotide synthesis and metabolism. Arabidopsis Book/American Society of Plant Biologists, 1, e0018. DOI 10.1199/tab.0018. [Google Scholar] [CrossRef]
41. Zhang, Y., Morar, M., Ealick, S. E. (2008). Structural biology of the purine biosynthetic pathway. Cellular and Molecular Life Sciences, 65(23), 3699–3724. DOI 10.1007/s00018-008-8295-8. [Google Scholar] [CrossRef]
42. Locasale, J. W. (2013). Serine, glycine and one-carbon units: Cancer metabolism in full circle. Nature Reviews Cancer, 13(8), 572–583. DOI 10.1038/nrc3557. [Google Scholar] [CrossRef]
43. Shuvalov, O., Petukhov, A., Daks, A., Fedorova, O., Vasileva, E. et al. (2017). One-carbon metabolism and nucleotide biosynthesis as attractive targets for anticancer therapy. Oncotarget, 8(14), 23955–23977. DOI 10.18632/oncotarget.15053. [Google Scholar] [CrossRef]
44. Le, A., Lane, A. N., Hamaker, M., Bose, S., Gouw, A. et al. (2012). Glucose-independent glutamine metabolism via TCA cycling for proliferation and survival in B cells. Cell Metabolism, 15(1), 110–121. DOI 10.1016/j.cmet.2011.12.009. [Google Scholar] [CrossRef]
45. Metallo, C. M., Gameiro, P. A., Bell, E. L., Mattaini, K. R., Yang, J. et al. (2012). Reductive glutamine metabolism by IDH1 mediates lipogenesis under hypoxia. Nature, 481(7381), 380–384. DOI 10.1038/nature10602. [Google Scholar] [CrossRef]
46. Mullen, A. R., Wheaton, W. W., Jin, E. S., Chen, P. H., Sullivan, L. B. et al. (2012). Reductive carboxylation supports growth in tumour cells with defective mitochondria. Nature, 481(7381), 385–388. DOI 10.1038/nature10642. [Google Scholar] [CrossRef]
47. Keenan, M., Chi, J. T. (2015). Alternative fuels for cancer cells. Cancer Journal, 21(2), 49–55. DOI 10.1097/PPO.0000000000000104. [Google Scholar] [CrossRef]
48. Mayers, J. R., Wu, C., Clish, C. B., Kraft, P., Torrence, M. E. et al. (2014). Elevation of circulating branched-chain amino acids is an early event in human pancreatic adenocarcinoma development. Nature Medicine, 20(10), 1193–1198. DOI 10.1038/nm.3686. [Google Scholar] [CrossRef]
49. Sheen, J. H., Zoncu, R., Kim, D., Sabatini, D. M. (2011). Defective regulation of autophagy upon leucine deprivation reveals a targetable liability of human melanoma cells in vitro and in vivo. Cancer Cell, 19(5), 613–628. DOI 10.1016/j.ccr.2011.03.012. [Google Scholar] [CrossRef]
50. Jentzmik, F., Stephan, C., Miller, K., Schrader, M., Erbersdobler, A. et al. (2010). Sarcosine in urine after digital rectal examination fails as a marker in prostate cancer detection and identification of aggressive tumours. European Urology, 58(1), 12–18. DOI 10.1016/j.eururo.2010.01.035. [Google Scholar] [CrossRef]
51. Wu, H., Liu, T., Ma, C., Xue, R., Deng, C. et al. (2011). GC/MS-based metabolomic approach to validate the role of urinary sarcosine and target biomarkers for human prostate cancer by microwave-assisted derivatization. Analytical and Bioanalytical Chemistry, 401(2), 635–646. DOI 10.1007/s00216-011-5098-9. [Google Scholar] [CrossRef]
52. Warburg, O. (1956). On the origin of cancer cells. Science, 123(3191), 309–314. DOI 10.1126/science.123.3191.309. [Google Scholar] [CrossRef]
53. DeBerardinis, R. J., Sayed, N., Ditsworth, D., Thompson, C. B. (2008). Brick by brick: Metabolism and tumor cell growth. Current Opinion in Genetics & Development, 18(1), 54–61. DOI 10.1016/j.gde.2008.02.003. [Google Scholar] [CrossRef]
54. DeBerardinis, R. J., Cheng, T. (2010). Q’s next: The diverse functions of glutamine in metabolism, cell biology and cancer. Oncogene, 29(3), 313–324. DOI 10.1038/onc.2009.358. [Google Scholar] [CrossRef]
55. Yao, C. H., Fowle-Grider, R., Mahieu, N. G., Liu, G. Y., Chen, Y. J. et al. (2016). Exogenous fatty acids are the preferred source of membrane lipids in proliferating fibroblasts. Cell Chemical Biology, 23(4), 483–493. DOI 10.1016/j.chembiol.2016.03.007. [Google Scholar] [CrossRef]
56. Kennedy, K. M., Scarbrough, P. M., Ribeiro, A., Richardson, R., Yuan, H. et al. (2013). Catabolism of exogenous lactate reveals it as a legitimate metabolic substrate in breast cancer. PLoS One, 8(9), e75154. DOI 10.1371/journal.pone.0075154. [Google Scholar] [CrossRef]
57. Lu, Z., Hunter, T. (2018). Metabolic kinases moonlighting as protein kinases. Trends in Biochemical Sciences, 43(4), 301–310. DOI 10.1016/j.tibs.2018.01.006. [Google Scholar] [CrossRef]
58. Wang, H., Wang, Y., Zhang, H., Liu, Z., Lu, Z. (2018). Determination of thermal focal length under different depths of focus in asymmetrical flat-flat dynamically stable resonators. Optics & Laser Technology, 106(11), 12–17. DOI 10.1016/j.optlastec.2018.03.013. [Google Scholar] [CrossRef]
 | This work is licensed under a Creative Commons Attribution 4.0 International License, which permits unrestricted use, distribution, and reproduction in any medium, provided the original work is properly cited. |