

 | Molecular & Cellular Biomechanics |  |
DOI: 10.32604/mcb.2022.018369
ARTICLE
Numerical Analysis of Blood Flow through COVID-19 Infected Arteries
1Kerala Water Authority, Palakkad, Kerala, 678001, India
2National Institute of Technology, Warangal, Telangana, 506004, India
*Corresponding Author: Anjana P. Anantharaman. Email: anjanapa@nitw.ac.in
Received: 20 July 2021; Accepted: 24 December 2021
Abstract: Computational Fluid Dynamics has become relevant in the study of hemodynamics, where clinical results are challenging to obtain. This paper discusses a 2-Dimensional transient blood flow analysis through an arterial bifurcation for patients infected with the Coronavirus. The geometry considered is an arterial bifurcation with main stem diameter 3 mm and two outlets. The left outlet (smaller) has a diameter of 1.5 mm and the right outlet (larger), 2 mm. The length of the main stem, left branch and right branch are fixed at 35 mm, 20 mm and 25 mm respectively. Viscosity change that occurs in the blood leads to different parametrical changes in blood flow. The blood flow towards the smaller branch is significantly affected by the changed blood viscosity. Extended regions of high pressure and increased velocity towards the larger outlet are obtained. The Time Averaged Wall Shear Stress (TAWSS) for the corona affected artery is found to be 10.4114 Pa at a 90° angle of bifurcation as compared to 2.45002 Pa of the normal artery. For varying angles of bifurcation, an angle of 75° was found to have a maximum Time Averaged Wall Shear Stress of 2.46076 Pa and 10.42542 Pa for normal and corona affected artery, respectively.
Keywords: Coronavirus; non-Newtonian fluid; endothelial cells; artery bifurcation; pulsatile flow
The world is witnessing and combating a difficult situation created by the Severe Acute Respiratory Syndrome Coronavirus 2 (SARS-CoV-2). Around 220 million of the global population is infected, of which 3.9 million succumbed to death so far [1]. Recent studies on the Coronavirus Disease 2019 (COVID-19), first recognized as a respiratory system disease, suggest that the cardiovascular system is severely affected by the infection. Cardiac damage is noted even in patients with no visible respiratory symptoms. The increase in the number of patients with no clinical respiratory symptoms has further aggravated the situation. Downregulation of the immune system in people with a previous history of diabetes, atherosclerosis, and obesity has led to a poor prognosis in the case of COVID-19 [2]. Purple rashes, swollen legs, clogged catheters, and sudden death—blood clots, large and small, are frequent complications of COVID-19. Researches from Netherlands and France suggest that blood clots appear in 20% to 30% of critically ill COVID-19 patients [3,4].
The novel form of Coronavirus has severe effects on haematological parameters. Endothelial dysfunction, platelet activation, hyper-viscosity, and blood flow aberration are the factors leading to thrombosis. Various studies show that blood viscosity in the case of COVID-19 patients has increased due to multiple reasons, such as elevated concentrations of acute phase reactants and hypergammaglobulinemia. Hyper-viscosity of blood may lead to severe clinical conditions such as myocardial infarction (MI), venous thrombosis, and venous thromboembolism. The changes in the physical parameters of blood due to Coronavirus infection are still open for further investigation. One possibility is that the Coronavirus directly affects the endothelial cells that line the blood vessels providing a smooth passage for blood to flow. Otherwise, the immune system that gets triggered as a result of the infection sparks clot formation [5].
Vascular endothelial cells experience two distinctive forces; cyclic strain due to the transmural pressure and shear stress due to the frictional force generated by fluid flow. Mean fluid flow rate, the physical dimensions of blood vessels, and blood viscosity contribute to the shear stress associated. Both strains cause appreciable cell deformation in the endothelial cells [6]. Endothelial cells can adapt to sustained stress levels. Changes in blood shear stress could be sensed directly by cell membrane components such as membrane proteins, ion channels, caveolae, or by alterations of the cellular cytoskeleton. An immediate endothelial response to shear stress is the activation of flow-sensitive ion channels. These ion channels play an essential role in shear stress sensing and transduction [7]. Dynamic fluid studies in human carotid and coronary arteries displayed that lesion rupture coincides with high shear stress. Increased changes in the shear stress in endothelial cells are accompanied by narrowing the lumen, thereby constricting the passage of blood. High pressures can induce Nitric Oxide (NO) production by the endothelial cells [8].
Computational Fluid Dynamics (CFD) comes handy for in-depth analysis of flow parameters of different fluids that are difficult to achieve in real world applications. Both laminar and turbulent models are effectively utilized in different commercially available CFD codes. Mesh refinement and validation are extremely important in any numerical simulation study [9,10]. Diseases related to the cardiovascular system are studied using different experimental and numerical methods to date. Still, there is a research gap in the pathology associated. Among various methods used, CFD methods are mostly used to simulate blood flow conditions. The artery wall is assumed rigid in many of the numerical studies conducted on blood flow. The variation in physical properties of blood have severe impacts on the medical condition of a patient, viscosity being the most important of them. Any such variation can be easily identified by numerically mimicking the condition and observing the variations in pressure, velocity and temperature. The heat transfer rate with Newtonian behaviour is much stronger than that of the Non-Newtonian case leading to several physiological disorders [11]. Hemodynamics can be analyzed effectively by simulating the flow conditions with the help of different numerical tools. The blood viscosity models and flow conditions used primarily affect the accuracy of simulation models. The development in in-vivo and in-vitro studies cannot undermine the challenges associated with it. Wall Shear Stress is an essential parameter in the study of hemodynamics to analyze the possibilities of atherosclerosis. Regions of low wall shear stress are prone to plaque development and high wall shear stress are related to destabilization of the plaque. Recent studies have also proved that the COVID-19 infected patients are at high risk for thrombotic arterial and venous occlusions. Wall Shear Stress assessment of blood vessels becomes extremely difficult to predict in the case of in-vitro measurements. The increase in viscosity of the blood largely affects the behaviour of the fluid. Newtonian Fluid assumption of blood holds good only for large blood vessels. For microcirculatory system and also with presence of stenosis, the assumption does not provide good approximation of wall shear stress. Blood is considered a non-Newtonian shear-thinning fluid in most studies [12]. Carreau Model is a well-established model for predicting blood flow without much deviation from real-life conditions. Improper selection of boundary conditions for modelling blood flow can produce unrealistic results. Most previous studies consider vessel wall as rigid, inlet velocity as pulsatile and outlet pressure as constant for accurate prediction of the flow. Arteries have a high degree of stiffness and assumption of the wall to be rigid produces fairly acceptable results [12]. Even though most studies consider laminar flow for analysis, the pulsatile nature of blood flow produces a transition of flow. Use of turbulent models are mostly suitable for understanding flow inside stenoic arteries and non-Newtonian approximation is more accurate in predicting the Wall Shear Stresses involved [13]. Researchers have invested time to study the effect of geometrical parameters using idealized geometries and patient-specific models. The assumption of the vessel wall as a Fluid-Structure Interactive model and treating blood as a multiphase fluid have also received much interest in recent [12].
The curvature of the coronary arteries significantly impacts the haemodynamic parameters associated with it. Kashyap, Arora and Bhattacharjee studied the effect of individual branch curvatures on occurrence of atherosclerosis using Computational Fluid Dynamics. The arteries were modelled using idealized geometries. The curvature is found to have increased the low Wall Shear Stress the artery walls are undergoing. The 3-dimensional Cartesian Navier–Stokes equations was solved using Fluent to analyse the blood flow through various branch curvatures from 0° to 60°. Non-Newtonian rheological models such as the Carreau and Carreau-Yasuda give reasonably accurate predictions of the flow field [14].
Rabbi, Laboni and Arafat in their study considered blood as a non-Newtonian fluid governed by continuity equation and Navier Stokes equation. Time Averaged Wall Shear Stress can provide meaningful insights to any cardio-vascular complexities developed in a patient. Idealized and patient specific Computer Models were analysed for Time Averaged Wall Shear Stress and other parameters. Higher exposure to Wall Shear Stresses were identified for increased angles of bifurcations [15]. A nonlinear rheological model is analyzed to study hemodynamics by Wu et al. [16]. Simulations of a flow in a sudden expansion channel and the flow through an idealized curved coronary artery with pulsatile inlet velocity were done modelling blood as a suspension. In the idealized coronary artery model it is observed that the Red Blood Corpuscles concentrates near the inner surface where the viscosity is higher and corresponding shear stress is lower which may be related to formation of plaque inside the vessel.
Increased blood flow velocity indicates the decreased blood flow due to reduced lumen diameter. The results obtained from such CFD simulations can provide a vast database for prognosis in the case of COVID-19 related cardiovascular issues. The endothelial cells mediate the exchange of substances between the bloodstream and neighbouring tissues. A high value of wall shear stress leads the endothelial cells to an inactive state. The blood lumen struggles to maintain its regular shape and high stresses lead to their rupture. The peak systole and diastole phases show the occurrence of flow reversal near bifurcations and blocked areas. Non-Newtonian Carreau model is used by Pandey et al. [17] to analyse flow velocity, streamline and Wall Shear Stress of healthy and constricted arteries using CT Scan data available. 2-Dimensional models of healthy and stenosed coronary artery is simulated considering the non-Newtonian and pulsatile nature of blood. Stenosis increases the pressure, velocity, and shear stress in an artery. Also, steady flow conditions are found to have underestimated these flow parameters of importance [18].
The main disadvantage of the clinical methods is that they can only find out the flow velocity for analyzing the significant cardio problems in COVID-19 patients. The pressure, velocity, and wall shear distributions can provide vital information for early diagnosis, and possible vide CFD simulations. Identifying the areas of critical interest would provide an opportunity for medical practitioners to streamline the treatment methods, thereby saving valuable time on the due course.
Through a detailed literature review, the following are observed:
1. Idealized geometry may be utilized for simplification of blood flow problem through human arteries and avoid patient-specific variations.
2. Blood is considered as a non-Newtonian fluid for most analysis and is governed by the continuity equation and Navier Stokes equation.
3. Artery wall is supposed to be rigid and still produces meaningful results.
Thus, the current work discusses these flow parameters associated with the changes in blood viscosity during Coronavirus infection using a 2-Dimensional transient simulation.
The schematic of the geometry used for 2D transient simulation of blood flow through a bifurcating artery in ANSYS fluent is shown in Fig. 1.
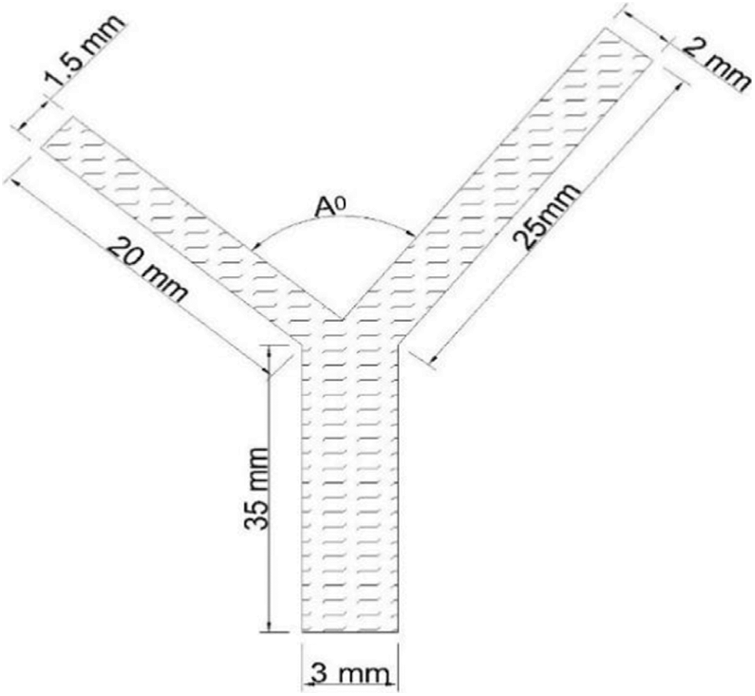
Figure 1: 2-dimensional model of an idealized coronary artery bifurcation
The angle A° depicts the angle of bifurcation. Idealized geometry rather than patient-specific models (obtained from CT scans) is used so as to simplify the problem and reduce the uncertainties associated. The wall of the artery is assumed to be fixed, rigid and non-porous as in many previous studies [15,18].
The results are validated using an already published numerical model. Carreau viscosity model with pulsating inlet velocity using a user-defined function was used to analyze flow dynamics of a normal bifurcated artery. As part of coronavirus infection, the hemodynamic changes, as predicted by Joob et al. [5], are studied by modifying the viscosity of flow. During both conditions, pressure gradient, velocity distributions, wall shear stress distributions and Time Averaged Wall Shear Stresses (TAWSS) are explored, and inferences drawn can be very useful in treatment of COVID-19 patients and in complementing clinical findings.
Blood is generally agreed as a non-Newtonian fluid. The Carreau model is one of the most commonly used models for the prediction of blood flow dynamics. The properties of blood used for analysis are listed in Table 1.

The viscosity values for COVID-19 patients are as suggested by Ray et al. [2].
The viscosity model suggested by Carreau-Yasuda model is shown below [19]:
where,
μc = effective dynamic viscosity (Pa-s)
nc and a are indexes determined from experiments.
In the simulations presented in this work, the power index a is fixed to be 2. This reduces the Carreau- Yasuda model in Eq. (1) to Carreau model which is available in commercial CFD package Ansys Fluent and can be utilized for the proposed analysis. Non-Newtonian rheological models such as the Carreau and Carreau-Yasuda exhibit a closer approximation of blood properties as compared to the Newtonian model [14]. The blood flow is assumed to be laminar even if the actual flow conditions may be different due to the pulsatile nature of blood flow.
2.2 Governing Equations and Boundary Conditions
Continuity and Incompressible Navier Stokes equation are the governing equations to be solved for the particular problem concerned [15,18].
Continuity equation:
where ▽ is the gradient of a vector and u is the corresponding blood velocity vector (m/s).
Navier-Stokes equation:
where ρ = density of the fluid (kg/m3), p = blood pressure (Pa), u = blood velocity vector (m/s), μc = effective dynamic viscosity (Pa-s). The applied boundary conditions are listed in Table 2.

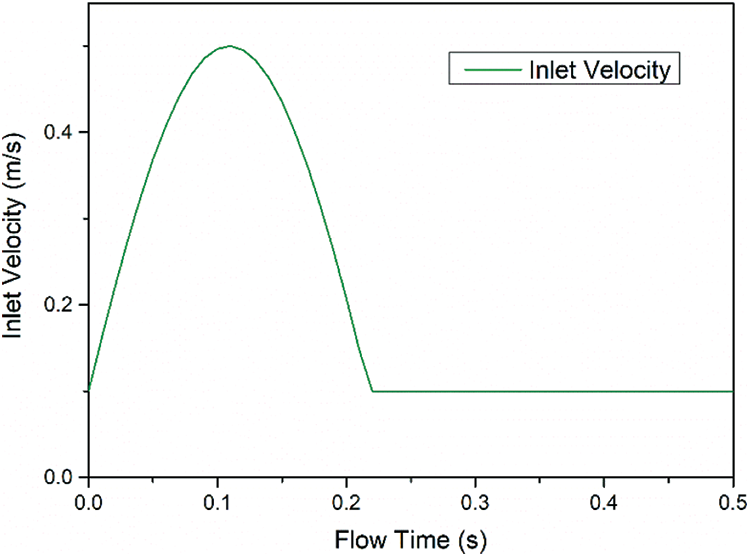
Figure 2: Inlet velocity variation for one pulse (0.5 s)
2.3 Discretization and Simulation
The geometry used for both the normal and corona affected artery is the same. The geometry is discretized into 23015 elements and checked for mesh refinement. Transient simulation of the discretized model is carried out for 50 number of time steps, each 0.01 s size. Simple pressure-velocity coupling method is used and second order discretization is applied for both pressure and momentum. Three different meshes were analysed for a bifurcating angle of 90°. The data for which is tabulated in Table 3 below.

Mesh 2 with 23015 elements is selected for further simulation and analysis. The number of elements is a trade-off between accuracy and time required for analysis.
2.4 Validation of the Computational Setup
The Time-averaged Wall Shear Stress (TAWSS) of the model analysed is found out using the equation:
where, T is the total time elapsed during one pulse (0.5 s) and WSS is the Area Weighted Wall Shear Stress (Pa) during each time step under consideration. The Wall Shear Stress during the entire period of one pulse for a healthy artery is plotted in Fig. 3.
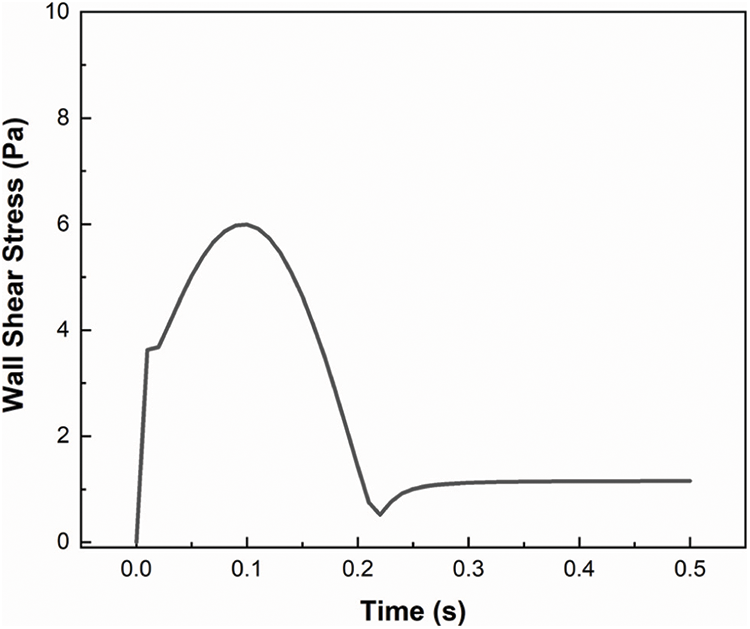
Figure 3: Wall shear stress on a normal artery during one period (0.5 s)
The area under the Wall Shear Stress plot is found out using Origin graphing software and is substituted in Eq. (4) to find out the TAWSS. The TAWSS of a healthy artery is thus found to be 2.45002 Pa which is compared with the results presented by Rabbi et al. [15], which comes in the range of 0.7 to 3.025 Pa. The results are found to be within acceptable limits. The velocity distribution pattern of 90° bifurcation validation model is plotted in Fig. 4.
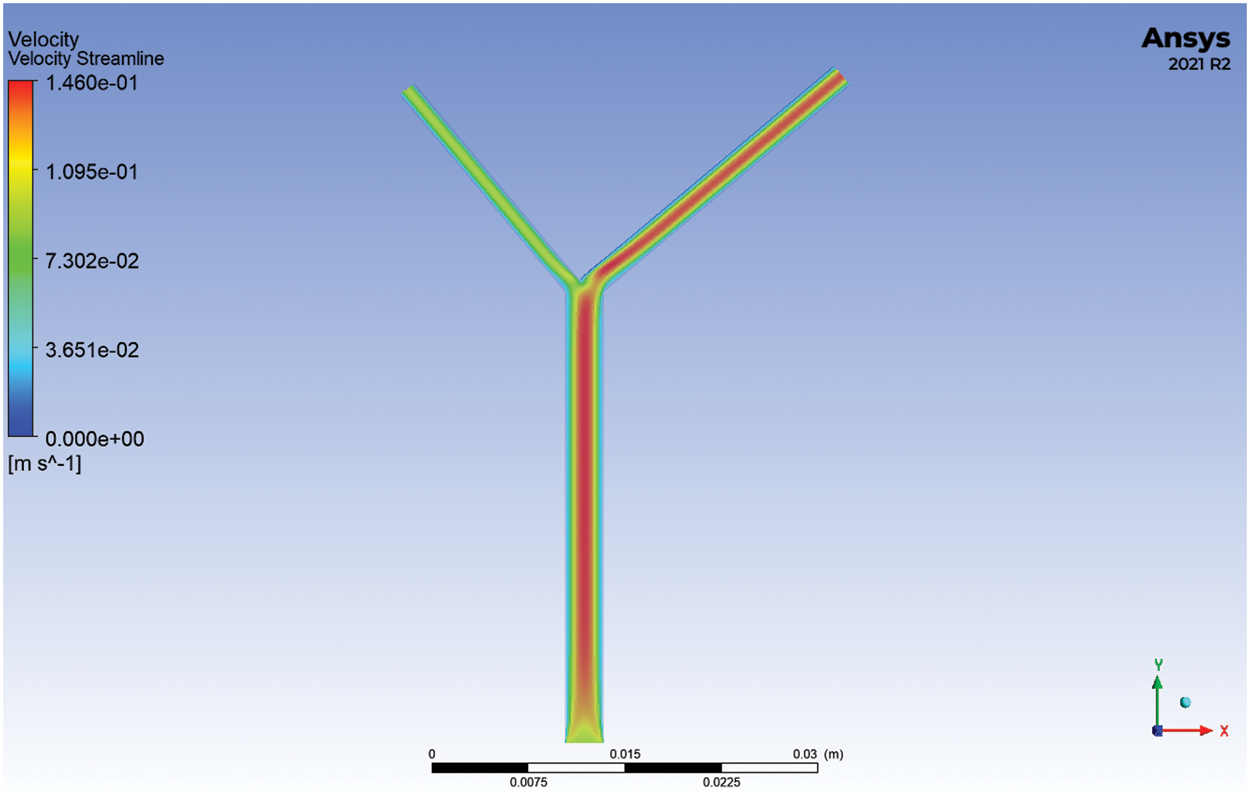
Figure 4: Velocity streamlines of a healthy artery at 0.05 s
Using Ansys Fluent, the numerical model was analysed for one cycle of the pulsatile flow (0.5 s) and pressure gradient, velocity vectors, wall shear stress and TAWSS on the healthy and corona affected arteries were studied. The pressure distribution, velocity streamlines and wall shear stress at t = 0.05 s for the normal and corona affected arteries with a bifurcation of angle 90° are compared in Figs. 5–7 respectively. The total pressure as seen from Fig. 5, is higher at the inlet and lower at the outlets for the corona-affected artery when compared to a healthy one. This can also be verified from the velocity streamlines plotted in Fig. 6. In order to compensate for the pressure, the heart needs to work harder to pump, resulting in weakening of the muscles involved. It can also be inferred that the velocity at the outlets of both branches is also increased. The increase in wall shear stress on the arteries is obvious from Fig. 7. Wall Shear Stress is seen to be associated with critical medical conditions such as Myocardial Infarction and progression of atherosclerosis. The analysis of Wall Shear Stress along the artery can thus give important insights to the prevailing medical condition of a patient.

Figure 5: Total pressure comparison of a healthy and diseased artery at 0.05 s for 90° bifurcation angle

Figure 6: Velocity streamlines of a healthy and diseased artery at 0.05 s for 90° bifurcation angle

Figure 7: Wall shear stress of a healthy and diseased artery at 0.05 s for 90° bifurcation angle
It is seen from the above plots that there is an increase in the velocity of blood flowing through the large branch in the case of the artery affected by Coronavirus during the systolic phase. The flow velocity in the smaller branch is less than that of a normal healthy artery during the systolic but greater during the diastolic phase. This is verified from the velocity streamlines too. The flow through the smaller branch decreases significantly during the pumping phase. It may lead to an acute shortage of oxygen and nutrients in the corresponding organs. The instantaneous velocity plots for Outlet 1 (left branch) and Outlet 2 are further plotted in Fig. 8 for comparison.
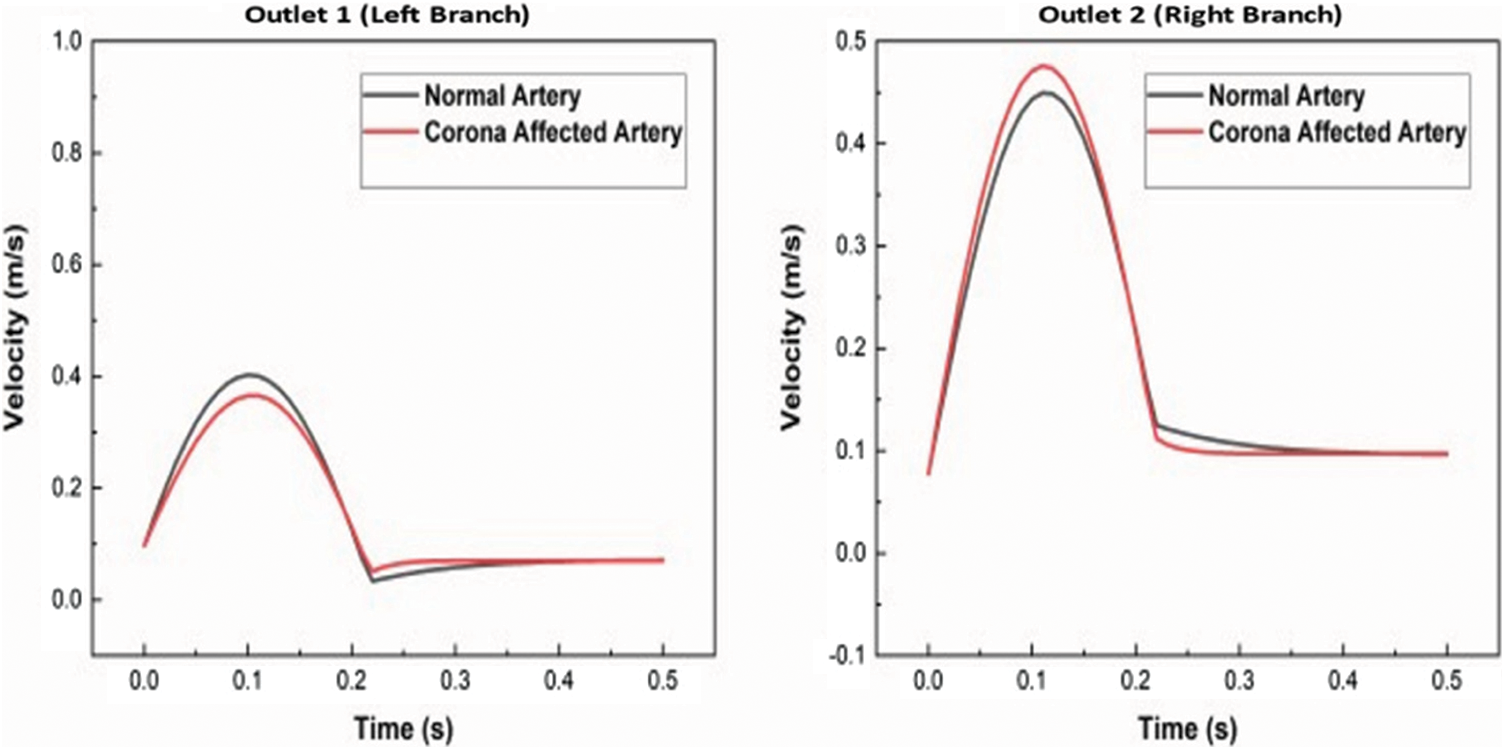
Figure 8: Instantaneous velocity comparison of a healthy and diseased artery for 90° bifurcation angle
The uniformity of pressure distribution is affected in the diseased artery. Extended regions of high pressure, when compared to the normal healthy artery, are seen. The total pressure distribution across the arteries during one pulse is plotted in Fig. 9.
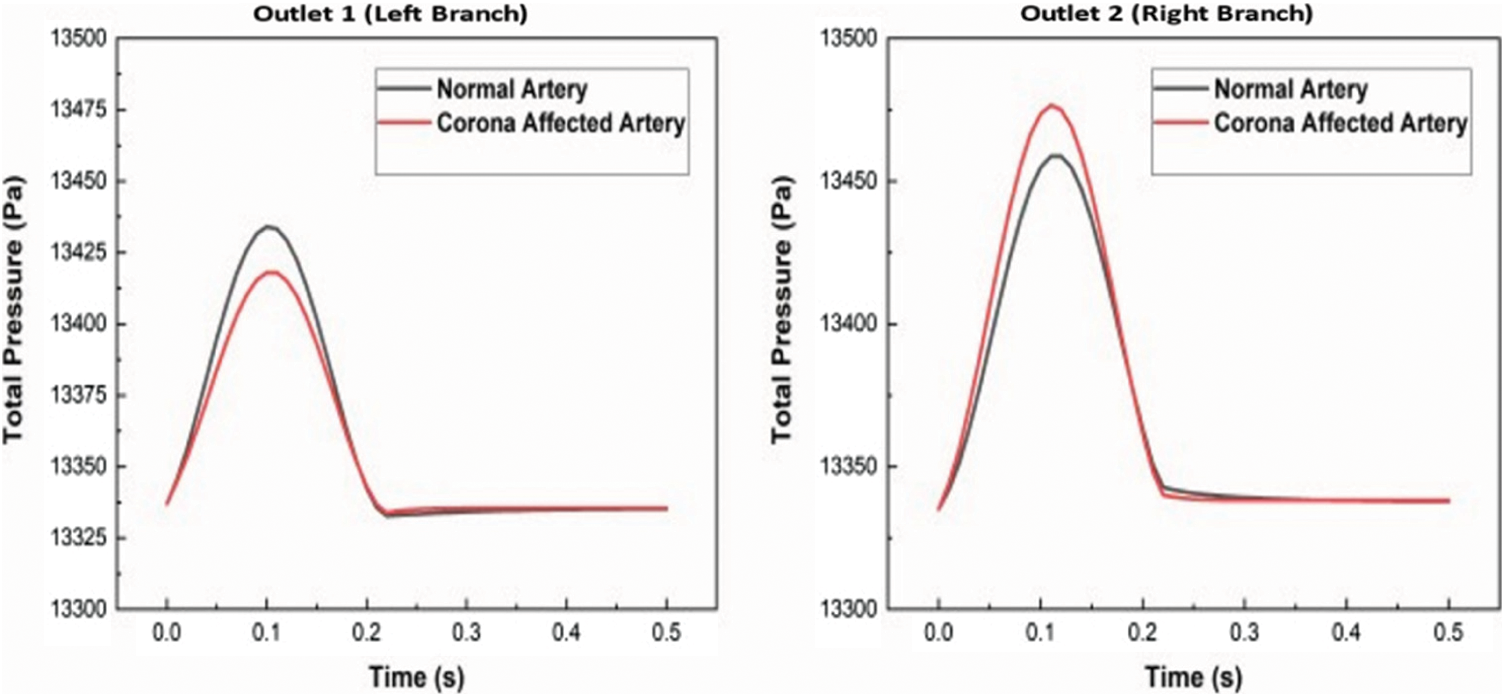
Figure 9: Instantaneous total pressure comparison of a healthy and diseased artery for 90° bifurcation angle
The TAWSS of both arteries are found out as described in Section 2.4 for both the arterial bifurcation cases. A critical inference is that the TAWSS for the artery affected by Coronavirus is 4.25 times that of the normal healthy artery. This plot for comparison is shown in Fig. 10.
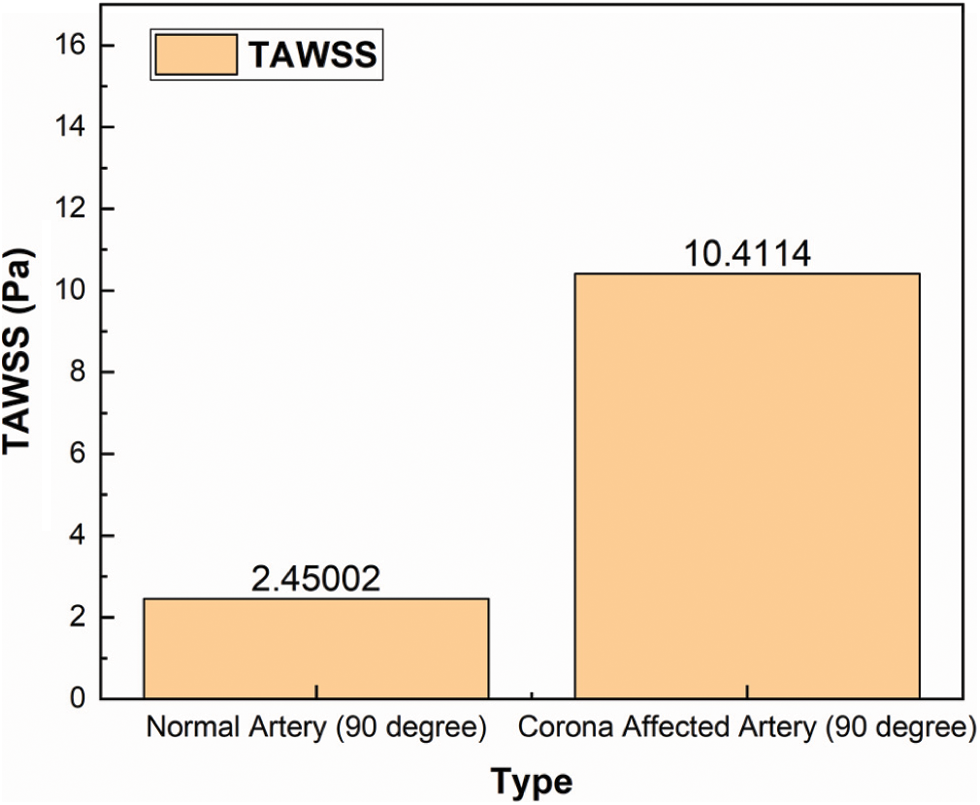
Figure 10: TAWSS comparison of a healthy and diseased artery for 90° bifurcation angle
The increase in wall shear stress can cause damage to the endothelial cells lining the blood vessels by increasing the chances of plaques and there by narrowing the lumen. The angles of bifurcation were changed to 30°, 60°, 75°, 105° and 120° for understanding the change in TAWSS the arteries get subjected to and is plotted in Fig. 11 for both the normal and diseased arteries.
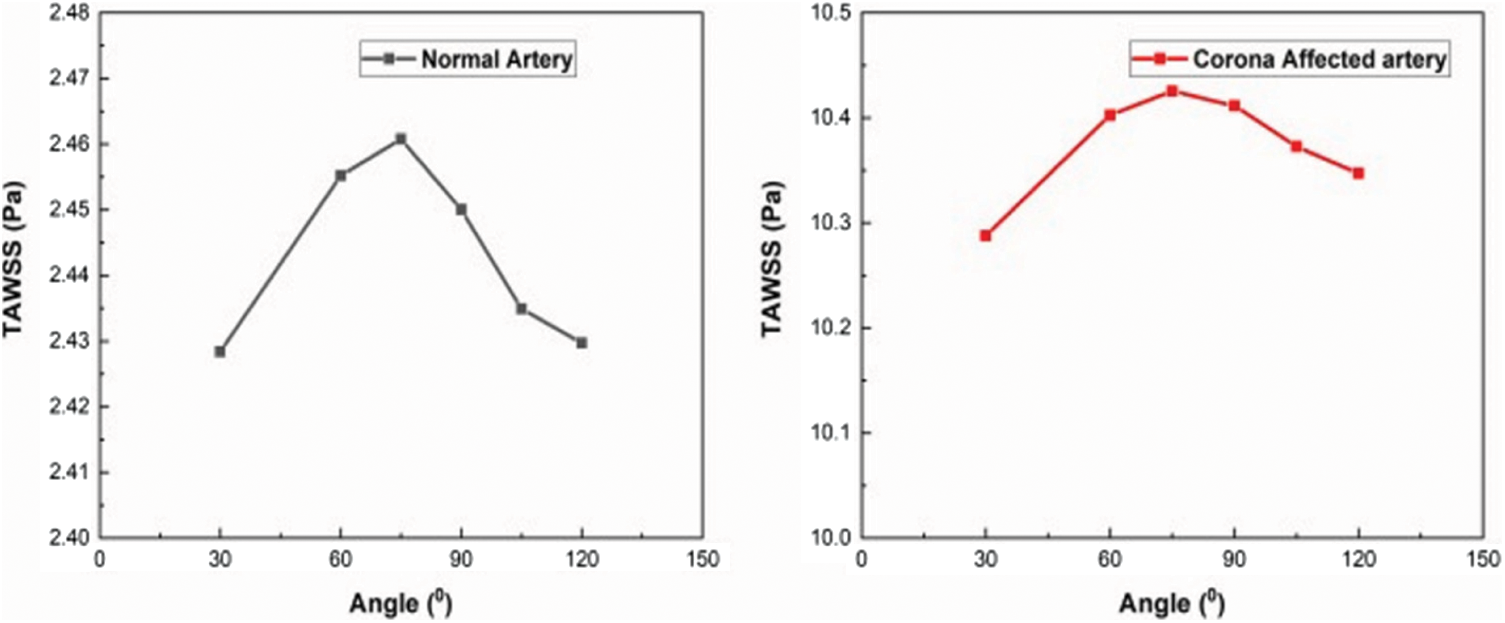
Figure 11: Variation of TAWSS with angle of bifurcation
It is seen that the TAWSS is maximum for an angle of bifurcation of 75°. The same trend is observed in the case of corona infected artery too. Along with the angular variations, the curvature of bifurcation may also affect the distribution of shear stresses along the artery wall. The complexity involved due to changes in curvature is not covered under the present study.
This study presented a 2D transient numerical simulation of arterial bifurcation in patients affected by Coronavirus. The viscosity changes in blood due to infection imparts considerable changes in the blood flow parameters such as velocity, pressure, and wall shear stress. Various blood parameters for varying angles of bifurcation from 30° to 120° for both normal and diseased conditions were analysed and validated using existing literature. The following conclusions are made after studying the transient blood flow in detail:
1. Bifurcations and junctions are prone to severe hemodynamic changes as a result of the increase in viscosity of blood. The outlet velocity towards the large branch is increased and towards the smaller branch outlet is considerably decreased during the systole.
2. The total pressure towards the larger outlet of the bifurcation is increased and towards the smaller outlet is decreased during the systole.
3. The Time Averaged Wall Shear Stress (TAWSS) for the corona affected artery is 10.4114 Pa at a 900 angle of bifurcation as compared to 2.45002 Pa of the normal artery. Damages are caused to the endothelial lining of the blood vessel due to sustained higher shear stresses. It may lead to plaque formation and narrowing of the lumen leading to severe cardiac risks or destabilization of existing plaques, both leading to adverse health conditions.
4. It is seen that the TAWSS is maximum at an angle of bifurcation of 75° and has a value of 2.46076 Pa and 10.42542 Pa for normal and corona affected artery respectively.
Reproducible results are obtained using commercially available viscometers for measuring whole blood viscosity, which when combined with Computational Fluid Dynamics simulation results can provide more information to crucial health conditions of a coronavirus infected person. Further studies are to be carried out by modelling blood vessels from real-life cases, and with other specific viscosity models.
Funding Statement: The authors received no specific funding for this study.
Conflicts of Interest: The authors declare that they have no conflicts of interest to report regarding the present study.
1. Worlometer (2020). Coronavirus cases. Ius et Praxis. https://doi.org/10.26439/iusetpraxis2020.n50-51.5049. [Google Scholar]
2. Basu-Ray, I., Almaddah, N. K., Adeboye, A., Soos, M. P. (2021). Cardiac manifestations of coronavirus (COVID-19). In: StatPearls. Treasure Island (FLStatPearls Publishing. [Google Scholar]
3. Klok, F. A., Kruip, M. J. H. A., van der Meer, N. J. M., Arbous, M. S., Gommers, D. A. M. P. J. et al. (2020). Incidence of thrombotic complications in critically ill ICU patients with COVID-19. Thrombosis Research, 191(April), 145–147. DOI 10.1016/j.thromres.2020.04.013. [Google Scholar] [CrossRef]
4. Poissy, J., Goutay, J., Caplan, M., Parmentier, E., Duburcq, T. et al. (2020). Pulmonary embolism in patients with COVID-19: Awareness of an increased prevalence. Circulation, 142(2), 184–186. DOI 10.1161/CIRCULATIONAHA.120.047430. [Google Scholar] [CrossRef]
5. Joob, B., Wiwanitkit, V. (2021). Blood viscosity of COVID-19 patient: A preliminary report. American Journal of Blood Research, 11(1), 93–95. [Google Scholar]
6. Ballermann, B. J., Dardik, A., Eng, E., Liu, A. (1998). Shear stress and the endothelium. Kidney International, 54(67), 100–108. DOI 10.1046/j.1523-1755.1998.06720.x. [Google Scholar] [CrossRef]
7. Fisher, A. B., Chien, S., Barakat, A. I., Nerem, R. M. (2001). Endothelial cellular response to altered shear stress. American Journal of Physiology-Lung Cellular and Molecular Physiology, 281(3), 529–533. DOI 10.1152/ajplung.2001.281.3.L529. [Google Scholar] [CrossRef]
8. Chistiakov, D. A., Orekhov, A. N., Bobryshev, Y. V. (2017). Effects of shear stress on endothelial cells: Go with the flow. Acta Physiologica, 219(2), 382–408. DOI 10.1111/apha.12725. [Google Scholar] [CrossRef]
9. Balasubramanian, S., Krishnan, S., Kumar, M., Srihari, K., Chakraborty, A. et al. (2020). Three dimensional computational studies on steady-state flow field around a microsphere under laminar flow. AIP Conference Proceedings, 2277, 1–7. DOI 10.1063/5.0025555. [Google Scholar] [CrossRef]
10. Devrani, S., Tiwari, R. K., Sharma, R., Rajesh, M. P., Kapoor, A. (2018). Characterization of the drag-reducing nature of long-chain polymer-water solutions through atomization. International Journal of Polymer Analysis and Characterization, 23(5), 430–434. DOI 10.1080/1023666X.2018.1469069. [Google Scholar] [CrossRef]
11. Foong, L. K., Shirani, N., Toghraie, D., Zarringhalam, M., Afrand, M. (2020). Numerical simulation of blood flow inside an artery under applying constant heat flux using Newtonian and non-Newtonian approaches for biomedical engineering. Computer Methods and Programs in Biomedicine, 190(1), 105375. DOI 10.1016/j.cmpb.2020.105375. [Google Scholar] [CrossRef]
12. Carvalho, V., Pinho, D., Lima, R. A., Teixeira, J. C., Teixeira, S. (2021). Blood flow modeling in coronary arteries: A review. Fluids, 6(2), 53. DOI 10.3390/fluids6020053. [Google Scholar] [CrossRef]
13. Carvalho, V., Rodrigues, N., Lima, R. A., Teixeira, S. (2020). Numerical simulation of blood pulsatile flow in stenotic coronary arteries: The effect of turbulence modeling and non-Newtonian assumptions. Proceedings of 24th International Conference on Circuits, Systems, Communications and Computers (CSCC), pp. 112–116. DOI 10.1109/CSCC49995.2020.00027. [Google Scholar] [CrossRef]
14. Kashyap, V., Arora, B. B., Bhattacharjee, S. (2020). A computational study of branch-wise curvature in idealized coronary artery bifurcations. Applications in Engineering Science, 4, 100027. DOI 10.1016/j.apples.2020.100027. [Google Scholar] [CrossRef]
15. Rabbi, M. F., Laboni, F. S., Arafat, M. T. (2020). Computational analysis of the coronary artery hemodynamics with different anatomical variations. Informatics in Medicine Unlocked, 19, 100314. DOI 10.1016/j.imu.2020.100314. [Google Scholar] [CrossRef]
16. Wu, W. T., Aubry, N., Antaki, J. F., Massoudi, M. (2020). Simulation of blood flow in a sudden expansion channel and a coronary artery. Journal of Computational and Applied Mathematics, 376, 112856. DOI 10.1016/j.cam.2020.112856. [Google Scholar] [CrossRef]
17. Pandey, R., Kumar, M., Srivastav, V. K. (2020). Numerical computation of blood hemodynamic through constricted human left coronary artery: Pulsatile simulations. Computer Methods and Programs in Biomedicine, 197(9), 105661. DOI 10.1016/j.cmpb.2020.105661. [Google Scholar] [CrossRef]
18. Jhunjhunwala, P., Padole, P. M., Thombre, S. B. (2015). CFD analysis of pulsatile flow and Non-Newtonian behavior of blood in arteries. Molecular and Cellular Biomechanics, 12(1), 37–47. DOI 10.3970/mcb.2015.012.037. [Google Scholar] [CrossRef]
19. Tabakova, S., Nikolova, E., Radev, S. (2014). Carreau model for oscillatory blood flow in a tube. AIP Conference Proceedings, 1629, 336–343. DOI 10.1063/1.4902290. [Google Scholar] [CrossRef]
 | This work is licensed under a Creative Commons Attribution 4.0 International License, which permits unrestricted use, distribution, and reproduction in any medium, provided the original work is properly cited. |