| Molecular & Cellular Biomechanics |
DOI: 10.32604/mcb.2021.017984
ARTICLE
Certain Investigations on Melanoma Detection Using Non-Subsampled Bendlet Transform with Different Classifiers
Muthayammal Engineering College, Namakkal, 637408, India
*Corresponding Author: R. Praveena. Email: praveenajuhi@gmail.com
Received: 21 June 2021; Accepted: 28 July 2021
Abstract: Skin is the largest organ and outer enclosure of the integumentary system that protects the human body from pathogens. Among various cancers in the world, skin cancer is one of the most commonly diagnosed cancer which can be either melanoma or non-melanoma. Melanoma cancers are very fatal compared with non-melanoma cancers but the chances of survival rate are high when diagnosed and treated earlier. The main aim of this work is to analyze and investigate the performance of Non-Subsampled Bendlet Transform (NSBT) on various classifiers for detecting melanoma from dermoscopic images. NSBT is a multiscale and multidirectional transform based on second order shearlet system which precisely classifies the curvature over other directional representation systems. Here two-phase classification is employed using k-Nearest Neighbour (kNN), Naive Bayes (NB), Decision Trees (DT) and Support Vector Machines (SVM). The first phase classification is used to classify the images of PH2 database into normal and abnormal images and the second phase classification classifies the abnormal images into benign and malignant. Experimental result shows the improvement in classification accuracy, sensitivity and specificity compared with the state of art methods.
Keywords: Dermoscopic image classification; non-subsampled bendlet transform; kNN; DT; NB; SVM
Skin performs very important functions in human body such as sensation, cooling and protection against physical damages. The three main layers of skin are the outer epidermis, middle dermis and the inner layer hypodermis. These skin layers consist of three major cells namely squamous cells, basal cells and melanocytic cells as shown in Fig. 1.
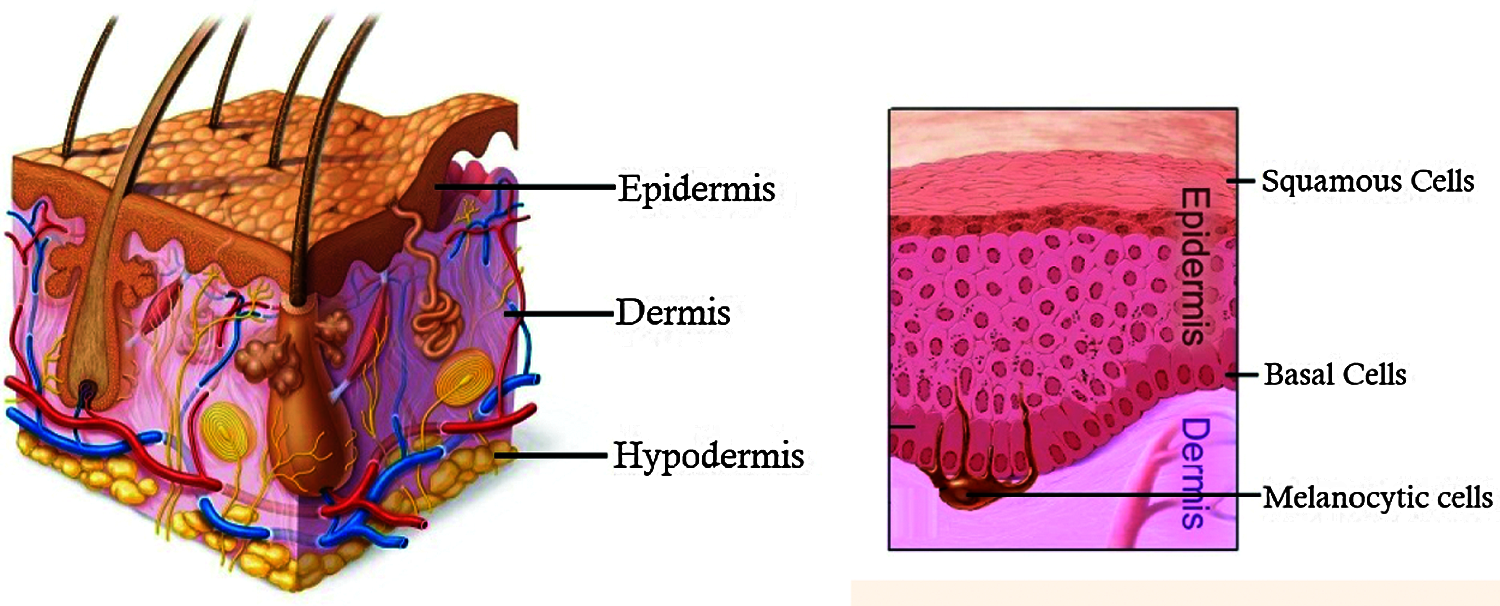
Figure 1: Layers of skin
Sometimes these skin cells multiply without any control and forms a big mass of cells called skin cancer. Melanoma skin cancer arises from melanocytic cells which produces melanin pigment that decides the color of the skin. The detection of melanoma at early stage is very much needed to avoid death rate. According to cancer statistics of 2021 [1], the estimated melanoma cancers are around 106,110 with 62,260 in male and 43,850 in female. The total estimated deaths are around 7,180 in which 4,600 are male and 2,580 are female. Generally, medical diagnosis for skin cancer is carried out by two methods namely invasive and non-invasive methods. The invasive methods are painful which involves taking biopsies by physical puncturing into the skin. The non-invasive procedure [2] does not involve any physical tools and the detection are done by visual inspection using various techniques like imaging, total body photography, dermoscopy, ultrasound, optical coherence tomography, magnetic resonance imaging and thermography, etc. The experienced dermatologists are able to produce 80% accuracy in examining skin lesion through naked eye. Computer based diagnosis is introduced to provide improved accuracy compared to the subjective judgement given by dermatologists for the skin lesion detection. Also, computer-based diagnosis has advantage of storing medical records of lesion and provides possibilities of cross referencing in order to enhance the differential diagnosis. The advancement in computer aided diagnostic system with machine learning algorithms extracts the important anisotropic features such as edges, curves and provide intelligent decisions which are very challenging for the inexperienced dermatologists.
Tan et al. [3] proposed two enhanced particle swarm optimization algorithms using deep learning models for the classification of skin lesion. In the first model, feature descriptors such as asymmetry, border, color, structural features are extracted by grey level run length matrix. The local binary pattern and histogram gradient features are extracted in the second model. Finally, convolution neural network is used to classify the features extracted from two models. The multiclass classification was developed by [4] to identify malignant and benign classes by extracting features from the frequency domain. The features from frequency domain are extracted by cross correlation method. A fusion method was described in [5] for classification using normalization techniques. The colour standardization method was developed after preprocessing step under different lightening conditions. The automatic statistical colour detection model was described in [6] to distinguish the skin lesion colours form the images. This work is carried out by maximizing the pixel belonging to the group with the given colour values of the neighbourhood. The textual and structural characteristics were proposed by Ajedh et al. [7] to identify melanoma. The textual characteristics were extracted by local binary pattern and structural characteristics were generated by wavelet and curvelet transforms. Classification was carried out by support vector machine.
Serten et al. [8] developed two models of residual network for classification of skin lesions. The first method is built by modelling wavelet transform with skin images and the second model is built by modelling sequential wavelet transform. The coefficients are extracted from both the models and residual network is used for classification. Skin lesion detection and classification are employed by uniform distribution and active contour method in preprocessing module [9]. The colour, texture and HOG features are extracted and SVM classifier is used to classify the abnormal images. Machine learning algorithms such as kNN, artificial neural network and decision trees are discussed in [10]. ABCDE feature descriptors [11] in which shape features such as asymmetry, border, evolution of shape and diameter are extracted by image invariant moments and color features are extracted by Euclidean distance method. Talavera-Martínez et al. [12] developed a new approach based on deep learning to remove hair from the dermoscopic images. The pixels that contain hair are detected and restored by using encoder-decoder architecture. Automatic skin lesion classification method describes the jaccad distance method [13] used in segmentation module to analyze the performance. Three phase joint training is employed in classification stage for multiclass classification.
Short term lesion changes detection [14] for melanoma screening were developed using a Siamese structure based deep neural network. The global features and deep convolutional features from lesion images are extracted by tensorial regression process. The lesion change detection is measured by analyzing the difference between two dermoscopic images accounted for a short period of time. Gray level co-occurrence matrix parameters such as energy, correlation, contrast, homogeneity is extracted from the skin cancer images and given as input to the gaussian mixture model [15]. The GMM analyze and classify the given skin images by using mahalanobis distance measure which also produces better efficiency in identifying the type of disease. Automatic colour enhancement and colour identification model were developed to differentiate malignant images with more colour than the benign images [16]. Four classifiers such as random forest, linear discriminant analysis, support vector machine and artificial neural networks were used to classify malignant and benign images. SVM provides better accuracy compare with other three classifiers. The transform-based analysis has more discriminating power than the spatial features such as shape, colour, local binary pattern and ABCDE rule. The deep learning methods used earlier were accurate but it requires more training and time complexity is also very high. The wavelet transform has poor directionality and it can capture frequency content only in three directions. Also, it is inefficient in capturing anisotropic features such as lines and curves. The curvelet transform cannot capture the contours in the image and contourlet transform suffers from shift variant due to pseudo gibbs effect. Shearlet transform cannot classify the curvature precisely and redundant in nature. In order to eliminate the above-mentioned drawbacks, an efficient approach of non-sub sampled bendlet transform are used for the detection of melanoma in dermoscopic images.
This article is organized as follows. Section 2 presents the materials and methods used to detect melanoma from dermoscopic images with detailed description of preprocessing method to remove noise and hair. Section 3 discusses non-sub sampled bendlet transform which extracts anisotropic features from the images. Section 4 illustrates the step-by-step algorithm of non-sub sampled bendlet transform. Section 5 explains the classifier types used to classify the NSBT features. Section 6 compares the performance of NSBT on different classifiers. Finally, Section 7 provides the conclusion.
The work flow of the proposed method is illustrated in Fig. 2. The CAD system is developed with the following steps namely preprocessing, feature extraction and classification. The PH2 dataset [17] considered for this experimentation consists of 200 dermoscopic images with a resolution of 768 × 560 pixels comprising 80 normal images and 120 abnormal images. Out of 120 abnormal images, 40 images belong to malignant and 80 images belong to benign category.
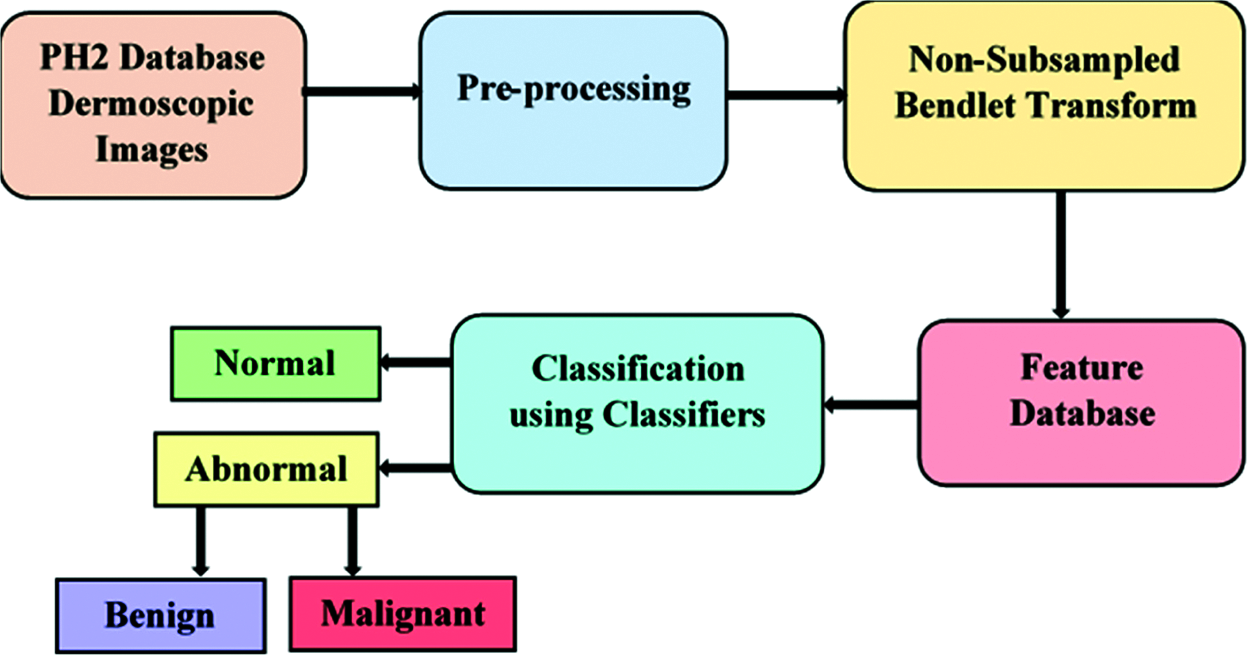
Figure 2: Block diagram of melanoma detection
The dermoscopic images consist of noise and hair which has to be removed before feature extraction module step. The noise present in the dermoscopic images is mainly salt & pepper noise and the presence of this noise and hair will affect the overall performance of the system. A non-linear filter is designed in such a way that it should remove both noise and hair from the dermoscopic images. Here, median filtering method is used to remove this unwanted information from the images. The pixels identified by the mask are sorted in the ascending order and the median value is computed and replaced as the center pixel value. Fig. 3 shows samples of images before preprocessing and after preprocessing.
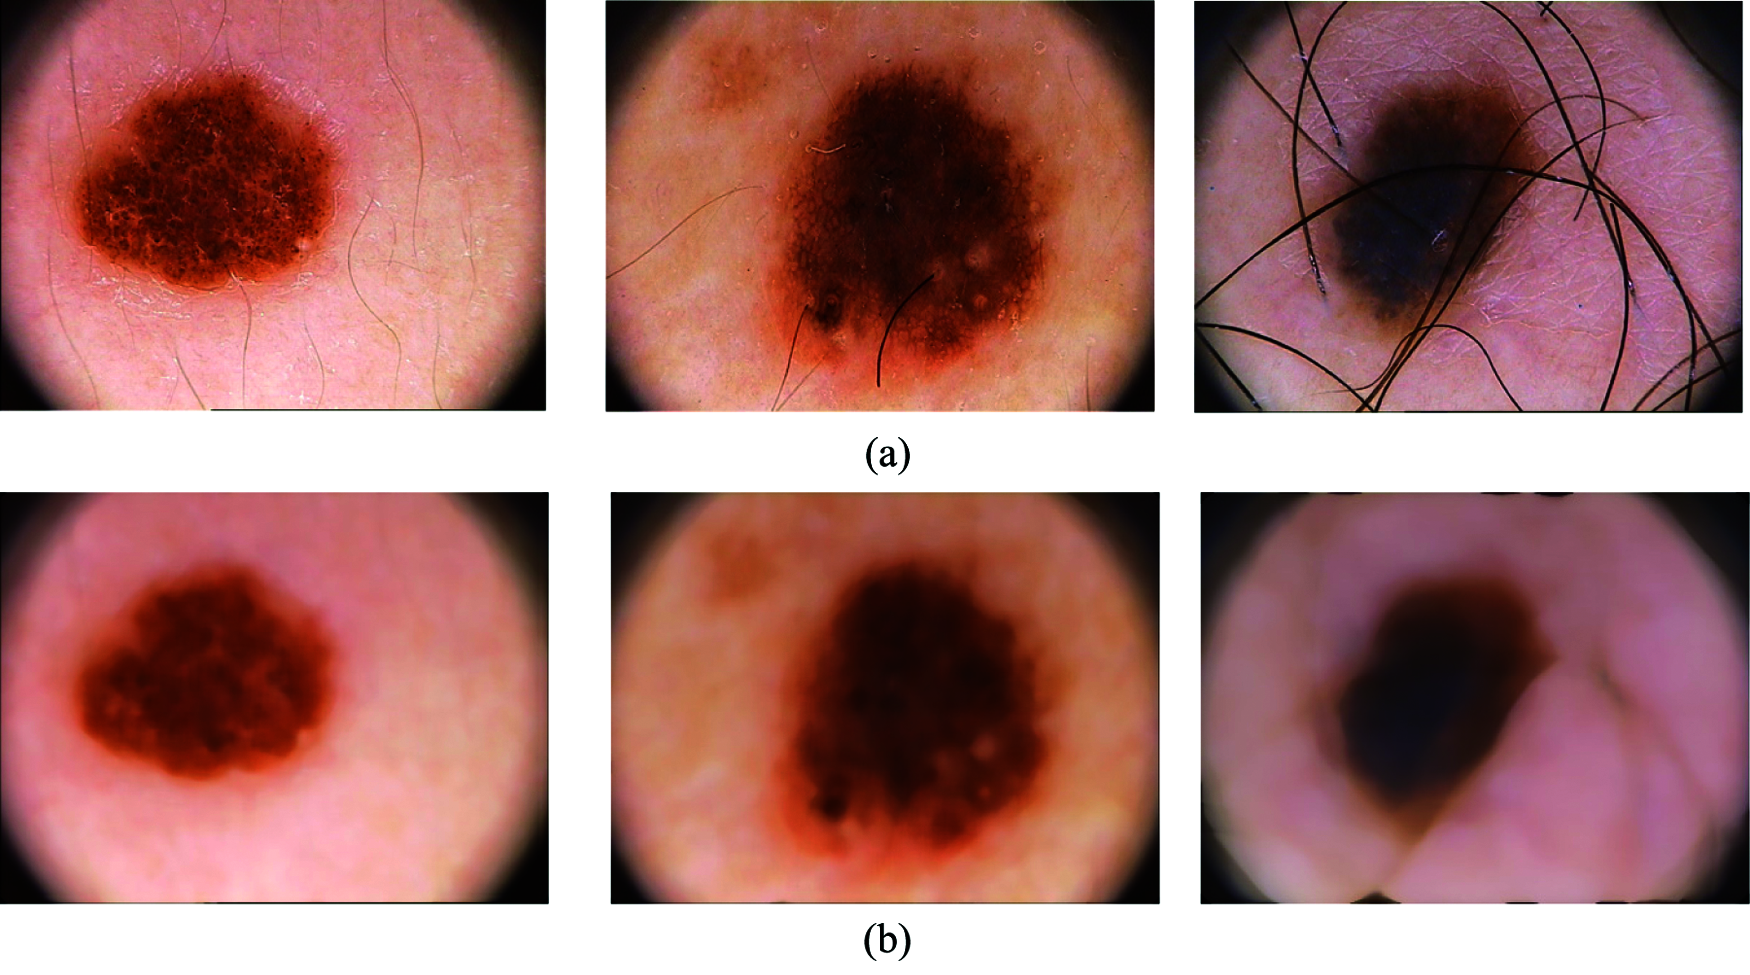
Figure 3: (a) Samples of input images containing noise and hair, (b) output after removing noise and hair
The preprocessed output is subjected to non subsampled bendlet transform and the texture features are extracted in the subbands at various levels and directions. The energy from each subband is calculated and given as input to the classifiers. Various classifiers namely kNN, NB, DT and SVM are used to classify the images into normal and abnormal in the first phase and again abnormal into benign and malignant in the second phase.
Non Subsampled Bendlet Transform
Dermoscopic images consists of regions seperated by lines and curves and these curves provides various information about the image features. The existing directional representation systems such as curvelet [18], contourlet [19], shearlet [20], bendlet [21] differ from regular wavelets where the degree of directions or orientation varies with the level of decomposition. This property classifies the curvature effectively and gives many directional information. Curvelets are constructed by parabolic scaling or dilation, orientation and translation parameters.
where, j-Scale, θ-Orientation, k1, k2-Location of curvelets.
The contourlets are the extension of curvelets and constructed by combining laplacian pyramid and directional filter banks to capture the anisotropic features. The laplacian pyramid is used to capture the discontinuties, followed by directional filter banks to connect point singularities into linear structure.It suffers from shift variant due to subsampling in both the stages. Shearlets are multilevel and multi diectional transform constructed by parabolic scaling, shearing and translation applied to few generating functions.
where, Tt is the translation operator,
The scaling matrix are given as
The above mentioned transforms are based on scale, shearing and translation whereas in Bendlet system [22] an extra parameter bending is included which is one of the main advantage for characterizing the curvature based on the decay rates of transform. The bendlet is the extension of shearlet which improves the adaptivity of the system with bent parameters. The traditional methods have weakness incase of optimal geometric singularities of lines and curved edges.
NSBT is a type of second order shearlet system which captures anisotropic features like edges, curves and other discontinuities from the images more precisely and classify them accurately. The advantage of bending parameter with NSBT exhibits quadratic property in spatial coordinates and uses alpha scaling instead of parabolic scaling. With alpha scaling, it gives location, orientation and curvature of system elements. The alpha scaling is given by
where a > 0 and α ϵ [0, 1]
The value of alpha 0 < α < 1/2 decides the type of scaling used to extract the curves from the dermoscopic images.
α = 0 corresponds to directional scaling called ridgelet.
α = 0.5 corresponds to parabolic scaling called curvelets and shearlets.
α = 1 corresponds to isotropic scaling called wavelets.
The shearing matrix is given as
Here, s stands for integer
The lth order shearlet is written as
When,
l = 1 represents shearing matrix
l = 2 represents both shearing and bending
The bendlet system is represented by the equation as
where a, s, b, t represents scale, shear, bend and location.
The cone adopted NSBT system is expressed as
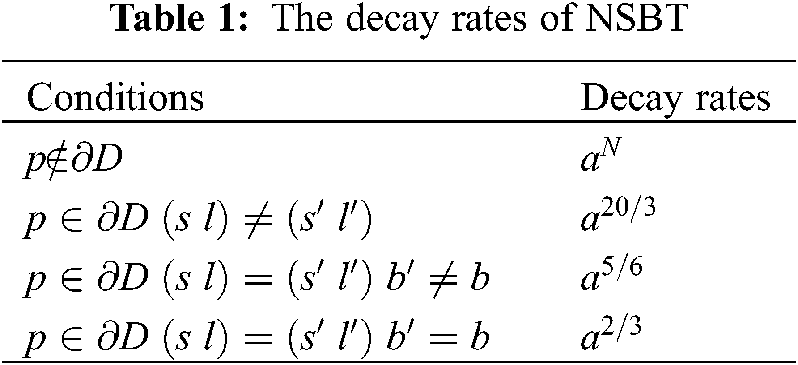
The heuristic argument of NSBT system illustrates the following points by Lessig et al. [21]
(i) The magnitude coefficients of bendlet system will be zero if the point p does not intersect the boundary curve ∂D.
(ii) The point p intersects the boundary curve ∂D but the parameters scale, shear and bend do not intersect the boundary curve then the magnitude coefficients of bendlet system will be less or close to zero.
(iii) The point p intersects the boundary curve ∂D along with parameters scale and shear but bend parameter does not intersect the curve then the magnitude coefficients of bendlet system will give a moderate value.
(iv) The point p intersects the boundary curve ∂D along with parameters scale, shear and bend then the bendlet system will give high magnitude coefficients values.
The decay rates are given in the Table 1.
NSBT Algorithm
In recent years, various directional representation systems were considered to extract the curves from dermoscopic images for the classification purpose but the drawback in that is they cannot classify the curvature precisely and characterize them. The proposed NSBT not only extracts the anisotropic features but also classifies them effectively improving the classification accuracy. The main steps of the proposed NSBT are described in detail as follows:
Step 1: The output from pre-processed image of size 768 × 560 is resized to 256 × 256 is shown in Fig. 4. The input image of size 256 × 256 is subjected to NSBT decomposition.
Step 2: Initializing the parameter values for cone adopted bendlet transform with α = 0.33 and obtain the coefficients at various levels and directions.
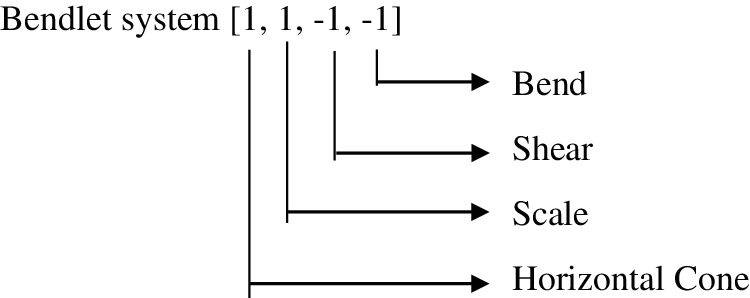
To obtain the coefficients for Level 1 and Directions 2, assign the values for scale, shear and bend as mentioned below:
Cone = 1:2
Scale = 1 to nScale [1]
Shear = −nShear to nShear [−1 0 1]
Bend = −nBend to nBend [−1 0 1]
Step 3: Design the shorter low pass band based on scale and alpha values. The frequency response of low pass filter is shown in Fig. 5.
Step 4: Generate other wavelet depending on scale by using Daubechies wavelet db8 as given in Fig. 6.
Step 5: Multiply wavelets obtained from Step 3&4 and apply zero padding to get high pass bands as shown in Figs. 7 and 8.
Step 6: Directional components are obtained by various parameter values of shearing and bending as shown in Fig. 9.
Step 7: Finally, the bendlet system that precisely captures the curvature at Level 1 and Direction 2 are obtained for horizontal cone are shown in Fig. 10.
Step 8: The sub bands are generated by convolving the input image with the bendlet system.

Figure 4: (a) Input image of size 768 × 560 (b) resized image of size 256 × 256

Figure 5: Frequency response of low pass filter

Figure 6: Daubechies wavelet-db8

Figure 7: Generation of high pass bands
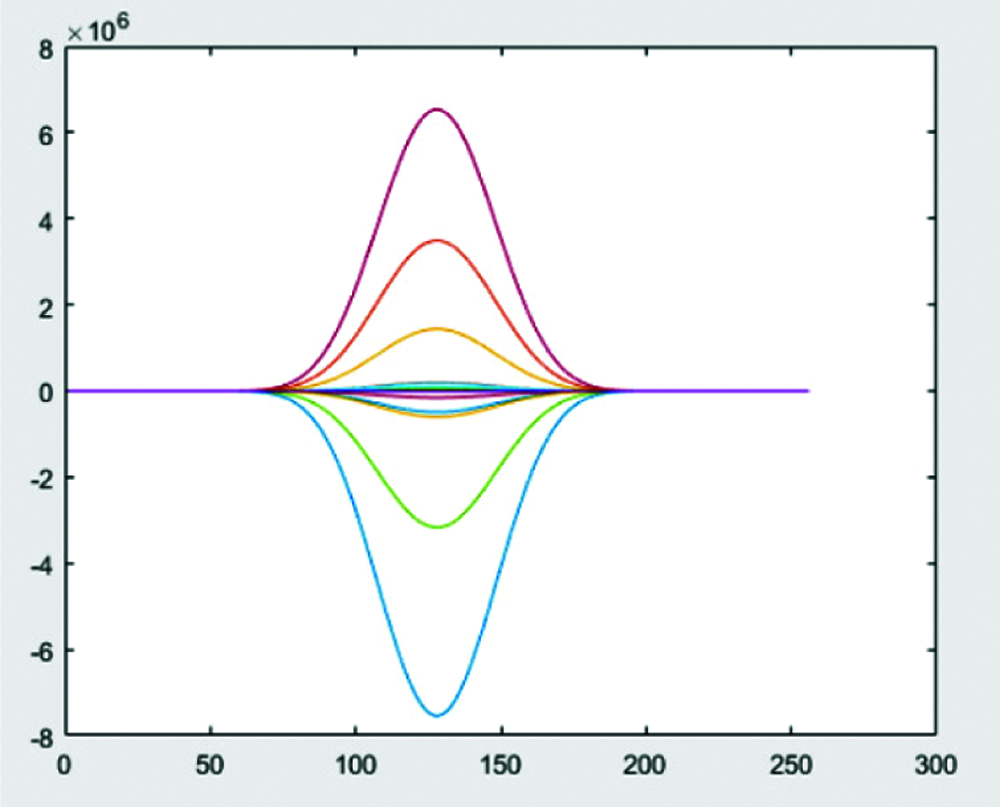
Figure 8: Normalization by zero padding

Figure 9: Directional components at various levels and directions

Figure 10: Bendlet systems generated for Level 1 and Direction 2 for horizontal cone shaped NSBT Transform. Similarly, bendlet systems generated from horizontal cone are rotated by 90’ to get the bendlet system for vertical cone
Totally 19 sub bands are obtained at Level 1 and Direction 2 are shown in Fig. 11. Out of 19 sub bands, 8 sub bands are generated from horizontal cone, 8 sub bands from vertical cone and 1 sub band from the low pass filter.
Step 9: Repeating the above steps from Step 2 to Step 8, sub bands for other levels and directions are generated.

Figure 11: Sub bands at Level 1 and Direction 2
The total number of sub bands generated at each level and directions during NSBT decomposition are given in Table 2. The sub bands obtained from the decomposition are of size 256 × 256 due to non-subsampling. The main advantage of using non-subsampling technique is shift invariant that it does not use down sampling and up sampling techniques for each decomposition level. The number of sub bands obtained from the bendlet system will increase the dimension of feature space. To reduce the feature space, energy features are extracted from each sub band and the equation is expressed as
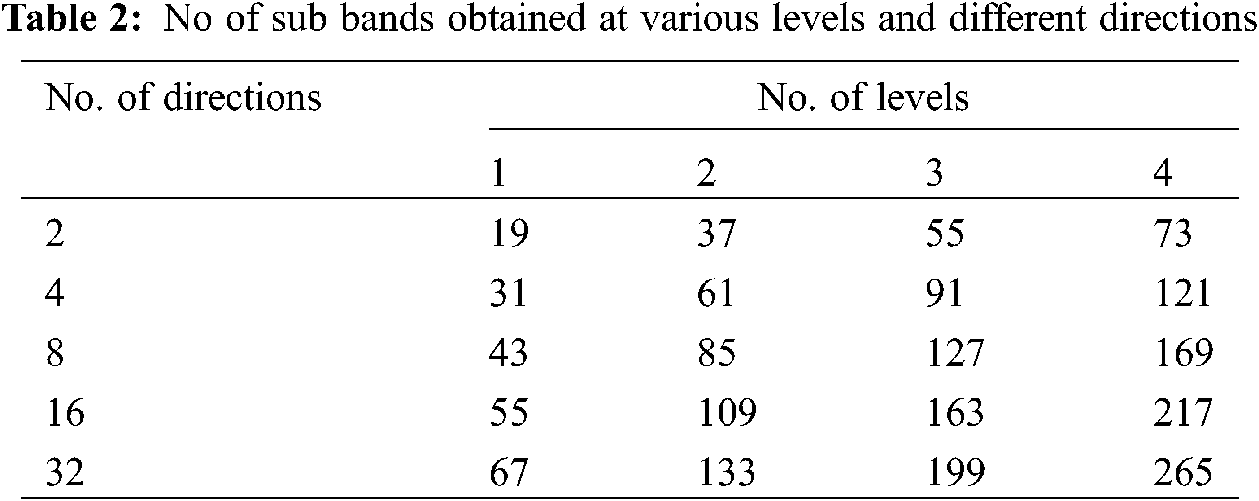
R-size of row, C-size of column.
The value of R and C are 256 × 256. The mean of the magnitude of sub bands or sub image gives the total energy features from the PH2 dataset. The features are given as input to the classifier stage.
Classifiers
The detection of melanoma from PH2 dataset is carried out by two independent SVM classifiers. In first phase classification 120 abnormal and 80 normal images were used and in second phase 80 benign and 40 malignant images were used for training. Various classifiers like kNN, NB, DT and SVM were used to classify the images into its corresponding categories.
kNN is a type of supervised machine learning algorithm which is also called as lazy learning algorithm. It works by calculating distance between the feature vectors by Euclidean distance method. Consider two vectors u = (x1, x2) and v = (y1, y2), the distance between the two vectors is calculated by the equation
Here the K value is chosen as 1 and the new feature is classified based on majority votes.
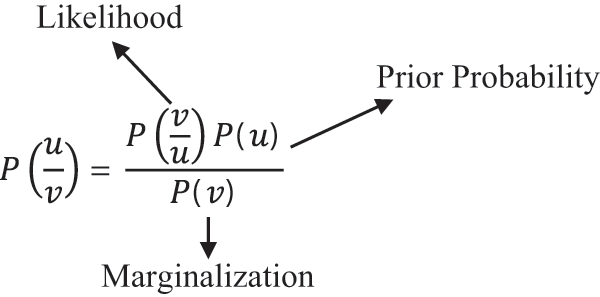
Naive Bayes is a type of probabilistic classifier that follows Bayes theorem in order to classify the images. It assumes that the occurrences of features in a class are not related with the presence of any other features. So, all the features are classified independently. The Bayes formula is given by
Decision Trees are a family of supervised machine learning algorithm that predicts the target variable using graphical representation with leaf node as a class label. Decision trees start with root node and split into many branch nodes. The features of root node are generated by attribute selection measures which is repeated till a leaf node is reached. The entropy and gini index impurity are given by the equation as
Support Vector Machine classifies the data points by creating a hyperplane between the class labels with maximum margin. Two parallel marginal lines are drawn parallel to the hyperplane that separates the datapoints into two classes. The distance between the marginal lines should be maximum to reduce the classification errors. The PH2 dataset consists of non-separable data points which cannot be separated by the hyperplane. In this case, SVM kernels are used to map the data points from two dimensions into high dimensional space. The gaussian kernel called radial basis function kernel RBF is used to effectively separate the data points into two classes as shown in Fig. 12.
Radial Basis Function is given by the equation as
3 Experimental Results and Discussions
The validation is carried out by using k fold cross validation to assess the performance of the model. The original data set is partitioned into k subsets or folds. In first phase of classification, 200 dermoscopic images were used, the value of k is chosen as 10. The total 200 dermoscopic images are divided by k = 10 to give 10 folds with 20 images in each fold. The 20 images in each fold contains 12 abnormal images and 8 normal images are shown in Fig. 13.
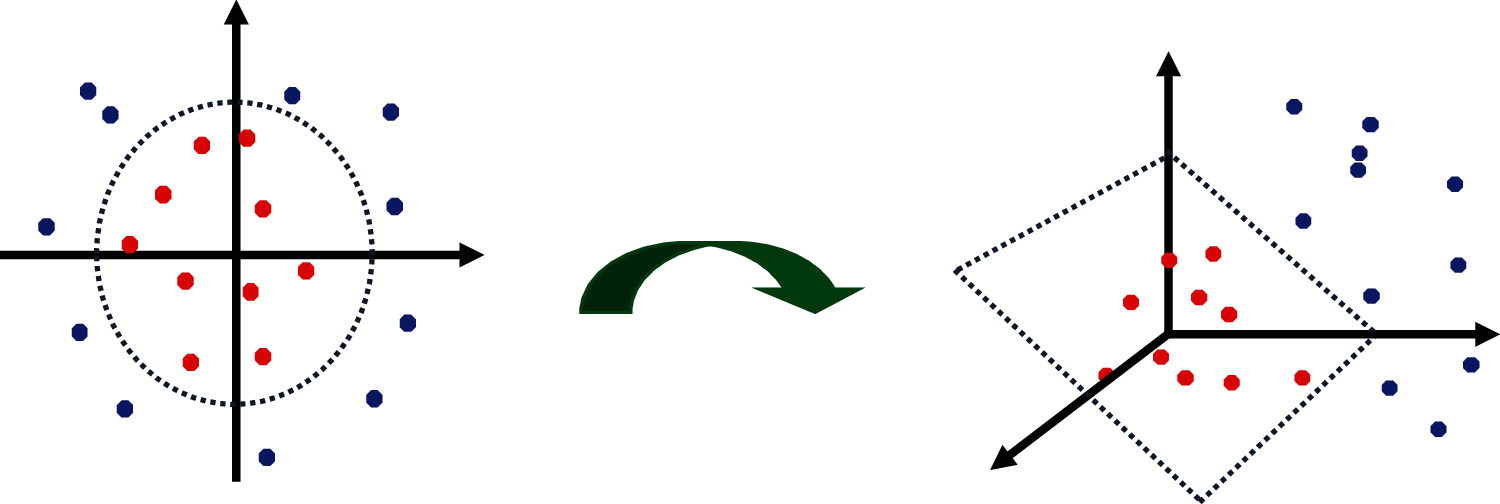
Figure 12: 3 mapping of data points by SVM-RBF kernels
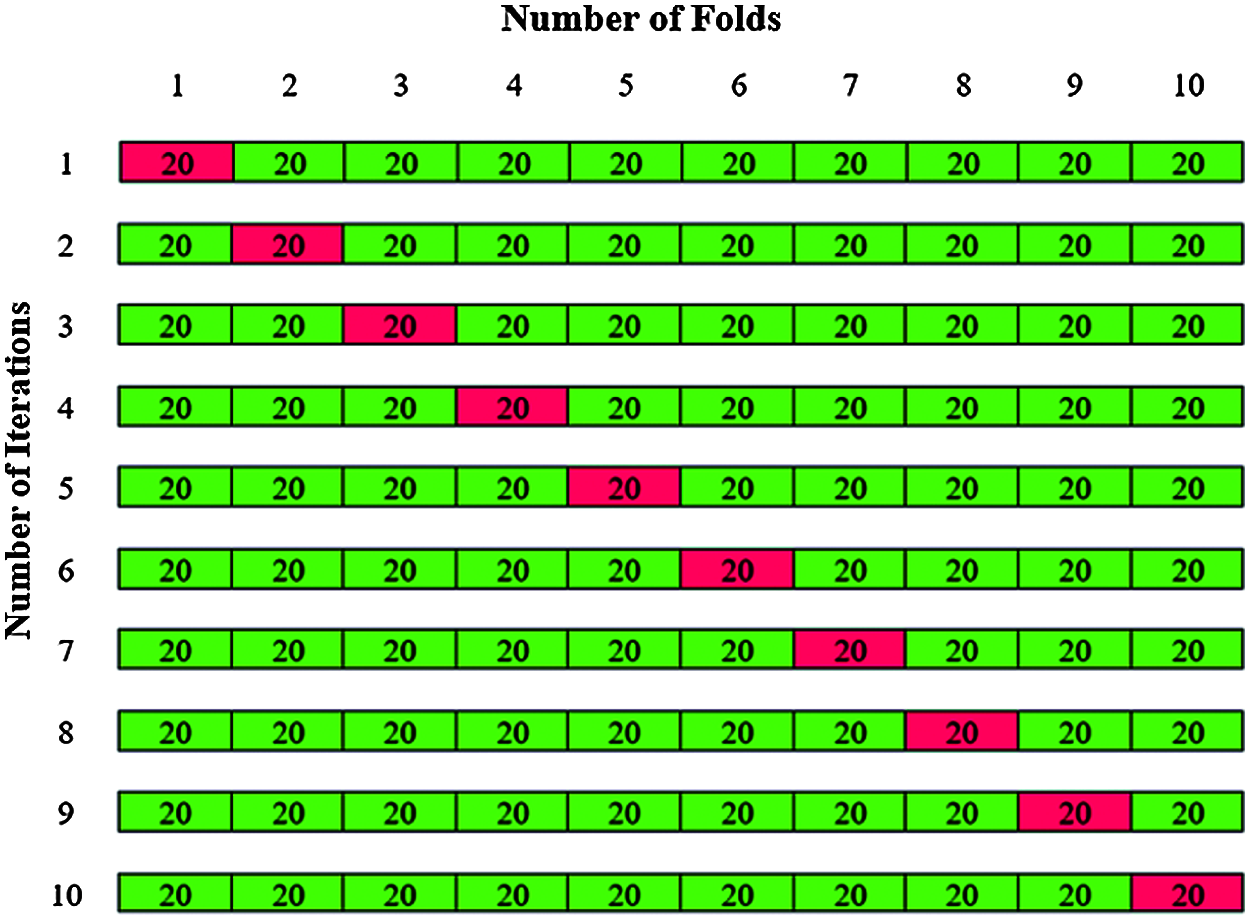
Figure 13: K-fold cross validation for Phase I classification
The training is carried out with k-1 folds and validation with one-fold. The experiments are repeated for all the ten iteration folds and averaging the accuracy gives the total accuracy for Phase I classification.
In Phase II classification, 120 abnormal images are considered for classification in which 80 images belong to benign and 40 images belong to malignant. The total 120 abnormal images are divided by k = 10 to give 10 folds with 12 images in each fold are shown in Fig. 14. The 12 images in each fold contain 8 benign images and 4 malignant images. The same steps of Phase I classification are repeated for phase II classification and the total accuracy is obtained.
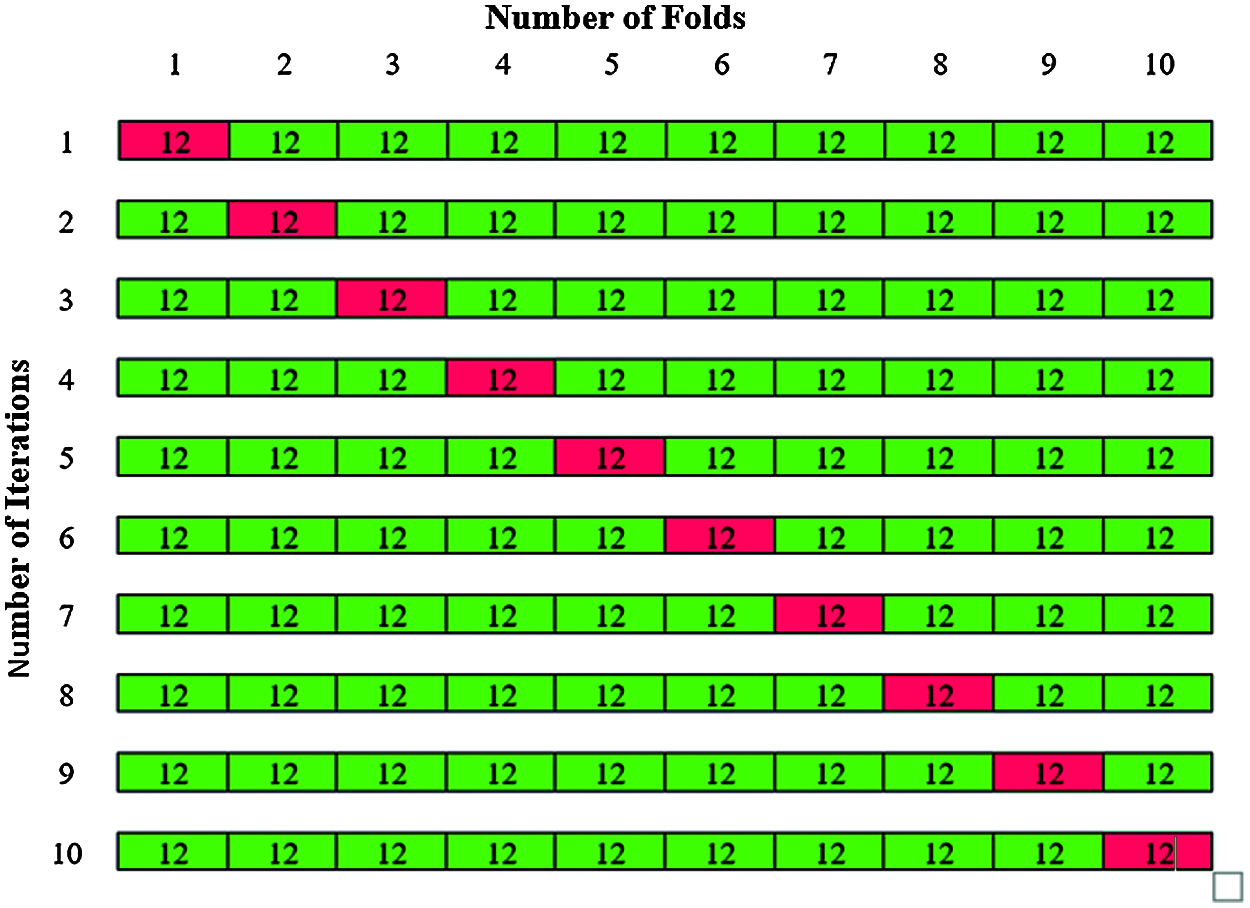
Figure 14: K-fold cross validation for Phase II classification
The performance metrics are evaluated using sensitivity, specificity and accuracy with four parameters namely, true positive, true negative, false positive and false negative.
• True Positive is the total number of features correctly classified as abnormal cases
• True Negative is the total number of features correctly classified as normal cases
• False Positive is the total number of features misclassified as normal cases
• False Negative is the total number of features misclassified as abnormal cases
Sensitivity (Sn) is defined as the ability of model to predict the true positives from the actual number of positives tested.
Specificity (Sp) is defined as the ability of model to predict the true negatives from the actual number of negatives tested.
Accuracy (Ac) is defined as the ability of model to predict the test data correctly from the total number of actual cases tested.
In each phase of classification, the levels of NSBT are varied from 1 to 4 and the directional features are extracted from 2 to 32, i.e., in multiples of 2 at every level. Table 3 shows the performance of first phase classification in which features are extracted by NSBT for Levels 1 to 4 and Directions 2 to 32 and finally the features are classified by using various classifiers such as kNN, NB, DT and SVM. Experimental results show that NSBT with SVM at Level 3 and Direction 8 provides better accuracy, sensitivity and specificity compared with other classifiers.
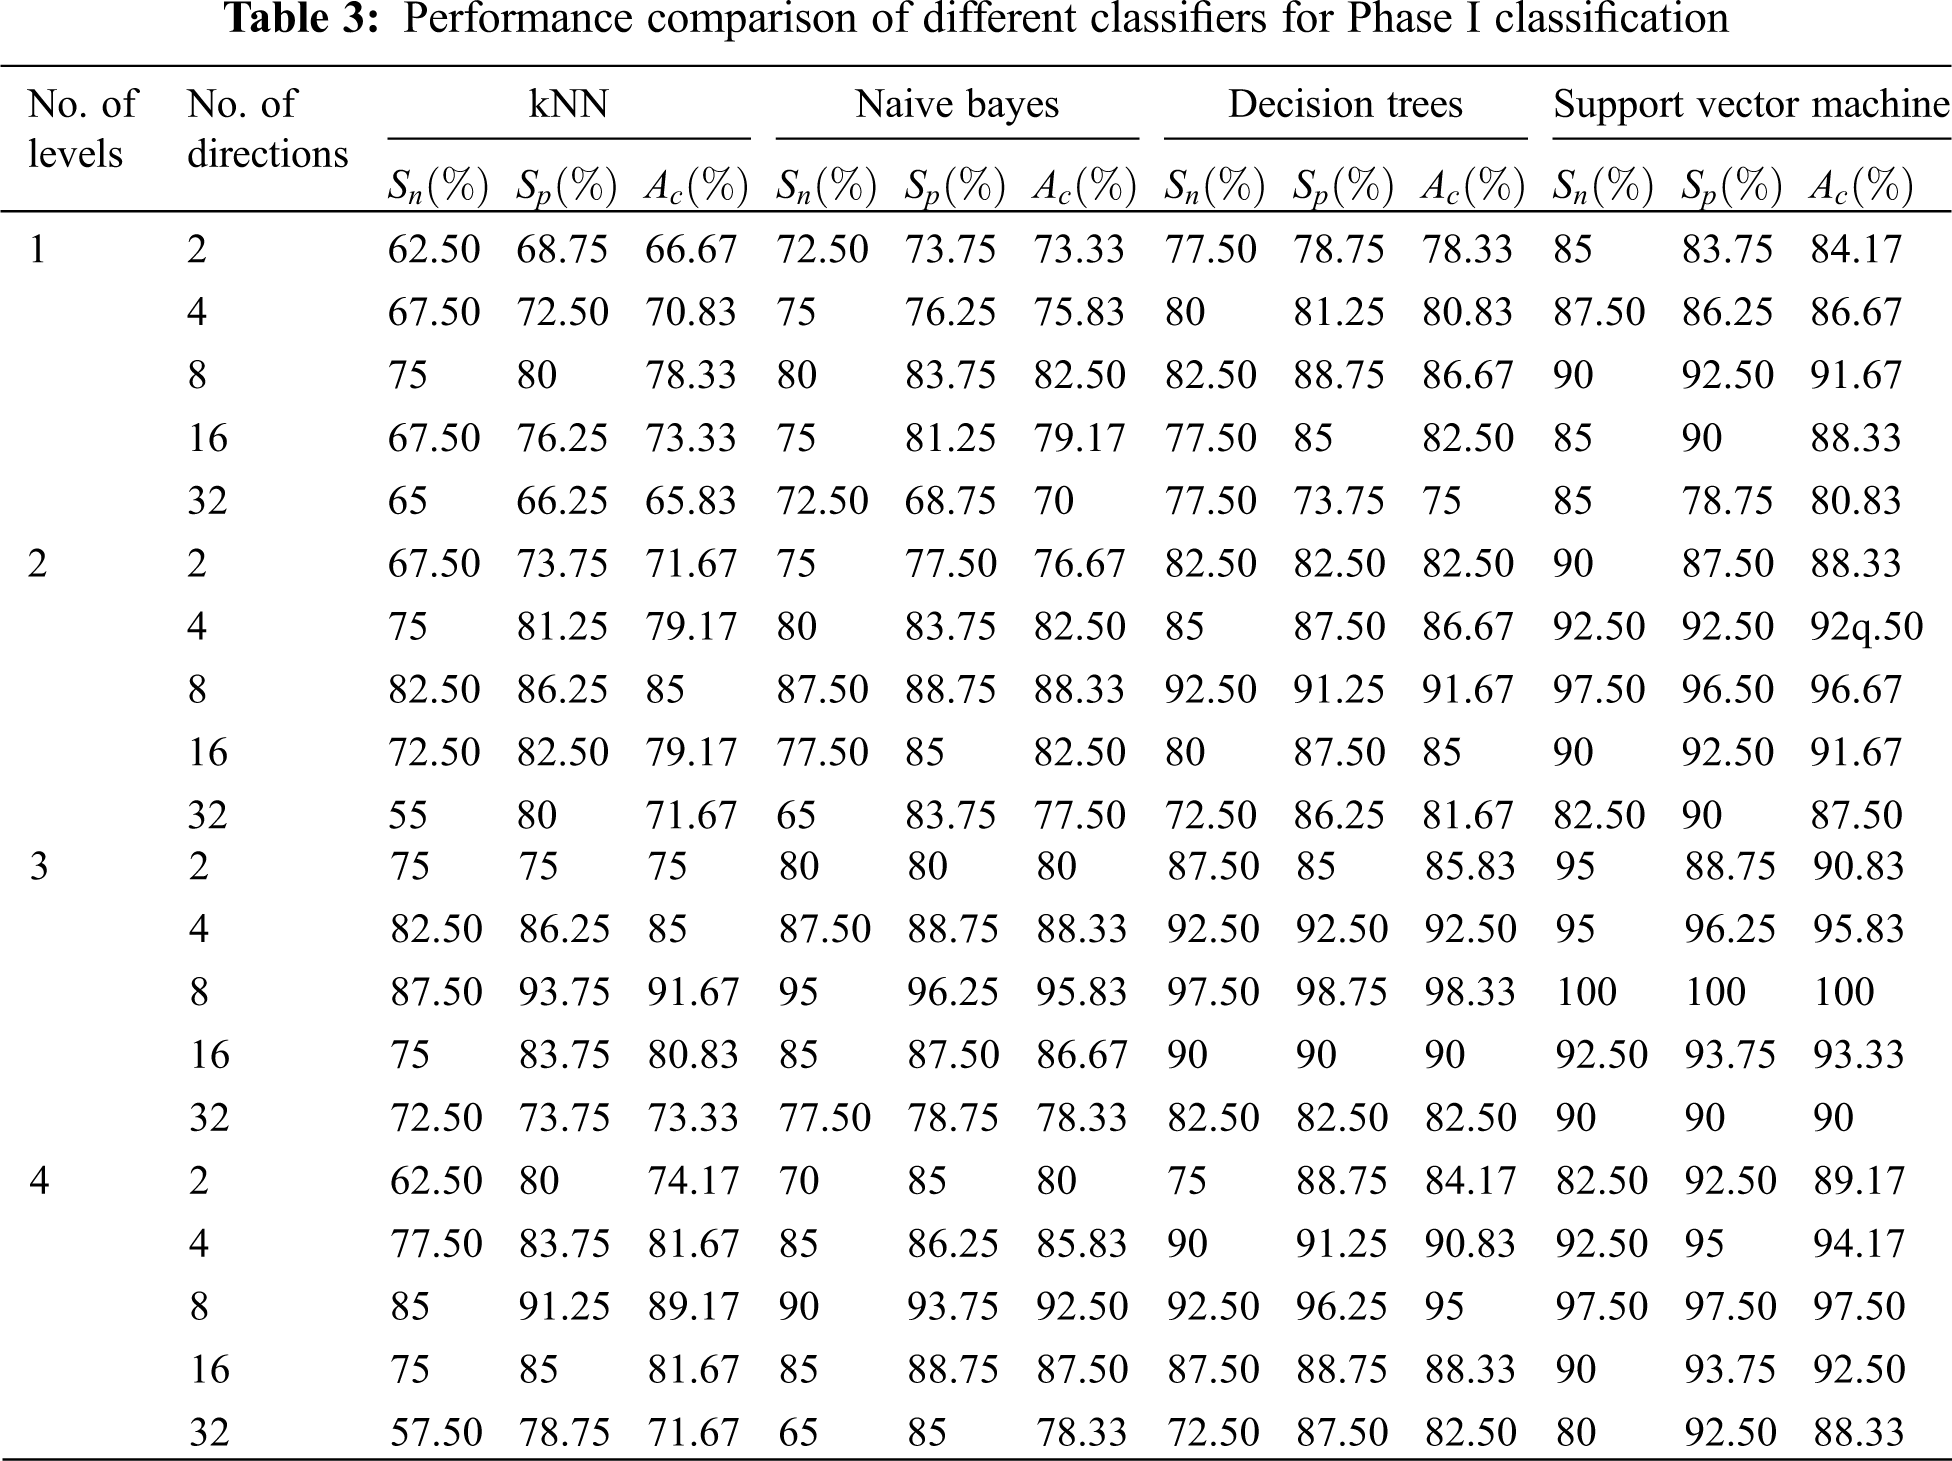
The performance of NSBT with decision trees are better than kNN and Naive Bayes. In first phase classification, the maximum accuracy of 98.50%, specificity of 97.50% and sensitivity of 100% are achieved with NSBT and SVM at Level 3 and Direction 8. In the second phase classification, the abnormality case is further categorized into benign and malignant. The features are extracted at various levels and different directions by using NSBT with various classifiers. It is observed from Table 4 that the performance of second phase classification provides maximum accuracy of 100%, specificity of 100% and sensitivity of 100% at Level 3 and Direction 8. The performance of NSBT with SVM decreases after Level 3 and Directions 8 due to redundant decomposition which produces many sub bands that do not have any discriminating power to classify the images. The presence of this sub bands in the classification system makes the model ineffective and also reduces the system performance.

The above results illustrate the effectiveness of using NSBT with different classifiers. A performance comparison of NSBT with different classifiers are shown in Figs. 15 and 16.
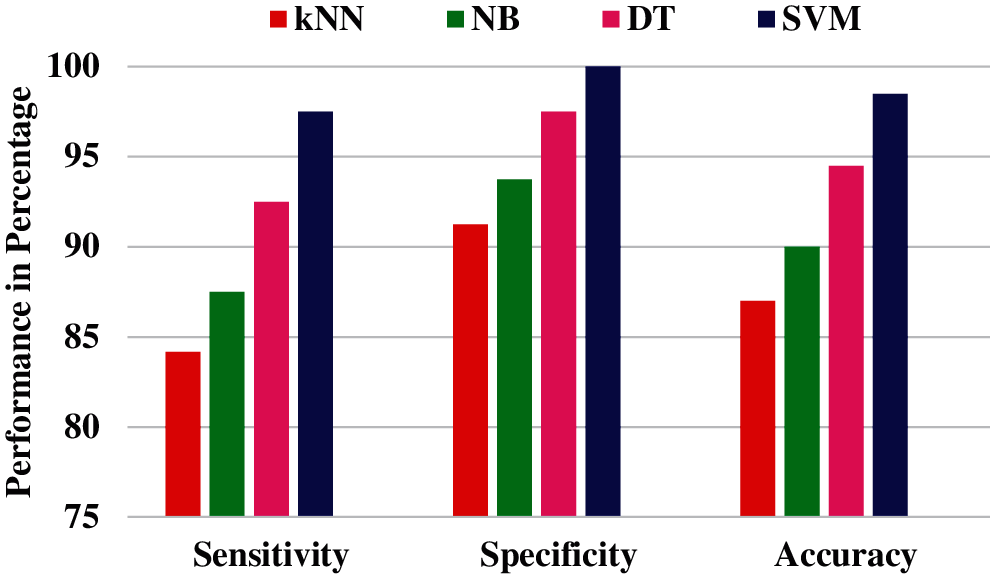
Figure 15: Performance comparison of NSBT with different classifier for Phase I classification

Figure 16: Performance comparison of NSBT with different classifier for Phase II classification
From the performance comparison in Figs. 15 and 16, NSBT with SVM provides better performance in terms of accuracy, sensitivity and specificity. NSBT with kNN is the least performer compared to all the other classifiers. The reason for poor performance of kNN is that they are not memory efficient due to the storage of many datapoints. Decision trees performs better compared with Naïve Bayes. NB suffers from zero frequency problem which further reduces the model performance. The drawback of DT is that any small change in the data can lead to large change in the tree structure. Hence the feature extracted from NSBT sub bands with SVM classifier are efficient compared with other classifiers.
In this article, the computerized diagnosis method for identification of melanoma is developed with three modules namely preprocessing, feature extraction and classification. The anisotropic features are represented by non-sub sampled bendlet transform and the energies are calculated from the sub bands. The energy features obtained at various levels and different directions preserved all the necessary information in the image making good features for classification. The energy features are classified using two stage classifiers such as kNN, NB, DT and SVM. Experimental result shows that NSBT along with SVM-RBF provides better classification results in both the phase of classification. The first phase classification gives classification result of sensitivity 97.50%, specificity 100%, accuracy 98.50% and second phase classification gives classification result of sensitivity 100%, specificity 100% and accuracy 100%. Thus, the stated objectives are achieved by developing noninvasive computerized diagnostic method.
Funding Statement: The authors received no specific funding for this study.
Conflicts of Interest: The authors declare that they have no conflicts of interest to report regarding the present study.
1. Siegel, R. L., Miller, K. D., Fuchs, H. E., Jemal, A. (2021). Cancer statistics 2021. Cancer Journal for Clinicians, 71 (1), 7–33. DOI 10.3322/caac.21654. [Google Scholar] [CrossRef]
2. Vigneshwaran, N., Padmapriya, P., Noorasafrin, A., Pooja, B., Hema, K. et al. (2018). Skin cancer detection using non-invasive techniques. Royal Society of Chemistry, 8, 28095–28130. DOI 10.1039/c8ra04164d. [Google Scholar] [CrossRef]
3. Tan, T. Y., Zhang, L., Lim, C. P. (2019). Intelligent skin cancer diagnosis using improved particle swarm optimization and deep learning models. Applied Soft Computing, 84, 105725–105732. DOI 10.1016/j.asoc.2019.105725. [Google Scholar] [CrossRef]
4. Chatterjee, S., Dey, D., Munshi, S., Gorai, S. (2019). Extraction of features from cross correlation in space and frequency domains for classification of skin lesions. Biomedical Signal Processing and Control, 53, 101581–101589. DOI 10.1016/j.bspc.2019.101581. [Google Scholar] [CrossRef]
5. Mahbod, A., Schaefer, G., Ellinger, I., Ecker, R., Pitiot, A. et al. (2018). Fusing fine-tuned deep features for skin lesion classification. Computerized Medical Imaging and Graphics, 71, 19–29. DOI 10.1016/j.compmedimag.2018.10.007. [Google Scholar] [CrossRef]
6. Saez, A., Acha, B., Serrano, A., Serrano, C. (2018). Statistical detection of colors in dermoscopic images with a texton-based estimation of probabilities. IEEE Journal of Biomedical and Health Informatics, 23(2), 560–569. DOI 10.1109/jbhi.2018.2823499. [Google Scholar] [CrossRef]
7. Adjed, F., Gardezi, S. J. S., Ababsa, F.,Faye, I. , Dass, S. C., (2017). Fusion of structural and textural features for melanoma recognition. IET Computer Vision, 12(2), 185–195. DOI 10.1049/iet-cvi.2017.0193. [Google Scholar] [CrossRef]
8. Serten, S., Demirel, H. (2020). Wavelet-based deep learning for skin lesion classification. IET Digital Library, 14(4), 720–726. DOI 10.1049/iet-ipr.2019.0553. [Google Scholar] [CrossRef]
9. Nasir, M., Attique Khan, M., Sharif, M., Lali, I. U., Saba, T. et al. (2018). An improved strategy for skin lesion detection and classification using uniform segmentation and feature selection based approach. Microscopy Research and Technique, 81(6), 528–543. DOI 10.1002/jemt.23009. [Google Scholar] [CrossRef]
10. Ozkan, I. A., Koklu, M. (2017). Skin lesion classification using machine learning algorithms. International Journal of Intelligent Systems and Applications in Engineering, 5(4), 285–289. DOI 10.18201/ijisae.2017534420. [Google Scholar] [CrossRef]
11. Ma, Z., Tavares, J. M. R. S. (2017). Effective features to classify skin lesions in dermoscopic images. Expert Systems with Applications, 84, 92–101. DOI 10.1016/j.eswa.2017.05.003. [Google Scholar] [CrossRef]
12. Talavera-Martínez, L., Bibiloni, P., González-Hidalgo, M. (2021). Hair segmentation and removal in dermoscopic images using deep learning. IEEE Access, 9, 2694–2704. DOI 10.1109/ACCESS.2020.3047258. [Google Scholar] [CrossRef]
13. Song, L., Lin, J., Wang, Z. J., Wang, H. (2020). An end-to-end multi-task deep learning framework for skin lesion analysis. IEEE Journal of Biomedical and Health Informatics, 24(10), 2912–2921. DOI 10.1109/jbhi.2020.2973614. [Google Scholar] [CrossRef]
14. Zhang, B., Wang, Z., Gao, J., Rutjes, C., Nufer, K. et al. (2021). Short-term lesion change detection for melanoma screening with novel siamese neural network. IEEE Transactions on Medical Imaging, 40 (3), 840–851. DOI 10.1109/TMI.2020.3037761. [Google Scholar] [CrossRef]
15. Gupta, C., Gondhi, N. K., Lehana, P. K. (2019). Analysis and identification of dermatological diseases using Gaussian mixture modeling. IEEE Access, 7, 99407–99427. DOI 10.1109/access.2019.2929857. [Google Scholar] [CrossRef]
16. Mahmouei, S., Aldeen, S., Stoecker, M., Garnavi, W. V. R. (2019). Biologically inspired quadTree color detection in dermoscopy images of melanoma. IEEE Journal of Biomedical and Health Informatics, 23(2), 570–577. DOI 10.1109/JBHI.2018.2841428. [Google Scholar] [CrossRef]
17. Teresa, M., Pedro, M. F.,Jorge, M., Andre, R. S. M., Jorge, R. (2013). PH2–A dermoscopic image database for research and benchmarking. 35th International Conference of the IEEE Engineering in Medicine and Biology Society, 5437–5440. DOI 10.1109/EMBC.2013.6610779. [Google Scholar] [CrossRef]
18. Zaouali, M., Bouzidi, S., Zagrouba, E. (2016). Review of multiscale geometric decompositions in a remote sensing context. Journal of Electronic Imaging, 25(6), 616171–6161720. DOI 10.1117/1.JEI.25.6.061617. [Google Scholar] [CrossRef]
19. Sonia, R. (2016). Melanoma image classification system by NSCT features and Bayes classification. International Journal of Advances in Signal and Image Sciences, 2(2), 27–33. DOI 10.29284/ijasis.2.2.2016.27-33. [Google Scholar] [CrossRef]
20. Kumar, D., Kumar, S., Balbir, S. (2016). Cone-adapted continuous shearlet transform and reconstruction formula. Journal of Nonlinear Science and Applications, 9, 262–269. DOI 10.22436/JNSA.009.01.25. [Google Scholar] [CrossRef]
21. Lessig, C., Petersen, P., Schafer, M. (2017). Bendlets: A second-order shearlet transform with bent elements. Applied and Computational Harmonic Analysis, 46(2), 384–399. DOI 10.1016/j.acha.2017.03.005. [Google Scholar] [CrossRef]
22. Poovizhi, S., Ganesh Babu, T. R. (2020). An efficient skin cancer diagnostic system using bendlet transform and support vector machine. Annals of Brazilian Academy of Sciences, 92(1), 1–12. DOI 10.1590/0001-3765202020190554. [Google Scholar] [CrossRef]
 | This work is licensed under a Creative Commons Attribution 4.0 International License, which permits unrestricted use, distribution, and reproduction in any medium, provided the original work is properly cited. |