Biomechanics
| Molecular & Cellular Biomechanics |
DOI: 10.32604/mcb.2021.014731
ARTICLE
Motion Features of Legs in Volleyball Block Jump Based on Biomechanical Analysis
Department of Sports, Tianjin Chengjian University, Tianjin, 300384, China
*Corresponding Author: Yan Yang. Email: yanye566659000@163.com
Received: 24 October 2020; Accepted: 04 March 2021
Abstract: Blocking technology is one of the most important means to obtain score in volleyball, which has a great influence on the victory of the game. In this study, the vertical jump was analyzed to understand the movement characteristics of legs during training time. The kinematics and dynamics data of the legs of 10 volleyball players after training for 0 h, 0.5 h, 1 h and 2 h were studied by using an infrared light point motion capture system and force measuring platform. The results showed that the joint angles of the players who had 1 h and 2 h of training in the buffering and pedaling and stretching stages decreased markedly compared with those who had 0 h of training. The peak angular velocity and impulse of hip and knee joints after 1 h and 2 h of training decreased in the pedaling and stretching stage. In the flight stage, the time of flight and the height of center of gravity showed a downward trend, while the time of landing and the angle of the knee joint decreased. After 1 h and 2 h of training, at the moment of double-foot landing, the flexion and extension angle of the knee joint increased, and the angular velocity of the knee joint and ankle joint decreased markedly. The length of training time has a great impact on the joints of legs, including increasing joint pressure and the risk of injuries.
Keywords: Biomechanics; kinematics; dynamics; volleyball; blocking
Blocking is an important means to obtain score in volleyball [1]. In competition, blocking can block the opponent from scoring through spiking [2], so as to gain the chance of initiative attack for his own side and improve the winning rate [3]. In addition, the success of blocking can inspire the morale of the team members and mobilize greater enthusiasm to face the competition and achieve good results. The height of takeoff has a great influence on the success rate of blocking. The higher the takeoff, the greater the success rate of blocking. Blocking technology has been widely concerned and studied because of its importance. Gerwyn Hughes et al. [4] found that the extension moment of normal knee joint of women was significantly lower than that of men at block jump, while the maximum standardized knee valgus moment of women was significantly larger than that of men. Hughes et al. [5] found that the blocking of the opponent has a great impact on the knee joint, there were significant differences in the flexion range of te knee joint and the maximum knee valgus angle, and the blocking of the opponent might change the muscle and nerve response during block jump. Ficklin et al. [6] compared the traditional blocking technology with swing blocking technology and found that the latter has higher takeoff height and effective blocking space, but it might reduce the adjustment ability of athletes when facing wrong judgment. Zahradnik et al. [7] found that step-back landing had a great impact on the knee, hip and ankle joints after the block jump, which might bring higher risk of anterior cruciate ligament (ACL) injury. In the blocking process, repeated jump and landing may bring great impact to various joints of legs, especially knee joints [8]. Among the current studies concerning volleyball block take-off, most of them focus on the analysis of the working process of lower limbs through different methods, rarely involving the changes of athletes’ lower limb movement characteristics under fatigue state. Biomechanical analysis can directly show the changes of athletes’ sports characteristics under fatigue state, which has been studied in many types of sports. Through the study of 14 Irish competitive dancers, Wild et al. [9] found that the landing performance of dancers decreased, the load of ankle and knee joints increased, and they faced greater risks of injury under fatigue state. Yu et al. [10] studied 15 male subjects and asked them to perform three jumping movements before and after fatigue. They found that fatigue would increase the abduction angle of knee joints, the flexion moment of hip joints, and the range of motion of ankle and knee joints in the frontal plane. Zago et al. [11] found that athletes’ fatigue would lead to the increase of knee flexion angle and hip abduction and internal rotation in repeated 180-degree turns, which would increase the risk of ligament injury. Tserenchiemed et al. [12] studied ten professional golfers and found that the knee joint flexion of the athletes was small, the internal rotation of the tibia was high, and the joint compression force increased in the fatigue stage, which led to the increase of ACL load. In this study, changes in leg movement characteristics under different training time were studied. Taking the vertical jumping in situ as an example, the changes of lower limbs in different stages of take-off were analyzed biomechanically to understand the influence of training time on block take-off, help coaches arrange the training schedule of athletes better, clarify the relationship between fatigue and movement characteristics, and prevent sport injuries.
2 Block Jump Technique of Volleyball
Blocking is one of the basic techniques of volleyball, which has a great influence on whether a team can win in a competition. It can be divided into in-situ blocking, mobile blocking, etc. The action of jumping include single leg jump, double-leg jump, front jump, side jump, etc. In this study, the most basic in-situ vertical jump action in blocking was taken as the research subject, and the changes of leg movement characteristics of athletes in different sports were analyzed from the perspective of biomechanics.
The process of vertical jump can be divided into buffering, pedaling and stretching, flight and landing. Buffering (Fig. 1) is the process from the motion starting of the knee joint to buffer to the lowest point. Pedaling and stretching is the process from the hip and knee joints descending to the lowest point to the moment that two feet away from the ground. Flight (Fig. 2) is the process from the moment that two feet away from the ground to the moment that two feet land on the ground. Landing is the process from the moment that two feet land on the ground to the moment that the knee and hip joints descending to the lowest point.
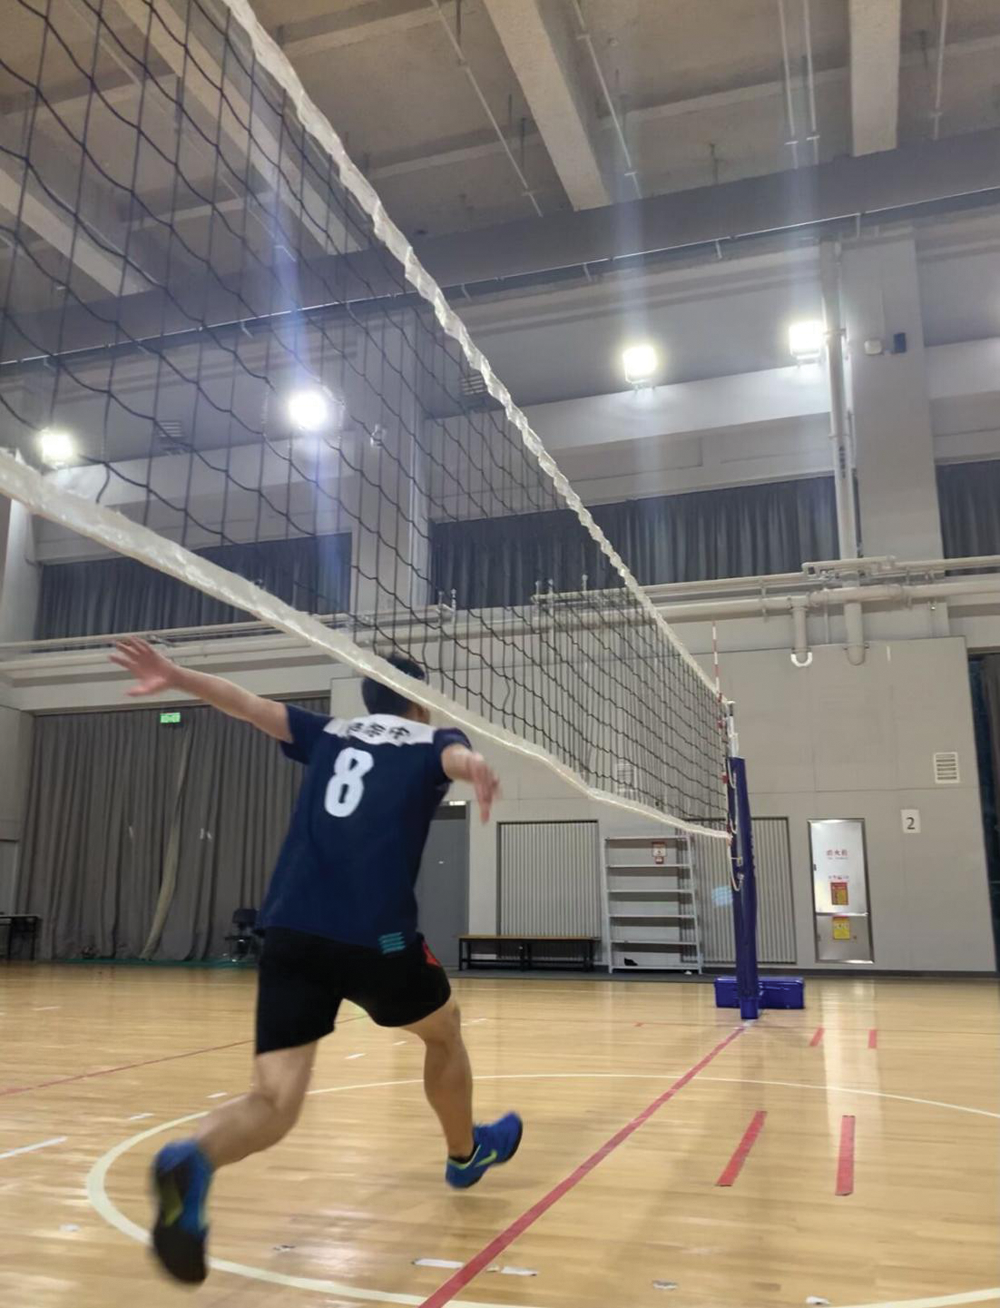
Figure 1: Buffering
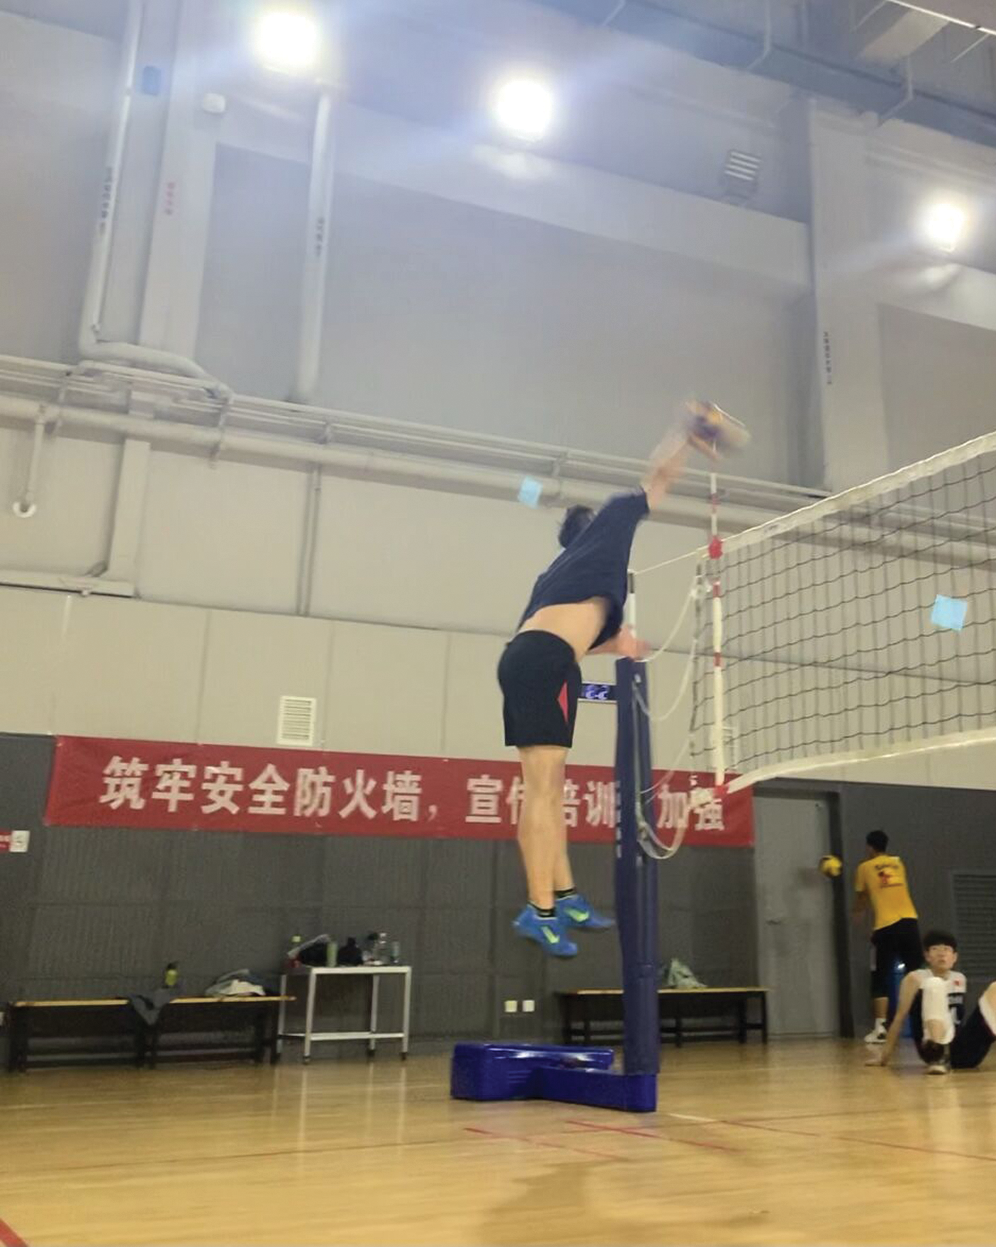
Figure 2: Flight
Ten male volleyball players from the male volleyball team in Department of Sports of Tianjin Chengjian University, were selected as the research subjects. They were healthy and received professional training in the college. They volunteered to participate in the research. Before conducting the research, the subjects were informed of the contents and procedures of the test and the matters needing attention, and the informed consent was signed. The basic information of the subjects is shown in Tab. 1.
Table 1: The basic information of the research subjects

Identification points were pasted at the key positions of the pelvis, calf and thigh, and kinematics related data were collected using American 3D MOTION infrared light point motion capture system. In the aspect of dynamics, two JP6060 multi-dimensional force measuring platforms were installed in embedded way for monitoring, which was at the same level of the runway, and the sampling frequency was 1000 Hz.
3.3 In-situ Vertical Jump Test
The test action was in-situ vertical jumping. The height of the net was 2.43 m. Players hold their hands flat in front of their chest, bent their knee joints (angle of the knee joint between 90° and 135°) and jumped with all their strength. When landing, their feet fell on two force measuring platforms respectively. They jumped three times with full strength in each test. Muscle interaction produced strength during jumping. The testing process is as follows. The basic information of athletes was collected. They warmed up. The identification points were pasted on the hip, knee and ankle joint of the athletes. They jumped from the force measuring platform three times with all their strength, and the data was taken as the data when no training was made. Then they received half hour of volleyball training and jumped again, and the data was taken as the data after half hour of training. The data after one hour of training and two hours of training were also collected. The whole experiment lasted for about 3 h.
Kinematics and dynamics data were obtained by using the software of a data acquisition system and were input into EXCEL2007 for analysis and processing. The indicators were described by the average values of the ten athletes,
With the increase of training time, the buffer time was gradually shortened (Fig. 3). The buffer time after 1 h of training and 2 h of training markedly decreased compared to that in the normal state, i.e., when the training time was 0.
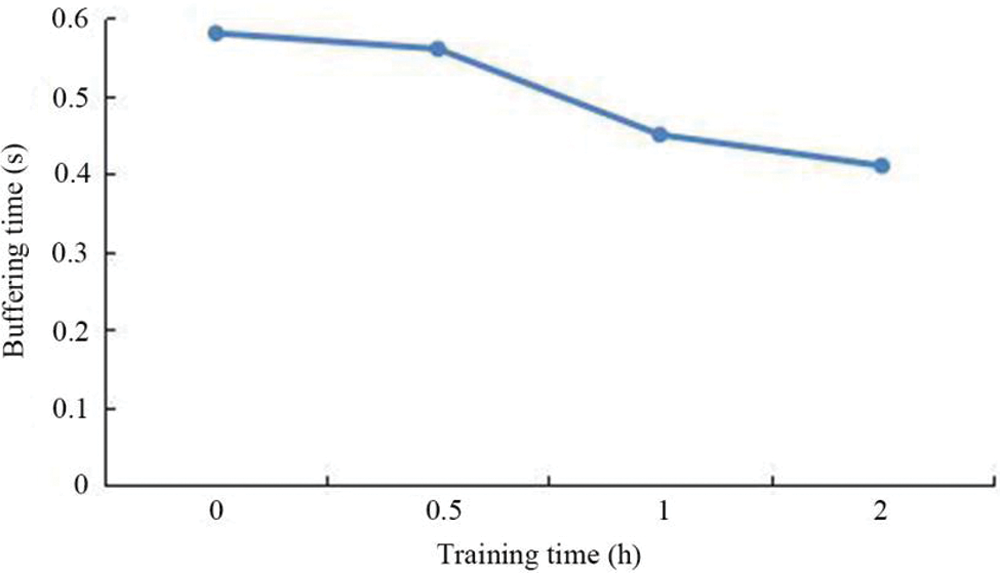
Figure 3: Changes in the buffer time
It was found from the obtained data that the angle of motion of lower limb joints decreased in the buffer stage with the increase of exercise time. The lower extremity joints included hip, knee and ankle joints. The data of each test are shown in Tab. 2.
Table 2: Changes in angles of different joints
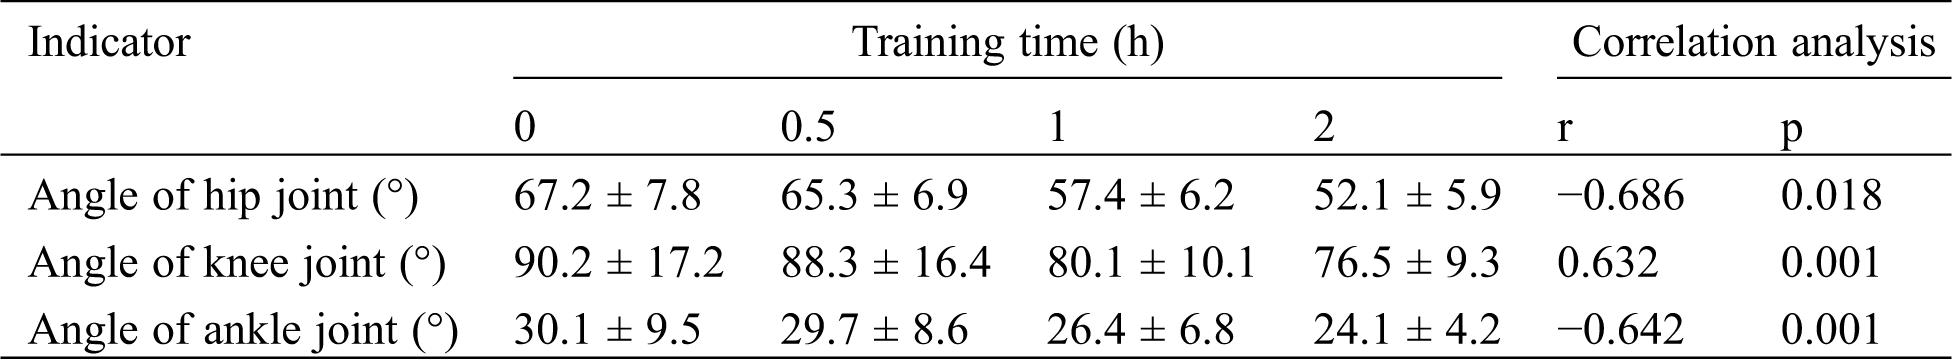
It was found from Tab. 2 that angles of different joints in the four tests showed a decreasing trend, indicating that the flexibility of the joints began to decline. There was no significant difference between the movement angle of different joints after training for 0.5 h and the normal state. When the training time reached 1 h, the movement angle began to decrease markedly. After the training time reached 2 h, the angle of the hip decreased to 52.1 ± 5.9°, the angle of the knee joint was 76.5 ± 9.3°, and the angle of the ankle joint was 24.1 ± 4.2°.
The other indicators in the buffering stage are shown in Tab. 3.
Table 3: Changes in the other indicators
As shown in Tab. 3, the training time had no significant impact on the angular velocity of different joints; with the increase of training time, the angular velocity of different joints increased slightly; the instantaneous force value at the end of buffer also had no great changes.
In the state of pedaling and stretching, the increase of training time had influence on indicators, such as pedaling and stretching time, changes in angles of lower limb angles and impulse.
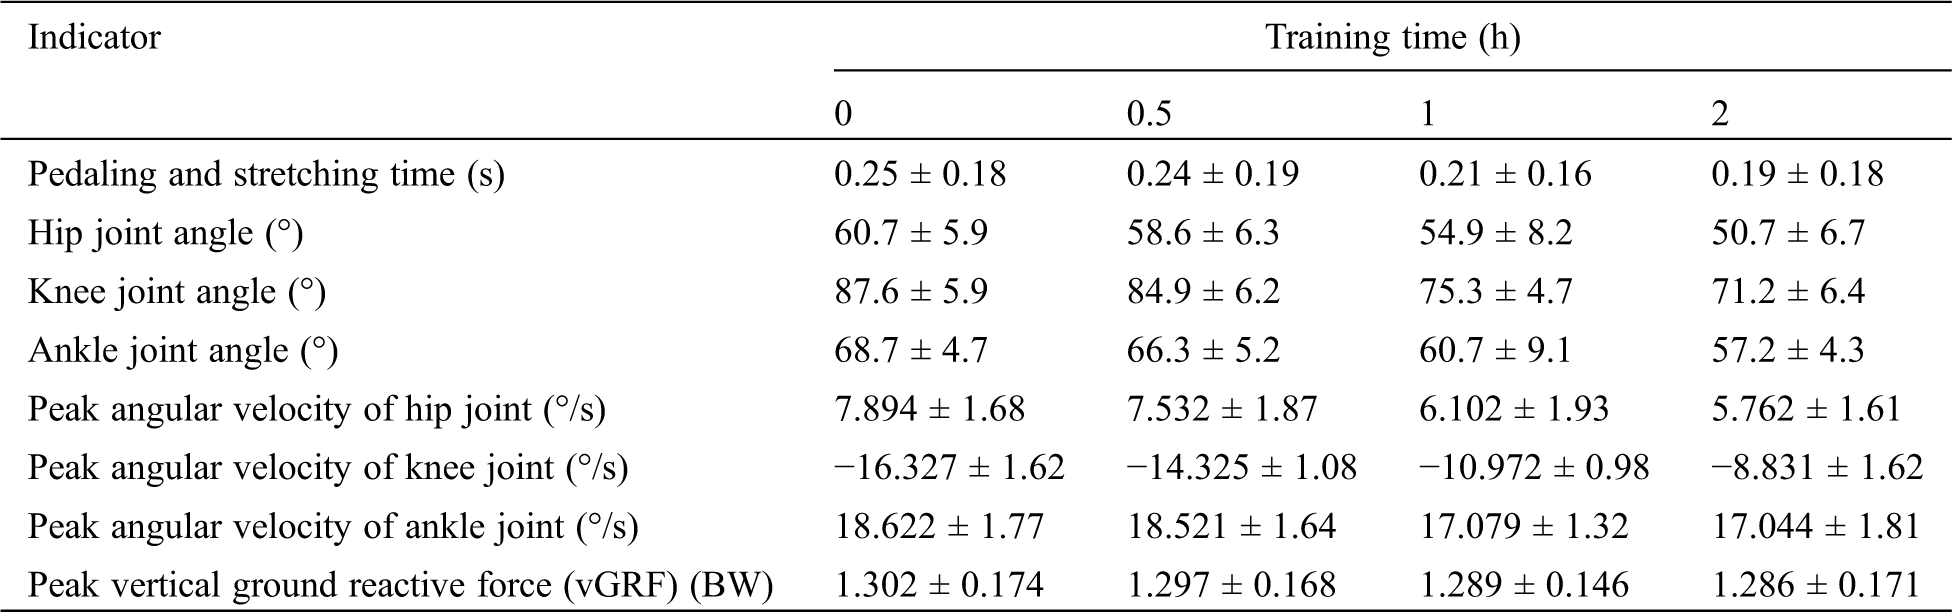
In combination with Tab. 4 from the point of view of the pedaling and stretching time, there was no significant difference between 0 h and 0.5 h, but after 1 h of training, the pedaling and stretching time was 0.21 ± 0.16 s, and after 2 h of training, it was 0.19 ± 0.18 s, which was significantly lower than that of normal state (0.25 ± 0.18 s); it was the same with that in the buffer stage. The change range of angle of the hip joint, knee joint and ankle joint also decreased with the increase of training time. The angle of each joint after 1 h of training and 2 h of training had a marked difference compared with the normal state. The peak angular velocity of hip joint, knee joint and ankle joint decreased with the increase of training time. The peak angular velocities of hip joints and knee joints after 1 h of training and 2 h of training markedly decreased with the increase of training time compared with those in the normal state. The angular velocity and the peak value of vGRF of the ankle joint decreased slightly.
Table 4: Changes in different indicators
It was seen from Fig. 4 that the impulse in the pedaling and stretching state decreased with the increase of training time. When the training time reached 0.5 h, the decrease of impulse was small. When the training time reached 1 h, the impulse in that stage decreased dramatically, and the impulse after 2 h of training was much smaller than that after 1 h of training.
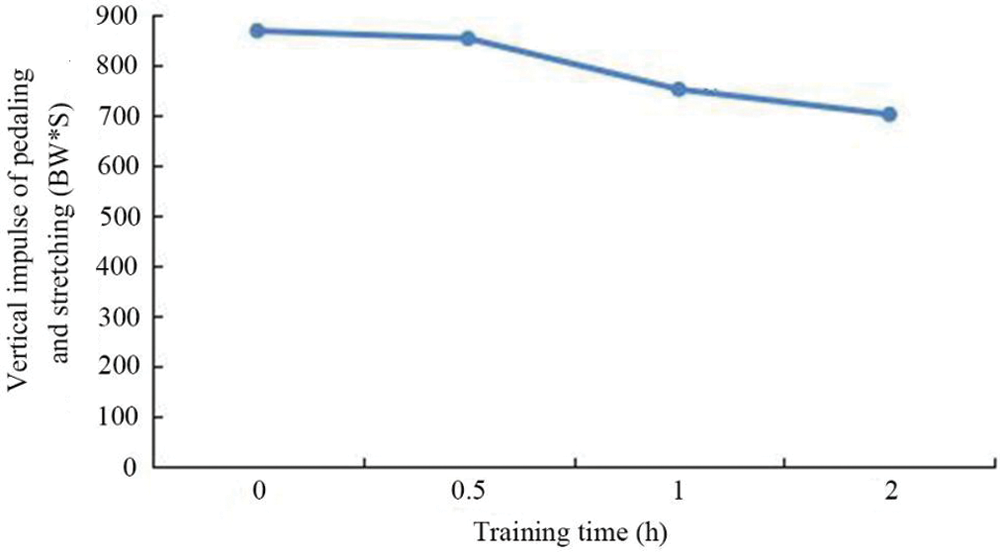
Figure 4: Changes of impulse
It was seen from Fig. 5 that the flight time decreased with the increase of training time, there was no significant difference of the flight time after 0.5 h of training and before training, the flight time after 1 h of training and 2 h of training greatly reduced compared with that in the normal state, the rising height of the center of gravity also showed a downward trend, the rising height of the center of gravity after 1 h and 2 h of training was much different from that in the normal state.
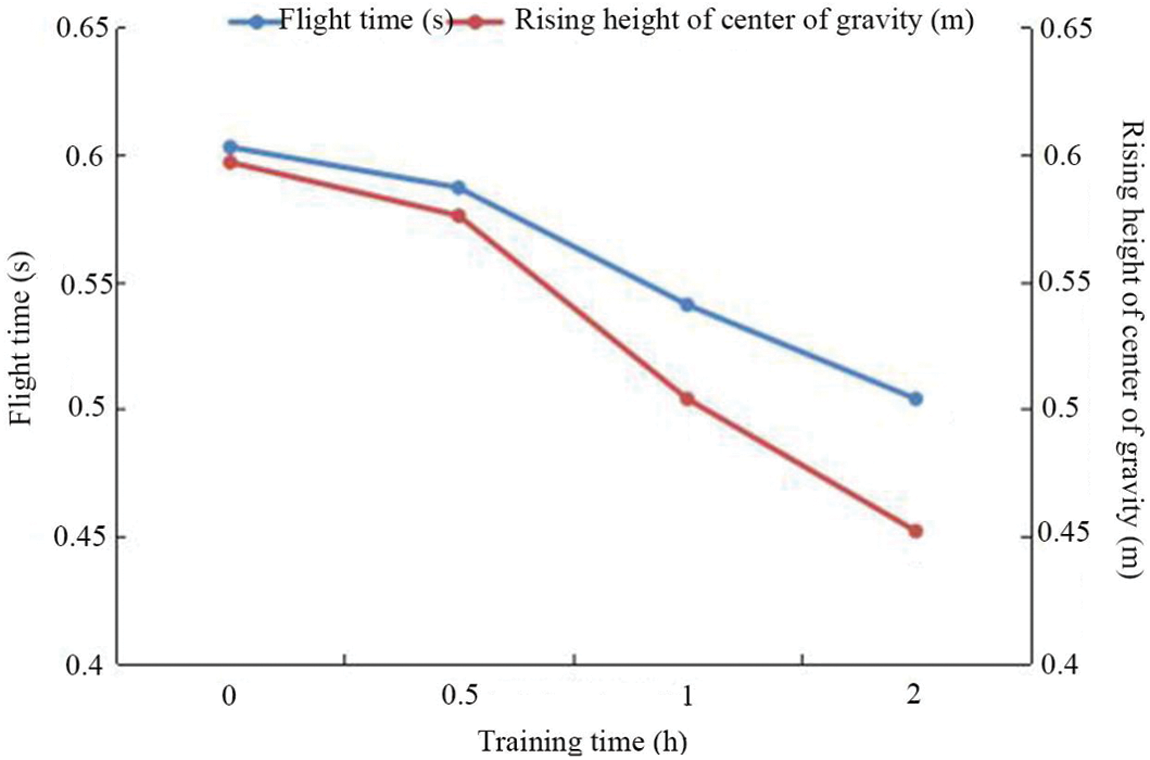
Figure 5: Changes of the flight time and rising height of center of gravity
In the landing stage, with the changes of the training time, the landing time, the angle and angular velocity of the knee joint and the angular velocity of the ankle joint at the moment of landing changed.
In combination with Tab. 5 with the increase of the training time, the landing time also increased. The landing time after 1 h and 2 h of training was longer than that without training. Angles of the hip and ankle joints had no great change, but the angle of the knee angle showed an obvious increasing tendency with the increase of the training time. After one hour of training, the angle of the knee joint reached 56.75 ± 7.69°, which was much different from that without training (50.67 ± 8.32°), and it was the same after two hours of training. Changes in the peak value of vGRF and its loading rate were small.
Table 5: Changes of indicators
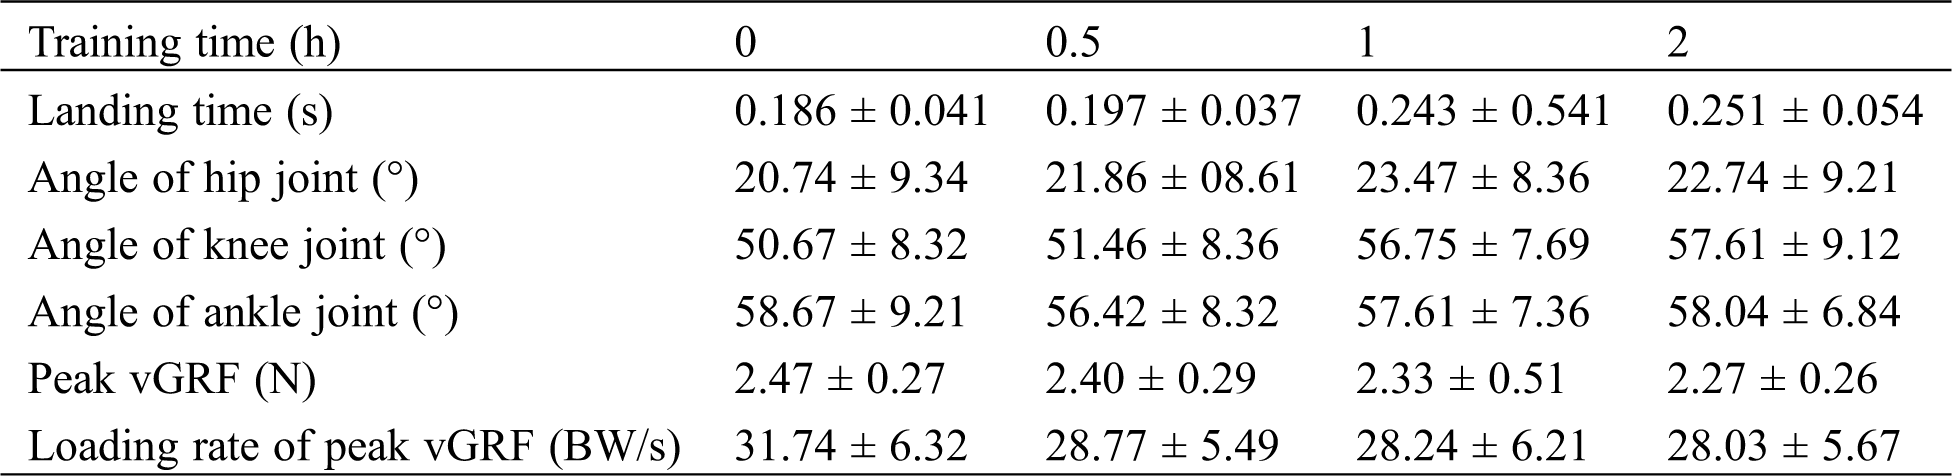
Fig. 6 shows that the flexion and extension angles of different joints at the moment of landing changed with the increase of the training time, the flexion and extension angles of the hip and knee joints decreased, the flexion and extension angle of the ankle joint increased; change in the flexion and extension angles was the largest.
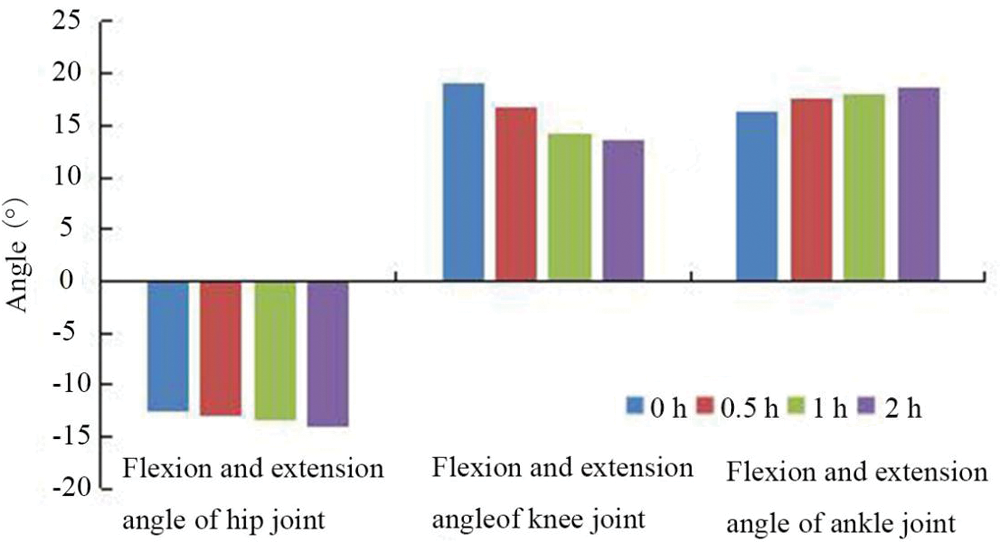
Figure 6: Changes in flexion and extension angles of different joints at the moment of double-foot landing
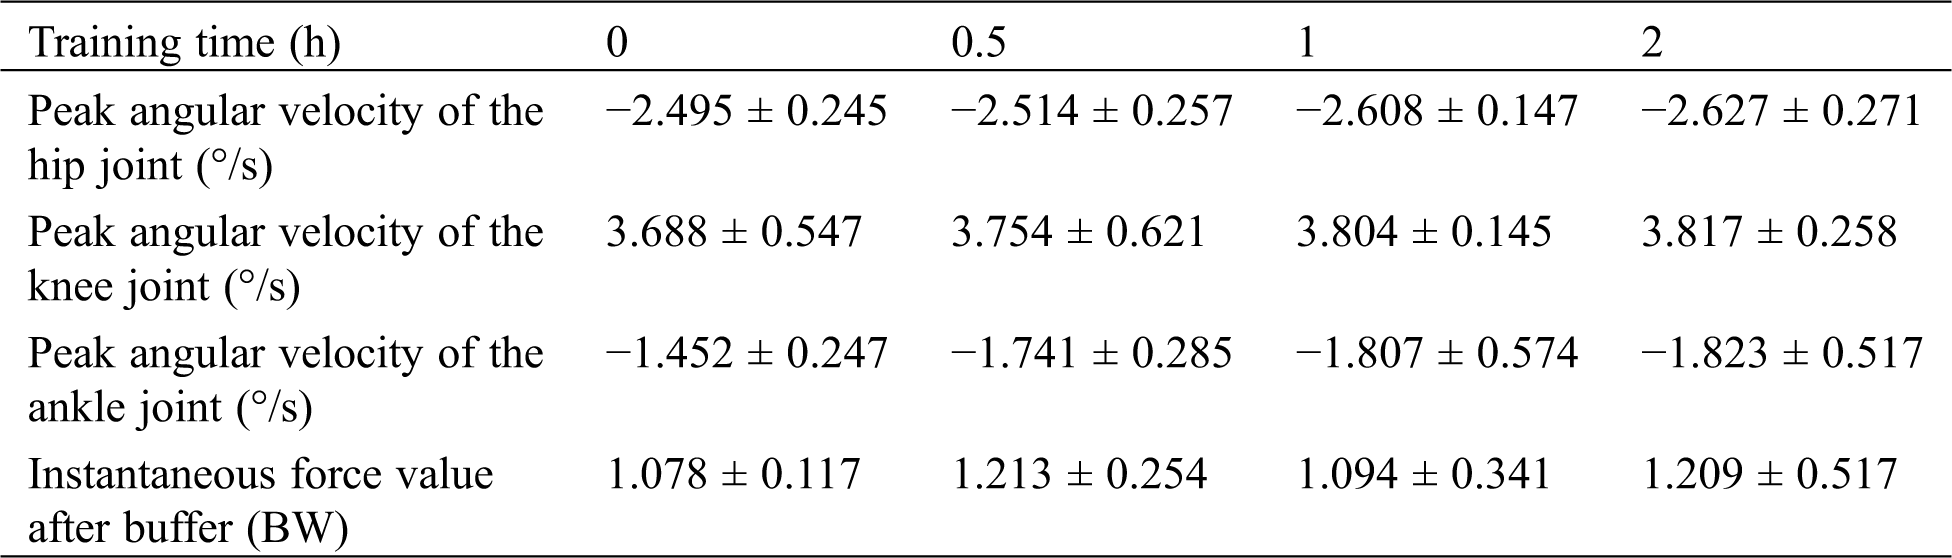
The angular velocity of different joints also changed when double feet touched the ground (Fig. 7). The angular velocity of the hip joint, knee joint and ankle joint decreased gradually with the increase of the training time, but the decrease of hip joint angular velocity was not obvious. The angular velocity of the knee joint and ankle joint after one hour and two hours of training decreased markedly compared with that without training.
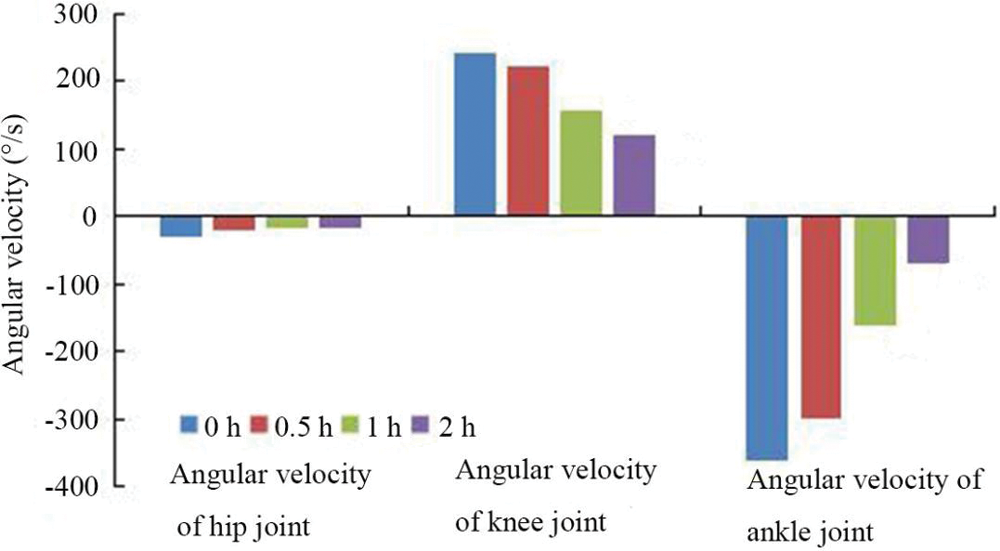
Figure 7: Changes in angular velocity of different joints at the moment of double-foot landing
The influence of the training time on height of jumping was analyzed in the aspect of sports mental fatigue. Before and after experiment, the athletes were given Athlete Burnout Questionnaire (ABQ) complied by Raedeke et al. [13]. The scale is composed of 15 items, including three subscales, physical strength exhaustion, decline of sense of achievement, and sports downplaying. There are five grades of score, 1 for never appear and 5 for always appear. The higher the score is, the more obvious the mental fatigue of athletes is. The statistical results are shown in Tab. 6.
Table 6: The statistical results of ABQ
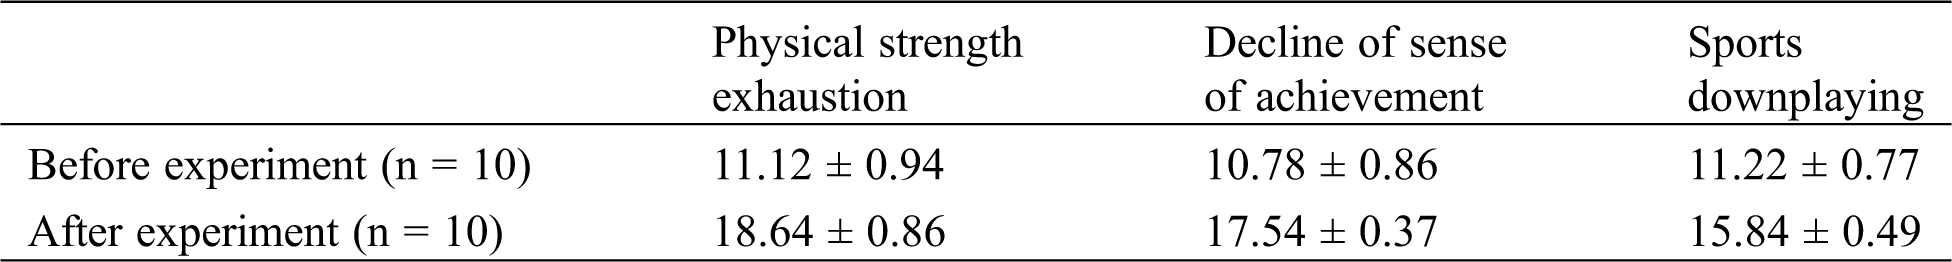
It was seen from Tab. 6 that the ABQ score of the athletes had large differences before and after experiment; before experiment, the athletes showed no mental fatigue; after a long-term training, the athletes showed different degree of mental fatigue, which might be correlated to the decline of height of jumping.
In the training process of volleyball block take-off, the athletes’ knee joints needs to move up and down, left and right, frequent take-off is needed, the range of motion is large, the speed of movement is fast, which brings a huge amount of load exercise to the knee joint. The muscle work can be divided into two kinds: concession and restraint. The former means that the muscle is controlled to stretch passively the action of gravity, and the latter means that the muscle contracts when people squat rapidly. After training, the contraction velocity may increase gradually, but after increasing to some extent, the muscle force may decrease. It was found from the analysis of biomechanical indicators that the length of the training time had a great influence on the height of jumping. The length of training time will affect the physiological mechanism of the human body, causing fatigue, so that the body can not continue to maintain the predetermined intensity of exercise. In this experiment, when the training time reached 0.5 h, the subjects have not yet reached the fatigue state. When the training time reached 1 h, the subjects had fatigue, and the biomechanical indicators of lower limbs began to change obviously. When the training time reached 2 h, the fatigue state of the subjects further deepened. The biomechanical indicators of lower limbs also had changes, as shown below.
In the buffer stage, the buffer time and the variation range of the joint angle had a great influence on height of jumping, and these indicators had great changes with the increase of the training time (p < 0.05). With the increase of the training time, the pull of lower limb muscles was insufficient, the motion of different joints became smaller, and the buffer time became shorter, thus affecting the height of jumping.
In the pedaling and stretching stage, the pedaling and stretching time decreased with the increase of the training time, which was also due to the reduction of the variation range of angles of different joints, consistent with the buffer stage. The peak angular velocity of the hip joint and knee joint also decreased with the increase of the training time. The angle and peak angular velocity of the knee joint had the greatest changes. With the increase of the training time, the reaction of lower limb muscles and nerve became slower, and moreover the contraction ability of the knee joint was greatly affected. During pedaling and stretching, the lower limbs could not sufficiently stretch due to the declined control ability, thus affecting the height of jumping.
With the increase of the training time, the landing time also increased, and the angle of the knee joint had the most prominent change. It was found that the burden of lower limbs increased with the increase of training time. When landing, better buffering effect could be achieved by enlarging the variation range of the knee joint, protecting lower limbs. With the increase of the angle of the knee joint, hamstring muscle can adjust its position, reduce the forward movement of tibia relative to femur, and reduce the possibility of ligament injury. At the moment of double-foot landing, the flexion and extension angle and angular velocity of the knee joint and the angular velocity of the ankle joint decreased markedly with the increase of the training time. In that process, quadriceps femoris tension increased, patellar tendon burden increased, and risk of ligament injury also increased.
The analysis of sports mental fatigue (Tab. 6) showed that the long-term training improved the mental fatigue level of the athletes. In the state of sports mental fatigue, the emotion, power and behaviors of athletes all changed, athletes showed negative response to sports, the training interests decreased, and the training motivation declined, which led to the decline of height of jumping during blocking.
Repeated jumping in the blocking process will cause many sports injury to volleyball players, such as patellar tendinitis, ACL injury, etc. [14,15]. ACL injury is a very serious and common sport injury for volleyball players [16]. The adductor muscle strength will be great when an athlete lands after block jump [17], and the flexion angle of the knee joint was small, increasing the risk of ACL injury [18]. Long-term continuous training will bring more pressure to joints and muscles of lower limb, and the possibility of injury will greatly increase. Long-term training also has a great impact on the height of jump. Therefore, in actual training and competition, athletes should master the time and rest properly to adjust joints and muscle state. In addition, it was found that the knee joint played a significant role in the process of block jump. Hence athletes must strengthen the protection of the knee joint, pay attention to training methods and intensity, and try to avoid knee joint injury.
Training time has a great influence on the height of jumping of volleyball block. It is found from the analysis of biomechanical data that the motion range of angles of different joints of lower limbs gradually decreased in the buffer stage with the increase of the training time, angles of different joints and the peak angular velocity and impulse of the hip and knee joints gradually decreased in the pedal and stretching stage, the flight time and rising height of center of gravity also showed a downward trend, and the angle of the knee joint during landing, the flexion and extension angle and angular velocity of the knee joint at the moment of double-foot landing and the angular velocity of the knee joint at the moment of double-foot landing changed.
Acknowledgement: This study was supported by Feasibility study on air volleyball course offered by Tianjin Chengjian University under the Concept of Health and Physical Fitness Education (Project No. JG-YBZ-1964).
Funding Statement: The author(s) received no specific funding for this study.
Conflicts of Interest: The authors declare that they have no conflicts of interest to report regarding the present study.
1. Meng, C. L., Li, Y. J. (2013). Comparative study of Chinese and foreign excellent volleyball athletes’ blocking technical and tactics. Journal of Beijing Sport University, 5, 140–144. [Google Scholar]
2. Hsu, C. C., Chen, H. T., Chou, C. L., Lee, S. Y. (2012). Spiking and blocking events detection and analysis in volleyball videos. IEEE International Conference on Multimedia and Expo, pp. 19–24. Melbourne, Australia. [Google Scholar]
3. Neves, T. J., Johnson, W. A., Myrer, J. W., Seeley, M. K. (2011). Comparison of the traditional, swing, and chicken wing volleyball blocking techniques in NCAA division I female athletes. Journal of Sports Science & Medicine, 10(3), 452–457. [Google Scholar]
4. Hughes, G., Watkins, J., Owen, N. (2010). Differences between the sexes in knee kinetics during landing from volleyball block jumps. European Journal of Sport Science, 10(1), 1–11. DOI 10.1080/17461390903108117. [Google Scholar] [CrossRef]
5. Hughes, G., Watkins, J., Owen, N. (2010). The effects of opposition and gender on knee kinematics and ground reaction force during landing from volleyball block jumps. Research Quarterly for Exercise and Sport, 81(4), 384–391. DOI 10.1080/02701367.2010.10599698. [Google Scholar] [CrossRef]
6. Ficklin, T., Lund, R., Schipper, M. (2014). A comparison of jump height, takeoff velocities, and blocking coverage in the swing and traditional volleyball blocking techniques. Journal of Sports Science & Medicine, 13(1), 78–83. [Google Scholar]
7. Zahradnik, D., Jandacka, D., Uchytil, J., Farana, R., Hamill, J. (2015). Lower extremity mechanics during landing after a volleyball block as a risk factor for anterior cruciate ligament injury. Physical Therapy in Sport, 16(1), 53–58. DOI 10.1016/j.ptsp.2014.04.003. [Google Scholar] [CrossRef]
8. Lobietti, R., Coleman, S., Pizzichillo, E., Merni, F. (2010). Landing techniques in volleyball. Journal of Sports Sciences, 28(13), 1469–1476. DOI 10.1080/02640414.2010.514278. [Google Scholar] [CrossRef]
9. Wild, C. Y., Grealish, A., Hopper, D. (2017). Lower limb and trunk biomechanics after fatigue in competitive female Irish dancers. Journal of Athletic Training, 52(7), 643–648. DOI 10.4085/1062-6050-52.3.12. [Google Scholar] [CrossRef]
10. Yu, P., Gong, Z., Meng, Y., Baker, J. S., Gu, Y. (2020). The acute influence of running-induced fatigue on the performance and biomechanics of a countermovement jump. Applied Sciences, 10(12), 4319. DOI 10.3390/app10124319. [Google Scholar] [CrossRef]
11. Zag, M., Sforza, C., Ferrario, V., Ferruccio, E., Fabio, G. (2018). Fatigue alters the biomechanics of turns while running. ISBS Proceedings Archive, 36(1), 12–15. [Google Scholar]
12. Purevsuren, T., Kwon, M. S., Park, W. M., Kim, K., Jang, S. H. et al. (2017). Fatigue injury risk in anterior cruciate ligament of target side knee during golf swing-ScienceDirect. Journal of Biomechanics, 53, 9–14. DOI 10.1016/j.jbiomech.2016.12.007. [Google Scholar] [CrossRef]
13. Raedeke, T. D., Smith, A. L. (2001). Development and preliminary validation of an athlete burnout measure. Journal of Sport & Psychology, 23, 281–306. [Google Scholar]
14. Janssen, I., Brown, N. A., Munro, B. J., Steele, J. R. (2015). Variations in jump height explain the between-sex difference in patellar tendon loading during landing. Scandinavian Journal of Medicine & Science in Sports, 25(2), 265–272. DOI 10.1111/sms.12172. [Google Scholar] [CrossRef]
15. Parsons, J. L., Alexander, M. J. L. (2012). Modifying spike jump landing biomechanics in female adolescent volleyball athletes using video and verbal feedback. Journal of Strength and Conditioning Research, 26(4), 1076–1084. DOI 10.1519/JSC.0b013e31822e5876. [Google Scholar] [CrossRef]
16. Zahradnik, D., Uchytil, J., Farana, R., Jandacka, D. (2014). Ground reaction force and valgus knee loading during landing after a block in female volleyball players. Journal of Human Kinetics, 40(1), 67–75. DOI 10.2478/hukin-2014-0008. [Google Scholar] [CrossRef]
17. Zahradnik, D., Farana, R., Uchytil, J., Jandačka, D. (2013). Effect of landing after block on valgoid load of knee in volleyball players. Rehabilitacia, 50(4), 205–213. [Google Scholar]
18. Zahradnik, D., Jandacka, D., Farana, R., Uchytil, J., Hamill, J. (2016). Identification of types of landings after blocking in volleyball associated with risk of ACL injury. European Journal of Sport Science, 17(2), 1. [Google Scholar]
 | This work is licensed under a Creative Commons Attribution 4.0 International License, which permits unrestricted use, distribution, and reproduction in any medium, provided the original work is properly cited. |