DOI: 10.32604/mcb.2021.014352
ARTICLE
Characteristics of Surface Electromyography of Forehand Smash of Badminton Players
Henan Mechanical and Electrical Vocational College, Zhengzhou, 451191, China
*Corresponding Author: Chen Zhang. Email: bizhang29456074@163.com
Received: 19 September 2020; Accepted: 23 December 2020
Abstract: To understand the characteristics of the forehand smash of badminton player and improve their performance, this study took eight badminton players as the subject, obtained the kinematics data through the Qualisys infrared high-speed camera, obtained the electromyography (EMG) data through the ME-6000 surface EMG test system, and compared and analyzed their forehand smash action. The results showed that the greater the angle and speed of different joints in the forehand smash was, the greater the speed and strength of hitting the ball was; the discharge amount of biceps brachii (BB) was the smallest, followed by triceps brachii (TB), flexor carpi ulnaris (FCU), anterior deltoid (AD), posterior deltoid (FD), and pectoralis major (PM), and the activation order was PM → AD → FD → BB → TB → FCU; deltoid muscle and pectoralis major muscle were the main muscle groups in the exercise, which showed the characteristic that trunk muscles drove arm muscles.
Keywords: Badminton; forehand smash; kinematics; surface electromyography; upper limb
Proper exercise plays a positive role in enhancing muscle strength and promoting growth and development [1]. With the development of society, sports have become more and more popular. Badminton, as a sport suitable for all ages, is short but intense [2] and can speed up blood circulation, improve endurance, and promote physical and mental health, which is widely loved by people [3]. Moreover, in competitive sports, badminton is also in continuous progress and development, and the related research on badminton is also in-depth. But most studies are about exercise-induced injury [4] and recovery [5], and the research on kinematics and muscle work is relatively limited. In sports research, kinematics research can describe the changes of body speed and angle, and surface electromyography (sEMG) research can describe the movement state of muscles [6]. The analysis of these two aspects can help understand and master sports skills, improve the competitive level of athletes, and reduce sports injury [7,8], which has been carried out in many sports [9]. Graydon et al. [10] studied the influence of ankle protectors on lower limb kinematics. Taking 12 male football players as an example, kinematics data were obtained through the motion capture system. It was found that ankle protectors could only reduce the risk of ankle contusion but could not reduce the risk of ankle varus injury. Lam et al. [11] studied the influence of the height of basketball upper on the side cutting of athletes. Through the study of 15 basketball players, it was found that shoes with high upper could reduce ankle internal and external rotation and limit the free movement of the ankle joint, but there was no negative image on sports performance. Zebis et al. [12] studied the effect of lower limb injury prevention training on reducing the risk of Anterior Cruciate Ligament (ACL) injury and selected 12 youth athletes as the subjects. Through sEMG and three-dimensional motion analysis, it was found that 12 weeks of injury prevention training changed the pattern of agonist-antagonist muscle reactivity in the process of side cutting, which had a protective effect on ACL. Silva et al. [13] studied the gait differences of running in shallow and deep water and on the land. The surface electromyography analysis showed that walking in the water had lower muscle activation than walking on the land; when running in the deep water, the muscle activation of the distal leg was low, while the activation of the thigh muscle was high. Smash is an important technique of badminton [14], which has strong attack power. This paper mainly analyzed the forehand smash action and studied kinematics and surface electromyography characteristics to understand the technical characteristics of forehand smash and provide guidance for badminton training and improve the sports performance of athletes.
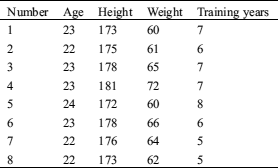
Eight male badminton players from the badminton team of Henan Mechanical and Electrical Vocational College were selected as the research subjects, and the general data of them are shown in Tab. 1. All the players were proficient in forehand smash, with the right hand as the dominant hand. They all understood the purpose and process of the experiment and signed informed consent. They had no severe exercise 24 h before the experiment and had no sports injury or disease recently. They were in good mental condition.
Forehand smash can be divided into four stages.
(1) Preparation: The badminton player leaned to the net with the right foot at the back, kept eyes on the ball, judged the landing point, bent the knee, lowered the center of gravity, and prepared to take off.
(2) Lead racket: The badminton player leaned to one side and lifted the shoulder towards the upper right side to drive the arm and lift the racket.
(3) Batting: The badminton player leaned back and chested up. The forearm swung backward, and the wrist extended backward. The badminton player swung the racket from top to the back and downward, then turned the body and kept abdomen in, and swung the forearm towards the front upper direction and swung the racket forward at a high speed. After reaching the hitting point, the badminton player rotated the forearm inward and smashed the ball by exerting force by the wrist.
(4) Landing: After the smash, the badminton player withdrew the forearm from the left front direction following the inertia and landed.
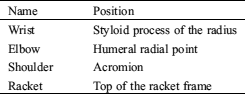
The flow of the experiment is shown in Fig. 1. The subjects were dressed in uniform and used the same racket and ball. Firstly, they warmed up for about 10 min. The process of the forehand smash was photographed by the Qualisys infrared high-speed camera [15]. The sampling frequency was 500 frames/s, and the relevant kinematics parameters were obtained using the Qualisys Track Manager software [16]. The pasting position of mark points is shown in Tab. 2. The electromyographic characteristics were collected by the ME-6000 sEMG test system made in Finland [17]. Firstly, the surface skin was cleaned with alcohol cotton, and then the body hair was shaved with a razor. After the warm-up, the skin was cleaned by the alcohol cotton again, and then the electrode slice was pasted on the right flexor carpi ulnaris (FCU), anterior deltoid (AD), posterior deltoid (FD), biceps brachii (BB), triceps brachii (TB) and pectoralis major (PM), as shown in Fig. 2. The synchronization of the two systems was realized by the synchro signal lamp. The experimental personnel was responsible for the pasting of mark points and electrode slide. A player fed the ball on the other side of the field, and the subject did the standard forehand smash. Each subject did the action three times.

Figure 1: The experimental process
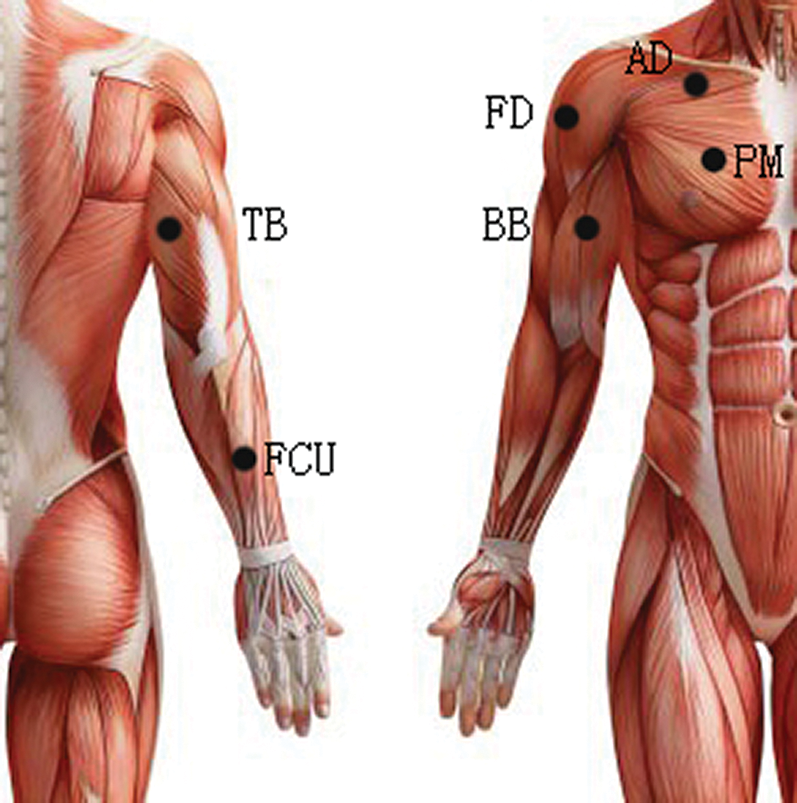
Figure 2: The pasting position of electrode slices
Table 2: Pasting positions of mark points
The kinematic data were processed in the Qualisys Track Manager software. The EMG data were processed in the Mega Win 6000 system [18]. Then the data were sorted and analyzed in Excel.
The maximum ball speed of eight players in the forehand smash process is shown in Fig. 3.
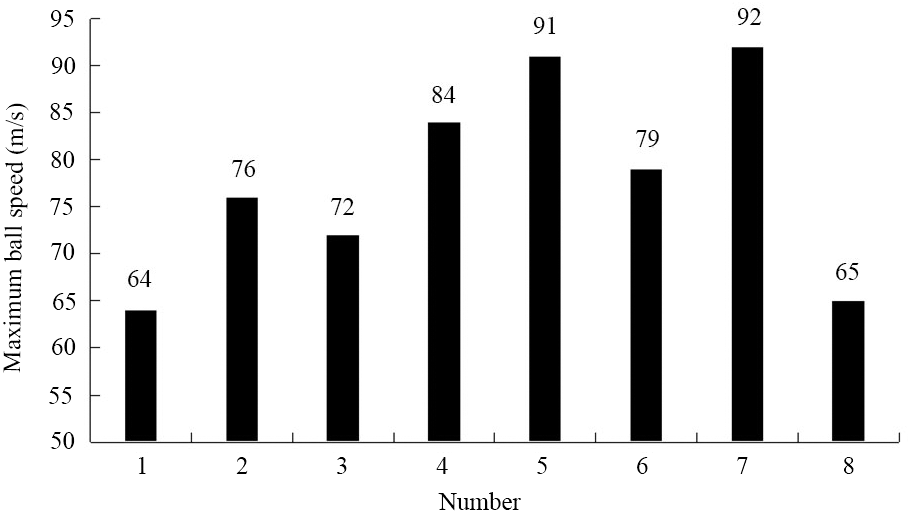
Figure 3: Comparison of the maximum ball speed
It was seen from Fig. 3 that there were some differences in the maximum ball speed; the maximum ball speed of No. 5 and No. 7 players was 91 m/s and 92 m/s respectively, which indicated that the smashing effect of these two players was good, and that of No. 1 and No. 8 players was 64 m/s and 65 m/s respectively, indicating that the smashing effect of these two players was relatively poor; the average maximum ball speed of players was 78 m/s.
The joint angles of the upper limbs of the eight players at the moment of hitting are shown in Tab. 3.
Table 3: Comparison of joint angles of upper limbs (unit: °)
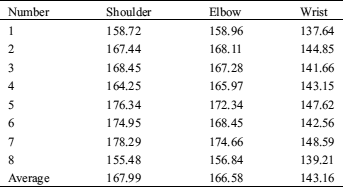
It was seen from Tab. 3 that the average angles of the shoulder, elbow, and wrist of players were 167.99°, 166.58°, and 143.16° respectively, at the moment of hitting; the maximum and minimum angles of the shoulder joint were 178.29° and 155.48° respectively, the maximum and minimum angles of the elbow joint angle was 174.66° and 156.84° respectively, and the maximum and minimum angles of the wrist joint was 148.59° and 137.64° respectively. The smashing effect of different subjects demonstrated that the greater the angles of different joints of the upper limbs were, the better the smashing effect was, and the higher the ball speed was.
At the moment of hitting the ball, the speed of different joints of the upper limbs was compared, as shown in Tab. 4.
Table 4: Comparison of the speed of different joints of upper limbs (unit: m/s)
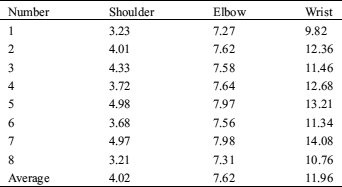
It was seen from Tab. 4 that the average speed of the shoulder, elbow and wrist was 4.20 m/s, 7.62 m/s, and 11.93 m/s respectively at the moment of hitting the ball, reflecting the characteristics of whipping, i.e., the shoulder joint as the starting point drove the acceleration of the elbow and wrist joints in turn to affect the final hitting speed. The comparison suggested that the joint speed of No. 5 and No. 7 athletes was relatively large; the speed of the shoulder, elbow, and wrist of No. 5 athlete was 4.98 m/s, 7.97 m/s, and 13.21 m/s respectively, and the speed of the shoulder, elbow, and wrist of No. 7 athlete was 4.97 m/s, 7.98 m/s, and 14.08 m/s respectively, which made the speed at the hitting moment very high and improved the speed and strength of smash.
In conclusion, to obtain a better smashing effect, in the training process, athletes should relax the upper limb joints better, fully extend the joints, and increase the joint twist angle to improve the joint speed, ensure smooth movements, and obtain a high hitting speed.
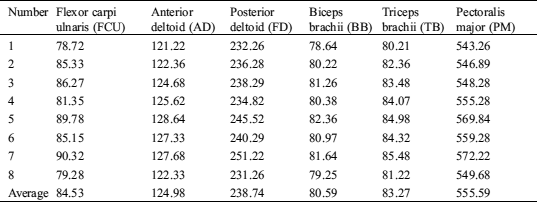
The average value of muscle discharge of athletes is shown in Tab. 5.
Table 5: Comparison of average EMG values (unit: μV)
The contribution rate of different muscles is shown in Fig. 4.
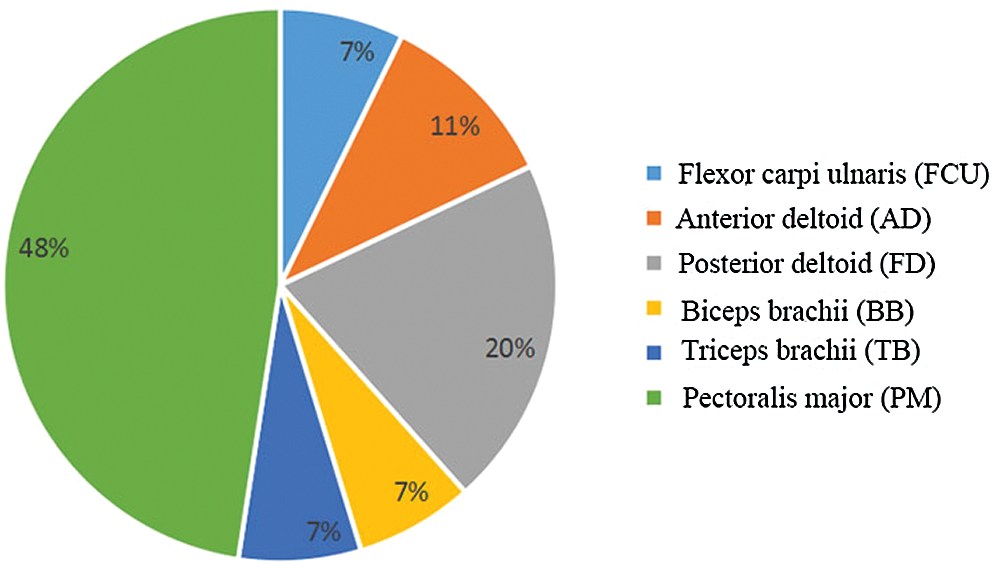
Figure 4: The contribution rate of different muscles
The average value of EMG can indicate the muscle activity, and the larger the value is, the more active the muscle is. It was seen from Tab. 5 that the discharge of BB from small to large was TB, FCU, AD, FD, and PM; the discharge of BB was the smallest, 80.59 μV, and the discharge of PM was the largest, 555.59 μV. In addition, the comparison between athletes demonstrated that the greater the EMG value was, the better the performance was (Nos. 5 and 7). It was seen from Fig. 4 that the contribution rate of PM was the highest (48%), followed by PD (20%) and AD (11%), indicating that deltoid muscles and PM played the main role and were the main muscle groups generating power. Therefore, to improve sports performance, the training of deltoid muscles and PM should be strengthened.
The power generation order of different muscles in the process of smashing was analyzed, and the results are shown in Tab. 6.
Table 6: Muscle activation time (unit: ms)
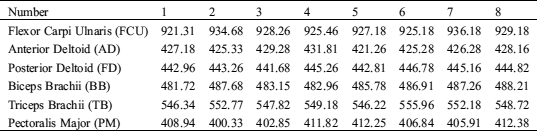
The average activation time of muscles is shown in Fig. 5.
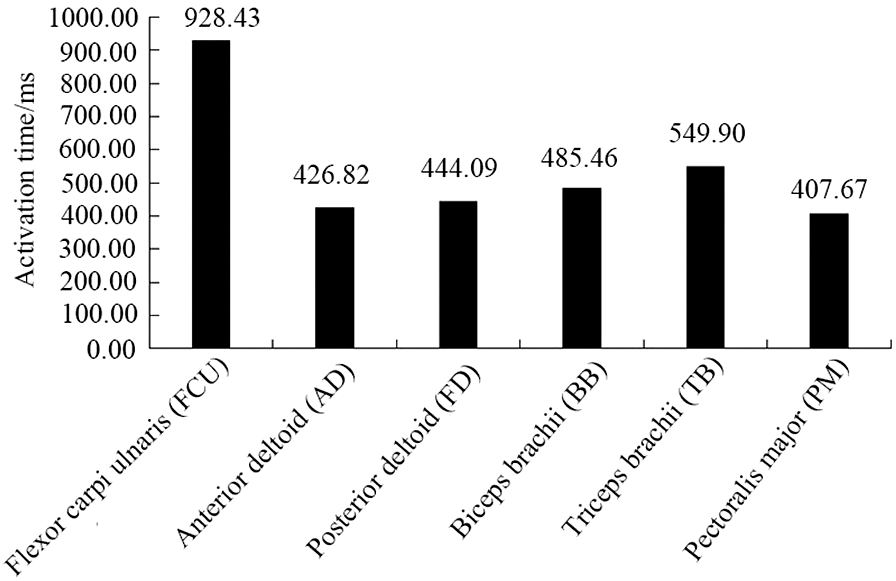
Figure 5: Muscle activation sequence
It was seen from Fig. 5 that the activation order of different muscles was PM → AD → FD → BB → TB → FCU. It was found that forehand smash started from the activation of the trunk muscle, and the trunk muscle stretched first and then drove the arm muscle to provide energy for completing the action of whipping. Based on the kinematic characteristics, it was found that the muscle activity of athletes also showed the characteristic that the large joint drove the small joint, which was coordinated with the action of the human body.
This study mainly analyzed the characteristics of the forehand smash of badminton athletes. It was found that:
(1) The average maximum ball speed was 78 m/s, the maximum was 92 m/s, and the minimum was 64 m/s;
(2) The average angles of the shoulder, elbow, and wrist were 167.99°, 166.58°, and 143.16°, respectively;
(3) The average speeds of the shoulder, elbow, and wrist were 4.20 m/s, 7.62 m/s, and 11.93 m/s, respectively;
(4) Deltoid and PM had the highest average EMG value and the largest contribution rate, i.e., they were the main muscle groups in the smashing process; therefore, the training of deltoid and PM should be strengthened;
(5) The activation of muscle started from the trunk muscle, and the trunk muscle drove the arm muscle to complete the action of whipping.
Funding Statement: The author received no specific funding for this study.
Conflicts of Interest: The author declares that he has no conflicts of interest to report regarding the present study.
1. Dube, S., Mungal, S., Kulkarni, M. (2015). Simple visual reaction time in badminton players: A comparative study. National Journal of Physiology, Pharmacy and Pharmacology, 5(1), 18–20. DOI 10.5455/njppp.2015.5.080720141. [Google Scholar] [CrossRef]
2. Phomsoupha, M., Laffaye, G. (2015). The science of badminton: Game characteristics, anthropometry, physiology, visual fitness and biomechanics. Sports Medicine, 45(4), 473–495. DOI 10.1007/s40279-014-0287-2. [Google Scholar] [CrossRef]
3. Arora, M., Shetty, S. H., Khedekar, R. G., Kale, S. (2015). Over half of badminton players suffer from shoulder pain: Is impingement to blame? Journal of Arthroscopy & Joint Surgery, 2(1), 33–36. DOI 10.1016/j.jajs.2014.12.006. [Google Scholar] [CrossRef]
4. Park, J., Lee, Y. H., Kong, I. D., Park, T. J., Chang, J. S. et al. (2017). Ultrasonographic changes of upper extremity tendons in recreational badminton players: The effect of hand dominance and comparison with clinical findings. British Journal of Sports Medicine, 51(4), 370. DOI 10.1136/bjsports-2016-097372.219. [Google Scholar] [CrossRef]
5. Chen, B., Mok, D., Lee, W. C. C., Lam, G. W. K. (2015). High-intensity stepwise conditioning programme for improved exercise responses and agility performance of a badminton player with knee pain. Physical Therapy in Sport: Official Journal of the Association of Chartered Physiotherapists in Sports Medicine, 16(1), 80–85. DOI 10.1016/j.ptsp.2014.06.005. [Google Scholar] [CrossRef]
6. Bingham, A., Arjunan, S. P., Jelfs, B., Kumar, D. (2017). Normalised mutual information of high-density surface electromyography during muscle fatigue. Entropy, 19(12), 697. DOI 10.3390/e19120697. [Google Scholar] [CrossRef]
7. Tsai, Y. J., Huang, Y. C., Chen, Y. L., Hsu, Y. W., Kuo, Y. L. (2020). A pilot study of hip corrective taping using kinesio tape for pain and lower extremity joint kinematics in basketball players with patellofemoral pain. Journal of Pain Research, 13, 1497–1503. DOI 10.2147/JPR.S256466. [Google Scholar] [CrossRef]
8. Koga, H., Nakamae, A., Shima, Y., Bahr, R., Krosshaug, T. (2018). Hip and Ankle kinematics in noncontact anterior cruciate ligament injury situations: Video analysis using model-based image matching. American Journal of Sports Medicine, 46(2), 333–340. DOI 10.1177/0363546517732750. [Google Scholar] [CrossRef]
9. Vigotsky, A. D., Halperin, I., Lehman, G. J., Trajano, G. S., Vieira, T. M. (2018). Interpreting signal amplitudes in surface electromyography studies in sport and rehabilitation sciences. Frontiers in Physiology, 8, 459. DOI 10.3389/fphys.2017.00985. [Google Scholar] [CrossRef]
10. Graydon, R., Fewtrell, D., Atkins, S., Sinclair, J. (2017). The effects of ankle protectors on lower limb kinematics in male football players. A comparison to braced and unbraced ankles. Equine and Comparative Exercise Physiology, 13(4), 251–258. DOI 10.3920/CEP160031. [Google Scholar] [CrossRef]
11. Lam, G. W. K., Park, E. J., Lee, K. K., Cheung, J. T. M. (2015). Shoe collar height effect on athletic performance, ankle joint kinematics and kinetics during unanticipated maximum-effort side-cutting performance. Journal of Sports Sciences, 33(16), 1738–1749. DOI 10.1080/02640414.2015.1011206. [Google Scholar] [CrossRef]
12. Zebis, M. K., Andersen, L. L., Brandt, M., Myklebust, G., Bencke, J. et al. (2016). Effects of evidence-based prevention training on neuromuscular and biomechanical risk factors for ACL injury in adolescent female athletes: A randomised controlled trial. British Journal of Sports Medicine, 50(9), 552–557. DOI 10.1136/bjsports-2015-094776. [Google Scholar] [CrossRef]
13. Silva, M. F., Dias, J. M., Bela, L. F. D., Pelegrinelli, A. R. M., Lima, T. B. et al. (2020). A review on muscle activation behaviour during gait in shallow water and deep-water running and surface electromyography procedures. Journal of Bodywork and Movement Therapies, 24(4), 432–441. DOI 10.1016/j.jbmt.2020.06.005. [Google Scholar] [CrossRef]
14. Li, S., Zhang, Z., Wan, B., Shan, G. (2016). The relevance of body positioning and its training effect on badminton smash. Journal of Sports Sciences, 35(4), 1–7. [Google Scholar]
15. Trinh, T. X., Heinke, S., Rode, C., Schenkl, S., Hubig, M. et al. (2017). Maximum striking velocities in strikes with steel rods-the influence of rod length, rod mass and volunteer parameters. International Journal of Legal Medicine, 132(6), 1–10. [Google Scholar]
16. Mänttäri, A. T., Suni, J. H., Sievänen, H., Husu, P., Vähä-Ypyä, H. et al. (2018). Six-minute walk test a tool for predicting maximal aerobic power (VO max) in healthy adults. Clinical Physiology and Functional Imaging, 38(1), 1–3. DOI 10.1111/cpf.12394. [Google Scholar] [CrossRef]
17. Lisón-Párraga, J. F., Biviá-Roig, G., Rubio-López, A. C., Pascual-Millán, F., Riveiro-Ferreira, N. et al. (2010). Efectos del estiramiento isquiotibial sobre el patrón de activación muscular del erector spinae durante la flexoextensión de tronco. Fisioterapia, 32(4), 165–171. DOI 10.1016/j.ft.2010.01.002. [Google Scholar] [CrossRef]
18. Anbarian, M., Jafarnezhad, A. A. (2015). Knee malalignment influences the electromyographic activity of selected lower limb muscles during gait in boy adolescents. Gait & Posture, 42, S39–S40. DOI 10.1016/j.gaitpost.2015.06.077. [Google Scholar] [CrossRef]
 | This work is licensed under a Creative Commons Attribution 4.0 International License, which permits unrestricted use, distribution, and reproduction in any medium, provided the original work is properly cited. |