| Journal of Renewable Materials |
DOI: 10.32604/jrm.2021.012744
ARTICLE
Study on Carbonation Damage Constitutive Curve and Microscopic Damage Mechanism of Tailing Recycled Concrete
1College of Urban, Rural Planning and Architectural Engineering, Shangluo University, Shangluo, 726000, China
2School of Civil Engineering, Xi’an University of Architecture and Technology, Xi’an, 710055, China
3Key Laboratory of Structure Engineering and Earthquake Resistance, Ministry of Education (XAUAT), Xi’an University of Architecture and Technology, Xi’an, 710055, China
4College of Architecture Engineering, Huanghuai University, Zhumadian, 463000, China
5China Construction Third Engineering Bureau Green Industry Investment Co., Ltd., Wuhan, 430070, China
*Corresponding Authors: Tao Li. Email: litao623114@126.com; Fan Xu. Email: xufanxf1205@163.com
Received: 11 July 2020; Accepted: 26 January 2021
Abstract: To improve the resource utilization of recycled aggregate concrete (RAC) and make use of the unique pozzolanic activation characteristics of iron ore tailing (IOT), the constitutive curves of tailing recycled concrete (TRC) before and after carbonization were analyzed theoretically, experimentally and microscopically. Firstly, according to the experimental data, the damage constitutive and related damage parameters of TRC were theoretically established by Weibull probability distribution function. Secondly, the comprehensive damage parameter b under different working conditions was studied. Finally, the damage mechanism was formed by EDS and SEM. The results showed that the damage constitutive model based on Weibull probability distribution function was in good agreement with the experimental results. Under each carbonization period, the b first decreased and then rose with the increase of tailings content. When its content was 30%, the b values of TRC were minimized, which were 22.14%, 20.99%, 25.39% lower than those of NAC, and 41.09%, 34.89%, 35.44% lower than those of RAC, indicating that IOT had a relatively good optimization effect on the constitutive curve of RAC. The microscopic analysis results also proved that the IOT addition with a proper amount would improve the matrix structure of RAC and increased its compactness, but when the content was higher, it would also cause harmful cracks in its matrix structure and reduced its density. Therefore, the optimal tailing content was about 30%. This paper provided a new method for damage constitutive calculation and analysis of TRC before and after carbonization.
Keywords: Tailings; recycled concrete; carbonation; damage constitution; damage mechanism
As a residual waste after ore separation from concentrate, the tailings are also known as a misplaced resource [1,2]. In 2015, the tailings utilization rate was only 28.9% in China, far lower than that of 60% in developed countries [1]. Therefore, in recent years, it is the focus of experts and scholars to make tailings concrete. Fernando et al. [3] replaced fine aggregate in concrete with tailings. Through the micro and macro tests, the porosity, particle size distribution and compressive strength of related concrete were studied, whose results showed that the mechanical properties could be increased by adding appropriate tailings content. Shettima et al. [4] proved that the tailings had pozzolanic activity, and the bigger compressive and splitting tensile strength, modulus of elasticity and durability value could be obtained by replacing fine aggregate. Elinwa et al. [5] showed that the compressive strength could also be increased by replacing part of cement with tailings. Xu et al. [6,7] prepared TRC by replacing fine aggregate with tailings, and systematically studied its mechanical properties and durability. Lv et al. [1] summarized tailings as raw materials of cement and concrete, and also put forward suggestions on the existing problems and future reuse direction.
At the same time, the rapid expansion of urban scale also caused the accumulation of construction wastes. However, its recycling rate in China is also less than 20%, far lower than 95% in developed countries. In view of the increasing concrete amount, it is an effective way to replace coarse aggregate to prepare RAC, which owns obvious environmental, social and economic benefit [8]. Bidabadi et al. [9] designed the best mix proportion of RAC considering the environmental and economic aspects, and proved that the fiber addition could effectively improve its tensile and flexural strength. Bahrami et al. [10] studied the rheological, mechanical and microstructure properties of self-compacting concrete with different proportions of recycled fine and coarse aggregate, indicating that the content of recycled fine aggregate should be limited to 25% in practice. Xiao et al. [11–14] had carried out a series of tests and theoretical studies on RAC, and had made great contributions to the development of RAC technology in China. But at present, due to the existence of recycled aggregate residual mortar, RAC still had some defects, such as high porosity, poor mechanical properties and durability [15,16].
Therefore, a new type of green concrete-TRC came into being at the present stage, which had been rarely researched by scholars. Moon et al. [17] applied molybdenum tailings as an admixture to adjust the fluidity and viscosity of high-flowing concrete to achieve the purpose compressive strength. Shetty et al. [18] synthesized concrete gravel using iron tailings and red mud, then studied its related properties. Yaragal et al. [19] mixed recycled aggregate with IOT to prepare mortar and concrete, and proved that it could completely replace natural fine aggregate with good performance. Throughout the existing literatures, there was still a lack of systematic descriptions on TRC, whose constitutive curve after carbonization and microscopic damage mechanism were even rarer.
Related literatures [20–23] showed that micro-cracks inside materials and its plastic yielding flow were the main energy dissipation mechanisms for the non-linearity of concrete materials. The development of micro-cracks led to the strain softening and stiffness reduction, while a plastic flow caused the irreversible deformation. Based on the continuum mechanics theory, the damage evolution factor was used to reflect the irreversible damage internal evolution process. That was to say, the establishment of damage-based constitutive model had become the key research object of scholars. At the same time, due to the heterogeneity of concrete materials at the meso-level and the randomness of aggregate distribution, the dispersion of its test results also existed. The Weibull probability distribution could fully reflect the development of defects and damage inside materials, which was widely used in the reliability field of materials, machinery, and chemical industry [24]. Nguyen et al. [25] and Rahman et al. [26], respectively used the Weibull distribution function to analyze the constitutive curves of fiber and asphalt concrete. Bai et al. [22] and Zhang et al. [23] used Weibull function to simulate the constitutive properties of sulfate-eroded concrete and polypropylene fiber recycled concrete respectively, and the results showed that the model could well reflect the mechanical characteristics of cement-based materials.
Based on this, the damage constitutive curves of TRC before and after carbonization were analyzed by Weibull probability density function. At the same time, their damage degradation mechanism was studied microcosmically by EDS and SEM, which provided a theoretical reference for promoting the wide application of TRC.
2 Damage Constitutive Theory of Concrete
Based on the quasi-brittle and meso-heterogeneous mechanical properties of concrete, the Weibull probability density function is selected to simulate the stress-strain curve of TRC. According to the strain equivalence principle proposed by the French scholar Lemaitre [27–29], the damage is caused by effective stress to affect the strain behavior of materials. That is to say, the strain produced by nominal stress acting on damaged materials is equal to that produced by effective force acting on damaged material, whose hypothesis can be expressed as follows:
where,
Combining the relationship between effective stress and Cauchy stress, it is concluded that:
where,
Substituting Eq. (2) into Eq. (1), the damage constitutive equation of damaged materials can be obtained as follows:
As can be seen from the above formulas, when
In order to apply Weibull probability distribution theory, the following assumptions need to be made:
1. TRC is macroscopically isotropic, and the damage develops equivalently in all directions;
2. The concrete can be considered to innumerable tiny elements macroscopically as a combination, each of which contains random distribution of small defects and cracks.
Based on the above two assumptions, if any element in concrete is selected, its density and strain obey the Weibull distribution, its probability density function is as follows:
where, a and b are damage parameters related to its physical and mechanical properties.
At the same time, D owns a physical quantity to characterize the damage degree of materials, which is related to the number of defects affecting the strength of micro-elements directly. The damage factor D and the micro-element ε obey the statistical law as below:
Combining Eqs. (4) and (5), and integrated the scores:
By substituting Eq. (6) into Eq. (1), it can be obtained that:
And the derivative of strain ε can be obtained as below:
Then the boundary conditions at the peak strain are used:
Taking the natural logarithm twice on both sides of the above equation:
Simultaneously, by substituting
Then, the deformation is available:
Combining Eqs. (10)–(12), the relevant damage parameters can be obtained as follows:
By substituting Eqs. (13) into (6) and (3), the damage factor and constitutive equation of TRC are obtained as follows:
Guo et al. [31] made a thorough study on the constitutive law of NAC, whose research results showed that the constitutive curve of cement-based materials also needed to meet the following conditions: (a) σ = 0, ε = 0; (b) ε = 0, dσ/dε = E; (c) ε = εmax, σ = σmax; (d) ε = εmax, dσ/dε =0. The following is to verify the applicability of the above damage constitutive law.
Derivation of the above equation can be obtained:
Available from the Eqs. (15) and (16), the condition (1) and condition (2) are respectively satisfied. Let Eq. (16) equal to 0, then we can get:
Due to
For the research convenience, taking
In the initial loading stage, subjective and objective factors cause large fluctuations of E and
Fig. 1 demonstrates the physical meaning of D0. Point B and OC are the peak point and the on-line secant modulus, while θ is the angle between OC and the horizontal axis. As can be seen from the above figure, D0 can also be expressed as:

Figure 1: Schematic diagram of D0
The figure area surrounding the constitutive curve and the coordinate axis represents the energy dissipation capacity of the specimen in a certain state. The larger the area is, the stronger the energy dissipation capacity is [32,33]. Thus, it can be approximated that D0 makes the damage factor at the peak state, which can directly reflect the overall energy dissipation capacity of its rising section under different conditions. It can be obtained as follows:
Therefore, the ultimate equation of the damage constitutive curve and damage factor are:
3 Equations and Mathematical Expressions
From the above analysis, it showed that the damage constitutive equation and the value of D was only related to the elastic modulus, peak stress and peak strain of the materials. So the corresponding damage constitutive curve could be obtained by the relevant physical quantities measured by the experiment. Combining Eqs. (13) and (22), it could be seen that b is also a comprehensive reflection of the three basic physical quantities. From Eq. (21), D0 gradually decreases as b increases, but the attenuation amplitude decreases slowly. Besides, it also illustrates that when b is smaller, the energy consumption capacity of the rising section is stronger, and its influence on damage curve and damage factor is shown in Fig. 2.

Figure 2: Influence of damage coefficient b on damage curve and damage factor (a) Damage curve (b) Damage factor
From the above figures, when b is small, the ascending part of the damage constitutive curve is steeper, while the descending part is relatively flat, and the area around the curve and the horizontal axis is larger, which indicates that the energy dissipation capacity is also better. As b increases, the curve gradually closes and the descending section changes faster, indicating that the concrete with lower ductility and energy consumption. Combined Eq. (3), it shows that when the ε/εmax is smaller or larger, the damage factors show a relatively gentle growth trend on the whole, and the damage factor increases in the middle stage. The larger the b is, the shorter the damage section is, which indicates that the process from the initial damage to the completion is shorter, the energy consumption is poorer, and the concrete presents obvious brittleness.
In the test, Qinling Portland cement (P.O. 42.5) was adopted with its water requirement for normal consistency, Fineness modulus, Initial setting and Final setting time being correspondingly 28%, 2.8 min, 160 min and 280 min. The coarse aggregate, including natural coarse aggregates (NCA) and recycled coarse aggregates (RCA), were common materials in the market with the size of 5 mm–20 mm and continuous gradation. NCA was artificial gravel, while RCA being in service for nearly 30 years was produced by a company in Xi’an, whose matrix strength of NCA was C30 and its old mortar content of RCA remained vary from 8.2% to 14.36%. In addition, RCA used in the experiment was manufactured after a series of procedures. The IOT used were from a tailings pond in Shangluo City. Then, its main physical indicators were measured in experiment through screening, drying, bagging and other procedures. The particle gradation diagrams of main materials meeting the requirements of relevant Chinese specifications were presented in Tabs. 1 and 2. To facilitate micro-analysis, the elements were determined by EDS, which was given in Fig. 3. The performance indicators of major aggregates were listed in Fig. 4.

Figure 3: Energy spectrum analysis (a) Cement (b) IOT

Figure 4: Performance indicators of major aggregates
Table 1: Cumulative sieve residue of coarse aggregate

Table 2: Cumulative sieve residue of fine aggregate

To facilitate analysis, the replacement rate of RCA was selected as 30% [34,35]. Then, considering the different tailings substitutions, the 9 TRC mixings were designed according to the requirements of the specification [36–38]. To facilitate the later comparative analysis, the water-cement ratio and sand ratio were selected as 0.4 and 0.35, respectively. During the test, the RCA and NCA, sand and IOT were mixed evenly, and then the concrete components were put into the concrete mixer in the order of coarse aggregate, cement, fine aggregate and water with lasting for 4–5 min. After the test and adjustment of mixing proportion, the design under various working conditions was obtained.
In the atmospheric environment, it also contains about 0.03% CO2 gas, and 0.05% in industrial and densely populated areas [39]. With the acceleration of fuel combustion, cement processing and industrialization, the concentration of CO2 has increased from 310 μmol/mol in 1960 to 400 μmol/mol. According to the United Nations Intergovernmental Panel on climate change (IPCC), it will exceed 800 μmol/mol by the end of the 21st century [40]. The rise concentration of CO2 has brought a series of major problems related to the national livelihood, and the carbonation of concrete is a key problem to be solved.
The stress-strain curves of nine group specimens before and after carbonization were carried out in TH-W rapid carbonization box, and the carbonation process was shown in Tab. 3, which was also implemented in accordance with the code requirements [30,41]. Then, the test was measured by a 1000 kN microcomputer-controlled testing machine and the MTI-3D non-contact strain measuring system in the same step.
Table 3: Carbonization test process and parameter setting

5 Experimental Damage Constitutive Curve Analysis
5.1 Experiment Constitutive Curve
In the test process, the failure modes under various working conditions were observed and analyzed. When the tailings content was high, the typical shear failure occurred due to the diagonal cracks. Through the experimental phenomenon, it also could be observed that the longer the carbonization cycle was, the higher the tailings content was, the more quick the formation of main cracks were, and the more concrete that fell off after the failure was, the more obvious the brittleness of the test block was. Then, the measured stress-strain curves under different carbonization cycles (0 d, 28 d, 90 d) could be obtained, as shown in Fig. 5.

Figure 5: Typical failure modes of specimen after different carbonization cycle. Adapted with permission from Refs.7, © Copyright 2020, Journal of Cleaner Production; © Copyright 2020, Elsevier (a) 0 days (NAC) (b) 90 days (NAC) (c) 0 days (RAC-8) (d) 90 days (RAC-8)
Generally speaking, the stress-strain constitutive curves of TRC had a similar trend to that of NAC. It was to say, it owned obvious ascending and descending sections with the single peak curve. Intuitively, with the increase of carbonization cycle, the performance difference of RAC with different tailing content decreased, in other words, the dispersion of ascending and descending sections become smaller. For example, the slope of descending sections tended to be the same under different tailing contents, whose results were similar to those using high silicon materials to RAC in the paper of Wang et al. [42].
5.2 Establishment of Damage Constitutive Curve Model
Usually, to reduce the contact effect between the test block and the press steel plate being leakiness, a preload was applied before the formal loading, but in the existing specifications, the detailed magnitude of the preload is not given, so the preload of about 1% is applied in this test. Due to insufficient preload, some blocks have negative stiffness at the initial stage. In order to maintain the authenticity of the test results, the negative stiffness was not deleted in the later stage, as shown in Figs. 6 and 7.

Figure 6: Damage constitutive fitting correlation curve of NAC (0 d) (a) Damage constitutive curve (b) Correlation coefficient (c) Conventional residual (d) Damage factor curve

Figure 7: Damage curve and correlation coefficient of TRC (0d) (a) RAC-1 (b) RAC-2 (c) RAC-3 (d) RAC-4 (e) RAC-5 (f) RAC-6 (g) RAC-7 (h) RAC-8
The damage constitutive model obtained in Section 1 was used to simulate and analyze the experimental results. Due to the influence of some uncontrollable factors such as the concrete discreteness in the experiment process, the one in a group with the fullest and most consistent on the theoretical stress-strain characteristics was selected as the research object. Taking NAC as an example, the fitting curve related to the damage constitutive was shown in Fig. 6.
Except for the maximum deviation of some points being close to 30% in the descending section, it could be clearly seen from the above figures that a small deviation of all other points were within ±5% on the whole. Similarly, the damage curves and correlation coefficients of remaining specimens (0 d, 28 d, 90 d) could be obtained. In a signed section, the typical stress-strain damage curves and correlation coefficients of carbonization for 0 d were selected as representatives, as shown in Fig. 7. By the substitution of experimental measured values, a, b, D0 and their correlation coefficients were shown in Tab. 4.
Table 4: Parameters of damage constitutive model under different carbonization ages

As shown in Fig. 8, it could be seen that both the parameters of b and D0 showed obvious changes. Owing to the influence of objective factors, the

Figure 8: Variation of constitutive curve related parameters (a) a (b) b (c) D0
Under the same carbonation cycle, different tailing contents also caused regular changes with b and D0 parameters, whose influence rule on b parameters were shown in Fig. 9. According to the figure, the tailing content made the b decrease first and then rise. That was to say, the energy consumption performance of TRC was first strengthened, and then decreased. When the tailing content lied between 20% and 70%, the energy dissipation performance of RAC was better than that of NAC (below the red dotted line in the figure). When the tailing content was 30%, the b values of each carbonation cycle (0d, 28d, 90d) were 2.91, 2.77 and 2.64, respectively, which were 22.14%, 20.99% and 25.39% lower than that of NAC, and 41.09%, 34.89%, 35.44% lower than that of RAC. It could be seen that an appropriate tailing amount could reduce b value by a large margin, even if the overall performance of the test block became better. Presently, the energy dissipation performance of the concrete reached the strongest under the current carbonization period.

Figure 9: Curve fitting of damage parameter b under different carbonization cycle (a) 0 d (b) 28 d (c) 90 d
At the same time, it could also be proved that the RCA made its overall performance lower than NAC. As the carbonation cycle increased, the b value of RAC had increased by 32.16%, 21.34%, and 15.56%, compared with its values of NAC. It could also be seen that the longer the carbonization cycle was, the smaller the b value of RAC was, and the stronger the energy consumption capacity of the test block was.
In order to quantitatively express the variation of parameters, the formula fitting of b with tailing content in the same carbonization cycle was studied. The fitting curves and correlation coefficients were also shown in Fig. 9. After fitting, the values of b under each carbonization cycle were as follows:
where, u was the substitution rate of iron tailing enlarged by 100 times.
It could also be seen that b changed approximately linearly with the increase of tailing content. The longer the carbonization period was, the smaller the absolute value of the linear change slope was. In other words, it also showed that the carbonization could improve the performance of TRC, whose results were consistent with the conclusions of Skocek et al. [43] and Cheng et al. [44]. Meanwhile, the correlation coefficients were mostly above 90%, indicating that the fitting curve had a certain degree of credibility and could be applied in the engineering practice. By referring to the peak stress in the test and substituting the above formula into Eq. (22), the final damage constitutive equation and damage factor equation of TRC could be obtained.
6 Research on Microscopic Damage Mechanism of TRC
The internal micro-structure of concrete directly determined its macro-mechanical performance. Therefore, it was necessary to study the internal micro-structure. In this paper, the microstructure of TRC was analyzed by EDS and SEM to find out its mechanism of carbonation damage.
The EDS Atlas of NAC, RAC and TRC were listed in Fig. 10. It could be seen that the Al and Si content of RAC lied the lowest. After adding a large amount of tailings (RAC-8), their content increased rapidly, increasing by 227% and 78%, respectively, whose improvement effect was obvious. In a certain aspect, it was also proved that the hydration degree of TRC was highest and also indicated that the tailings could promote hydration.

Figure 10: EDS atlas analysis and its main chemical compositions (28 d) (a) NAC (b) RAC (c) TRC
6.2.1 Effect of Tailings Content
Referring to the related literatures [45,46], combined with the common morphology of hydration products about cementitious materials, the material composition in micro state could be confirmed. Fig. 11 illustrated a typical SEM test results before carbonation. Through the analysis of chemical composition, we could clearly see the plate-like Ca(OH)2 and the needle-like or rod-like ettringite with different content. The hydration degree with NAC and RAC (Figs. 11a and 11b) were relatively weak, and the intuitive performance was that there were no obvious formation of needle-like hydrated calcium silicate. On the contrary (Figs. 11c and 11d), TRC had a large number of needle-like and rod-like ettringite materials, while the flake-like Ca(OH)2 was relatively small, which indicated that the tailing activity made the hydration reaction of cement forward to some extent.
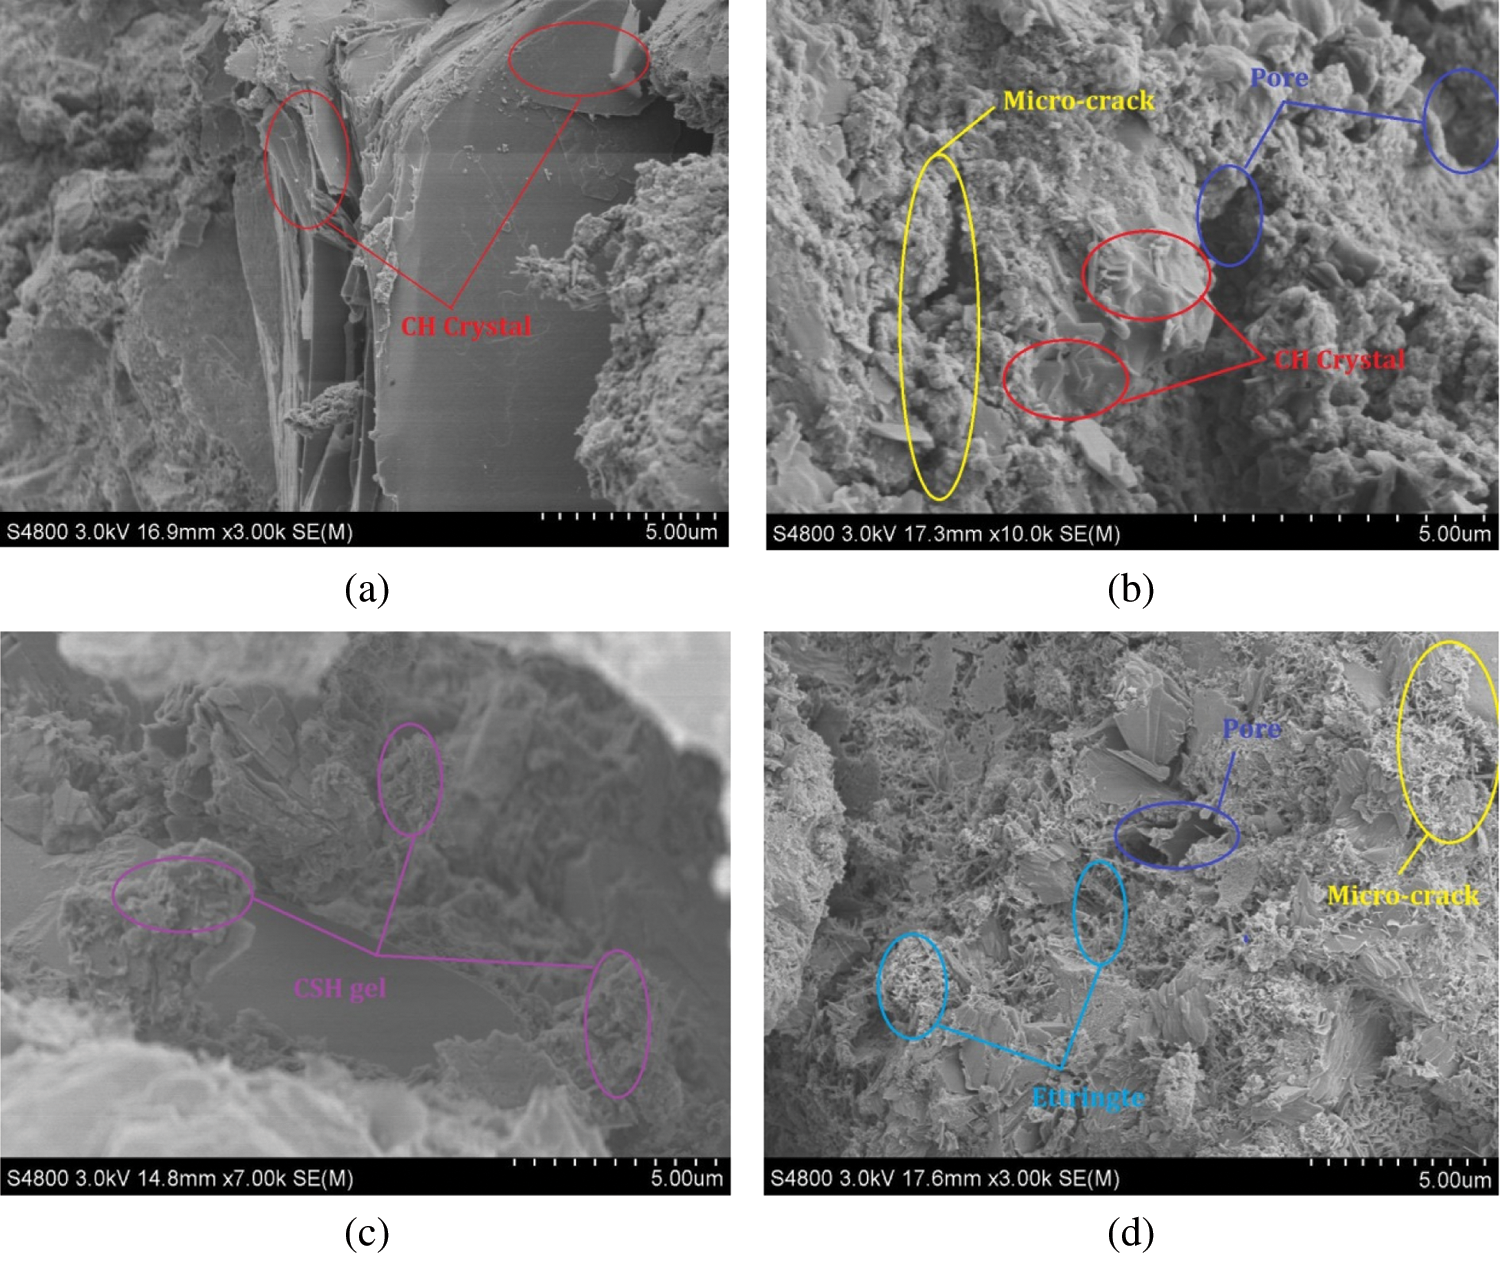
Figure 11: Effect of tailing content on concrete microstructure (0 d) (a) NAC (b) RAC-1 (c) RAC-4 (d) RAC-8
From Fig. 11, the tailing addition also had a greater impact on the density of the matrix structure. Because of more cracks and more complex interface transition zone (ITZ) of RCA, the matrix structure of material itself was relatively loosen (Fig. 11b). Furthermore, it would also lead to an increase in the porosity and a decrease in related mechanical properties. Combined with Figs. 11c and 11d, it could be proved that the fine powder effect of IOT could fill and improve the ITZ, also optimize the number and size of micro-cracks. Meanwhile, the tailing addition made the ettringite content increase greatly, the higher the content was, the greater the increase was. Therefore, the appropriate tailing amount could make the compactness of the matrix structure reach the highest, and the corresponding performance also reached the best. As can be seen from the Fig. 9, the corresponding proportion was close to 30%. However, the addition of excessive tailing made the cement hydration rate faster, but also changed the optimal mix ratio of concrete, which reduced the density of matrix structure. The intuitive performance was the increase in the number of micro-cracks and harmful holes in the matrix structure, as shown in the Fig. 11d.
6.2.2 Effect of Carbonization Cycle
Fig. 12 exhibited the influence of carbonization cycle (90 d) on the concrete microstructure. Compared with Fig. 11, it could be concluded that the content of needle-like or rod-like ettringite was obviously higher, indicating that the complex carbonization reaction could also promote the hydration reaction of cement.

Figure 12: Effect of carbonation cycle on concrete microstructure (90 d) (a) NAC (b) RAC-1 (c) RAC-4 (d) RAC-8
When the tailing content was small, the carbonization products could fill the pore and optimize the ITZ. While it was large, carbonization destroyed the matrix structure of concrete, resulting in a large number of dry shrinkage micro-cracks in the matrix structure. The reason was that CaCO3 generated by carbonization filled the gap in the ITZ, improving the compactness of concrete and its energy dissipation capacity, the longer the carbonation period was, the higher the improvement range was, as shown in Fig. 8. In addition, both cement hydration and carbonization needed to consume free water. However, when the tailing content was larger, the consumption of free water also remained too much, resulting in excessive local water loss and causing shrinkage and cracking of concrete (Fig. 12d), which also led to the reduction of energy dissipation capacity macroscopically (Fig. 7).
In conclusion, the appropriate tailing amount (30%) could reduce the porosity, improve the pore structure and optimize the corresponding mechanical properties. Simultaneously, carbonation could also improve the compactness of RAC, but when the tailing content was larger and the carbonization cycle remained was longer, the matrix structure was easy to crack. Therefore, in the future application of TRC, it was necessary to strictly control the amount of IOT to use limited resources to obtain the maximum energy consumption capacity. However, in view of the concrete discreteness, it is necessary to use more micro-means to study the pore morphology, pore diameter and porosity in the future, so as to quantitatively express this change and provide theoretical basis for better use of RAC.
Based on the fine powder and pozzolanic activation characteristics of IOT, the rapid carbonization test was carried out on TRC, and the stress-strain constitutive curves were analyzed by Weibull probability distribution function. Then, the micro-damage mechanism of TRC was studied. The main conclusions were as follows:
1. According to the principle of strain equivalence and Weibull probability distribution, the stress–strain damage constitutive curves and related damage factors of TRC were deduced theoretically, which laid a foundation for the theoretical analysis of TRC.
2. The stress-strain curves of TRC before and after carbonization were tested with 9 mix ratios. Based on the above theory, the damage constitutive curves were simulated and analyzed. The correlation coefficients could be kept above 85%, which were in good agreement with the experimental results.
3. Under each carbonation cycle, when the tailing content was 30%, the b values of TRC were minimized, which was 22.14%, 20.99%, 25.39% lower than that of NAC, and 41.09%, 34.89%, 35.44% lower than that of RAC, indicating that IOT had a relatively good optimization effect on the constitutive curve of RAC.
4. Through microscopic analysis, a small amount of IOT could fill and promote the hydration of cementitious materials, resulting in a denser matrix structure and a stronger overall energy dissipation capacity. When the IOT content was too high, the gradation of aggregates was changed by adding IOT, which increased the harmful pores of matrix materials, so as to enhance the brittleness of the test block and reduce its energy dissipation capacity to different degree.
5. During carbonization, its products could also fill the harmful pores of RAC and improve the ITZ, thus improving its constitutive curve to become full and enhancing its energy dissipation capacity, the longer the carbonization cycle was, the greater the increase range was. However, when the tailing content was bigger and the carbonization cycle was longer, the hydration and carbonization degree became higher, resulting in the larger demand of free water, which caused the matrix structure to more crack, thus changing the constitutive curve and reducing its energy consumption capacity. After comprehensive consideration, when the tailing content was 30%, the matrix structure owned the densest, and the constitutive curve remained the fullest, also with the best energy consumption.
Funding Statement: This work was funded by the Natural Science Foundation of China (No. 51678480); Ministry of Education Cooperative Education Project (201802308007); Innovation Capability Support Program of Shaanxi (2020PT-038); Henan Province Key Scientific Research Projects of Colleges and Universities (19A560016); Henan Province Key Projects of Science and Technology (192102310277, 182102310834); Scientific Research Projects of Shaanxi Education Department (16JK1244).
Conflicts of Interest: The authors declare that they have no conflicts of interest to report regarding the present study.
1. Lv, X. D., Liu, Z. A., Zhu, Z. G., Li, B. X. (2018). Study of the progress of tailings comprehensive utilization of raw materials in cement and concrete. Materials Review, 32(S2), 452–456. [Google Scholar]
2. Rahul, D., Ajit, P. S. (2019). Utilization potential of fly ash and copper tailings in concrete as partial replacement of cement along with life cycle assessment. Waste Management, 99(1), 90–101. DOI 10.1016/j.wasman.2019.08.036. [Google Scholar] [CrossRef]
3. Protasia, F. N. M., Avillez, R. R. D., Letichevsky, S. (2021). The use of iron ore tailings obtained from the Germanodam in the production of a sustainable concrete. Journal of Cleaner Production, 278, 123929. [Google Scholar]
4. Shettima, A. U., Hussin, M. U., Ahmad, Y., Mirza, J. (2016). Evaluation of iron ore tailings as replacement for fine aggregate in concrete. Construction and Building Materials, 120(1-3), 72–79. DOI 10.1016/j.conbuildmat.2016.05.095. [Google Scholar] [CrossRef]
5. Elinwa, A. U., Maichibi, J. E. (2014). Evaluation of the iron tailings from Itakpe in Nigeria as concrete material. Advances in Materials, 3(4), 27–32. [Google Scholar]
6. Xu, F., Wang, S. L., Li, T., Liu, B., Li, B. B. et al. (2021). Mechanical properties and pore structure of recycled aggregate concrete made with iron ore tailings and polypropylene fibers. Journal of Building Engineering, 33(3), 101572. DOI 10.1016/j.jobe.2020.101572. [Google Scholar] [CrossRef]
7. Li, T., Wang, S. L., Xu, F., Meng, X. Y., Li, B. B. et al. (2020). Study of the basic mechanical properties and degradation mechanism of recycled concrete with tailings before and after carbonation. Journal of Cleaner Production, 259(5), 120923. DOI 10.1016/j.jclepro.2020.120923. [Google Scholar] [CrossRef]
8. Kazmi, S. M. S., Munir, M. J., Wu, Y. F., Patnaikuni, I., Xing, F. (2019). Influence of different treatment method on the mechanical behavior of recycled aggregate concrete: A comparative study. Cement and Concrete Composites, 104(6), 103398. DOI 10.1016/j.cemconcomp.2019.103398. [Google Scholar] [CrossRef]
9. Bidabadi, M. S., Mehran, S., Mahmood, A. (2020). Optimum mix design of recycled concrete based on the fresh and hardened properties of concrete. Journal of Building Engineering, 32, 101483. [Google Scholar]
10. Bahrami, N., Zohrabi, M., Mahmoudy, S. A., Akbari, M. (2020). Optimum recycled concrete aggregate and micro-silica content inself-compacting concrete: Rheological, mechanical and microstructural properties. Journal of Building Engineering, 31, 101361. [Google Scholar]
11. Xiao, J. Z., Huang, K. W., Li, L. (2016). Numerical simulation on static force and fatigue behaviors of modeled recycled aggregate concrete under uniaxial compression. Journal of Southeast University (Natural Science Edition), 46(3), 552–558. [Google Scholar]
12. Xiao, J. Z., Zhang, K. J., Hu, B., Chen, E. C. (2017). Reliability-based study on partial coefficient of recycled aggregate concrete. Engineering Mechanics, 34(6), 82–91. [Google Scholar]
13. Xiao, J. Z., Liao, Q. X., Zhang, Q. T., Qiang, C., Liu, X. (2018). Bond behavior between seawater sea-sand recycled aggregate concrete and glass-fiber reinforced polymer bars. Journal of Tongji University (Natural Science), 46(7), 884–890. [Google Scholar]
14. Xiao, J. Z., Zhang, K. J., Cao, W. L., Bai, G. L. (2020). Time-dependent reliability-based design of recycled aggregate concrete structures. Journal of Building Structures, 41(12), 17–27. [Google Scholar]
15. Duan, Z., Han, N., Singh, A., Xiao, J. (2020). Multi-scale investigation on concrete prepared with recycled aggregates from different parent concrete. Journal of Renewable Materials, 8(11), 1375–1390. DOI 10.32604/jrm.2020.013044. [Google Scholar] [CrossRef]
16. Sanglakpam, C. D., Rizwan, A. K. (2020). Effect of sulfate attack and carbonation in graphene oxide-reinforced concrete containing recycled concrete aggregate. Journal of Materials in Civil Engineering, 32(11), 0003415. [Google Scholar]
17. Moon, Y. J., Yun, W. C., Jae, G. J. (2011). Recycling of tailings from Korea Molybdenum Corporation as admixture for high-fluidity concrete. Environmental Geochemistry and Health, 33(S1), 113–119. DOI 10.1007/s10653-010-9355-1. [Google Scholar] [CrossRef]
18. Shetty, K. K., Nayak, G., Vijayan, V. (2014). Effect of red mud and iron ore tailings on the strength of self-compacting concrete. European Scientific Journal, 21(10), 168–176. [Google Scholar]
19. Yaragal, S. C., Roshan, A. K. M. (2017). Usage potential of recycled aggregates in mortar and concrete. Advances in Concrete Construction, 5(3), 201–219. [Google Scholar]
20. Ana, C. V. Z., Carolina, B. F., Fernando, S. L. (2017). Synthetic gravel for concrete obtained from sandy iron ore tailing and recycled polyethyltherephtalate. Construction and Building Materials, 151(4), 859–865. DOI 10.1016/j.conbuildmat.2017.06.133. [Google Scholar] [CrossRef]
21. Loland, K. E. (1980). Continuous damage model for load response estimation of concrete. Cement and Concrete Research, 10(3), 395–402. DOI 10.1016/0008-8846(80)90115-5. [Google Scholar] [CrossRef]
22. Bai, W. F., Liu, L. A., Guan, J. F., Yao, X. H. (2019). The constitutive model of concrete subjected to sulfate attack based on statistical damage theory. Engineering Mechanics, 36(2), 66–77. [Google Scholar]
23. Zhang, T., Huang, W., Rong, C. (2015). Damage constitutive models of polypropylene fiber recycled concrete. Materials Review B, 29(11), 150–155. [Google Scholar]
24. Muthy, A. R., Priya, D. S. (2017). Weibull distribution based constitutive model for nonlinear analysis of RC beams. Structural Engineering and Mechanics, 61(4), 463–473. [Google Scholar]
25. Nguyen, D. L., Thai, D. K., Ngo, T. T., Tran, T. K., Nguyen, T. T. (2019). Weibull modulus from size effect of high-performance fiber-reinforced concrete under compression and flexure. Construction and Building Materials, 226(2), 743–758. DOI 10.1016/j.conbuildmat.2019.07.234. [Google Scholar] [CrossRef]
26. Rahman, A. S. M. A., Mendz Larriain, M. M., Tarefder, R. A. (2019). Development of a nonlinear rutting model for asphalt concrete based on Weibull parameters. International Journal of Pavement Engineering, 20(9), 1055–1064. [Google Scholar]
27. Kachanov, L. M. (1986). Introduction to continuous damage mechanics. Netherlands Dorrecht, Nijhoff. [Google Scholar]
28. Fu, Q., Xie, Y. J., Long, G. C., Qian, Z. (2014). Statistical damage constitutive relation of rubberized self-compacting concrete. Journal of Sichuan University (Engineering Science Edition), 46(4), 53–60. [Google Scholar]
29. Long, G. C., Li, N., Xue, Y. H., Xie, Y. (2016). Mechanical properties of self-compacting concrete incorporating rubber particles under impact load. Journal of the Chinese Ceramic Society, 44(8), 1081–1090. [Google Scholar]
30. Ministry of Housing and Urban-Rural Construction of China (2016). Code for design of concrete structures (GB50010-2010, 2015 edition). China: China Architecture & Building Press. [Google Scholar]
31. Guo, Z. H. (2014). Principles of reinforced concrete. Beijing, Tsinghua Press. [Google Scholar]
32. Kwan, A. K. H., Dong, C. X., Ho, J. C. M. (2016). Axial and lateral stress-strain model for circular concrete-filled steel tubes with external steel confinement. Engineering Structures, 117(7), 528–541. DOI 10.1016/j.engstruct.2016.03.026. [Google Scholar] [CrossRef]
33. Arruda, M. R. T., Castro, L. M. S. (2013). A new hybrid-mixed stress model for the analysis of concrete structures using damage mechanics. Computers & Structures, 125(125), 23–44. [Google Scholar]
34. Xiao, B., An, X. W., Yang, R., Han, Y. Z., Huang, T. X. et al. (2018). Experimental research on basic mechanical characteristics of recycled aggregate concrete and influencing factors. Concrete, 11, 32–36. [Google Scholar]
35. Wang, S. L., Li, T., Yang, T., Zhang, B., Ju, J. (2013). Experimental study on seismic behavior of RAC columns with silica fume and hybrid fiber. Journal of Building Structures, 34(5), 122–129. [Google Scholar]
36. Ministry of Housing and Urban-Rural Construction of the People’s Republic of China (2011). Specification for mix proportion design of ordinary concrete (JGJ55-2011). China: China Architecture & Building Press. [Google Scholar]
37. Bidabadi, M. S., Akbari, M., Panahi, O. (2020). Optimum mix design of recycled concrete based on the fresh and hardened properties of concrete. Journal of Building Engineering, 32(5), 101483. DOI 10.1016/j.jobe.2020.101483. [Google Scholar] [CrossRef]
38. Gupta, P., Khaudhair, Z., Ahuja, A. (2016). A new method for proportioning recycled concrete. Structural Concrete, 17(4), 677–687. DOI 10.1002/suco.201400076. [Google Scholar] [CrossRef]
39. Jin, W. L., Zhao, X. Y. (2014). Curability of concrete structures (The Second Edition). China: Science Press. [Google Scholar]
40. IPCC (2013). Intergovernmental panel on climate change summary for policymakers. Climate Change 2013: The Physical Science Basis, Contribution of Working Group I to the Fifth Assessment Report of the Intergovernmental Panel on Climate Change. England: Cambridge University Press. [Google Scholar]
41. Ministry of Housing and Urban-Rural Construction of the People’s Republic of China (2009). Standard for test methods of long-term performance and durability of ordinary concrete (GB/T50082-2009). China: China Architecture & Building Press. [Google Scholar]
42. Wang, Y. G., Hughes, P., Niu, H. C., Fan, Y. H. (2019). A new method to improve the properties of recycled aggregate concrete: Composite addition of basalt fiber and nano-silica. Journal of Cleaner Production, 236(10), 117602. DOI 10.1016/j.jclepro.2019.07.077. [Google Scholar] [CrossRef]
43. Skocek, J., Maciej, Z., Haha, M. B. (2020). Carbon capture and utilization by mineralization of cement pastes derived from recycled concrete. Scientific Reports, 10(1), 821. DOI 10.1038/s41598-020-62503-z. [Google Scholar] [CrossRef]
44. Cheng, Y. H., Huang, F., Qi, S. S., Li, W. C., Liu, R. (2020). Durability of concrete incorporated with siliceous iron tailings. Construction and Building Materials, 242(4), 118147. DOI 10.1016/j.conbuildmat.2020.118147. [Google Scholar] [CrossRef]
45. Oritola, S. F., Saleh, A. L., Sam, A. R. M. (2020). Characterization of iron ore tailings as fine aggregate. ACI Materials Journal, 117(2), 125–134. [Google Scholar]
46. Zhang, L. F., Han, J. D., Liu, W. Q., Sun, W. (2015). Microstructure evolution of cement-based materials caused by carbonation reaction–A review. Material Report A: Review, 29(2), 85–95. [Google Scholar]
 | This work is licensed under a Creative Commons Attribution 4.0 International License, which permits unrestricted use, distribution, and reproduction in any medium, provided the original work is properly cited. |