| Journal of Renewable Materials |
DOI: 10.32604/jrm.2021.015326
ARTICLE
Crack Propagation and Failure Characteristics of Modeled Concrete with Natural and Brick Aggregates
College of Civil Engineering, Tongji University, Shanghai, 200092, China
*Corresponding Author: Jianzhuang Xiao. Email: jzx@tongji.edu.cn
Received: 09 December 2020; Accepted: 18 January 2021
Abstract: The failure characteristics of recycled concrete containing brick aggregates are still indistinct, especially how the angular aggregates effect the crack propagation. Based on the concept of modeled concrete, the development of cracks in concrete containing the natural aggregate and brick aggregate under a compression loading was studied. The strain distribution was analyzed with the Digital Image Correlation (DIC). The modeled aggregates include circular and squared ones, and the squared modeled aggregates were placed in different orientations, including 0°, 22.5° and 45°. The results show that when the aggregate is placed at 45°, the upper and lower vertices of the aggregate lead to the highest critical strain concentration, therefore, cracks are easy to propagate from these areas and the strength of the corresponding modeled concrete is the lowest. When the modeled natural aggregate is placed at the orientation of 0°, the strain concentration first appears at the interface on both lateral sides of the aggregate. The brick aggregate has a lower elastic modulus and strength than the surrounding mortar. As a result, cracks always propagate through the brick aggregate, which is the primary reason for the low strength of the corresponding concrete.
Keywords: Recycled concrete; brick aggregate; modeled concrete; mechanical properties; crack propagation
Global population growth, construction of infrastructures and house building activities create enormous amounts of the construction and demolished waste (C&D waste). In recent years, China’s urbanization process is very fast, and the annual production of C&D waste reaching over 18 billion tons [1,2]. The research and application on recycled aggregate from waste concrete and bricks is currently developing greatly, and remarkable achievements have been made. It is found that the recycled aggregate concrete has degraded but comparable properties such as compressive strength and elastic modulus [3–5].
It is not easy to understand or predict the mechanical properties of recycled concrete because of its multi-phase and complex microstructures. The modeled concrete was designed to understand the relationship between the aggregate phase and hardened mortar phase, along with the crack development in the process of stress failure [6–11]. In the modeled concrete, the aggregate was 2-dimentionlized. Therefore, the different phases were clearly seen from the surface, as a result, the crack propagation and failure characteristics can be captured during mechanical testing. Xiao et al. [12–14] put forward the concept of the modeled recycled concrete, and the research results showed that under compression, in modeled recycled concrete specimens, the cracks appeared first in the interfacial transition zone. With an increase of the compression, cracks expanded to the old mortar phase, and protruded through the new mortar finally. The results also showed that the elastic modulus of the modeled recycled concrete was reduced compared with the modeled natural concrete. Li et al. [15] further studied the elastic modulus and peak strain of the modeled recycled concrete by using a finite element simulation, as well as the influence of different thickness of the old mortar on strength.
Zheng et al. [16] investigated the effect of waste brick aggregates on concrete in comparison with ordinary concrete. A reduction of 12% was obtained in the compressive strength. Also, there was a reduction in the elastic modulus by 54% and 62% when the aggregate replacement ratio is 50% and 100%, respectively. The reduction in the properties was attributed to the lower unit weight of brick aggregate, hence reducing the density of concrete which was responsible for the lower compressive strength and elastic modulus [17,18]. However, the research related to the mechanical performance and interaction between brick aggregates and hardened mortar is still needed, especially from the point of damage characteristics and the perspective of the phase separation.
The previous research on the modeled recycled concrete simplified the aggregate to a circle shape [12]. However, the real aggregate has edges and corners. In order to understand the impact of the edges and corners of the aggregate on the mechanical properties and failure characteristics of the recycled concrete, squared modeled aggregates are adopted. In this study, natural aggregates and brick aggregates with different orientations are designed to prepare the modeled aggregate concrete to illustrate the failure characteristics of concrete containing aggregates of varied types, shapes and orientations.
Marble stone was used as the modeled natural aggregate and sintered clay bricks were used as the modeled recycled aggregate. Circular aggregates from stone and bricks with a diameter of 35 mm and a thickness of 20 mm were prepared to make plate specimens of 20 mm thickness. At the same time, squared aggregates of 35 mm side length and with a thickness of 20 mm were also prepared. The mortar poured surrounding the aggregate had a mix proportion as cement: water: sand = 1:0.6:3. The Chinese standard P.O. 42.5 cement was used as the cementing agent. The aggregates were placed at center of the plate molds and the cement mortar was poured around them. The modeled concrete is a plate made of the aggregate and cement mortar, with the overall dimension of 100 mm × 100 mm × 20 mm. For the squared aggregates, three different orientations of 0°, 22.5° and 45° were adopted. Fig. 1 shows the layout of the modeled concrete with the various orientations of aggregates.

Figure 1: Layout of modeled concrete with natural and brick aggregates
2.2 Physical and Mechanical Properties of Each Phase
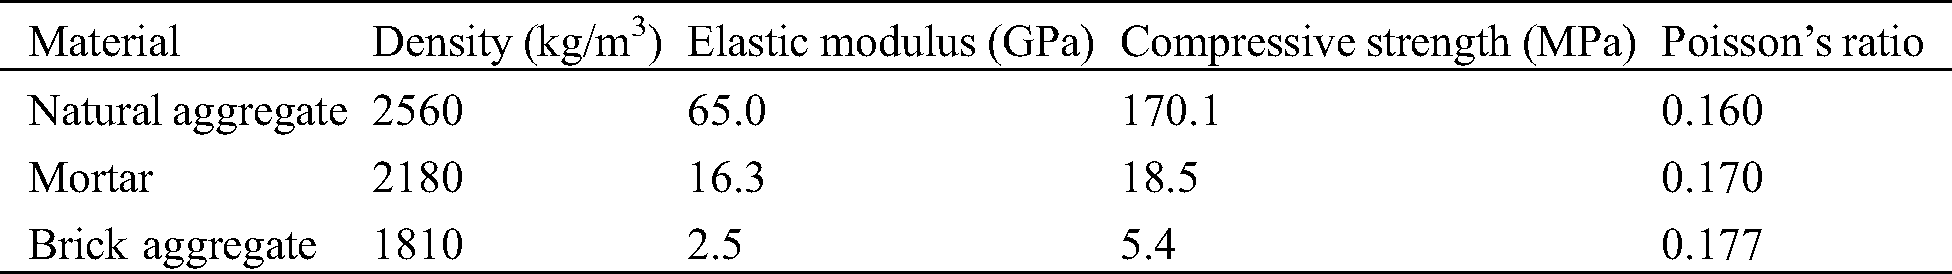
In order to accurately grasp the physical and mechanical properties of each phase of materials, prismatic specimens of 40 mm × 40 mm × 80 mm were prepared from each material, i.e., marble stone, bricks and the mortar that is used for making the modeled concrete. The compressive strength, elastic modulus and Poisson’s ratio of the prismatic specimens were tested on an electronic universal testing machine. The mechanical properties are shown in Tab. 1, and the density of the materials can also be found. It can be seen from the table that the density of natural aggregate is the highest, i.e., 2560 kg/m3, the densities of the mortar and the brick are 2180 kg/m3 and 1810 kg/m3, respectively. The elastic modulus of the natural stone material is significantly higher than the other materials. Comparing the compressive strength of the materials, it is found that it follows the same trend as the elastic modulus. However, the Poisson’s ratios of them are relatively similar to each other.
Table 1: Physical and mechanical properties of each phase
Digital image correlation (DIC) technology is a non-contact and non-destructive testing method. It directly provides full-field displacements to sub-pixel accuracy and full-field strains by comparing the digital images of a test object surface acquired before and after deformation. By using the randomly arranged speckles on the surface of the specimen and then comparing the change of the relative position of these speckles while the specimen is under loading process, the displacement field on the surface of the specimen can be calculated. The strain distribution field can be further analyzed to obtain the process of strain concentration and crack propagation.
Dark speckles were made on the front surface of the test specimen and the size of the speckles was about 0.7 mm, covering the entire area to be measured. An industrial camera (model JHSM300f) was used for images capturing with a pixel of 2048 × 1536. The whole surface of the specimen is in the visible range, which is 150 mm × 120 mm. Therefore, the resolution can reach 0.08 mm/pixel. From the above analysis, the size of the speckle is suitable for calculating the strain distribution field according to related researches [19–21]. The interval of the image capturing is 5 seconds.
The prepared plate specimen was placed on an electronic universal testing machine for compression loading. Two sheets of Teflon were placed on the upper and lower surfaces of the test specimen, and lubricating oil was applied between the two layers to reduce friction. Before the formal loading, the specimens were preloaded to 5 kN and unloaded to 0 kN three times to dismiss uneven compression. The loading rate of preloading was 0.1 mm/min. The formal loading includes two processes: Force loading and displacement loading. The force loading rate is 2 kN/min. When the load reaches 20 kN, it was changed to displacement loading. The loading rate is 0.05 mm/min. The whole loading test setup is shown in Fig. 2.

Figure 2: Test setup
3.1 Mechanical Properties and Failure Modes
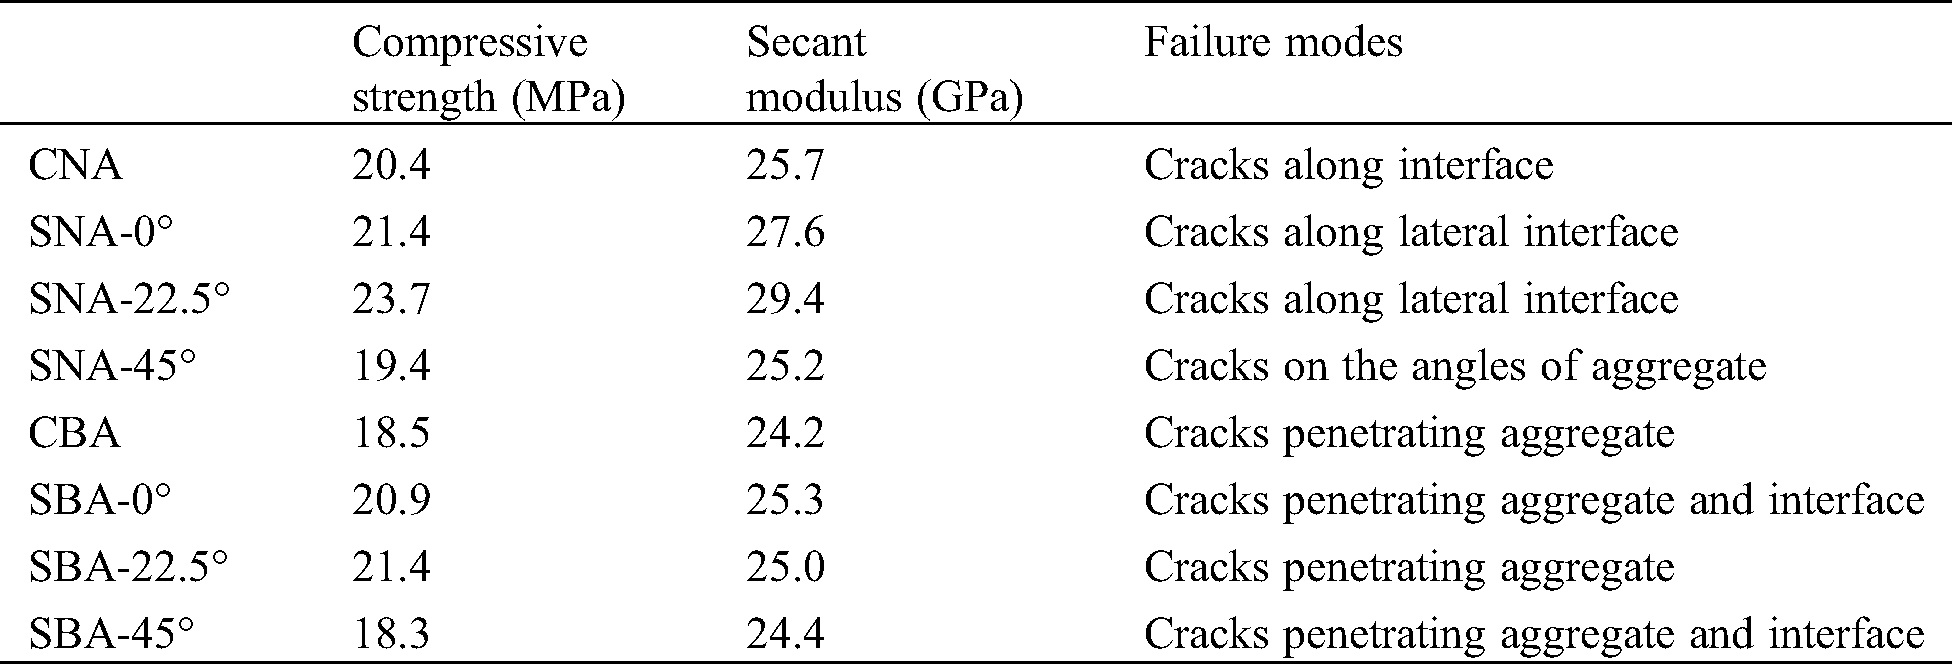
The compressive strength of each specimen was obtained from dividing the observed peak load by the area of the cross section (100 mm × 20 mm). For calculating the secant modulus, the rising section of the loading curve was adopted at 20% and 70% of the peak load. Both the compressive strength and the secant modulus of the specimens are shown in Tab. 2. In the table, the name CNA represents circular natural aggregate, SNA is squared natural aggregate, CBA is circular brick aggregate and SBA is squared brick aggregate. The degree after the name is the orientation of the squared aggregate being placed in the specimen. Each value presented in the table is the average of three specimens.
From Tab. 2, for circular aggregate, it can be seen that the strength of the natural aggregate modeled concrete is 20.4 MPa, and that of the brick aggregate modeled concrete is slightly lower, 18.5 MPa. For squared aggregate, the strength of brick aggregate modeled concrete is also lower than that of modeled ordinary concrete. This shows that the brick aggregate will reduce the strength of concrete [18]. For three kinds of orientation of the squared natural aggregates, it is easy to find that the lowest compressive strength was observed at the angle of 45°. For the brick aggregate concrete, the strength was also lowest at the same angle. This is because the stress concentration at the tip of the aggregate is the most critical and the cracks appear earlier. The strength of the concrete containing the modeled aggregate at the orientation of 22.5° is the highest, which is higher than that at the orientation of 0°. This may be because of the weak interface formed by two lateral surfaces of the aggregate, leading to a splitting failure mode. However, when the orientation of the model aggregate is 22.5°, the stress concentration at the tip of the model aggregate is relatively weak, and the interface on both lateral surfaces of the modeled aggregate is subjected to both a vertical pressure and a splitting tension. Therefore, after balancing these two factors, the strength of the model concrete with the aggregate orientation of 22.5°shows the highest.
The specimens containing the circular aggregate show lower compressive strengths compared to those of squared aggregates, except the orientation of 45°. There should be two reasons to explain this. First, the circular aggregate has a diameter 35 mm, which is the same as the side length of the squared aggregate. Therefore, the area of the circular aggregate is smaller than the squared one, which results in more mortar in the specimen of circular aggregates. Second, the ITZ may play a more essential role in the specimen containing circular aggregates because of the smooth and warped surface. In contrast, the surface of the squared aggregate has a certain orientation as it is placed.
For the secant modulus of the modeled concrete, similar trend is found as the strength which is presented in Tab. 2. The secant modulus of natural aggregate modeled concrete is higher than that of the corresponding brick aggregate modeled concrete, and the ranges are about 6.2%, 9.1%, 17.6% and 3.3%, respectively, for four kinds of modeled aggregate concrete.
The variation of the secant modulus shows that it is related to the aggregate shapes and orientations. According to the different phases in concrete, each phase can be considered as a series of springs, which are connected in different positions. When the orientation of the aggregate are changed, the connection relationship of the springs changes, which leads to a change in the secant modulus of the concrete performance.
Table 2: Mechanical properties and failure modes
3.2 Natural Aggregate Modeled Concrete
In the following section, the strain of the horizontal direction (εx) of the specimens was recorded and analyzed. For each specimen, three figures are provided: First at 20% of the peak force (Fp), second at 80% of the peak force and third at 100% of the peak force. At each load level, two figures are illustrated, see Fig. 3. The left one is showing the strain distribution obtained by using DIC and the right one shows the strain values along lines at the top, middle and bottom of the specimen, named L0, L1 and L2, which can be seen in Fig. 3.

Figure 3: Strain distribution of CNA ((a): εx at 20% of Fp; (b): εx along L0, L1 and L2 at 20% of Fp; (c): εx at 80% of Fp; (d): εx along L0, L1 and L2 at 80% of Fp; (e): εx at 100% of Fp; (f): εx along L0, L1 and L2 at 100% of Fp)
3.2.1 Circular Natural Aggregate
From Fig. 3a, it can be seen that the strain along horizontal direction shows a random fluctuation around zero. According to the elastic modulus and Poisson’s ratio of the mortar, the horizontal strain of the specimen is about 0.00004 at 20% peak load, which is consistent with the average value obtained with DIC. This can be seen more clearly from the strain curves along L0, L1 and L2 in Fig. 3b. Three strain curves fluctuate between ± 0.002, and the mean value is about zero.
When the load reached 80% of the specimen’s strength (Fig. 3c), the strain has a maximum value at the bottom of the circular aggregate. The highest point of the green line can be seen in Fig. 3d, which is about 0.0012. From Fig. 3c, we can also see the strain concentration along the interface around the circular aggregate. The strain is concentrated because of the variation in the interface and the phase variation between the circular aggregate and the mortar.
As soon as the specimen reaches its peak force, it can be seen from the graph of strain concentration (Fig. 3e) that there is a triangle area in the upper and lower part of the circular aggregate, which is also in the strain’s boundary concentration area. This is because the elastic modulus of natural aggregate is much higher than that of the mortar, therefore, the aggregate works as a constraint to the mortar attaching on it. The red area in the upper right corner of the strain distribution graph is caused by a splitting failure of the specimen and the local plane warping, which is observed in the test. According to the principle of two-dimensional DIC, when the specimen moves towards the lens, the distance between the scattered patterns becomes greater, and the calculated strain field is in a tension state. When the specimen moves away from the lens, the strain field shows compressive situation [22,23]. According to the red curve of L0 in Fig. 3f, it can be found that the strain concentration at the upper part of the aggregate is about 0.0015, which is higher than the cracking strain of mortar. Therefore, there should be a micro-crack in this area.
According to the strain curve along L1, it can be concluded that the strain concentration happens on both lateral sides of the aggregate. The strain values are 0.0006 and 0.0018, respectively, on the left and right lateral interfaces, and there should be micro cracks. For the L2 curve at the lower part of the specimen, the maximum strain value is about 0.0013. According to these curves, we can see the quantitative degree of the strain concentration around the aggregate, which is helpful to understand the influence of the aggregate on its surrounding strain concentration.
3.2.2 Squared Natural Aggregate at 0°
When the squared aggregate is used and its sides are parallel to the sides of the mortar specimen, this contributes to an even strain distribution and less stress concentration around the aggregate, see Fig. 4a. However, from Fig. 4b, at the left end of the curve L2, there is an obvious tensile stress concentration with a strain value as high as 0.005. According to the test phenomenon, it is found that there is a crack at this position, which starts from the lower left corner of the specimen.

Figure 4: Strain distribution of SNA-0° ((a): εx at 20% of Fp; (b): εx along L0, L1 and L2 at 20% of Fp; (c): εx at 80% of Fp; (d): εx along L0, L1 and L2 at 80% of Fp; (e): εx at 100% of Fp; (f): εx along L0, L1 and L2 at 100% of Fp)
As 80% of the peak force is reached, the crack at the left end of curve L2 develops further, and the strain value reaches to 0.007. At the same time, a small strain concentration appears along the left side of aggregate, and its value is about 0.0015, which can be seen from the curve L1 in Fig. 4d. The strain values of other regions are in an increasing trend, that is, they are in the state of gradual tension.
When it reaches the peak load, for Fig. 4e, the crack at the left end of L2 does not obviously continue to expand, because its strain value is still 0.007. However, the strain concentration of interface on the left side of aggregate develops further. It can be determined from the L0 and L1 curves in Fig. 4f, the strain values increase to greater than 0.003. The ultimate failure of the specimen occurs because of two cracks, the crack in the lower left corner of the specimen and the crack in the interface on the left side of the modeled aggregate.
3.2.3 Squared Natural Aggregate at 22.5°
For the specimens containing a squared natural aggregate placed in an inclined direction of 22.5°, as shown in Fig. 5a, when the load is 20% of the peak load, the average of the horizontal strain is approximately near zero. According to Fig. 5b, the strain along L0, L1 and L2 fluctuates between ± 0.0003.

Figure 5: Strain distribution of SNA-22.5° ((a): εx at 20% of Fp; (b): εx along L0, L1 and L2 at 20% of Fp; (c): εx at 80% of Fp; (d): εx along L0, L1 and L2 at 80% of Fp; (e): εx at 100% of Fp; (f): εx along L0, L1 and L2 at 100% of Fp)
With the increase of load, the upper tip of the aggregate cause obvious strain concentration and evolves into a crack. The strain concentration is along the inclined surface of the aggregate, as shown in Fig. 5c. From the curve L0 in Fig. 5d, it can be seen that the maximum strain at the tip of the aggregate is 0.003, and the crack develops to the lateral side of the aggregate. It is easy to find a strain concentration on the curve L1. However, a strange phenomenon is seen that the strain on the surface of the specimen is negative except for the cracking area. This should be because the specimen moves far away from the lens as explained above [20], so that the whole specimen has a strain of about −0.002. Therefore, the actual strain at the tip of the aggregate should be about 0.005.
Before reaching the peak load, the crack continues to develop downward along the right surface of the aggregate, and then to develop vertically after crossing the lower tip of the aggregate. This crack develops from the top of the specimen and gradually extends to the bottom of the specimen, see Fig. 5e. Therefore, the strain curves of L0, L1 and L2 have peaks as shown in Fig. 5f. The crack opens from these positions, and the specimen reaches the peak load immediately.
3.2.4 Squared Natural Aggregate at 45°
When the modeled squared natural aggregate is aligned at an angle of 45°, the strain distribution figures and curves are illustrated in Fig. 6. First, no obvious strain concentration can be observed from Fig. 6a, in which, however, the upper part of the specimen is red, the middle part is green and the lower part is purple. Corresponding to the color bar on the right side, the strain in the upper region is about −0.0003, the strain in the middle is about −0.007, and the strain in the lower part is about −0.0011. This should be because of the out-of-plane inclination of the specimen, therefore, the strain calculated based on this is not the real strain. According to the previous analysis, the specimen is in a slight lateral expansion in a horizontal direction because of Poisson’s ratio effect, and the tensile strain value is close to 0.00004. Therefore, the train curves of L0, L1 and L2 are adjusted according to this. After adjusting, it is found that there is no obvious strain concentration.
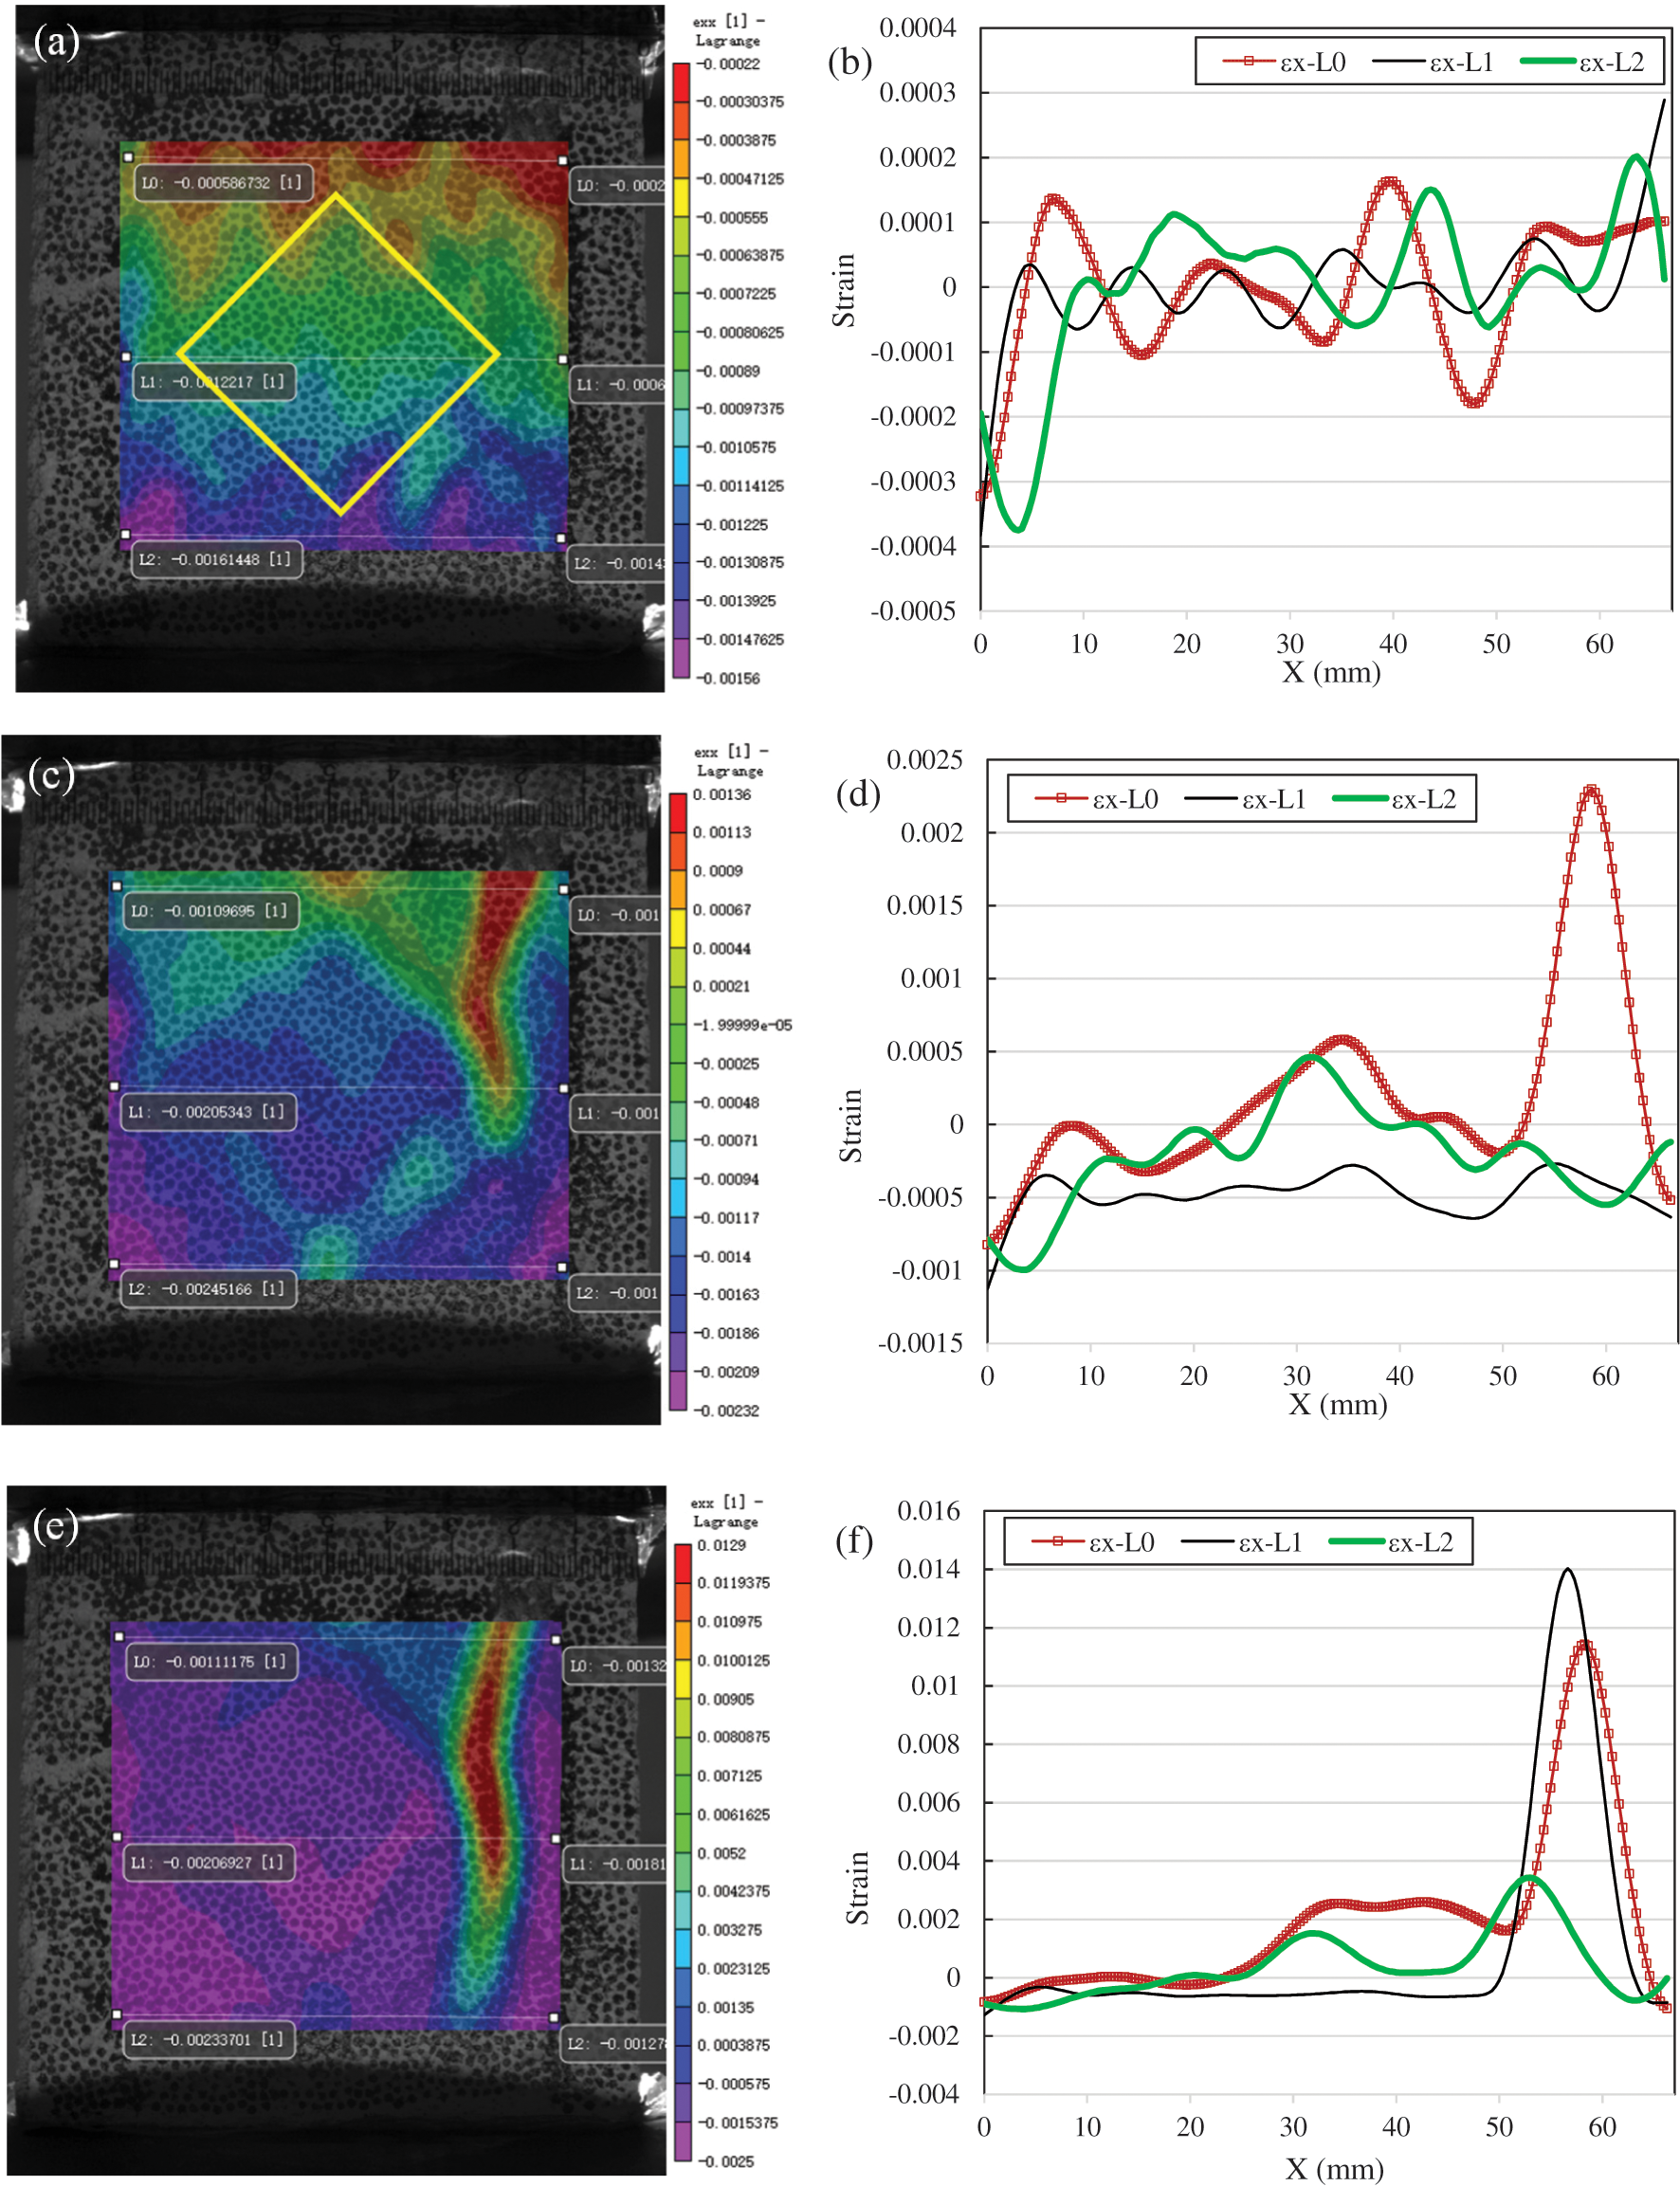
Figure 6: Strain distribution of SNA-45° ((a): εx at 20% of Fp; (b): εx along L0, L1 and L2 at 20% of Fp; (c): εx at 80% of Fp; (d): εx along L0, L1 and L2 at 80% of Fp; (e): εx at 100% of Fp; (f): εx along L0, L1 and L2 at 100% of Fp)
When the load increases to 80% of the peak load, the strain concentration in Fig. 6c can be seen. Apart from an obvious crack on the right of the specimen, the strain concentration around the aggregate can also be observed. In Fig. 6d, the curve L0 can clearly show the strain concentration at the crack. In addition, there is a peak in the middle of the L0 curve, the obvious tensile zone, which is the strain concentration caused by the upper tip of the aggregate. Because the elastic modulus and strength of the aggregate are much greater than that of the mortar, the mortar at the tip of the aggregate is in a splitting tensile state. In Fig. 6d, the green curve L2 also has a peak in the middle.
As the load continues to increase to failure, see Fig. 6e, the cracks on the right side of the specimen continue to develop to main cracks, resulting in the specimen’s failure.
3.3 Brick Aggregate Modeled Concrete
When brick aggregate is introduced in the specimen, a larger variation of the strain distribution has been observed. The strength and elastic modulus of the brick aggregate are less than that of the hardened mortar. This differs completely from ordinary concrete and it results in completely different failure modes and cracks propagating laws. In the following part, the modeled concrete made of circular brick aggregate and squared brick aggregate with three different orientations is tested and the development of cracking is also analyzed to summarize the influence of brick aggregate on cracking performance.
3.3.1 Circular Brick Aggregate
According to Fig. 7a, the strain distribution of the circular brick aggregate modeled concrete under 20% peak load appears that the specimen is inclined out-of-plane. It is shown that the upper part of the specimen is purple, and the corresponding strain is about 0.0027; the middle part is green, and the strain is about 0.0013; the lower part is red and the strain is about zero. Therefore, it is also necessary to adjust the strain curves of L0, L1 and L2 to get the curve diagram in Fig. 7b. It can be seen that the strain curves fluctuate between −0.0005 and 0.0005, except that the strain on the left and right ends is relatively large.

Figure 7: Strain distribution of CBA ((a): εx at 20% of Fp; (b): εx along L0, L1 and L2 at 20% of Fp; (c): εx at 80% of Fp; (d): εx along L0, L1 and L2 at 80% of Fp; (e): εx at 100% of Fp; (f): εx along L0, L1 and L2 at 100% of Fp)
When the load increases to 80% of the peak load, an obvious crack can be seen in the upper right corner of the specimen. It can also be clearly seen from the curve in Fig. 7d that there is a hump on the L0 strain curve, which is corresponding to a crack and the maximum strain reaches 0.005. However, no obvious strain concentration is found in the modeled brick aggregate.
As the load continues to increase, the crack at the upper right corner of the specimen propagates downward and gradually penetrates the interface on the right side of the aggregate, see Fig. 7e. A strain concentration can also be found on the left side of the brick aggregate from Fig. 7e. In particular, there is a strain concentration zone inside the aggregate. The expansion of the crack is not seen in the upper and lower mortar parts of the aggregate. In addition, in the lower left corner of the specimen, a crack is also found to propagate upward gradually. Abrupt changes of these strain concentrations can be seen in Fig. 7f. From the curve L1, there are three bulges corresponding to the cracks in the left interface, middle of aggregate and right interface, and the values of the three strain concentrations are similar. The strength of the brick aggregate is lower than that of the mortar, therefore, the brick aggregate becomes a weak spot in the concrete. Under compression, the aggregate itself is crushed prior to the mortar, so that the above failure modes occur, which differs from ordinary concrete.
3.3.2 Squared Brick Aggregate at 0°
For the modeled squared brick aggregate concrete, according to the strain contour at 20% peak load (see Fig. 8a), it can be determined that the specimen also has an out-of-plane displacement. By eliminating the strain change caused by out-of-plane displacement, the strain curves of L0, L1 and L2 fluctuate within ± 0.0002, which is basically consistent with the fact that the accuracy of DIC technology, which is about 20 μm [21].
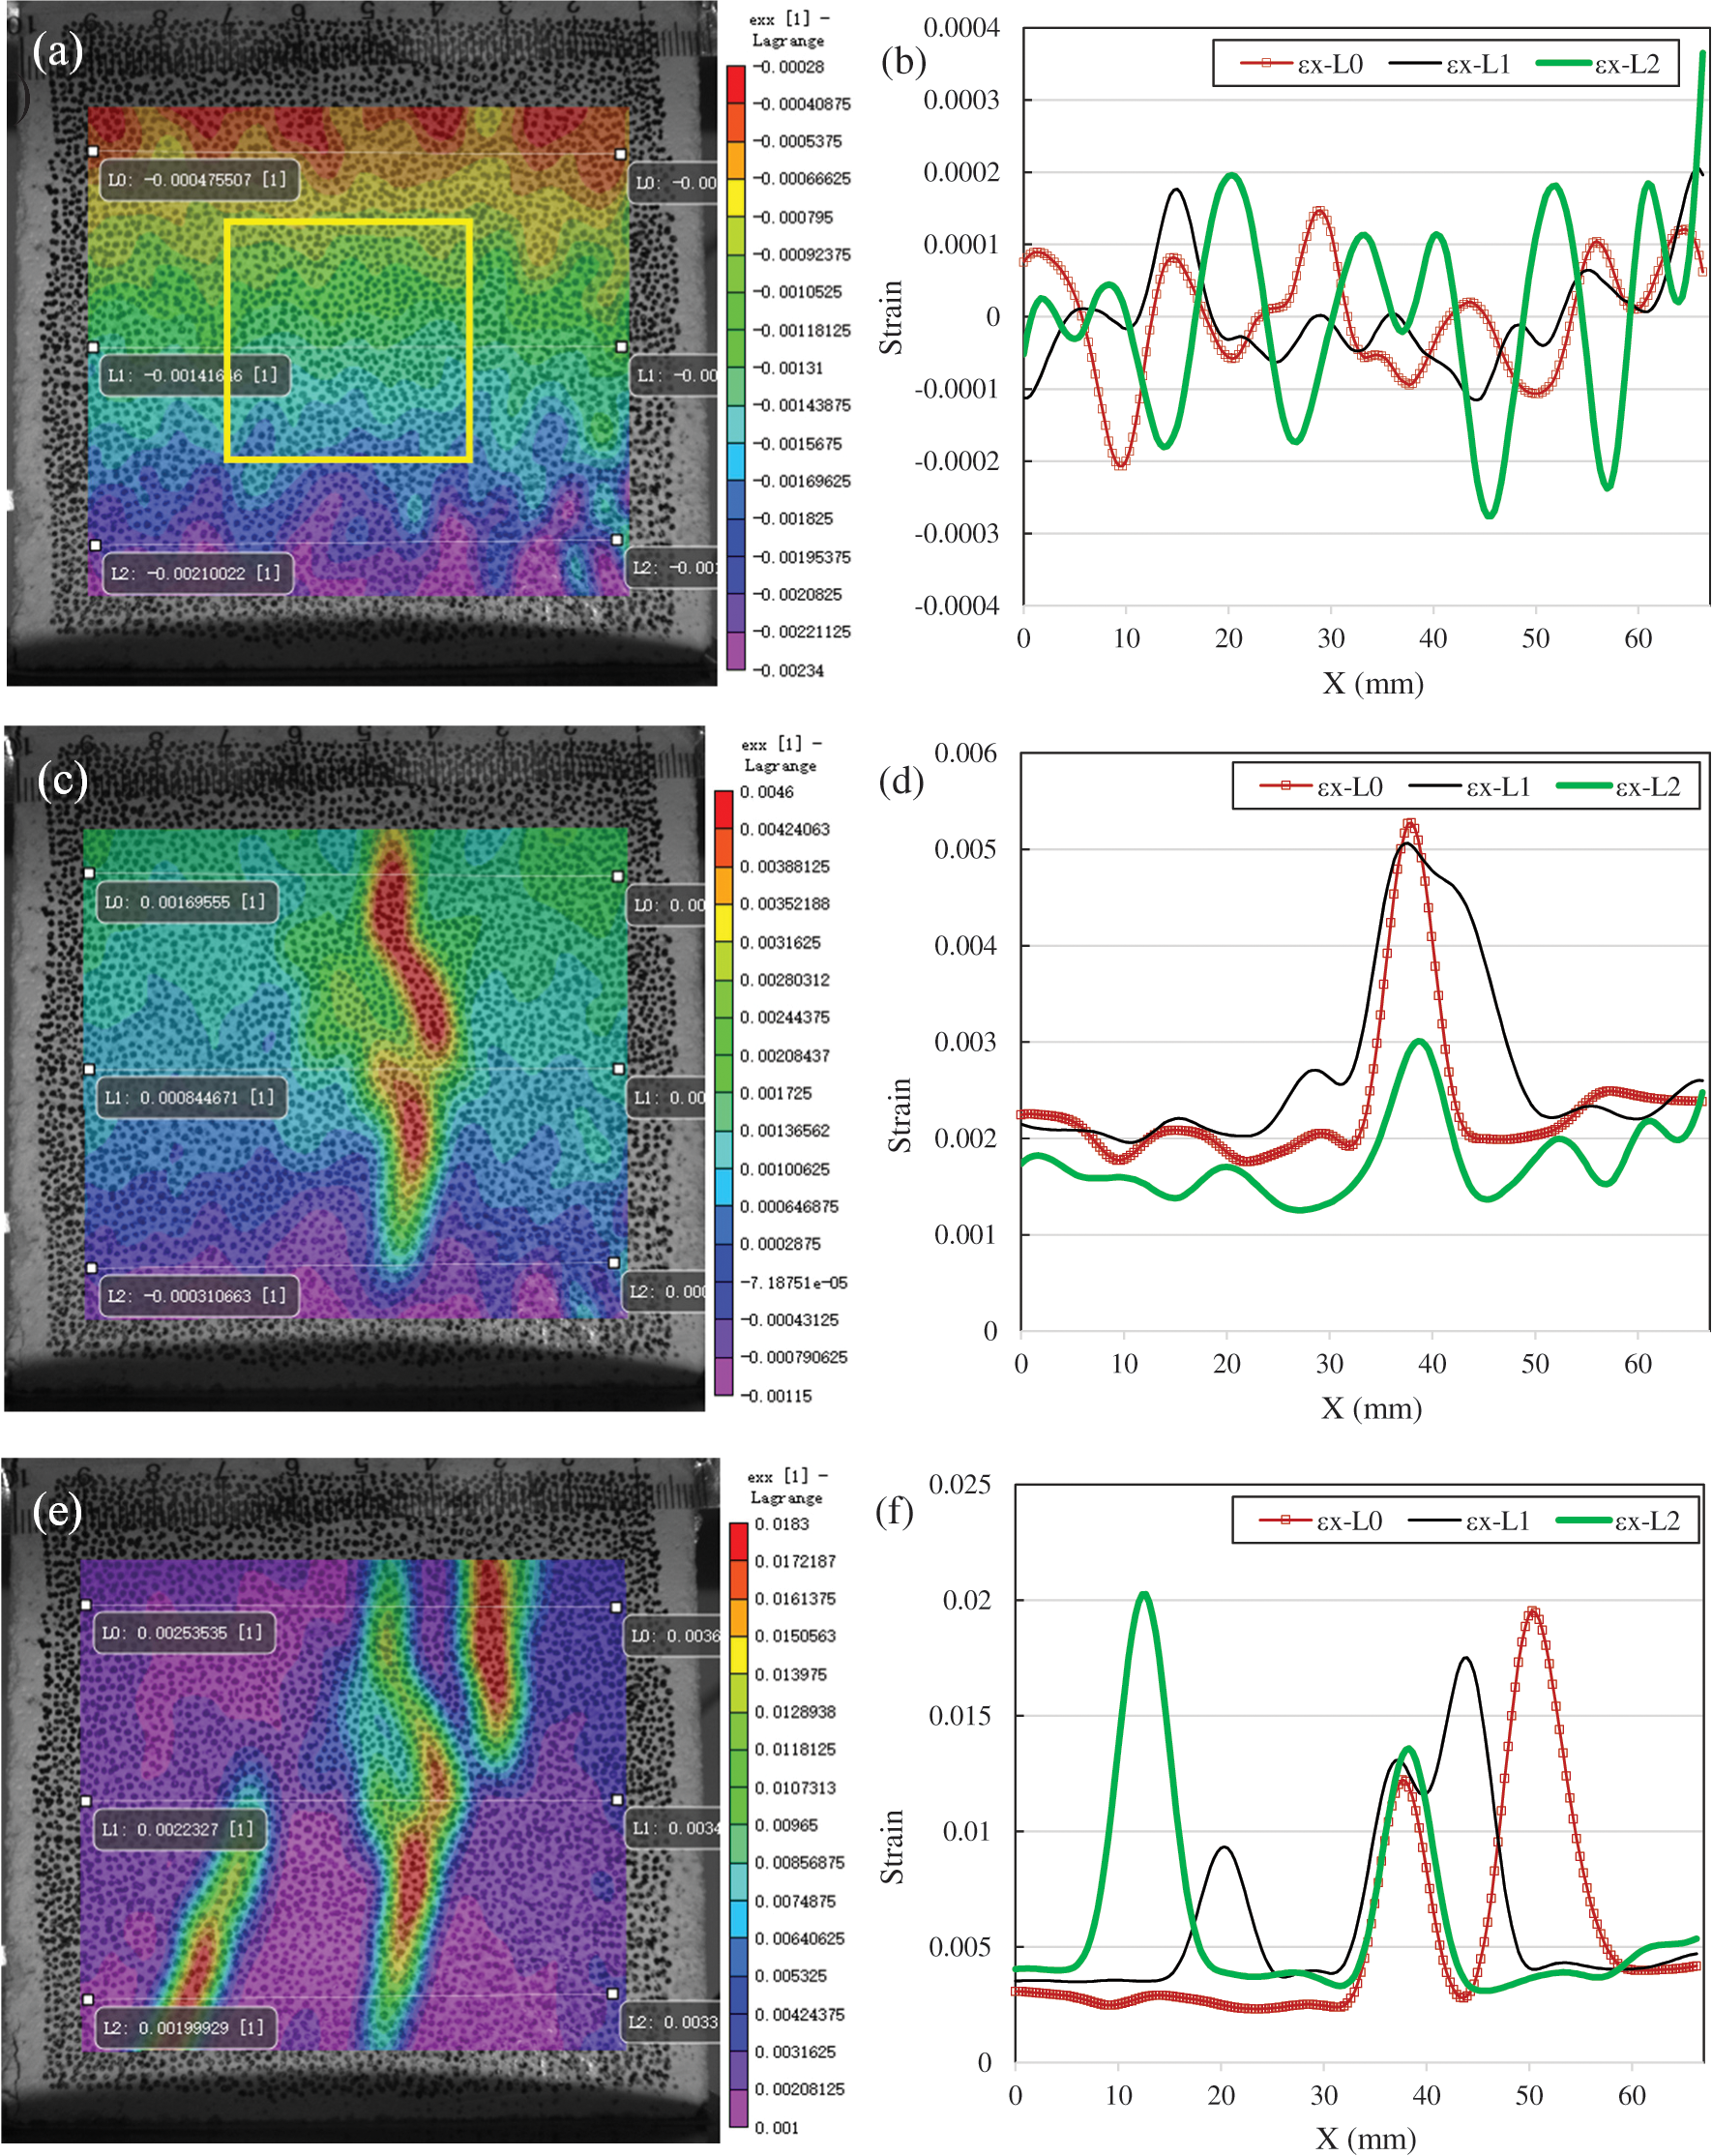
Figure 8: Strain distribution of SBA-0° ((a): εx at 20% of Fp; (b): εx along L0, L1 and L2 at 20% of Fp; (c): εx at 80% of Fp; (d): εx along L0, L1 and L2 at 80% of Fp; (e): εx at 100% of Fp; (f): εx along L0, L1 and L2 at 100% of Fp)
When the load increases to 80% of the peak load, the cracks are also initiated from the interior of the brick aggregate, as shown in Fig. 8c. According to Fig. 8d, the strain value at the cracks is about 0.005. Considering that the average strain in other areas is about 0.002, this should be a virtual strain distribution caused by the out-of-plane displacement of the specimen. Therefore, the real strain at the crack should be about 0.003.
With the continuous increase of the load, before the failure, there are cracks on the upper and lower surfaces of the specimen in the mortar area, see Fig. 8e. The strain value of the cracks is as high as 0.02. Even after deducting the virtual strain caused by the out-of-plane displacement of the specimen, the strain value at the crack is still as high as 0.017. In summary, the cracks occurs in the brick aggregate first, and then propagate into the adjacent mortar.
3.3.3 Squared Brick Aggregate at 22.5°
For the specimen that the squared brick aggregate is aligned at 22.5°, when the compressive load is 20% of the peak load, the strain of X-direction fluctuates between ± 0.00015, see Fig. 9b.

Figure 9: Strain distribution of SBA-22.5° ((a): εx at 20% of Fp; (b): εx along L0, L1 and L2 at 20% of Fp; (c): εx at 80% of Fp; (d): εx along L0, L1 and L2 at 80% of Fp; (e): εx at 100% of Fp; (f): εx along L0, L1 and L2 at 100% of Fp)
As the load reached to 80% of the peak force, the cracks propagates from the lower left and right corners of the specimen (see Fig. 9c). The strain values of these two cracks are about 0.0045 according to the strain curve of L2 in Fig. 9d. Also from Fig. 9c, it can be found that the strain concentration appears in the brick aggregate, and the strain concentration also occurs at boundaries of the aggregate. The curve L1 in Fig. 9d shows that the maximum strain inside the aggregate reaches 0.0012. It can also found that, although the cracks starts from the mortar, the strain concentration occurs inside the aggregate before the cracks propagates into the brick aggregate. This also shows that the brick aggregates is the weak spot in concrete containing them.
The load continues to increase, the cracks in the mortar become longer and wider, and the strain value increases to 0.016. The maximum strain concentration internal the brick aggregate increases to 0.006, as shown in Fig. 9f.
3.3.4 Squared Brick Aggregate at 45°
When the squared brick aggregate is assigned at an angle of 45°, the aggregate is still the weakest area in the specimen. The strain concentration can be seen inside of the aggregate as 80% peak load is reached. There is also an obvious strain concentration starting from the bottom corner of the specimen in Fig. 10c with a strain value of surpassing 0.01, probably a crack has happened at this position. Apart from that, a small strain concentration propagates from the upper corner of the specimen as well, although the value is only about 0.003.
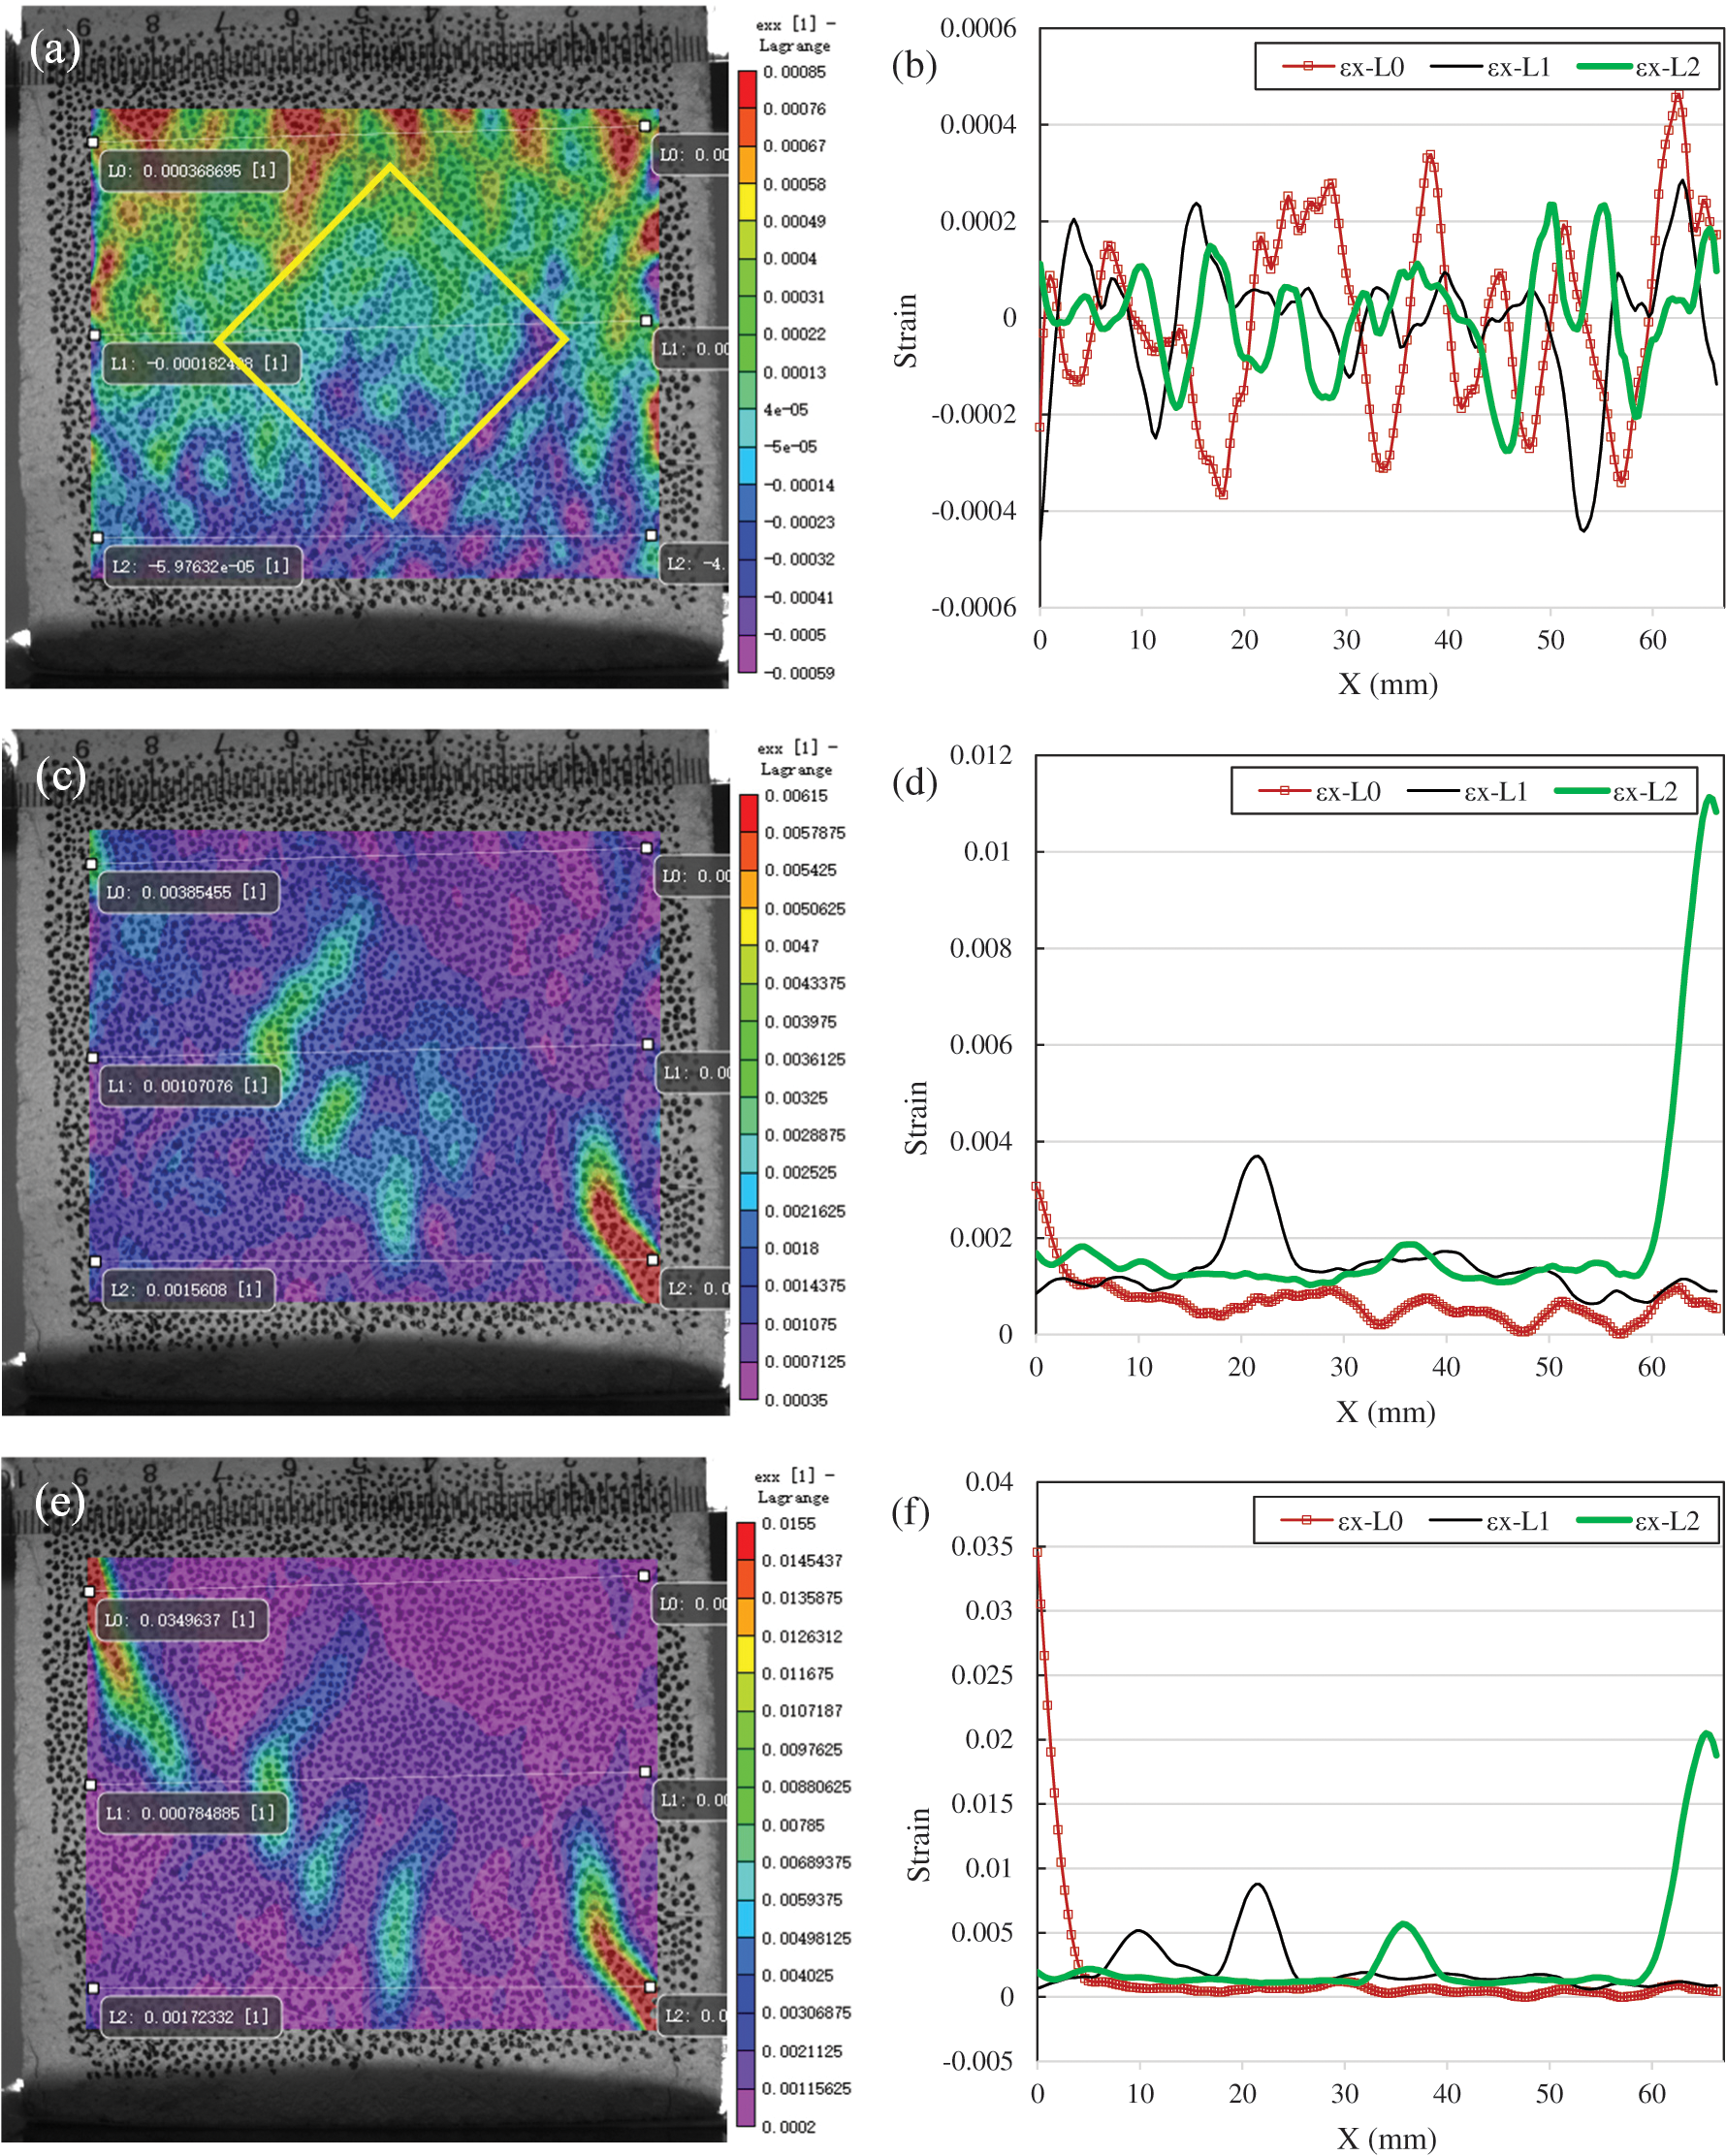
Figure 10: Strain distribution of SBA-45° ((a): εx at 20% of Fp; (b): εx along L0, L1 and L2 at 20% of Fp; (c): εx at 80% of Fp; (d): εx along L0, L1 and L2 at 80% of Fp; (e): εx at 100% of Fp; (f): εx along L0, L1 and L2 at 100% of Fp)
As the load reaches its peak value, multiple cracks emerge on the left top corner and other parts of the specimen, which can be attributed to the difference in the material properties of the brick aggregate and the mortar.
In summary, comparing the natural aggregate and brick aggregate modeled concrete, it is obvious that brick aggregate is the weak spot in concrete. Internal fractures always occur inside the brick aggregate before the mortar cracks. In addition, there are obvious strain concentrations at the interface area around the natural aggregate, especially when the sharp angle of the aggregate is facing the stress direction. This should be caused by the great difference of elastic modulus between the aggregate and the mortar. However, the phenomenon of strain concentration at the interface area between the brick aggregate and mortar is not distinct. This may result from two reasons, first, the difference of elastic modulus between brick aggregate and mortar is relatively small, second, the damage develops inside the aggregate prior to the interface area.
The modeled concrete containing stone and brick aggregates with different orientations were studied in this investigation, based upon the crack propagation and damage characteristics during compressive loading, the following conclusions may be drawn:
1. Applying modeled aggregate to recycled concrete, not only can suffice the understanding of crack development process but also the strain concentration of the specimen can be obtained by using DIC.
2. The mechanical test shows that the elastic modulus of brick aggregate is 2.5 MPa, which is only 1/6 of that of the hardened mortar. This attributes that the modeled concrete containing brick aggregate has a lower elastic modulus as to the corresponding modeled natural concrete.
3. The elastic modulus of the natural aggregate in the modeled concrete is about 4 times of that of the hardened mortar, and the strength of the natural aggregate is much higher than the mortar. Therefore, the strain concentration often occurs in the interface, and the cracks pass through the interface.
4. When the modeled aggregate is placed at 45°, there are obvious strain concentrations at the top and bottom tips of the aggregate, and the strain concentration is higher than any other cases. And also, the strength of the specimen in this case is the lowest compared to others.
5. According to the strain distribution field obtained with DIC, it can be seen that the failure of the brick aggregate modeled concrete starts from the brick aggregate itself. The brick aggregate cracks earlier than the surrounding mortar, which is the main reason for the low strength of brick aggregate concrete.
6. There may be some drawbacks in the application of two-dimensional DIC in this test, because the out-of-plane displacement of the specimen is regarded as the expansion or contraction in the plane after the captured figures being analyzed with DIC. This results in the distortion of the strain value obtained from the analysis, but the strain distribution can still be used to judge the position and propagating trend of the crack.
7. According to the influence of modeled aggregate orientations on elastic modulus, strength and failure process of concrete, it is found that the strain concentration is easily caused by aggregate tips or sharp edges. Moreover, the aggregate should not have a large flat surface, which is easy to cause splitting failure. Therefore, the method of removing the tip of aggregates and reducing the flaky aggregate is highly recommended to improve the quality of recycled aggregates.
8. The research based on the modeled concrete can clearly show its damage evolution process, and it is still necessary to carry out more extensive research based on the changes of parameters such as different types of aggregates and aggregate shapes and numbers, so as to better grasp the damage characteristics of recycled concrete.
Funding Statement: The financial supports from the National Natural Science Foundation of China (Nos. 52078358, 51325802) and China Postdoctoral Science Foundation (No. 2018M642079) are highly acknowledged.
Conflicts of Interest: The authors declare that they have no conflicts of interest to report regarding the present study.
1. Xiao, J., Li, W., Fan, Y., Huang, X. (2012). An overview of study on recycled aggregate concrete in China (1996–2011). Construction and Building Materials, 31(5), 364–383. DOI 10.1016/j.conbuildmat.2011.12.074. [Google Scholar] [CrossRef]
2. Tam, V. W. Y., Soomro, M., Evangelista, A. C. J. (2018). A review of recycled aggregate in concrete applications (2000–2017). Construction and Building Materials, 172, 272–292. DOI 10.1016/j.conbuildmat.2018.03.240. [Google Scholar] [CrossRef]
3. Shi, C., Li, Y., Zhang, J., Li, W., Chong, L. et al. (2016). Performance enhancement of recycled concrete aggregate – A review. Journal of Cleaner Production, 112(2), 466–472. DOI 10.1016/j.jclepro.2015.08.057. [Google Scholar] [CrossRef]
4. Letelier, V., Tarela, E., Munoz, P., Moriconic, G. (2017). Combined effects of recycled hydrated cement and recycled aggregates on the mechanical properties of concrete. Construction and Building Materials, 132(1), 365–375. DOI 10.1016/j.conbuildmat.2016.12.010. [Google Scholar] [CrossRef]
5. Mi, R., Pan, G., Liew, K. M., Kuang, T. (2020). Utilizing recycled aggregate concrete in sustainable construction for a required compressive strength ratio. Journal of Cleaner Production, 276(2), 124249. DOI 10.1016/j.jclepro.2020.124249. [Google Scholar] [CrossRef]
6. Buyukozturk, O., Nilson, A. H., Slate, F. O. (1971). Stress-strain response and fracture of a concrete model in biaxial loading. ACI Materials Journal, 68(8), 590–599. [Google Scholar]
7. Maji, A. K., Shah, S. P. (1989). Application of acoustic emission and laser holography to study microfracture in concrete. ACI Materials Journal, 112, 83–110. [Google Scholar]
8. Choi, S., Shah, S. P. (1999). Propagation of microcracks in concrete studied with subregion scanning computer vision (SSCV). ACI Materials Journal, 96(2), 255–260. [Google Scholar]
9. Choi, S., Shah, S. P. (1997). Measurement of deformations on concrete subjected to compression using image correlation. Experimental Mechanics, 37(3), 307–313. DOI 10.1007/BF02317423. [Google Scholar] [CrossRef]
10. Lawler, J. S., Keane, D. T., Shah, S. P. (2001). Measuring three-dimensional damage in concrete under compression. ACI Materials Journal, 98(6), 465–475. [Google Scholar]
11. Tregger, N., Corr, D., Graham-Brady, L., Shah, S. P. (2006). Modeling the effect of mesoscale randomness on concrete fracture. Probabilistic Engineering Mechanics, 21(3), 217–225. DOI 10.1016/j.probengmech.2005.11.002. [Google Scholar] [CrossRef]
12. Xiao, J., Li, W., Corr, D. J. (2013). Effects of interfacial transition zones on the stress–strain behavior of modeled recycled aggregate concrete. Cement and Concrete Research, 52(6), 82–99. DOI 10.1016/j.cemconres.2013.05.004. [Google Scholar] [CrossRef]
13. Xiao, J., Li, L., Shen, L. (2015). Effects of strain rate on mechanical behavior of modeled recycled aggregate concrete under uniaxial compression. Construction and Building Materials, 93(1), 214–222. DOI 10.1016/j.conbuildmat.2015.04.053. [Google Scholar] [CrossRef]
14. Xiao, J., Li, W., Corr, D. J. (2013). Simulation study on the stress distribution in modeled recycled aggregate concrete under uniaxial compression. Journal of Materials in Civil Engineering, 25(4), 504–518. DOI 10.1061/(ASCE)MT.1943-5533.0000598. [Google Scholar] [CrossRef]
15. Li, W., Xiao, J., Sun, Z. (2012). Interfacial transition zones in recycled aggregate concrete with different mixing approaches. Construction and Building Materials, 35(6), 1045–1055. DOI 10.1016/j.conbuildmat.2012.06.022. [Google Scholar] [CrossRef]
16. Zheng, C., Lou, C., Du, G., Li, X., Liu, Z. et al. (2018). Mechanical properties of recycled concrete with demolished waste concrete aggregate and clay brick aggregate. Results in Physics, 9(3), 1317–1322. DOI 10.1016/j.rinp.2018.04.061. [Google Scholar] [CrossRef]
17. Hasan, A., Kibria, M. G., Hasan, F. M. M. (2019). Effects of incorporating recycled brick and stone aggregate as replacement of natural stone aggregate in concrete. International Journal of Engineering and Technology Innovation, 9(1), 38–48. [Google Scholar]
18. Pitarch, A. M., Reig, L., Tomas, A. E., Lopez, F. J. (2019). Effect of tiles, bricks and ceramic sanitary-ware recycled aggregates on structural concrete properties. Waste and Biomass Valorization, 10(6), 1779–1793. DOI 10.1007/s12649-017-0154-0. [Google Scholar] [CrossRef]
19. Bruck, H. A., McNeill, S. R., Sutton, M. A., Peters, W. H. (1989). Digital image correlation using Newton-Raphson method of partial differential correction. Experimental Mechanics, 29(3), 261–267. DOI 10.1007/BF02321405. [Google Scholar] [CrossRef]
20. Mata-Falcón, J., Haefliger, S., Lee, M., Galkovski, T., Gehri, N. (2020). Combined application of distributed fibre optical and digital image correlation measurements to structural concrete experiments. Engineering Structures, 225(1A), 111309. DOI 10.1016/j.engstruct.2020.111309. [Google Scholar] [CrossRef]
21. Harenberg, S., Pahn, M., Malárics‐Pfaff, V., Dehn, F. Caggiano, A. et al. (2019). Digital image correlation strain measurement of ultra-high-performance concrete-prisms under static and cyclic bending-tensile stress. Structural Concrete, 20(4), 1220–1230. DOI 10.1002/suco.201900033. [Google Scholar] [CrossRef]
22. Haddadi, H., Belhabib, S. (2008). Use of rigid-body motion for the investigation and estimation of the measurement errors related to digital image correlation technique. Optics and Lasers in Engineering, 46(2), 185–196. DOI 10.1016/j.optlaseng.2007.05.008. [Google Scholar] [CrossRef]
23. Sutton, M. A., Yan, J. H., Tiwari, V., Schreier, H. W., Orteu, J. J. (2008). The effect of out-of-plane motion on 2D and 3D digital image correlation measurements. Optics and Lasers in Engineering, 46(10), 746–757. DOI 10.1016/j.optlaseng.2008.05.005. [Google Scholar] [CrossRef]
 | This work is licensed under a Creative Commons Attribution 4.0 International License, which permits unrestricted use, distribution, and reproduction in any medium, provided the original work is properly cited. |