| Journal of Renewable Materials |
DOI: 10.32604/jrm.2021.014809
ARTICLE
Experimental and Theoretical Study on the Flexural Behavior of Recycled Concrete Beams Reinforced with GFRP Bars
1School of Civil Engineering, Liaoning University of Technology, Jinzhou, 121001, China
2Engineering Research Center of Continuous Extrusion, Dalian Jiaotong University, Dalian, 116028, China
*Corresponding Authors: Xiangqing Kong. Email: xqkong@lnut.edu.cn; Ying Fu. Email: 5117832@163.com
Received: 30 October 2020; Accepted: 23 November 2020
Abstract: This paper experimentally investigated the flexural behavior of reinforced recycled aggregate concrete (RAC) beams reinforced with glass fiber-reinforced polymer (GFRP) bars. A total of twelve beams were built and tested up to failure under four-point bending. The main parameters were reinforcement ratio (0.38%, 0.60%, and 1.17%), recycled aggregate replacement ratio (R = 0, 50%, and 100%) and longitudinal reinforcement types (GFRP and steel). The flexural capacity, failure modes, flexibility deformation, reinforcement strains and crack distribution of the tested beams were investigated and compared with the calculation models of American code ACI 440.1-R-15, Canadian code CSA S806-12 and ISIS-M03-07. The tested results indicated that the reinforcement ratio has great influence on the ultimate load, crack width and deflection of GFRP-RAC beams, the recycled aggregate replacement ratio has little influence on it. However, it was found that the reinforcement ratio has no obvious influence on the cracking load which was only related to the recycled aggregate replacement ratio. The average cracking load decreased by 5% and 15% as the recycled aggregate replacement ratio increased from 0 to 50% and 100%. For the steel-RAC beams, the ultimate load was found to be about 1/2 of the ultimate load of GFRP-RAC beam under the same condition and the trend of strain, deflection and crack width were different from GFRP-RAC beams. This is due to the different material properties of GFRP bars and steel rebar. On the other hand, the calculation results showed that ACI 440.1-R-15 and CSA S806-12 underestimated the ultimate load of GFRP-RAC beams. Moreover, the deflection prediction of GFRP-RAC beams by CSA S806-12 is relatively accurate compared with ACI 440.1-R-15 and ISIS-M03-07. As for the prediction of crack width, the results of ACI 440.1-R-15 prediction were in good agreement with the experimental results at the ultimate load, with the average value of 1.09 ± 0.28.
Keywords: GFRP bars; recycled aggregate concrete; replacing ratio; flexural capacity; reinforcement ratio
In recent decades, the problems of structural safety and high maintenance costs caused by steel bar corrosion have attracted much attention. To prevent reinforcement corrosion, Fiber Reinforcement Polymer (FRP) bars are used in special environments [1]. Compared to traditional steel bars, FRP bars have the advantages of lightweight, high strength, corrosion resistance, fatigue resistance, non-magnetic characteristics and so on [2–5]. In order to accelerate the application of FRP-reinforced concrete structures in actual engineering, a series of experimental studies and theoretical analyses of the flexural performance of FRP-reinforced concrete beams were performed [6–12]. Adam et al. [1] experimentally studied the flexural behavior of nine concrete beams reinforced with glass fiber reinforced polymer (GFRP) bars, and the study showed that as the reinforcement ratio increases, the deflection and crack width of the GFRP-RC beams decrease obviously. Rafi et al. [5] carried out a flexural test on concrete beams reinforced with carbon fiber reinforced polymer (CFRP). They found that the flexural performance of CFRP reinforced concrete (RC) beams were in many ways similar to the steel-RC beams. Elgabbas et al. [6] investigated the bending performance of six concrete beams reinforced with basalt fiber-reinforced polymer (BFRP) and concluded that the BFRP-RC beams exhibited bilinear behavior of strain and deflection till failure. Similarly, Tomlinson et al. [7] assessed the structural behavior of BFRP-RC beams and indicated that the strengths of BFRP-RC beams were about 2.6–2.9 times higher than that of the steel-RC beams under the same conditions. In another investigation, Kara et al. [8] numerically studied the flexural capacity of FRP-RC members. Their results showed that an increase of FRP bars has little influence on moment capacity, but has a greater effect on the deflection after initial cracking.
At present, most of the researches on FRP bars only considers the application of FRP bars in natural concrete and relatively few studies on FRP bars in other types of concrete [13]. In recent years, with the further acceleration of economic construction, a large amount of construction waste has caused a lot of problems such as reduction of arable land area and environmental pollution. Therefore, the application and development of recycled concrete have attracted widespread attention [14,15]. The recycled concrete as a raw material to make recycled aggregate can realize the recycling of construction waste, not only save natural resources, but also protect the ecological environment, and reduce construction waste in the process of urbanization, which is an important part of a sustainable development strategy [16]. Consequently, it has attracted many research interests. In particular, there have been many kinds of research on the performance of members made with recycled aggregate concrete (RAC) [17–25]. For example, Ignjatović et al. [17] experimentally evaluated the flexural behavior of nine steel-RAC beams. Results indicated that compared to the natural aggregate concrete beams, the service and ultimate loading of RAC beams are both satisfactory. Sato et al. [18] tested 37 RC beams produced by 100% RAC to investigate the flexural performance and indicated the possibility of using recycled concrete into RC structures under the proper design. Knaack et al. [19] examined the structural performance of 24 RAC beams. It’s found that the recycled aggregate has little effect on the strength of concrete. However, with the increased of recycled aggregate replacement ratio, the initial stiffness of the RAC beams is considerably decreased and the ultimate deflection is increased. Similarly, Kang et al. [22], Seara-Paz et al. [23], and Arezoumandi et al. [24] also investigated the flexural behavior of RAC beams, respectively.
It should be noted that all of the RAC beams in these studies mentioned above are reinforced with steel reinforcing; however, few studies have been conducted to investigate the structural performance of RAC beams reinforced with FRP bars (FRP-RAC beams). Thus, this paper designs nine GFRP-RAC beams and three steel-RAC beams for flexural performance tested. The effects of recycled aggregate replacement ratio, longitudinal reinforcement ratio, and longitudinal reinforcement types on the flexural performance of GFRP-RAC beams were analyzed. Based on the calculation formulas of ACI 440.1-R-15 [26], CSA S806-12 [27], and ISIS-M03-07 [28], the cracking moment, flexural capacity, crack width, and deflection of GFRP-RAC beams are compared and analyzed.
The GFRP bars with a diameter of 8, 10, and 14 mm which have a sand-coated surface (Fig. 1a) were used as longitudinal tension reinforcement in GFRP-RAC beams. The grade of steel bars used in the experiment was HRB 335. The physical and mechanical properties of FRP bars and steel bars were shown in Tab. 1. The cement used in the tested was Bohai ordinary Portland cement, with a strength grade of 42.5 and a density of 3 g/cm3. Fine aggregate was natural medium and coarse river sand with a fineness modulus of 2.52. Recycled coarse aggregate was obtained from construction wastes in the structure laboratory after crushing, screening, and cleaning by a crusher, as shown in Fig. 1b. It was continuously graded with particle size ranging from 5 mm to 20 mm. Natural coarse aggregate was made of gravel with particle size ranging from 5 mm to 20 mm. Tab. 2 shows the mixed proportion of recycled concrete. Tab. 3 shows the modulus of elasticity and compressive strength of the different recycled aggregate replacement ratio (R = 0%, 50%, and 100%).
Table 1: Tensile properties and bond strength of FRP and steel bars
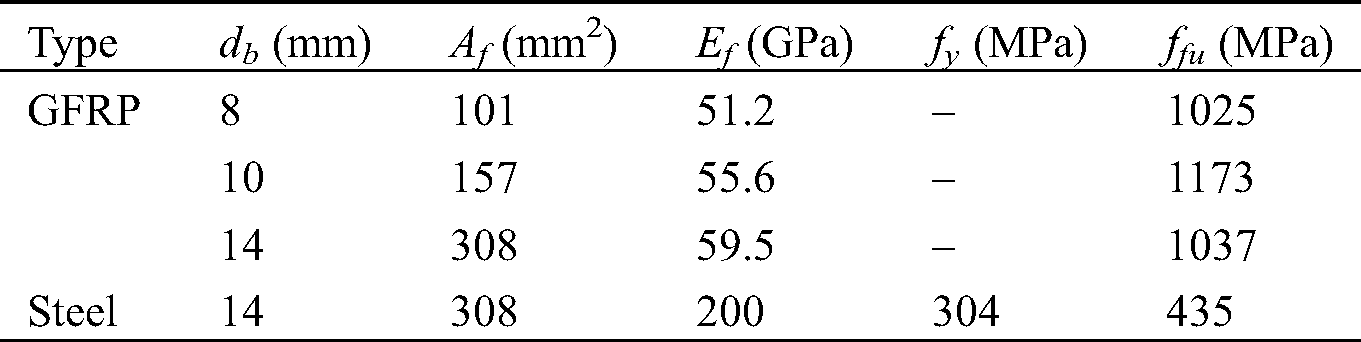
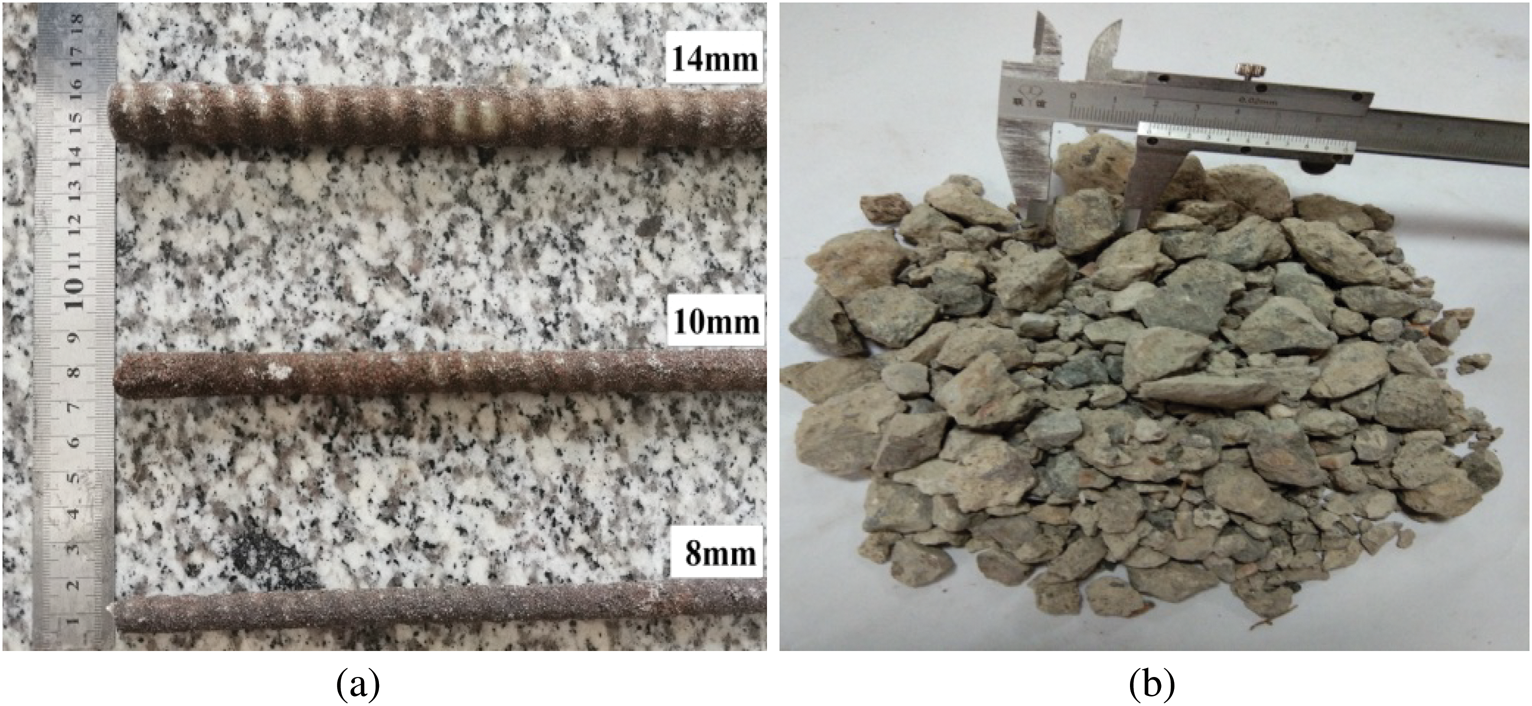
Figure 1: The material of Experiment: (a) Glass FRP bars, (b) Recycled coarse aggregate

Table 3: Mechanical properties of concrete

A total of 12 full-scale simply supported beams were cast and experimentally tested under four-point bending, including 9 RAC beams reinforced with GFRP bars and 3 reference beams reinforced with steel bars. The tested parameters were types of bars (GFRP and steel), reinforcement ratio (ρf = 0.38%, 0.60% and 1.17%) and recycled aggregate replacement ratio (R = 0%, 50%, 100%), as shown in Tab. 4. All the tested beams were 150 mm wide, 200 mm deep, and 2100 mm long. Besides, the effective span of the tested beams was 1800 mm, and the clear shear span of 600 mm. The tested beams were reinforced with two 8 mm steel bars that were provided as top reinforcement and the bottom reinforcement was GFRP bars with different bar diameters (8 mm, 10 mm, and 14 mm). The tested beams were designed with closely spaced steel stirrups in the shear spans to avoid shear failure, while in the constant moment zone, no stirrups were provided. Fig. 2 shows the details for all specimens.
Table 4: Reinforcement details of beam specimens
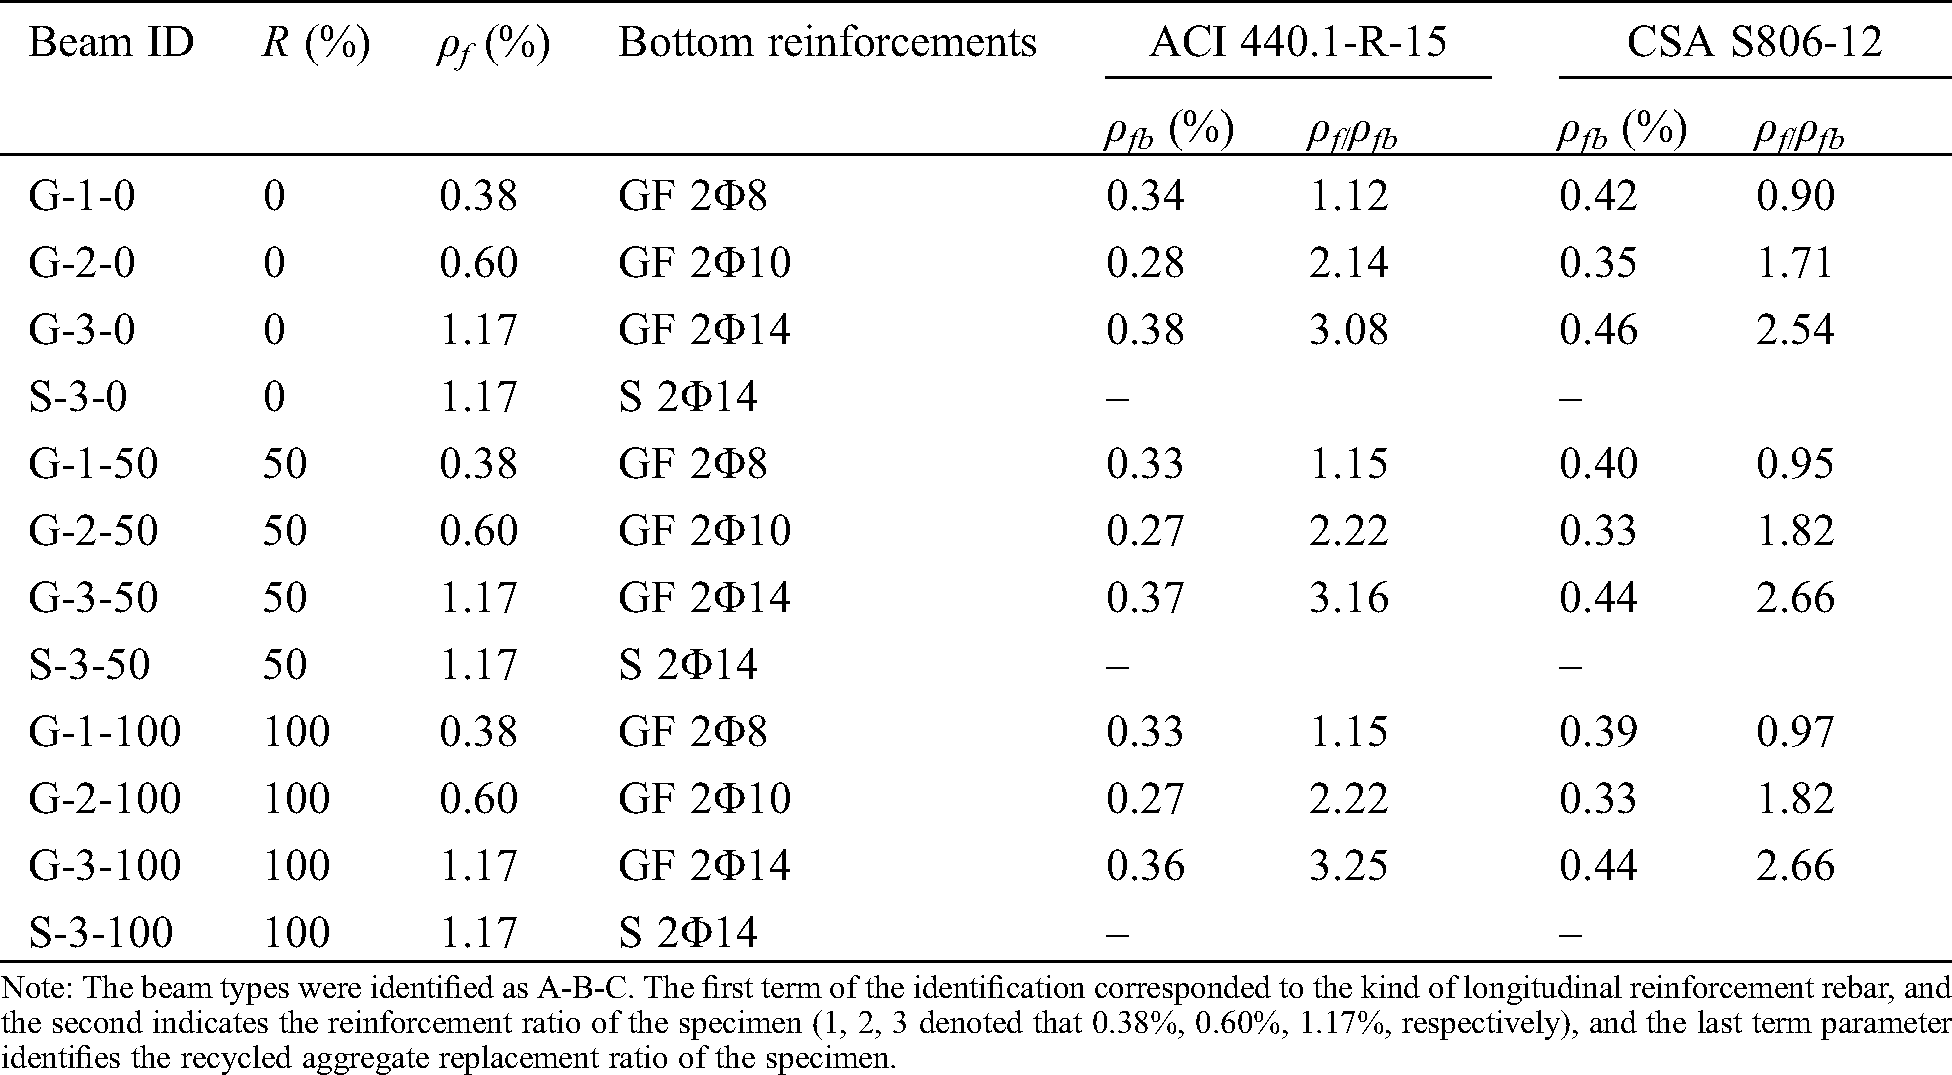

Figure 2: Layout of set up and test device diagram
2.3 Instrumentation and Testing
The experiments were carried through a 5000 kN electro-hydraulic servo universal testing machine with a gradual loading process. The test operation should be strictly according to the GB 50152-82-92 [29]. The longitudinal tension reinforcement bars were instrumented six electrical resistance strain gauges at different locations, and two electrical resistance strain gauges were instrumented at the compression zone concrete of tested beams to measure concrete strain, as shown in Fig. 2. Also, five vertical linear displacement gauges (VLDG) were provided to measure the mid-span deflection of test specimens.
During the experimental process, all the GFRP-RAC beams were found to show a similar behavior before cracking. The first crack appeared in the middle of the constant moment region and the corresponding cracking load was recorded. The cracking load can also be demonstrated by the load-strain and load-deflection curve relationships. Tab. 5 provides the cracking loads of all the tested beams. It can be seen that the cracking loads decreased with the increased of the recycled aggregate replacement ratio. While the reinforcement ratio has no remarkable affect on the cracking load. This is because the cracking load is directly related to the concrete tensile strength, which is a function of the compressive strength. Therefore, the cracking load is closely related to the concrete compressive strength. For the tested beams with the recycled aggregate replacement ratio R = 0, the cracking load ranged from 11.8 kN to 12.7 kN with an average of 12.2 kN. While for the tested beams with the recycled aggregate replacement ratio R = 50% and 100%, the cracking load ranged from 11.2 kN to 11.8 kN and 10.1 kN to 10.6 kN with an average of 11.6 kN and 10.4 kN, respectively. The cracking load was predicted using Eq. (1), where fr was calculated from Eq. (2a) for ACI 440.1-R-15 and Eq. (2b) for CSA S806-12 and ISIS-M03-07.


Tab. 5 also shows the cracking load comparison between experimental and predicted values. The average cracking load of the GFRP-RAC (R = 0) beams was highly consistent with ACI 440.1-R-15 and CSA S806-12, and the experimental-to-predicted ratio was 0.91 and 0.94, respectively. The average cracking load of the GFRP-RAC (R = 50%) beams was slightly lower than those predicted, the experimental-to-predicted ratio was 0.88 and 0.92, respectively. While for the GFRP-RAC (R = 100%), the experimental-to-predicted ratio was 0.80 and 0.83, respectively. As can be seen from the comparison results of all the tested beams, CSA S806-12 provided slightly better predictions of cracking load than ACI 440.1-R-15, because CSA S806-12 has a smaller modulus of rupture. Similar results were reported for the cracking moments of GFRP-RC beams [3]. Therefore, the cracking load of the GFRP-RAC beams was generally 20% and 17% lower than predicted with ACI 440.1-R-15 and CSA S806-12.
Table 5: Experimental and predicted cracking and ultimate load
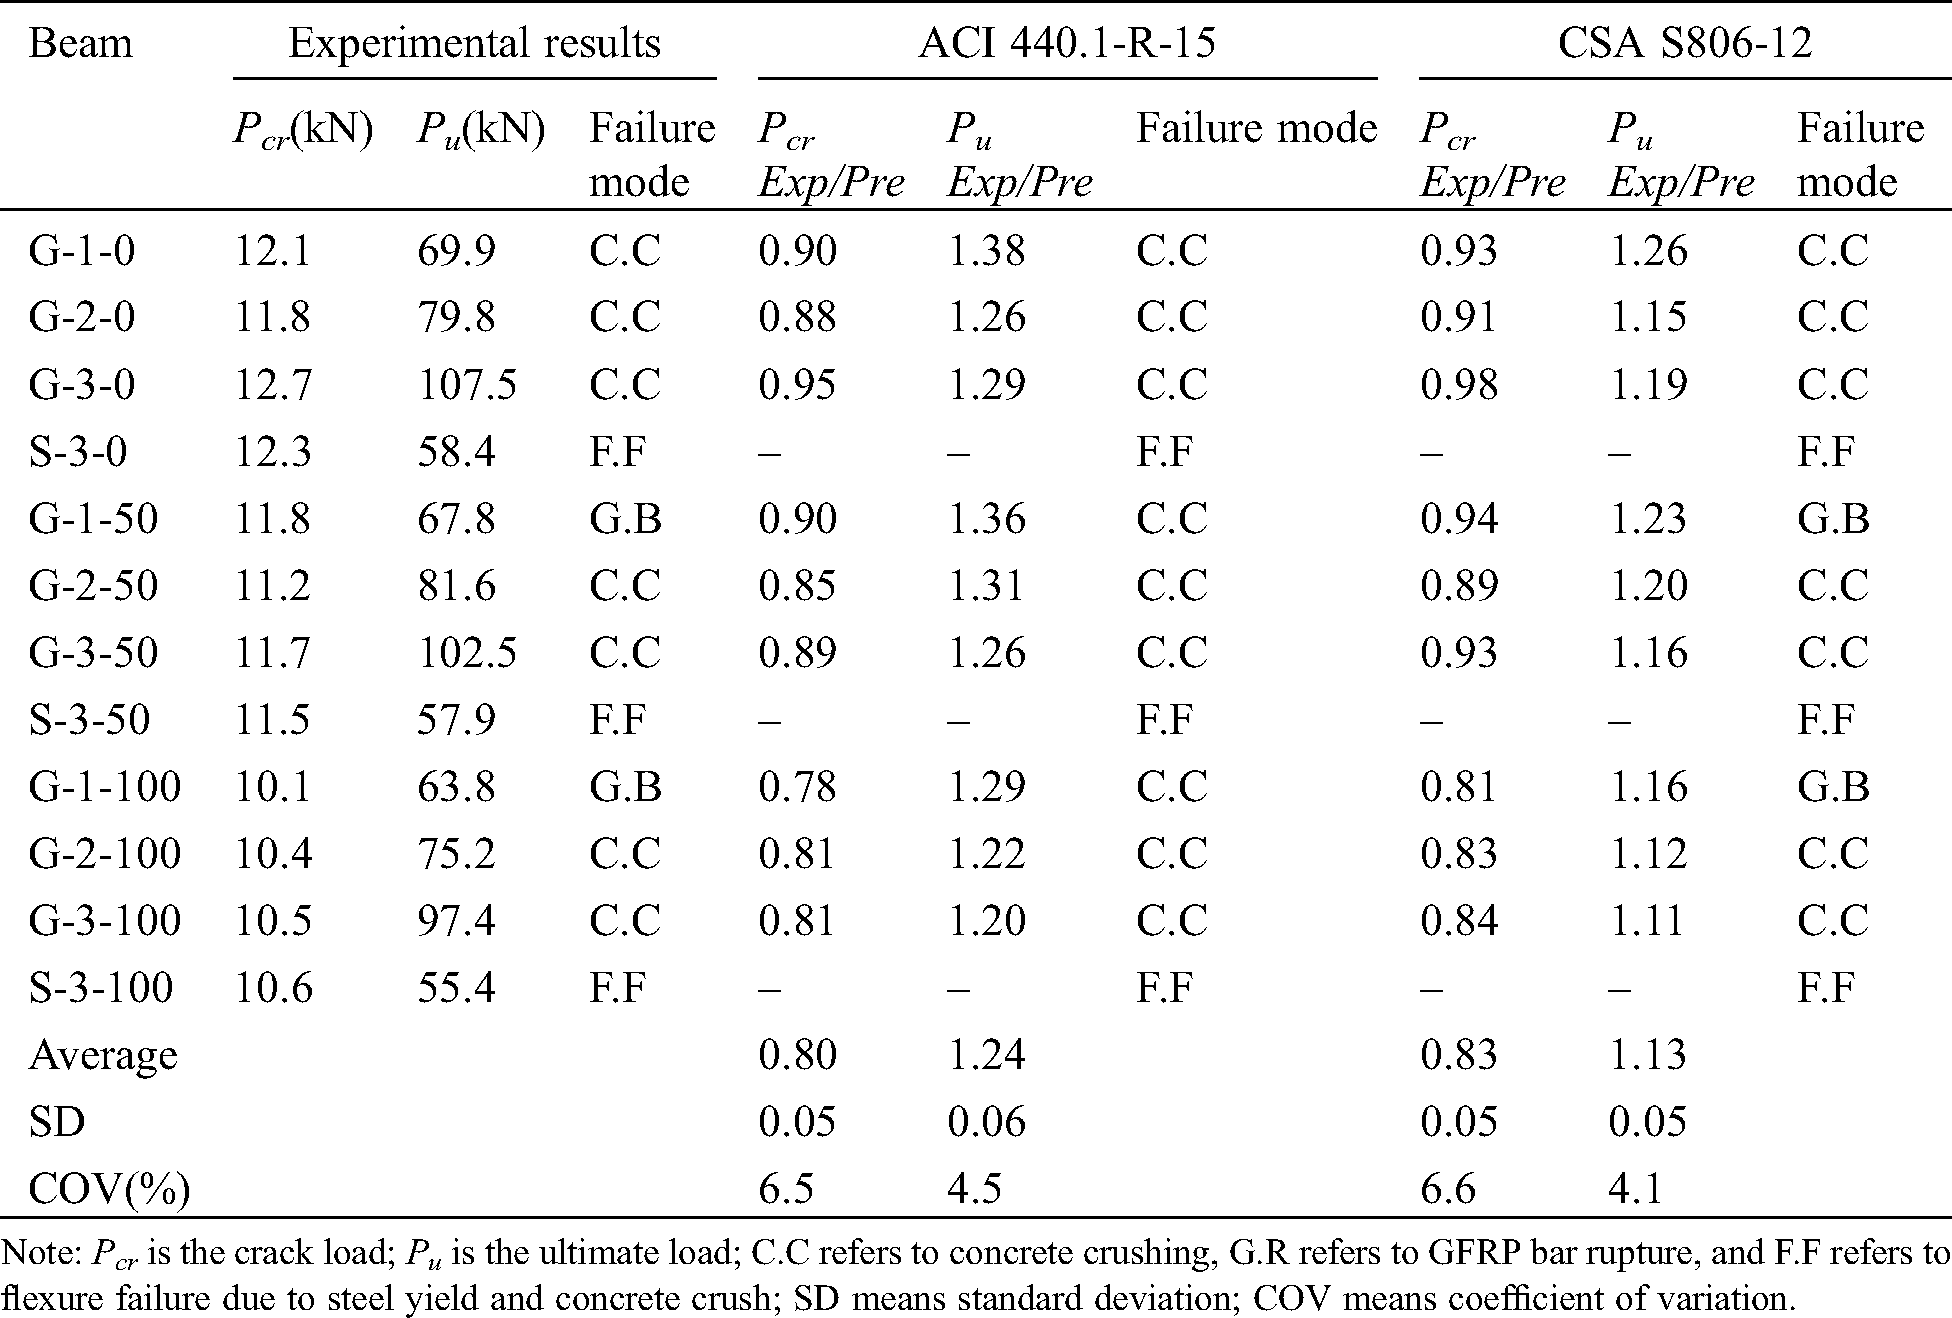
Note: Pcr is the crack load; Pu is the ultimate load; C.C refers to concrete crushing, G.R refers to GFRP bar rupture, and F.F refers to flexure failure due to steel yield and concrete crush; SD means standard deviation; COV means coefficient of variation.
All the GFRP-RAC beams were designed to fail by tension failure and concrete crushing. This is the common design concept for GFRP-RAC sections according to ACI 440.1-R-15 and CSA S806-12. The failure modes of GFRP-RAC beams depend on the relationship between the actual reinforcement ratio and the balanced reinforcement ratio. The balance reinforcement ratios were calculated with Eq. (3). The terms α1 and β1 were computed from Eqs. (4) and (5) for ACI 440.1-R-15 and CSA S806-12, respectively.


The failure modes of all the tested beams were shown in Tab. 5. As anticipated, the tested beams reinforced with steel bars as control beams failed in flexure by bottom steel yielding and top concrete crushing. However, the failure of GFRP-RAC beams was divided into concrete crushing in the compressive zone and tension failure at the region of maximum bending moment, as shown in Fig. 3.

Figure 3: Typical failure modes of the tested beams. (a) Rupture of GFRP reinforcement bars; (b) Crushing failure of concrete
Tensile failure was due to the sudden rupture of GFRP bars at the maximum bending moment (Fig. 3a), it occurs in GFRP-RAC beams with lower reinforcement ratio (except for G-1-0 beam, which failure mode is concrete crushing). At the failure loading, the GFRP bars suddenly failure without a visible sign. Simultaneously, during the tested, the friction sound of the GFRP bar and RAC could be clearly heard. Adam et al. [1] and Goldston et al. [12] recorded the same type of failure modes in the FRP reinforced concrete beams. Concrete crushing was the most common failure mode, occurring in GFRP-RAC beams with a larger reinforcement ratio (ρf = 0.6% and 1.17%), which exhibits some warning before failure. The failure modes of GFRP-RAC beams were shown in Fig. 3b. The results are in good agreement with a study by Adam [1]. It is worth mentioning that, the GFRP-RAC beams with a larger reinforcement ratio recovered most of the deformation after unloading.
Tab. 5 presents the ultimate load of all the tested beams. It is found that the ultimate load of the GFRP-RAC beams increased with the increased of the reinforcement ratio. Take the GFRP-RAC beams containing 100% of recycled aggregate (R = 100%) as an example, increasing the reinforcement ratio from 0.38% to 0.60% and 1.17% increased the ultimate load from 63.8 kN to 75.2 kN and 97.4 kN (17.9% and 52.7%). Similarly, the same results were found for the GFRP-RAC beams (R = 0% and 50%). When the reinforcement ratio increased from 0.38% to 0.60% and 1.17%, the ultimate load increased by 14.2%, 53.8%, and 20.4%, 51.2%, respectively. Therefore, increasing the reinforcement ratio can significantly increase the ultimate load of GFRP-RAC beams. This is because with the increased of the reinforcement ratio, the tensile capacity of the tensile zone increased, and the failure mode of the tested beams change from tensile failure to compression failure. With the further increased of the reinforcement ratio, the height of the compression zone and the compression capacity of the tested beams increased, and the ultimate capacity was still greatly improved. Therefore, increasing the reinforcement ratio of BFRP bars is an effective way to improve the ultimate capacity of BFRP-RAC beams.
In contrast, the ultimate load of the GFRP-RAC beams tends to decrease with the increased of the recycled aggregate replacement ratio. For the GFRP-RAC beams (ρf = 1.17%), the ultimate load decreased by 5%, and 10% when the recycled aggregate replacement ratio increased from 0 to 50% and 100%. Compared with the GFRP-RAC beams with a reinforcement ratio of 0.38%, it was decreased by 3% and 9%, respectively. Similar behavior was found for the steel-RAC beams. Moreover, for the GFRP-RAC beams (ρf = 0.60%), the ultimate load decreased by 6% when the recycled aggregate replacement ratio was increased by 100%. However, the ultimate load increased slightly when the recycled aggregate replacement ratio increased by 50%. Overall, however, the trend was decreased. The reason is that the compressive strength of recycled concrete is lower than that of ordinary concrete in the compression zone, and there are fine cracks in the processing of recycled coarse aggregate, which led to the internal defects of recycled concrete and the compressive strength decreased.
Furthermore, compared with different types of longitudinal reinforcement, it was found that under the same conditions, the ultimate load of GFRP-RAC beams is obviously higher than that of steel-RAC beams. For the group of specimens with recycled aggregate replacement ratio R = 100%, beam G-100-3 failed at 97.4 kN, the value of which is higher than beam S-3-100 (55.4 kN). This is attributed to the higher tensile strength for GFRP bars compared with steel bars.
The ultimate load of the GFRP-RAC beams was predicted using Eqs. (6) and (7) (for ACI 440.1-R-15 and CSA S806-12) and compared with the experimental values. Tab. 5 presents the experimental-to-predicted ultimate load of the GFRP-RAC beams and the average values were 1.24 ± 0.06 and 1.13 ± 0.05 for ACI 440.1-R-15 and CSA S806-12, respectively. The predicted results show that ACI 440.1-R-15 and CSA S806-12 are conservative in predicting the ultimate load for GFRP-RAC beams. This is an agreement with the observations reported by Elgabbas et al. [6] for BFRP-RC beams. The difference between ACI 440.1-R-15 and CSA S806-12 in predicting the experimental results is due to the difference between β1 and the assumed ultimate strain of concrete, which is 0.003 for ACI 440.1-R-15 and 0.0035 for CSA S806-12, respectively. Therefore, CSA S806-12 provides a more reasonable ultimate load for GFRP-RAC beams compared with the ACI 440.1-R-15.
When  ,
,


When  ,
,


3.4 Strain in Reinforcement and Concrete
The load-strain curves in the tensile reinforcing bars and the compression concrete zone, as shown in Fig. 4. Generally, the GFRP-RAC beams show a typical bilinear load-strain curves relationship. In the first stage, the beam does not crack and FRP rebar and RAC work together to bear the tensile forces. The strain of GFRP bars increased slowly with the increased in the load. However, the curves slope sudden change at cracking. This is in agreement with the results reported for different types of FRP bars in concrete beams [25]. In the second stage, the concrete cracks in the tensile zone are further aggravated, the tensile reinforcing bars begin to bear the stress independently, and the tensile reinforcement strain increased significantly. In contrast, for the steel-RAC beams, it was observed that the load-strain curve consists of three stages. The steel-RAC beams showed a similar relationship followed by a yield stage, which is determined by material properties.

Figure 4: Load-strain curves of the tested beams
Figs. 4a–4c show the load-strain curves under the different reinforcement ratio. It can be seen that both the tensile strains in the GFRP bars and the compressive strains in the concrete decreased with the reinforcement ratio increased at the same load level. In the case of the GFRP-RAC (R = 100%) beams, increasing the reinforcement ratio from 0.38% to 0.60% and 1.17%, the strain of GFRP bars decreased from 19768 με to 15214 με and 12679 με, which reduced by approximately 23% and 36%, respectively. In addition, the strain of concrete decreased from 3790 με to 2786 με and 1938 με, which reduced by approximately 26% and 49%, respectively. Similar behaviors were observed for the GFRP-RAC beams (R = 0 and 50%).
On the other hand, the load-strain curves with the different recycled aggregate replacement ratios were shown in Fig. 4d. It indicates the recycled aggregate replacement ratio has no significant effect on the load-strain behavior of GFRP-RAC beams with a low reinforcement ratio, while the influence on GFRP-RAC beams with high reinforcement ratio is slightly greater. The reasons for this phenomenon are: Due to the reinforcement ratio is low, the failure of GFRP-RAC beams is mainly determined by the tensile strength of GFRP bars. When reaching the limit state, concrete in compression zone does not exert its material properties. While the reinforcement ratio is high, the damage of GFRP-RAC beam is controlled by the crushing failure of concrete in the compression zone, so the longitudinal reinforcement strain of GFRP-RAC beams with a high reinforcement ratio is greatly affected by the recycled aggregate replacement ratio. In addition, the elastic modulus of recycled concrete is small, the strain of recycled concrete is large under the same load level, so the strain of longitudinal reinforcement is also large.
Figs. 4a–4c also show the load-strain curves of different types of longitudinal bars. Due to the GFRP bars relatively lower elastic modulus compared with a steel bar, the slope of the load-strain curve of steel-RAC is smaller than that of GFRP-RAC before the steel yielding. However, once the steel-RAC beams reached the yielding load (the corresponding strain of approximately 2000 με), the steel bars and the concrete strains increased rapidly.
As seen in Fig. 5, the mid-span load-deflection curve of GFRP-RAC beams is a typical bilinear relationship, and the cracking point is the turning point. The first stage of the curve represents the behavior of the un-cracked beams. In this stage, the deflection curve of the GFRP-RAC beams shows a nearly similar relationship due to the influence of reinforcement ratio and elastic modulus on the gross moment of inertia of the beams can be neglected. The second stage represents the behavior of the cracked beams, in which all the GFRP-RAC beams exhibited decreased post-cracking stiffness until failure. Also, the Fig. 5 also shows a typical trilinear load-deflection relationship for steel-RAC beams, which consisted of three sections: Straight-line section, curve section, and horizontal section. The above results are in good agreement with a study by Adam [1].

Figure 5: Load-deflection curves of the tested beams
The mid-span load-deflection relationship of the tested beams was presented in Figs. 5a–5c. As expected, the deflection of the GFRP-RAC experienced a significantly decreased with the increased of the reinforcement ratio. For the GFRP-RAC beams (R = 100%), at the same load level (63.8 kN, the ultimate load of G-1-100), the reinforcement ratio increased from 0.38% to 0.6% and 1.17%, and the deflection of GFRP-RAC beams decreased by 26% and 60%, respectively. Similarly, for the GFRP-RAC beams (R = 50%), at the same load (67.8 kN, the ultimate load of G-1-50), the deflection of GFRP-RAC beams decreased by 28% and 59%; for the GFRP-RAC beams (R = 0), at the same load (69.9 kN, the ultimate load of G-1-0), the deflection of GFRP-RAC beams decreased by 39% and 68%, respectively. The reason is that when the reinforcement ratio is higher, the section stiffness of the beam is larger. So it can be seen that the reinforcement ratio has a significant impact on the deflection for the GFRP-RAC beams.
In addition, the study found that with the increased of the recycled aggregate replacement ratio, the deflection of the tested beams tends to decrease, but the influence was not significant. As shown in Fig. 5d, for the GFRP-RAC beams (ρf = 1.17%), at 97.4 kN (the ultimate load of G-3-100), the mid-span deflections were 26.8 mm, 30.8 mm, and 34.1 mm for beams G-3-0, G-3-50 and G-3-100, respectively. This is because the recycled coarse aggregate itself adheres to the old mortar, which reduces the elastic modulus of the recycled coarse aggregate, further leading to a reduction in its resistance to deformation and a large degree of deflection. Similarly, for the GFRP-RAC beams (ρf = 0.60%), at 75.2 kN (the ultimate load of G-2-100), the mid-span deflection was 39.7 mm, 41.7 mm, and 46.5 mm for beams G-2-0, G-2-50, and G-2-100, respectively. However, for GFRP-RAC beams (ρf = 0.38%), the G-1-0 mid-span deflection is slightly larger. This may be due to the different failure modes.
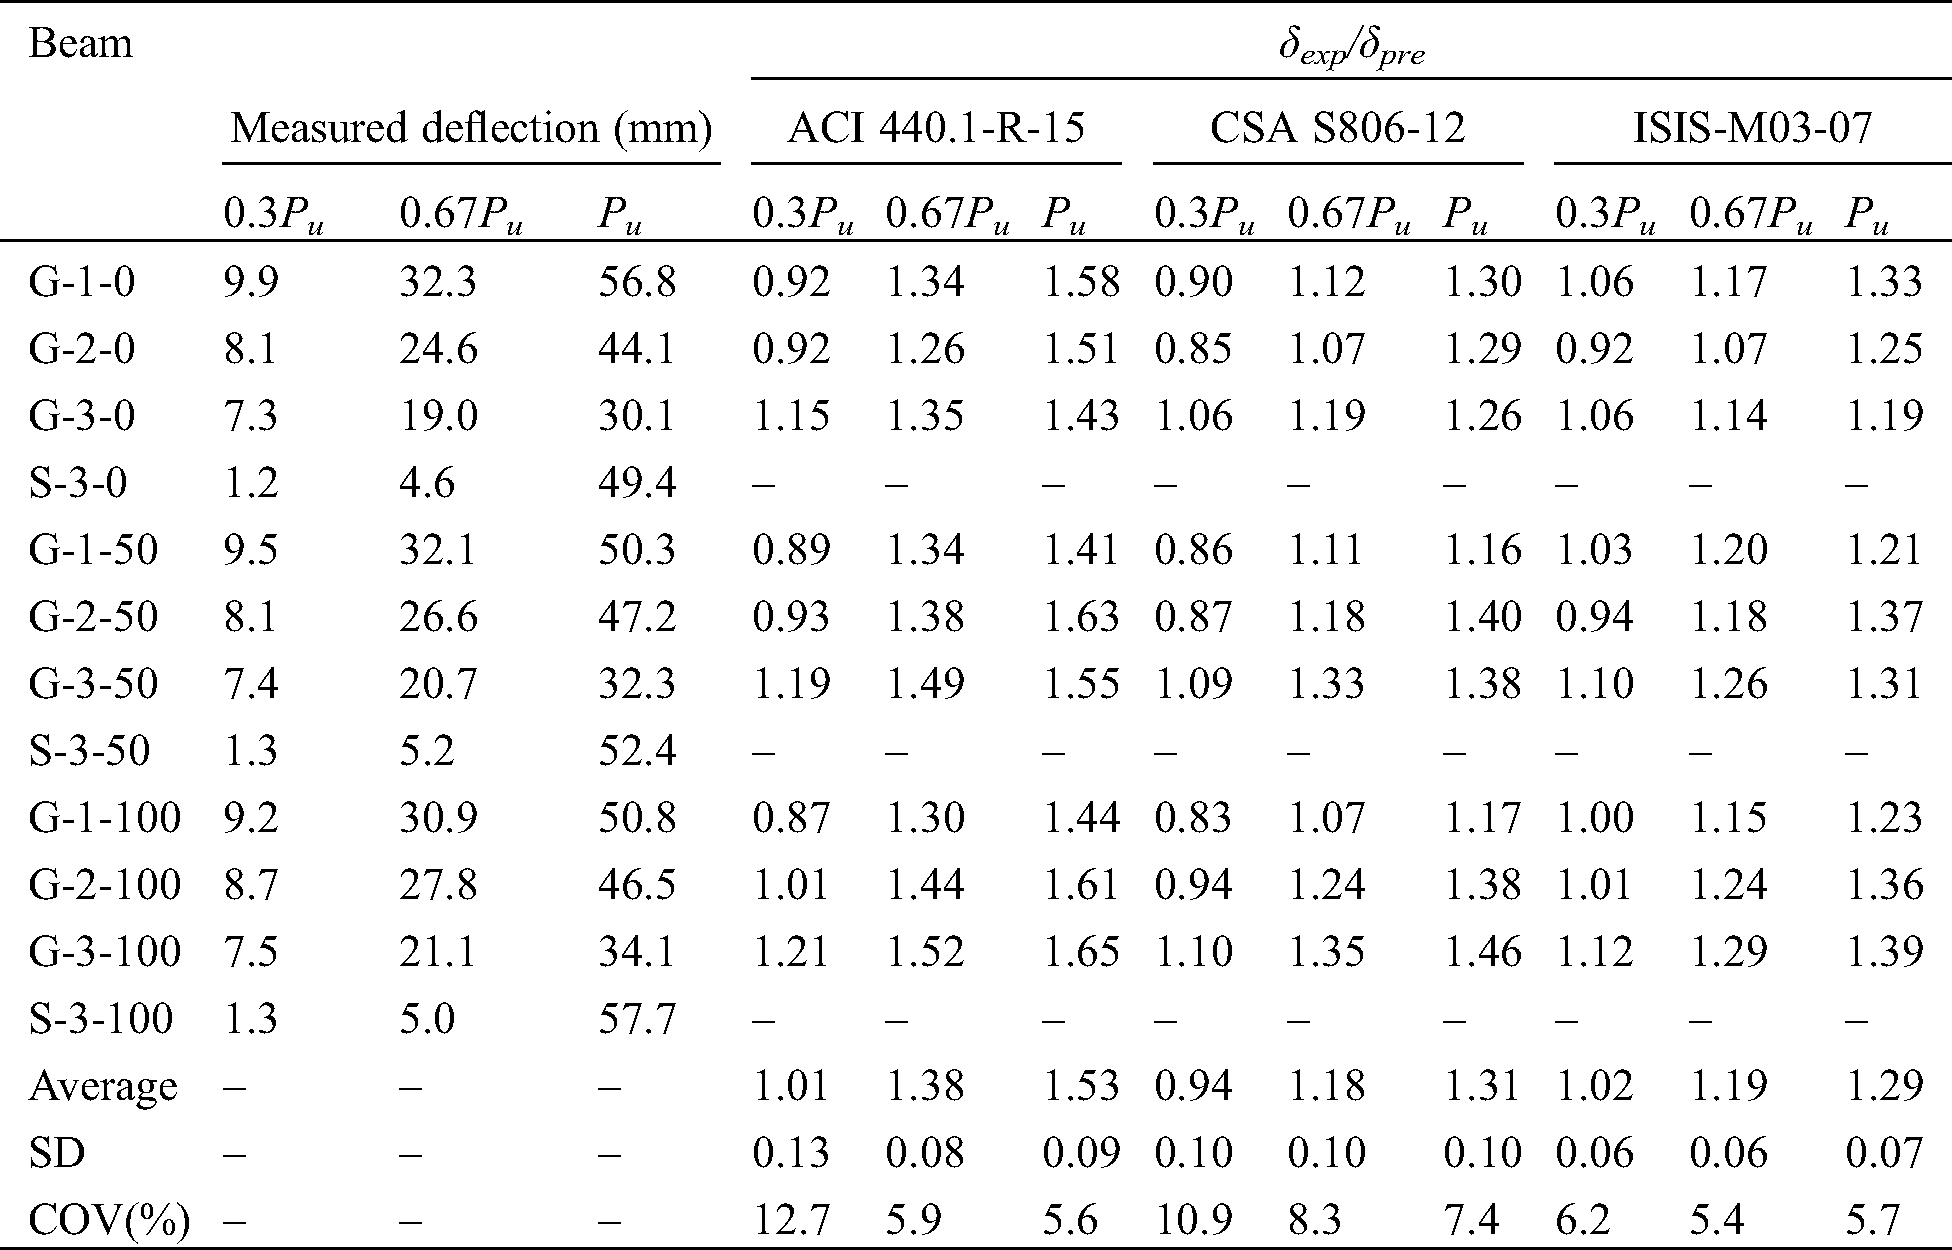
On the other hand, compared with the GFRP-RAC beams, steel-RAC beams have relatively small deflection deformation before the steel yielding. As shown in Tab. 6, at service load (0.3Pu), larger deflection in the order of 5.7-6.1 times that of the steel-RAC beams. This is because steel bars have a higher elastic modulus than FRP bars. However, the deflection increased rapidly after the steel bar yielding, which was attributed to the difference in mechanical properties of steel bar and GFRP bars.
Table 6: Experimental to predicted deflection ratio
3.6 Crack Propagation and Crack Width
Fig. 7 shows and depicts the crack propagation of the tested beams, which followed the traditionally flexural cracking patterns of simply supported beams. All the GFRP-RAC beams showed a similar cracking development. The first crack appeared in the pure bending zone. As the load increased, more cracks began to appear in the pure bending zone and extend vertically toward the compression zone. At the same time, inclined cracks appeared in the shearing zone and developed toward the loading point. Moreover, the existing cracks have begun to widen, especially the first formed crack. As expected, increasing the reinforcement ratio can enhance the cracking performance characterized by smaller crack width and better distribution. In addition, the study also found that with the increased of the recycled aggregate replacement ratio, the number of cracks increased and the crack spacing decreased. On the other hand, the crack development characteristics of steel-RAC beams and GFRP-RAC beams are different. Once the GFRP-RAC beams are cracked, the crack propagation speed is observed to be faster than the steel-RAC beams. This may be because of the relatively small elastic modulus of FRP bars, which results in a significant decrease in stiffness after cracking. As shown in Fig. 6, for the GFRP-RAC beams, the crack width varied linearly. However, the relationship was bilinear in the case of steel-RAC beams.

Figure 6: Load-crack width relationship for the tested beams

Figure 7: Crack patterns and crack propagation
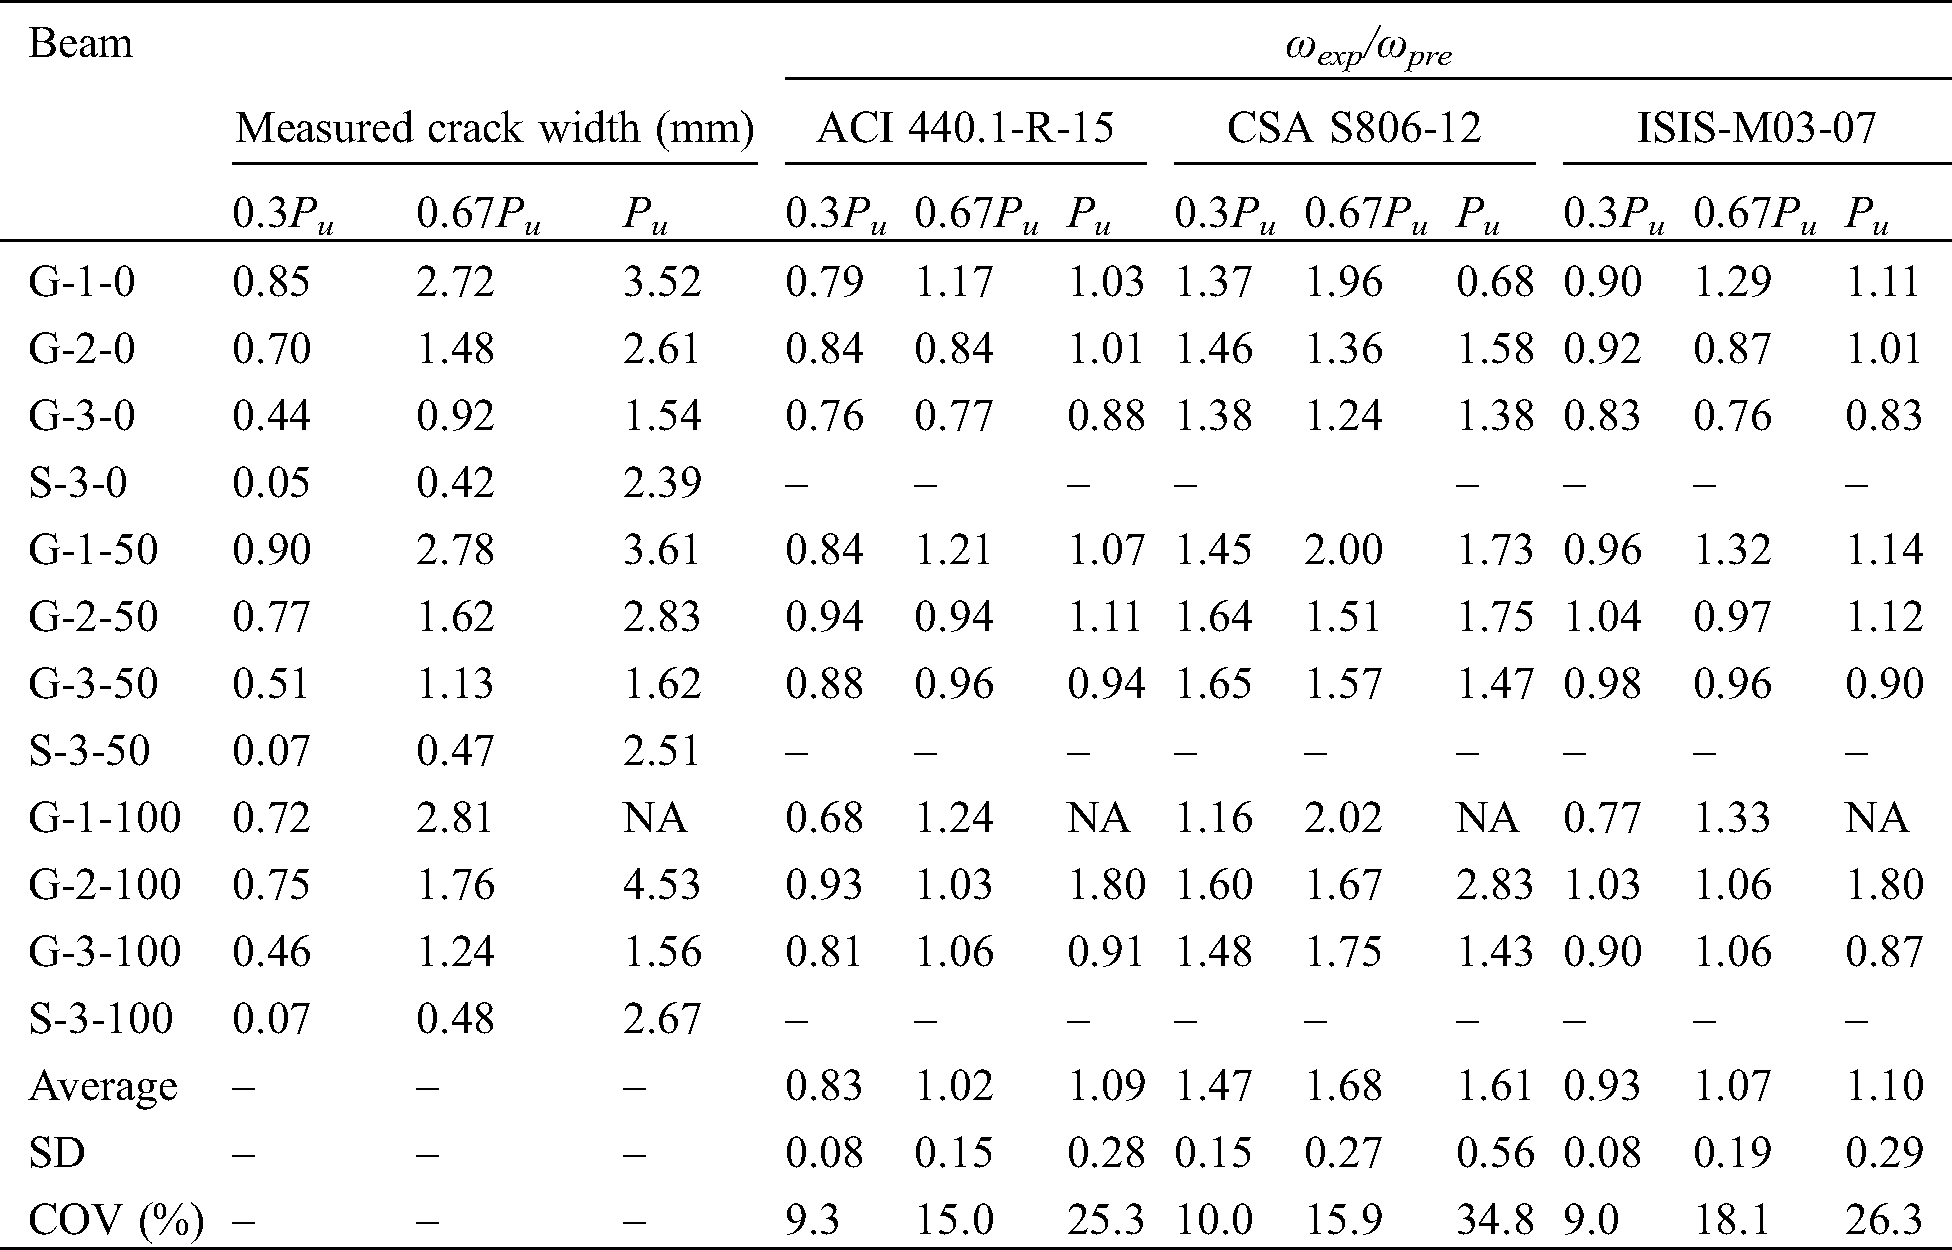
Fig. 6 shows the load-crack width curves for all the tested beams, and Tab. 7 presents the values of crack width under different loads. The crack widths of GFRP-RAC beams were greatly affected by the reinforcement ratio. At a load of 40 kN, increasing the reinforcement ratio from 0.38% to 0.60% and 1.17%, the crack width was 1.61 mm, 0.91 mm, and 0.44 mm for the GFRP-RAC beams (R = 100%). While the crack width was 1.35 mm, 0.82 mm, and 0.46 mm for the GFRP-RAC beams (R = 50%). Also, for the GFRP-RAC beams (R = 0), the crack width recorded values of 1.28 mm, 0.74 mm, and 0.42 mm, respectively. However, it was less affected by the recycled aggregate replacement ratio. It can also be seen in Fig. 6d that the crack width slightly increased with the increased of the recycled aggregate replacement ratio. For the GFRP-RAC beams (ρf = 0.38%), at a load of 40 kN, the crack width tends to decrease by 6% and 26% when the recycled aggregate replacement ratio increased from 0 to 50 and 100%. Furthermore, similar conclusions were obtained for the GFRP-RAC beams with reinforcement ratios of 0.60% and 1.17%.
Table 7: Experimental to predicted crack widths ratio
On the other hand, comparing the crack widths of tested beams with different longitudinal reinforcement types. It can be seen from Fig. 6 that before the steel bar yielded, the crack width of the GFRP-RAC beam was larger than that of the steel-RAC beam. After the load reached 45 kN (the steel bar yielding), the crack widths of steel-RAC beams increased significantly, while the crack widths of GFRP-RAC beams developed relatively slow.
4 Deflection and Cracking Provision
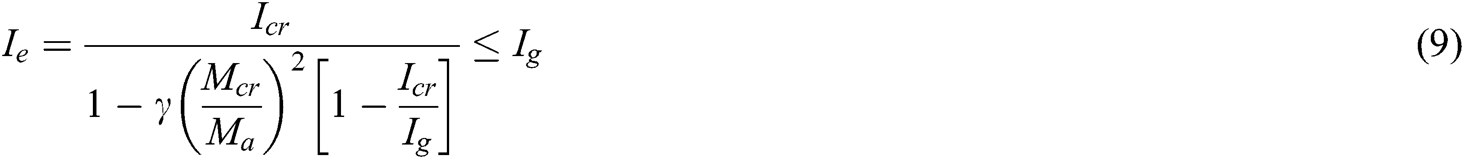
The load-deflection curve of the GFRP-RAC beams is divided into two stages, and the cracking point is the turning point. In the first stage, which represents the un-cracked section, the behavior of the GFRP-RAC beams was controlled by the gross moment of inertia of the section (Ig). While, in the second stage, the section stiffness has been reduced when Ma > Mcr and the crack propagation occurs, in which the effective moment of inertia (Ie) is calculated by Eq. (9) in GFRP-RC beams according to ACI 440.1-R-15. Bischoff et al. [30] considered an integration factor γ to account for the variation in stiffness along the length of the member. Therefore, the ACI 440.1-R-15 applies a formula to calculate γ, as shown in Eq. (13). According to ACI 440.1-R-15, the deflection prediction of as imply supported beam that applied to two-point loading after cracking can be obtained using Eq. (8).


CSA S806-12 suggests calculating the deflection of FRP-RC beams by the integration of moment-curvature along the span at any point, assuming that the section is completely cracked and that the crack area of the beam has no contribution to the tensile stiffness. Therefore, it can be assumed that the load-deflection curvature relation of FRP concrete specimen is bilinear, where the curvature ψ is given by Ma/(EcIg) and Ma/(EcIcr) for the un-cracked stage and cracked part, respectively. The CSA S806-12 provides deflection formulas, as shown in Eq. (14), for calculating the deflection of supported components. Furthermore, the cracked moment of inertia (Icr) can be obtained using Eq. (12).


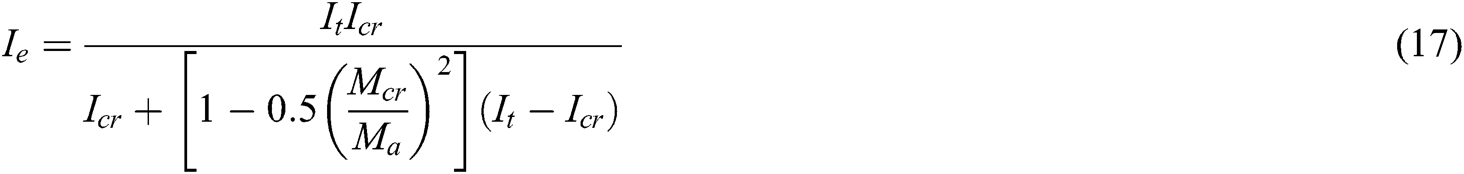
The deflection calculation formula recommended by ISIS-M03-07 is the same as that of ACI 440.1-R-15, as shown in Eq. (8). However, the effective moment of inertia (Ie) was calculated by Eq. (17) in GFRP-RC beams according to ISIS-M03-07, which was based on the SIMTReC [31].
The bond coefficient (kb) represents the bond between the surrounding concrete and FRP bars, which is a key factor for predicting the crack width. Due to the absence of relevant experimental data, ACI 440.1-R-15 suggests a kb value of 1.4 should be used when predicting the crack widths for FRP beams. CSA S806-12, however, suggests a kb value of 0.8 and 1.0 for sand-coated FRP bars and deformed FRP bars, respectively. In addition, ISIS-M03-07 recommends a kb value of 1.2 without experimental data. ACI 440.1-R-15 and CSA S806-12 used equations Eq. (18). While ISIS-M03-07 used Eq. (19) to predict crack width.


5 Comparison between Predicted and Experimental Results
Tab. 6 provided the experimental-to-predicted deflection ratio (δexp/δpre) at 0.3Pu, 0.67Pu, and Pu based on ACI 440.1-R-15, CSA S806-12, and ISIS-M03-07 provisions. Fig. 8 compares the correlation between experimental and predicted mid-span deflection curve. Besides, Tab. 6 confirms that the deflection prediction of ACI 440.1-R-15 on the GFRP-RAC beams at 0.3Pu is relatively accurate, where the average δexp/δpre was 1.01 ± 0.13. Similarly, at 0.67Pu and Pu, it greatly underestimated the deflection of the forecast with an average δexp/δpre of 1.38 ± 0.08 and 1.53 ± 0.09. ISIS-M03-07 showed better predictions than ACI 440.1-R-15 at 0.3Pu, 0.67Pu and Pu, with an average δexp/δpre of 1.02 ± 0.06, 1.19 ± 0.06 and 1.29 ± 0.07, respectively. However, CSA S806-12 relatively overestimated the deflection at 0.3Pu with an average δexp/δpre 0.94 ± 0.10. In addition, it underestimated the deflection at 0.67Pu and Pu, where the average δexp/δpre 1.18 ± 0.10 and 1.31 ± 0.10 with coefficient of variation (COV) of 8.1% and 7.3%, respectively. Therefore, as mentioned above, CSA S806-12 may provide a reasonable prediction for GFRP-RAC beams.

Figure 8: Comparison of predicted deflection with experimental data
Tab. 7 compares the experimental crack widths to the predicted values at three different load levels: at 0.3Pu, 0.67Pu, and Pu. ACI 440.1-R-15 and ISIS-M03-07 predictions were conservative for GFRP-RAC beams at 0.3Pu, with the average ωexp/ωpre of 0.83 ± 0.08 and 0.93 ± 0.08, respectively. Furthermore, there is no significant difference between ACI 440.1-R-15 and ISIS-M03-07 for the prediction of test results at 0.67Pu and Pu. ACI 440.1-R-15 was relatively accurate than ISIS-M03-07 for crack width prediction and a smaller coefficient of variation. However, CSA S806-12 severely underestimates the crack widths under various loads especially at both 0.67Pu and Pu, with an average ωexp/ωpre of 1.68 ± 0.27 and 1.61 ± 0.56.
The flexural behavior of GFRP-RAC beams has been investigated and compared with the steel-RAC beams in this paper. Also, the experimental data were compared with the prediction by FRP design codes and guidelines. According to the experimental and prediction results, draw the following conclusion:
1. Experimental research shows that the increase of the reinforcement ratio has a greater effect on the ultimate load, while the replacement ratio has a smaller effect on it, but has a greater effect on the cracking load. The GFRP-RAC beams showed cracking loads lower than the predicted values and ultimate load higher than the predicted values using ACI 440.1-R-15 and CSA S806-12 equations. ACI 440.1-R-15 and CSA S806-12 overestimated the cracking load by 20% and 17% and underestimated the ultimate load by 24% and 13% of the GFRP-RAC beams.
2. The GFRP-RAC beams behaved differently from the steel-RAC beam in terms of deflection and strain curve. The GFRP-RAC beams exhibited typical bilinear behavior for strain and deflection. The reinforcement ratio has a greater effect on the strain and deflection of the GFRP-RAC beams, while the replacement ratio of the recycled aggregate has less effect on it.
3. Increasing the reinforcement ratio has a greater effect on the crack width, while the replacement ratio of the recycled aggregate has less effect on it. The GFRP-RAC beams showed that the crack width decreases significantly with the reinforcement ratio increases, and the crack width increases slightly with the reinforcement ratio increases.
4. ACI 440.1-R-15 and ISIS-M03-07 underestimated the deflection at different loads. While ISIS-M03-07 showed better predictions than ACI 440.1-R-15 at 0.3Pu, 0.67Pu and Pu, with an average δexp/δpre of 1.02 ± 0.06, 1.19 ± 0.06 and 1.29 ± 0.07, respectively. In addition, CSA S806-12 overestimated the deflection at 0.3Pu with the average δexp/δpre were 0.94 ± 0.10.
5. ACI 440.1-R-15 and ISIS-M03-07 predictions were conservative for GFRP-RAC beams and CSA S806-12 severely underestimates the crack width at 0.3Pu. However, ACI 440.1-R-15 was relatively accurate than CSA S806-12 and ISIS-M03-07 for crack width prediction and smaller coefficient of variation at 0.67Pu and Pu, with an average ωexp/ωpre of 1.02 ± 0.15 and 1.09 ± 0.28.
Nomenclature
 : : | shear span, (mm) |
| A: | effective tension area of concrete surrounding surround flexural tension reinforcement and bearing the same centroid as that reinforcement, divided by the number of bars, (mm2) |
 : : | nominal area of BFRP tension reinforcement, (mm2) |
 : : | the effective width of the beam, (mm) |
 : : | the distance from extreme compression fiber to neutral axis at balanced strain condition, (mm) |
 : : | distance from extreme tension fiber to the center of the centroid of tension reinforcement, (mm) |
 : : | modulus of elasticity of FRP, (MPa) |
 : : | concrete compressive strength, (MPa) |
 : : | stress in BFRP reinforcement in tension, (MPa) |
 : : | modulus of rupture of concrete, (MPa) |
 : : | the ultimate strength of BFRP longitudinal reinforcement, (MPa) |
 : : | the distance from neutral axis to center of tensile reinforcement, (mm) |
 : : | the distance from neutral axis to extreme tension fiber, (mm) |
 : : | transformed moment of inertia of cracked reinforced-concrete section, (mm4) |
 : : | effective moment of inertia, (mm4) |
 : : | gross moment of inertia of uncracked section, Ig = bh3/12 (mm4) |
 : : | the bond-dependent coefficient |
 : : | the ratio of the depth of neutral axis to reinforcement depth |
 : : | length of clear span, (mm) |
 : : | un-cracked length of the beam, (mm) |
 : : | applied moment, (kN.m) |
 : : | cracking moment, (kN.m) |
 : : | ultimate moment, (kN.m) |
 : : | the ratio of elastic modulus of FRP bar to the elastic modulus of concrete |
 : : | applied load, (kN) |
 : : | ultimate load, (kN) |
 : : | the spacing between the longitudinal reinforcement bars; |
 : : | the maximum crack width; |
 : : | the concrete rectangular strain diagram coefficient; |
 : : | ultimate concrete strain |
 : : | ultimate strain in FRP reinforcement |
 : : | experimental mid-span deflection, (mm) |
 : : | experimental mid-span deflection, (mm) |
 : : | calculated mid-span deflection, (mm) |
 : : | actual longitudinal reinforcement ratio |
 : : | balance longitudinal reinforcement ratio |
 : : | distance from the centroidal axis of the gross section to the tension face |
Funding Statement: The authors gratefully acknowledge the support of the National Natural Science Foundation of China (51704029) and Liaoning Revitalization Talents Program (XLYC1807044, XLYC1807050).
Conflicts of Interest: The authors declare that they have no conflicts of interest to report regarding the present study.
1. Adam, M. A., Said, M., Mahmoud, A. A., Shanour, A. S. (2015). Analytical and experimental flexural behavior of concrete beams reinforced with glass fiber reinforced polymers bars. Construction and Building Materials, 84, 354–366. DOI 10.1016/j.conbuildmat.2015.03.057. [Google Scholar] [CrossRef]
2. Liu, H. X., Yang, J. W., Wang, X. Z., Han, D. J. (2017). Experimental study on shear behavior of BFRP-reinforced recycled aggregate concrete deep beams without stirrups. KSCE Journal of Civil Engineering, 21(6), 2289–2299. DOI 10.1007/s12205-016-1081-5. [Google Scholar] [CrossRef]
3. El-Nemr, A., Ahmed, E. A., Benmokrane, B. (2013). Flexural behavior and serviceability of normal- and high-strength concrete beams reinforced with glass fiber reinforced polymer bars. ACI Structural Journal, 110(6), 1077e88. [Google Scholar]
4. Alsayed, S. H. (2010). Flexural behaviour of concrete beams reinforced with GFRP bars. Cement & Concrete Composites, 20(1), 460–469. [Google Scholar]
5. Rafi, M. M., Nadjai, A., Ali, F., Talamona, D. (2008). Aspects of behaviour of CFRP reinforced concrete beams in bending. Construction and Building Materials, 22(3), 277–285. DOI 10.1016/j.conbuildmat.2006.08.014. [Google Scholar] [CrossRef]
6. Elgabbas, F., Vincent, P., Ahmed, E. A., Benmokrane, B. (2016). Experimental testing of basalt-fiber-reinforced polymer bars in concrete beams. Composites Part B: Engineering, 91, 205–218. DOI 10.1016/j.compositesb.2016.01.045. [Google Scholar] [CrossRef]
7. Tomlinson, D., Fam, A. (2015). Performance of concrete beams reinforced with basalt FRP for flexure and shear. Journal of Composites for Construction, 19(2), 04014036. DOI 10.1061/(ASCE)CC.1943-5614.0000491. [Google Scholar] [CrossRef]
8. Kara, I. F., Ashour, A. F. (2012). Flexural performance of FRP reinforced concrete beams. Composite Structures, 94(5), 1616–1625. DOI 10.1016/j.compstruct.2011.12.012. [Google Scholar] [CrossRef]
9. Ovitigala, B. T., Ibrahim, M. A., Issa, M. A. (2016). Serviceability and ultimate load behavior of concrete beams reinforced with basalt fiber-reinforced polymer bars. ACI Structural Journal, 113(4), 757–768. [Google Scholar]
10. Urbanski, M., Lapko, A., Garbacz, A. (2013). Investigation on concrete beams reinforced with basalt rebars as an effective alternative of conventional R/C structures. Procedia Engineering, 57(1), 1183–1191. DOI 10.1016/j.proeng.2013.04.149. [Google Scholar] [CrossRef]
11. Fan, X., Zhang, M. (2016). Experimental study on flexural behaviour of inorganic polymer concrete beams reinforced with basalt rebar. Composites Part B: Engineering, 93, 174–183. DOI 10.1016/j.compositesb.2016.03.021. [Google Scholar] [CrossRef]
12. Goldston, M. W., Remennikov, A., Sheikh, M. N. (2017). Flexural behaviour of GFRP reinforced high strength and ultra high strength concrete beams. Construction and Building Materials, 131, 606–617. DOI 10.1016/j.conbuildmat.2016.11.094. [Google Scholar] [CrossRef]
13. Xiao, J., Li, W., Fan, Y. H., Huang, X. (2012). An overview of study on recycled aggregate concrete in China (1996–2011). Construction and Building Materials, 31(6), 364–383. DOI 10.1016/j.conbuildmat.2011.12.074. [Google Scholar] [CrossRef]
14. Behera, M., Bhattacharyya, S. K., Minocha, A. K., Deoliya, R., Maiti, S. (2014). Recycled aggregate from C&D waste & its use in concrete—a breakthrough towards sustainability in construction sector: A review. Construction and Building Materials, 68, 501–516. DOI 10.1016/j.conbuildmat.2014.07.003. [Google Scholar] [CrossRef]
15. Choi, W. C., Kim, S. W., Yun, H. D. (2012). Flexural performance of reinforced recycled aggregate concrete beams. Magazine of Concrete Research, 64(9), 837–848. DOI 10.1680/macr.11.00018. [Google Scholar] [CrossRef]
16. Bidabadi, M. S., Akbari, M., Panahi, O. (2020). Optimum mix design of recycled concrete based on the fresh and hardened properties of concrete. Journal of Building Engineering, 32, 101483. DOI 10.1016/j.jobe.2020.101483. [Google Scholar] [CrossRef]
17. Ignjatović, I. S., Marinković, S. B., Mišković, Z. M., Savic, A. R. (2013). Flexural behavior of reinforced recycled aggregate concrete beams under short-term loading. Materials and Structures, 46(6), 1045–1059. DOI 10.1617/s11527-012-9952-9. [Google Scholar] [CrossRef]
18. Ryoichi, S., Ippei, M., Takahisa, S., Masaru, S. (2007). Flexural behavior of reinforced recycled concrete beams. Journal of Advanced Concrete Technology, 5(1), 43–61. DOI 10.3151/jact.5.43. [Google Scholar] [CrossRef]
19. Knaack, A. M., Kurama, Y. C. (2015). Behavior of reinforced concrete beams with recycled concrete coarse aggregates. Journal of Structural Engineering, 141(3), B4014009. DOI 10.1061/(ASCE)ST.1943-541X.0001118. [Google Scholar] [CrossRef]
20. Fathifazl, G., Razaqpur, A. G., Isgor, O. B., Abbas, A., Foumier, B. et al. (2009). Flexural performance of steel-reinforced recycled concrete beams. ACI Structural Journal, 106(6), 858–867. [Google Scholar]
21. Cao, W. L., Gong, X. X., Ye, T. P., Jiang, W., Chen, G. L. et al. (2017). Experiment of the flexural performance of recycled concrete beams with different recycled aggregate replacement ratios. Journal of Natural Disasters, 26(4), 10–18. [Google Scholar]
22. Kang, H. K., Kim, W., Kwak, Y. K., Hong, S. G. (2014). Flexural testing of reinforced concrete beams with recycled concrete aggregates. ACI Structural Journal, 111(3), 607–616. DOI 10.14359/51686622. [Google Scholar] [CrossRef]
23. Seara-Paz, S., Gonzalez-Fonteboa, B., Martinez-Abella, F., Eiras-Lopez, J. (2018). Flexural performance of reinforced concrete beams made with recycled concrete coarse aggregate. Engineering Structures, 156, 32–45. DOI 10.1016/j.engstruct.2017.11.015. [Google Scholar] [CrossRef]
24. Arezoumandi, M., Smith, A., Volz, J. S., Khayat, K. H. 2015,An. experimental study on flexural strength of reinforced concrete beams with 100% recycled concrete aggregate. Construction & Building Materials, 88(2), 154–162. [Google Scholar]
25. Kassem, C., Farghaly, A. S., Benmokrane, B. (2011). Evaluation of flexural behavior and serviceability performance of concrete beams reinforced with FRP bars. Journal of Composites for Construction, 15(5), 682–695. DOI 10.1061/(ASCE)CC.1943-5614.0000216. [Google Scholar] [CrossRef]
26. ACI Committee 440. (2015). Guide for the design and construction of structural concrete reinforced with FRP bars, American Concrete Institute. Farmington Hills (MI). [Google Scholar]
27. CSA Canadian Standards Association. (2012). Design and construction of building structures with fiber-reinforced polymers. Canada, Ontario: American Concrete Institute, S806-S812. [Google Scholar]
28. ISIS. (2007). Reinforced concrete structures with fibre-reinforced polymers: ISIS-M03-07. Canada: Intelligent Sensing for Innovative Structures. [Google Scholar]
29. Ministry of Housing and Urban-Rural Development of the People’s Republic of China. (2012). Standard for test method of concrete structures e GB/T 50152-2012. Beijing, China. [Google Scholar]
30. Bischoff, P. H., Gross, S. P. (2010). Equivalent moment of inertia based on integration of curvature. Journal of Composites for Construction, 15(3), 263–273. DOI 10.1061/(ASCE)CC.1943-5614.0000164. [Google Scholar] [CrossRef]
31. SIMTReC Canada Research Network. (2007). Reinforced Concrete Structures with Fiber-Reinforced Polymers. SIMTReC Manual No. 3, University of Manitoba, Winnipeg, MB, Canada. [Google Scholar]
 | This work is licensed under a Creative Commons Attribution 4.0 International License, which permits unrestricted use, distribution, and reproduction in any medium, provided the original work is properly cited. |