| Journal of Renewable Materials |
DOI: 10.32604/jrm.2021.014751
ARTICLE
Physicochemical Properties Comparative Analysis of Corn Starch and Cassava Starch, and Comparative Analysis as Adhesive
1Engineering Research Center of Advanced Wooden Materials, Ministry of Education, Northeast Forestry University, Harbin, 150040, China
2Postdoctoral Research Station of Mechanical Engineering, Northeast Forestry University, Harbin, 150040, China
3Wenzhou Polytechnic, Wenzhou, 325000, China
*Corresponding Authors: Yanhua Zhang. Email: zhangyanhua@nefu.edu.cn; Jun Cao. Email: caojunnefu@163.com
Received: 27 October 2020; Accepted: 03 December 2020
Abstract: The morphology and properties of corn starch and cassava starch were compared by SEM, DSC and TGA. The effects of amylose and amylopectin content on starch properties were studied by FT-IR, XRD and XPS. The plywood was pressed with the prepared adhesive and the bonding strength of the plywood was tested to analyze the difference among the adhesives from different plant sources and the difference after blending PAPI prepolymer. FT-IR results showed that the hydroxyl peak of cassava starch was stronger and wider. TGA showed that the residue of cassava starch was lower, but the thermal stability of cassava starch was almost the same. XPS data showed that the oxygen content of cassava starch was slightly higher, but the carbon content was slightly lower. SEM analysis showed that corn starch granules were more irregular and sharper than cassava starch, and cassava starch granules were more uniform, regular and round.
Keywords: Corn starch; cassava starch; comparative analysis; adhesive
Starch is a kind of biodegradable natural macromolecule. It has the characteristics of low prices, environmental protection, and rich raw materials. It is widely used in food, textile, papermaking, and adhesive fields. Fig. 1 shows the practical application of starch. Starch is also mainly used as a food additive and degradable tableware in the food field. Starch is also widely used in textile, papermaking, adhesives and other fields. The application of these neighborhoods is based on the water absorption and gelatinization adhesion of starch. Also, starch has been widely used in the biomedical field. In the medical field, it is mainly used as a bacteriostatic hydrogel and drug sustained-release agent.

Figure 1: Diagram of starch application
The molecular formula of starch is (C6H10O5)n. n is the degree of polymerization. Starch is a natural polymer formed by dehydration of glucose unit through a glycosidic bond (C–O–C). Natural starch has two structural types: Amylose and amylopectin. As shown in Fig. 2. Amylose structure, the amylose structure is a schematic diagram. And that of amylopectin is shown in Fig. 3. Amylopectin structure. Amylose has a long straight chain, while glucose is linked by α-(1-4) glycosidic bond [1,2]. The molecular weight of amylopectin is large, and the branched-chain structure is highly branched. And the glucose between the short chains of amylopectin linked by α-(1-4) glucoside bond. The branched chains of amylopectin are linked by α-(1-6) glycosidic bond [2,3].

Figure 2: Amylose structure
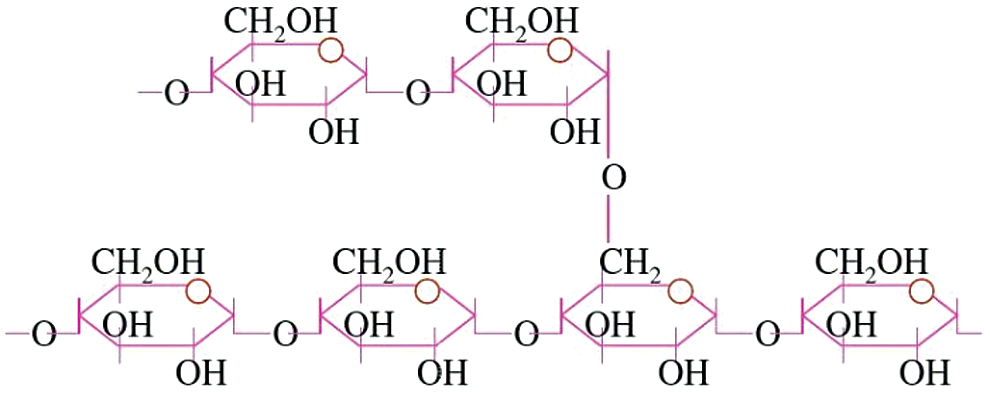
Figure 3: Amylopectin structure
Amylose and amylopectin structure differences, leading to its performance, are significantly different. Amylose can be dissolved in 70°C~80°C hot water. Branched-chain starch is insoluble. Amylose and amylopectin content in the natural starch depends upon the source of starch. The contents of amylose and amylopectin in different starch sources were different. Amylose accounts for 23% in common corn and 17% in cassava starch. The most important property of starch is that the granule expands under the excess water heating. And then amylose and amylopectin dissolve. That is the gelatinization of starch.
The gelatinized amylose will form a continuous gel phase after cooling. That is due to the regular long amylose structure of amylose. The molecular weight of amylopectin is higher than that of amylose. Therefore, the amylopectin after gelatinization is cooled and aggregated into gel particles. Viscous solutions are produced as the gel particles increase [4]. The length and distribution of amylopectin determine the gelatinization temperature, enthalpy change, and gelatinization characteristics. Long branched chains, such as amylose, also affect the gelatinization properties of starch [5,6]. Corn starch is one of the most studied starch. Corn starch has large particle size characteristics, strong surface polarity, high cohesive energy, and high softening temperature. There are few studies on cassava starch than corn starch. Cassava starch has low gelatinization temperature and high gelatinization degree. The gel formed is highly stable, and the gel layer is fine [7,8].
In this study, FT-IR, DSC, TGA, XPS, SEM and other test methods were used to analyze and compare the effects of different amylopectin and amylose content on the physical and chemical properties of starch. Starch adhesive was prepared from corn starch and cassava starch, and its solid content and viscosity were determined. PAPI prepolymer was used as crosslinking agent to modify the starch adhesive. Plywood was prepared with “starch adhesive” and “starch adhesive within PAPI prepolymer”. The bonding strength of plywood was tested and analyzed by universal mechanical testing machine.
Corn starch (industrial grade) was purchased from Dacheng corn Co., Ltd., in Changchun, China. The moisture content of the corn starch is 10%–12%, amylose: amylopectin = 23: 77. Cassava starch (industrial grade) was purchased from Beidahuang rice Co., Ltd., Harbin, China. The water content of the cassava starch is 10%–12%, amylose: amylopectin = 17: 83. Ammonium persulfate (APS), sodium hydrate (NaOH), hydrochloric acid (HCl), borax (Na2B4O7·10H2O) and other reagents were purchased from Tianjin Yongda Chemical Reagent Co., Ltd., Tianjin, China Polyvinyl alcohol (PVA, industrial grade) was purchased from Guangdong Xinxiang Chemical Co., Ltd., Guangzhou, China. The model is 1799 (alcoholysis degree: 99%, molecular weight: 1700). Polyaryl polymethylene isocyanate (PAPI, industrial grade) was purchased from Bayer company. Poplar veneer was purchased from China Dunhua Jinhai Wood Industry Co., Ltd., China, and the moisture content of 10%–12%. Unless otherwise specified, the reagents are analytical grade.
2.2.1 Preparation of Native Starch Adhesive
The proper amount of starch and distilled water was weighed with a balance to prepare 30 wt% starch suspension. The starch suspension was transferred to a 500 mL four necked round bottom flask with agitator, thermometer and the condenser tube. The starting temperature of the reaction was 40°C. Adjust the pH value of the reaction device to 8–9 with 1mol/L NaOH solution, and stir for 30 min at 300 rpm. Then the pH in the reaction unit was stabilized with hydrochloric acid. Add polyvinyl alcohol solution (5% of dry starch mass) and stir evenly. According to the total mass of the reaction system, add ammonium persulfate solution with 6% of the total mass of the reaction system, and stir the reaction at 300 rpm for 1 h. After the above reaction, the temperature was raised to 60°C~70°C and borax (2 wt%, dry starch) was added for a certain time. The reaction device was cooled to room temperature. Then we obtain starch adhesive of plant origin.
The starch adhesive prepared by weighing the required starch from different plants in the plastic cup. After peeling the balance, weigh the PAPI prepolymer (12 wt%, dry starch) in the plastic cup. Stir with a glass rod until evenly dispersed, and then brush on the surface of poplar veneer within 30 min (within the failure period).
2.2.2 Viscosity and Solids Content of Native Starch Adhesive
The instrument used for the viscosity test is NDJ-5S (Shanghai Yueping instrument, China). The experiment was carried out at the speed of 60 rpm or 30 rpm and the temperature of 20°C within 2# rotor. The viscosity of starch adhesives from different plant sources (without Papi prepolymer) was determined.
The solid content shall be determined to basic the method specified in “test methods for wood adhesives and their resins” (national standard of the people’s Republic of China GB/T 14074-2006). During the test, the tin foil was folded into a cube container (the weight of the cube container was weighed and recorded as m1). A small amount of adhesive was added into the cube container (only the mass of adhesive was weighed as m2), put it in an oven at 120 ± 3°C, dried to constant weight and weighed (the mass of adhesive and tin foil after drying is recorded as m3). Calculate the solid content according to the following formula:

Three different kinds of plywood were prepared with poplar veneer, and the fiber direction of two adjacent veneers was perpendicular to each other. The prepared starch adhesive (mixed with PAPI prepolymer) was evenly coated on the poplar veneer with 320 g/m2 of soft bristle brush (the middle poplar veneer was coated with starch adhesive on both sides). After the painting is completed, preload with the pre press for 30–40 min under the pressure of 2–3 MPa. After pre pressing, the plywood was put into a hot press with 110°C hot pressing temperature and 2–3 MPa pressure for 3 min.
2.2.4 Bonding Strength of Plywood
The bonding strength of plywood was tested according to “test methods for physical and chemical properties of wood-based panels and veneered panels” (National Standard of the People’s Republic of China GB/T 17657-2013). Add clean water into the water bath and heat the water in the water bath to 63 ± 3°C. The specimens with the size of 100 mm × 25 mm are tied together with rubber bands or ropes (to prevent bubbles in the water from dispersing the test pieces during heating), and they are completely immersed in the water bath and pressed with heavy objects to prevent the specimens from floating. After soaking for 3 h, the specimens were cooled at room temperature for 10 min to obtain the wet shear bond strength test specimens. Dry shear bond strength specimens were not treated. The tests were carried out on CMT 5504 mechanical testing machine (Sans, China).
2.2.5 Differential Scanning Calorimetry (DSC)
D204 differential scanning calorimeter (NETZSCH, Germany) was used to test the difference between the two starch samples. Put the sample (10–12 mg) into the sample holder in the instrument, use the empty sample cell as the reference substance, and then heat it from 25°C to 150°C in a nitrogen atmosphere at a rate of 5°C/min. The temperature was calculated by the Proteus analysis software (NETZSCH, Germany).
XRD spectra were obtained from two plant sources dried native starch powder, using an X-ray diffractometer (Rigaku D/max 2200, Japan) at 32 kV and 40 mA with 0.154 nm Cu Kα radiation. The results of diffraction experiments were plotted by Origin 9.0 statistical software. The relative crystallinity of starch was calculated by MDI Jade 6.0 software [9].
2.2.7 Fourier Transform Infrared (FT-IR)
Corn starch and cassava starch samples were put in the oven at 120 ± 2°C for drying to constant weight before testing, and then ground and refined. Fourier transform infrared spectroscopy (Bruker tensor I, Germany) was used to test starch samples. The resolution of starch samples was 4 cm-1 and scanned 32 times in the area of 4000–400 cm−1.
2.2.8 Thermogravimetric Analysis (TGA)
The thermal decomposition kinetics of two kinds of plant starch was studied by TG 209 F3 thermogravimetric analyzer (NETZSCH, Germany). The temperature was raised from 50°C to 700°C at a rate of 10°C/min at a flow rate of 40 mL/min. Argon purge shall be started 30 min before measurement to establish an inert environment to prevent any unnecessary oxidative decomposition. The residual mass of all samples was plotted as a function of temperature, and its first derivative (DTG) was used for analysis.
2.2.9 Scanning Electron Microscopy (SEM)
The micro morphology of cassava starch and corn starch was photographed by FEI Quanta 200 scanning electron microscope (FEI, USA). Before vacuum gold plating, starch samples were soaked in ethanol. The soaked starch sample was glued to the silver-tape connected to the brass plate. The starch sample was bombarded by electrons at an accelerating voltage of 20 kV and photographed at a magnification of 2000.
2.2.10 X-ray Photoelectron Spectroscopic Analysis (XPS)
The instrument used in XPS test was Kα X-ray photoelectron spectrometer (Thermo Fisher Scientific, USA). The etching took place in a small area of 2 mm × 0.4 mm on the sample (sputtering angle is 45°). At room temperature, 1486.6 eV Al-Kα beam composed of 100 W and 200 mm diameter beam grating was used to etch the sample. Al-Kα radiation was used to etch the sample vertically at the speed of 1 nm/s. The energy passing through the sample during etching was 50 eV. The high energy emission spectra were collected at a resolution of 0.1 eV.
3.1 Physical and Chemical Properties of Pure Starch Adhesive
The viscosity of natural starch adhesive comes from the interaction between molecules. Among them, the interaction force between amylose is small, and that between amylopectin is large [10]. The viscosity of starch adhesive prepared by non gelatinized starch is low. The viscosity of starch adhesive prepared by gelatinized starch is high. This is because the molecular volume of starch becomes larger after water absorption and gelatinization. The contact opportunities and hydrogen bonding forces between starch molecules with larger volume become larger. As shown in Tab. 1. The physical and chemical properties of two kinds of starch as adhesive, the initial viscosity of corn starch adhesive is 194 mPa·s. The initial viscosity of cassava starch adhesive was 450 mPa·s. The hydrogen bond force between starch molecules with high amylopectin content and short amylopectin length is stronger. The strong intermolecular hydrogen bonding force makes the adhesion force and desorption resistance between the particles larger [11]. In addition, the gelatinization temperature of cassava starch was lower than that of corn starch. Starch adhesive was prepared at 60°C–70°C, and the gelatinization degree of cassava starch was higher than that of corn starch. Therefore, the viscosity of cassava starch adhesive is higher than that of corn starch adhesive. This means that more viscosity can be produced. The amylopectin content of cassava starch was higher than that of corn starch. This is the reason why the initial viscosity of cassava starch adhesive is higher than that of corn starch adhesive. However, if the viscosity is too high, it is difficult to disperse uniformly in the system. It is easy to cause caking, and it is difficult to brush the agglomerated adhesive in the preparation of plywood.
Table 1: The physical and chemical properties of two kinds of starch as adhesive

The solid content of the adhesive is the nonvolatile substance in the adhesive. In the bonding system plays a bonding role in this part of the material. The solid content was determined by the constant weight method. The results are shown in Tab. 1. The physical and chemical properties of two kinds of starch as adhesive. The solid content of the cassava starch adhesive was 32.50%. The solid content of corn starch adhesive was 30.76%. This phenomenon indicates that cassava starch with high amylopectin content has a higher molecular weight than corn starch. Therefore, cassava starch has more hydroxyl groups than corn starch. The experimental results of solid content are consistent with those of the viscosity experiment.
As can be seen from Fig. 4, the test results of the two starches are very similar. There is a large endothermic peak in the curve. The endothermic peak temperatures of cassava starch and corn starches were 106.5°C and 112.0°C, respectively. The endothermic peak areas are 748 J/g and 723 J/g, respectively.

Figure 4: DSC curves of corn and cassava starch
The DSC curves of corn starch and cassava starch increased significantly at 63.0°C and 51.0°C. The rise of the DSC curve is the result of starch gelatinization and endothermic. The temperature of the DSC curve of cassava starch was 10°C–15°C lower than that of corn starch. The gelatinization process of starch is essentially the dissolution of starch crystal. The swelling capacity of starch granules mainly depends on the amount of amylopectin containing short chains [12]. The long chain of amylopectin can inhibit the expansion of starch, which is not conducive to starch gelatinization [13]. The long-chain in amylopectin is similar to amylose in nature. The amylopectin content of cassava starch is higher than that of corn starch, so cassava starch is easier to gelatinize than corn starch. In practical application, it is necessary to modify cassava starch to improve gelatinization temperature. Compared with corn starch, cassava starch has higher requirements in the process of synthesis and modification.
The boiling point of water at normal temperature and normal pressure is 100°C. The endothermic peak appeared near 100°C. This is due to the evaporation of water in the starch sample and the destruction of the water chain crystal structure during heating. The destruction and disappearance of crystalline structure in starch granules during the heating process is divided into two steps. The first phase of crystal structure changes occurred between starch molecules. With the increase in temperature, the amount of water in the starch sample decreased gradually. The crystal structure of the water chain decreases with a decrease in water. Finally, the crystal structure of the water chain disappeared utterly. The second phase of crystal structure changes occurred in starch molecules. With the increase of temperature to the melting point microcrystalline, the chain crystal structure begins to melt. Finally, the chain crystal structure disappeared utterly [14].
It can be seen from Fig. 5. X-ray diffraction patterns of CS and NS that the X-ray diffraction patterns of cassava starch (CS) and corn starch (NS) after drying are composed of peak diffraction characteristics and dispersion diffraction characteristics. The test results of the two starches are very similar. This is a typical diffraction curve of the polycrystalline system. CS has strong diffraction peaks at 2θ = 15.1°, 17.1°, 18.2° and 22.8°. NS has strong diffraction peaks at 2θ = 14.9°, 16.9°, 18.1°, and 22.8°. The results show that the structure of cassava starch and corn starch is composed of crystalline and amorphous. The FWHM of CS was larger than NS, indicating that the crystallinity of cassava starch was higher than that of corn starch. The crystallinity of CS and NS were 27.4% and 22.1%, respectively.

Figure 5: X-ray diffraction patterns of CS and NS
The 2θ values of the diffraction peaks of corn starch and cassava starch were around 15.1°, 17.1°, 18.2°, and 22.8°. That is a typical A-type crystal [15]. The crystal peaks near 15.1°, 17.1° and 18.2° are formed by the interaction between the starch’s internal molecular chains. The hydroxyl groups in the inner molecular chain of starch molecules form chain crystals in the form of hydrogen bonds with each other. The crystal peak near 22.8° is a chain crystal formed by a hydrogen bond between the starch molecular chain and water [14]. The moisture content of dry cassava starch was similar to that of corn starch. The diffraction peaks of cassava starch and corn starch at 2θ = 22.8° were the most similar. Also, the diffractive peaks are quite different. The diffraction peak intensity of cassava starch was stronger than that of corn starch at 2θ = 15.1°, 17.1°, and 18.2°. That is due to the different proportion of amylopectin in cassava starch and corn starch. Generally speaking, the size of the crystallization zone is affected by amylopectin content [16]. The ratio of amylopectin to amylopectin was 83/17 in cassava starch and 77/23 in corn starch. Compared with corn starch, the amylopectin content of cassava starch was higher. That indicates that more intermolecular hydrogen bonds can be formed between cassava starch granules. And the crystallinity is also improved.
The content of amylopectin in cassava starch is higher, which will form a higher crystal structure. Therefore, the adhesive prepared from cassava starch has strong coagulability. The high coagulability of cassava starch adhesive means that the stability of the adhesive is poor. Therefore, cassava starch adhesive preparation will have higher requirements for the modification process.
The infrared spectra of corn starch and cassava starch are shown in Fig. 6. The test results of the two starches are very similar. The characteristic peak at 3300–3500 cm−1 is O–H stretching vibration [17,18]. We can find in Fig. 6a, the absorption peak of cassava starch was larger than that of corn starch. The characteristic peak at 2900–2950 cm−1 is caused by the asymmetric stretching vibration of C–H which from the glucose ring [19]. The 1630–1650 cm−1 bands are the O–H bending vibration of water molecules adsorbed in the amorphous region of starch granules [19,20]. The band of 1150–1160 cm−1 is pertain to the asymmetric stretching vibration of C–O in C–O–H structure [21]. And the band of 1020–1030 cm−1 is pertain to the C–O vibration peak on the dehydrated glucose ring [22].

Figure 6: FT-IR of cassava starch and corn starch: The (a) is the same (b) only moving the curve up and down
The reason for the stronger absorption peak of cassava starch at 3300–3500 cm-1 was that the proportion of amylopectin in cassava starch was higher than that in corn starch. Because the molecular weight of amylopectin is higher than that of amylose, amylopectin has more pyran ring than amylose. More pyran ring in starch means more –OH. Therefore, cassava starch with high amylopectin content has higher –OH content than corn starch with relatively low amylopectin content. The results of FT-IR and DSC showed the same trend, and the proportion of other functional groups was similar.
There are two weight loss curves below 150°C. The weight loss of the first stage is related to the loss of adsorbed water and bound water. In the second stage, due to thermal decomposition, the polymer chain breaks, resulting in large weight loss. Dehydration and thermal decomposition are generally considered as two independent processes related to starch degradation mechanism [23−26]. DTG curve is the differential of the TG curve. The position of weight loss on the TG curve corresponds to the characteristic peak on the DTG curve.
The second stage of weight loss of the TG curve (starch thermal decomposition) is accompanied by three processes: Intermolecular dehydration, intramolecular dehydration, and high-temperature pyrolysis [26]. The main reason for the dehydration of starch molecules is the breaking of α-1,4 glucoside bond in amylose and amylopectin. Also, the α-1,6 glycosidic bond may be broken, and the α-1,4 glycosidic bond is easier to hydrolyze than the α-1,6 glycosidic bond [25]. The polar water molecules produced by the cleavage can easily react with the glycosidic bond to destroy the structure of the starch glucose ring. The intramolecular dehydration is mainly caused by the C2 and C3 positions in the starch glucose unit. The hydroxyl group on C2 or C3 binds to the active hydrogen on the hydroxyl group adjacent to C2 or C3. When the hydroxyl group is separated from the glucose ring in the form of water, the hydroxyl group on the adjacent carbon gets electrons to form a carbonyl group. Usually, this process is not easy to happen due to space resistance and the energy required. Under the protection of inert gas, there is a lack of oxygen in the pyrolysis process, so the main products are H2, CO2, CH4 [26].
The initial decomposition temperature of corn starch and cassava is about 297°C, as shown in Fig. 7. The test results of the two starches are very similar. This is because intermolecular dehydration begins with the breaking of the α-1,4 glycosidic bond. The energy required for breaking the α-1,4 glycoside bond in corn starch and cassava starch was the same. The decomposition rate of corn starch was the fastest at 316°C, and that of cassava starch was the fastest at 319°C. This is because the energy required for α-1,6 glycosidic bond breaking is larger than that for α-1,4 glycosidic bond breaking. Therefore, the temperature when cassava starch reaches the maximum decomposition rate is higher than that of corn starch. Corn starch and cassava starch completely decomposed, when the temperature reached 600°C. The thermal decomposition residue of corn starch and cassava starch was 15.60% and 13.80%, respectively. This is because cassava starch has higher amylopectin content. High amylopectin content means more hydroxyl groups. The pyrolysis was carried out under the protection of inert gas, and no air was introduced into the system. Therefore, the hydroxyl group is the source of hydrogen and oxygen atoms in H2O, H2, CO2, and CH4 gases.

Figure 7: TGA of cassava starch and corn starch
3.6 Scanning Electron Microscopy (SEM) Analysis
The shape and size of starch granules have their characteristics due to different varieties. The scanning electron microscope of corn starch and cassava starch is shown in Fig. 8. The test results of the two starches are very similar.

Figure 8: SEM images of corn starch and cassava starch: (a) Micro morphology of corn starch, (b) Micro morphology of cassava starch
Corn starch is a hexagonal or polyhedral shape, but its corners are round. The average particle size is 12 μm in the range of 4–25 μm. Cassava starch granules were spherical or ellipsoidal. The average particle size is 15 μm in the range of 5–20 μm. The results showed that the two kinds of starch granules were similar in size but different in shape. Under the same particle size, the surface area of hexagonal or polyhedral corn starch granules was larger than that of spherical or ellipsoidal cassava starch granules. This phenomenon indicates that corn starch granules have more chance to contact with reactants during the chemical reaction.
The weak interaction between the radially arranged amylopectin will increase the strain during the growth of starch granules, and eventually lead to the cracking of starch granules [27]. Some cassava starch granules are curved or fractured, while the surface of corn starch granules is only slightly concave. The high amylopectin content of cassava starch leads to greater internal stress in the growth process, which makes it easier to produce defects. Compared with Fig. 8a and Fig. 8b, we find that the homogeneity of corn starch granules is higher than of cassava starch. Due to this molecular defect, the homogeneity of cassava adhesive will be inferior to that of corn starch adhesive. This fully shows that cassava starch particles should be modified in the process of preparation of adhesive.
3.7 X-Ray Photoelectron Spectrometer (XPS) Analysis
Experiments on two different types of corn starch and cassava starch with different test parameters were scanning, each sample test 5scans. And probes into the atomic percentage, specific test results are shown in Tab. 2. The test results of the two starches are very similar.
Table 2: XPS data analysis of corn starch

It can be seen from Tab. 2. XPS data analysis of corn starch that the binding energy of C1s of corn starch is 284.69 ev, and that of cassava starch is 284.70 eV, which is caused by C–C–C–H–C–O–C groups [28]. The binding energy of O1s position of corn starch is 530.96 eV. And the O1s position binding energy of cassava starch is 530.95 eV. The binding energy of O1s position is caused by water absorption of –OH group and –OH group. The binding energy of cassava starch C1s and O1s has the same position as corn starch, which can determine the two starches’ chemical structure. The atomic percentage of O1s in cassava starch was higher than that in corn starch, which indicated that cassava starch had more –OH content. This is consistent with the wider characteristic peak of –OH group in cassava starch measured by FT-IR. The content of the C1s atom in corn starch was higher than that in cassava starch, indicating that the carbon content of corn starch was higher. The content of the O1s atom in cassava starch was higher than that in corn starch, indicating that the cassava starch’s oxygen content was higher. This is consistent with the TGA test results. That is, corn starch residue is higher than cassava starch.
3.8 The Bonding Strength of Plywood
Until now, there is not relevant testing standard for the starch adhesive in China. In this study, plywood specimens were prepared based on the national standard test method for tensile shear strength of wood adhesives (GB/T 33333-2016), and 8 plywood specimens were tested for each group.
As shown in Tab. 3. Comparison of bonding strength between corn starch and cassava starch adhesives, the test results of the two starches are very similar. The dry shear strength of corn starch adhesive without PAPI prepolymer is about 1.27 MPa. The dry shear strength of tapioca starch adhesive is about 1.04 MPa. Compared with corn starch, the amylopectin content of cassava starch was higher. The higher the amylopectin content, the higher the cassava starch –OH content. The hydrogen bond force between hydroxyl groups is the source of starch adhesion [29]. However, the hydrogen bonding force also affects the viscosity of starch adhesive [10,11]. Although the hydrogen bonding force of cassava starch adhesive is stronger than that of corn starch adhesive, the viscosity of cassava starch adhesive is much higher than that of corn starch adhesive due to the excessive hydrogen bonding force. That will lead to difficulty in sizing adhesive and uneven coating [30]. The defective adhesive layer has a great influence on the shear stress of plywood [31]. Also, the starch adhesive without PAPI prepolymer has no wet shear strength due to the hydrogen bond between the starch adhesive and wood. When water molecules are involved, cell cavities in plywood wood provide a way for water molecules to contact starch adhesives. The water molecules entering the cell cavity combine with –OH on the starch adhesive in the form of the hydrogen bond. That results in the expansion of the adhesive layer and the cracking of plywood.
Table 3: Comparison of bonding strength between corn starch and cassava starch adhesives

When the amount of PAPI prepolymer was 12%, the dry shear strength and wet shear strength of corn starch adhesive were 1.09 MPa and 0.25 MPa, respectively. The dry shear strength and wet shear strength of cassava starch adhesive are about 1.29 MPa and 0.35 Mpa, respectively. Compared with the adhesive without PAPI prepolymer, the adhesive with PAPI prepolymer has wet shear strength. The reason is that –NCO group in prepolymer will form –NHCOO– group between the adhesive layer and wood board. In short, it is to firmly bond the adhesive layer and the wood board in the form of a chemical bond [32,33]. The chemical properties of –NHCOO– group are stable and can be hydrolyzed in alkaline conditions. Also, the dry shear strength of corn starch adhesive decreased after adding prepolymer. This is due to the reaction between –OH in the adhesive system and –NCO in prepolymer after adding prepolymer. The hydroxyl group in the adhesive decreased after the reaction. This leads to the decrease of hydrogen bond force between the adhesive and the board, which leads to the decrease of dry shear strength [34]. After adding 12% prepolymer, the dry shear strength of tapioca starch adhesive was improved. This is due to the consumption of some –OH in the adhesive system after the introduction of –NCO group. The decrease in the strength of the hydrogen bond force leads to a decrease in the adhesive system’s viscosity. The problem of adhesive layer defect caused by high viscosity was eliminated by adding PAPI prepolymer.
The effects of amylose and amylopectin content on the properties of starch were studied. FT-IR analysis showed that the hydroxyl content of cassava starch was higher than that of corn starch. XPS data showed that the carbon content in cassava starch was lower, while the oxygen content in cassava starch was higher. TGA showed that the cassava starch residue was lower, which confirmed the XPS results that the carbon content of cassava starch was lower. SEM analysis showed that corn starch was more irregular and sharpper, and cassava starch was more regular and rounder. The results of bonding strength test showed that the dry shear strength of corn starch adhesive was higher than that of cassava starch. After adding 12% PAPI prepolymer, the dry shear strength and wet shear strength of cassava starch adhesive were higher than those of corn starch. In conclusion, cassava starch was more suitable for preparing adhesive than corn starch, but the preparation process still needs to be improved.
Funding Statement: This work was supported by the National Natural Science Foundation of China (No. 31670569) and the Fundamental Research Funds for the Central Universities (No. 2572019CG05). Special thanks to the support of the Chinese University Students, Innovation and Entrepreneurship Project (202010225071).
Conflicts of Interest: The authors declare that they have no conflicts of interest to report regarding the present study.
1. Din, Z., Chen, L., Xiong, H., Wang, Z., Khan, S. A. (2020). Starch: An undisputed potential candidate and sustainable resource for the development of wood adhesive. Starch−Starke, 72(3–4), 1–9. [Google Scholar]
2. Smeets, N. M. B., Imbrogno, S., Bloembergen, S. (2017). Carbohydrate functionalized hybrid latex particles. Carbohydrate Polymers, 173, 233–252. DOI 10.1016/j.carbpol.2017.05.075. [Google Scholar] [CrossRef]
3. Wu, A. C., Witt, T., Gilbert, R. G. (2013). Characterization methods for starch−based materials: State of the art and perspectives. Australian Journal of Chemistry, 66(12), 1550–1563. DOI 10.1071/CH13397. [Google Scholar] [CrossRef]
4. Santelia, D., Zeeman, S. C. (2011). Progress in arabidopsis starch research and potential biotechnological applications. Current Opinion in Biotechnology, 22(2), 271–280. DOI 10.1016/j.copbio.2010.11.014. [Google Scholar] [CrossRef]
5. Li, C., Gong, B. (2020). Insights into chain−length distributions of amylopectin and amylose molecules on the gelatinization property of rice starches. International Journal of Biological Macromolecules, 155, 721–729. DOI 10.1016/j.ijbiomac.2020.04.006. [Google Scholar] [CrossRef]
6. Basilio, C. U., Leopoldo, G. C., Velazquez, G., Gerardo, T. M., Alberto, C. G. et al. (2019). Effect of dual modification on the spectroscopic, calorimetric, viscosimetric and morphological characteristics of corn starch. Polymers, 11(2), 333. [Google Scholar]
7. Xu, Q., Wen, J. P., Wang, Z. J. (2016). Preparation and properties of cassava starch−based wood adhesives. Bioresources, 11(3), 6756–6767. [Google Scholar]
8. Han, H., Hou, J., Yang, Y., Zhang, Y., Chen, H. et al. (2019). Insight on the changes of cassava and potato starch granules during gelatinization. International Journal of Biological Macromolecules, 126, 37–43. DOI 10.1016/j.ijbiomac.2018.12.201. [Google Scholar] [CrossRef]
9. Feng, Y., Yang, H., Liao, A., Liu, T., Zhou, L. et al. (2019). Controlled non−crystallization of cassava starch. Science and Technology of Food Industry, 40(2), 25–28. [Google Scholar]
10. Wang, J., Mao, H., Li, H. (2020). Research progress of starch structure and rice texture. Journal of Chinese Institute of Food Science and Technology, 20(1), 1–9. [Google Scholar]
11. Li, H., Lei, N., Yan, S., Gao, M., Yang, J. et al. (2019). Molecular causes for the effect of cooking methods on rice stickiness: A mechanism explanation from the view of starch leaching. International Journal of Biological Macromolecules, 128, 49–53. [Google Scholar]
12. Zhou, H., Peng, X., Ouyang, L., Zhu, C., He, X. (2018). Effects of amylopectin structure on gelatinization characteristics of rice starch. Journal of the Chinese Cereals and Oils Association, 33(8), 25–30. [Google Scholar]
13. Lin, L., Cai, C., Gilbert, R. G., Li, E., Wang, J. et al. (2016). Relationships between amylopectin molecular structures and functional properties of different−sized fractions of normal and high−amylose maize starches. Food Hydrocolloids, 52, 359–368. DOI 10.1016/j.foodhyd.2015.07.019. [Google Scholar] [CrossRef]
14. Zhang, B. (2008). Chain−chain and chain−water crystal structure in starch polytropism system. Journal of the Chinese Cereals and Oils Association, (1), 48–50. [Google Scholar]
15. Lemos, P. V. F., Barbosa, L. S., Ramos, I. G., Coelho, R. E., Druzian, J. I. (2018). The important role of crystallinity and amylose ratio in thermal stability of starches. Journal of Thermal Analysis and Calorimetry, 131(3), 2555–2567. DOI 10.1007/s10973-017-6834-y. [Google Scholar] [CrossRef]
16. Patricia, M., Fiorela, P., Luis, A. B., Carmen, N., Carmen, V. (2019). Physicochemical, functional and morphological characterization of starches isolated from three native potatoes of the Andean region. Food Chemistry: X, 2, 100030. [Google Scholar]
17. Cuenca, P., Ferrero, S., Albani, O. (2020). Preparation and characterization of cassava starch acetate with high substitution degree. Food Hydrocolloids, 100, 105430. [Google Scholar]
18. Xiao, X., Yu, L., Xie, F., Bao, X., Liu, H. et al. (2017). One−step method to prepare starch−based superabsorbent polymer for slow release of fertilizer. Chemical Engineering Journal, 309, 607–616. DOI 10.1016/j.cej.2016.10.101. [Google Scholar] [CrossRef]
19. Zuo, Y., He, X., Li, P., Li, W., Wu, Y. (2019). Preparation and characterization of hydrophobically grafted starches by in situ solid phase polymerization. Polymers, 11(1), 72. [Google Scholar]
20. Yang, C., Lin, Y., Cheng, F., Zhou, M., Zhu, P. (2019). Synthesis and characterization of corn starch phthalate by a semidry method. Starch−Strke, 71(9–10), 1800315. [Google Scholar]
21. Sandra, M., Jorge, M., Fern, O. M., Carvalho, L. (2016). Low density wood−based particleboards bonded with foamable sour cassava starch: Preliminary studies. Polymers, 8(10), 354. DOI 10.3390/polym8100354. [Google Scholar] [CrossRef]
22. Xu, P., Zhao, X., Ma, P., Chen, M., Dong, W. et al. (2018). Design of nano−starch−reinforced ethyl−co−vinyl acetate elastomers by simultaneously constructing interfacial bonding and novel reversible matrix crosslinking. Chemical Engineering Journal, 346, 497–505. [Google Scholar]
23. Chen, L., Wang, Y., Zia-ud-Din, Fei, P. Jin, W. et al. (2017). Enhancing the performance of starch−based wood adhesive by silane coupling agent(KH570). International Journal of Biological Macromolecules, 104, 137–144. DOI 10.1016/j.ijbiomac.2017.05.182. [Google Scholar] [CrossRef]
24. Zhang, Y., Zhang, J., Chen, M., Luo, J., Li, J. (2019). A tough, water−resistant, high bond strength adhesive derived from soybean meal and flexible hyper−branched aminated starch. Polymers, 11(8), 1352. DOI 10.3390/polym11081352.
25. Liu, X., Yu, L., Xie, F., Li, M., Li, X. (2010). Kinetics and mechanism of thermal decomposition of cornstarches with different amylose/amylopectin ratios. Starch–Strke, 62(3−4), 139–146. DOI 10.1002/star.200900202. [Google Scholar] [CrossRef]
26. Liu, X. (2011). Thermal decomposition of starch and starch based materials (Ph.D. Dissertation), pp. 1–150. South China University of Technology. [Google Scholar]
27. Blennow, A., Hansen, M., Schulz, A., JRgensen, K., Donald, A. M. et al. (2003). The molecular deposition of transgenically modified starch in the starch granule as imaged by functional microscopy. Journal of Structural Biology, 143(3), 229–241. DOI 10.1016/j.jsb.2003.08.009. [Google Scholar] [CrossRef]
28. Gabriela, F. M., Elaynne, R. P., Marisa, B. M. M., Fernando, S. (2017). XPS study on the mechanism of starch−hematite surface chemical complexation. Minerals Engineering, 110, 96–103. [Google Scholar]
29. Qiao, Z., Lv, S., Gu, J., Tan, H., Zhang, Y. (2017). Influence of acid hydrolysis on properties of maize starch adhesive. Pigment & Resin Technology, 46(2), 148–155. DOI 10.1108/PRT-10-2015-0105. [Google Scholar] [CrossRef]
30. Cheng, L., Guo, H., Gu, Z., Li, Z., Hong, Y. (2017). Effects of compound emulsifiers on properties of wood adhesive with high starch content. International Journal of Adhesion and Adhesives, 72, 92–97. DOI 10.1016/j.ijadhadh.2016.10.001. [Google Scholar] [CrossRef]
31. Yang, Y., Zhou, Z., Guo, Y., Wu, L. (2012). Effect of defects in the adhesive layer on strength of adhesively bonded single−lap composites joints. Acta Materiae Compositae Sinica, 29(5), 157–163. [Google Scholar]
32. Mizera, K., Ryszkowska, J. (2019). Thermal properties of polyurethane elastomers from soybean oil−based polyol with a different isocyanate index. Journal of Elastomers and Plastics, 51(2), 157–174. [Google Scholar]
33. Cornill, A., Auvergne, R., Figovsky, O., Caillol, S. (2017). A perspective approach to sustainable routes for non−isocyanate polyurethanes. European Polymer Journal, 87, 535–552. DOI 10.1016/j.eurpolymj.2016.11.027. [Google Scholar] [CrossRef]
34. Gao, Z., Wang, W., Zhao, Z., Guo, M. (2011). Novel whey protein−based aqueous polymer−isocyanate adhesive for glulam. Journal of Applied Polymer Science, 120(1), 220–225. DOI 10.1002/app.33025. [Google Scholar] [CrossRef]
 | This work is licensed under a Creative Commons Attribution 4.0 International License, which permits unrestricted use, distribution, and reproduction in any medium, provided the original work is properly cited. |