DOI: 10.32604/jrm.2021.014479
ARTICLE
Microparticle Effect of Carbon Dioxide Hydrate Crystal Nucleus in Reaction Kettle
1MOE Key Laboratory for Enhanced Oil and Gas Recovery, Northeast Petroleum University, Daqing, China
2Petro China Jidong Oilfield Company, Tangshan, China
3Oil Production Engineering Research Institute of Daqing Oilfield, Petro China, Daqing, China
4School of Science, Zhejiang University, Hangzhou, 310000, China
*Corresponding Author: Yujie Bai. Email: sygcbyj@163.com
Received: 30 September 2020; Accepted: 03 November 2020
Abstract: This study analyzed the partial effect of carbon dioxide hydrate in reaction kettle experiments. The particle and bubble characteristics of the crystal nucleus during carbon dioxide hydrate decomposition were observed under the microscope. The results showed that in the temperature range of 0.5°C–3.5°C, the pressure range of 3 MPa–5.5 MPa, phase characteristics in the reaction kettle changed in a complex fashion during carbon dioxide hydrate formation. During hydrate decomposition, numerous carbon dioxide bubbles were produced, mainly by precipitation at high temperatures or in the hydrate cage structure. The hydrate crystal nucleus initially exhibited fluidity in the reaction. However, as the reaction progressed, the hydrate crystal nucleus migrated upward under the influence of gravity and carbon dioxide diffused into the aqueous phase. Next, the hydrate was formed and accumulated, finally forming a solid carbon dioxide hydrate layer.
Keywords: Carbon dioxide hydrate; decomposition; induction time; particle characteristics
As a greenhouse gas, carbon dioxide (CO2) can be buried through injection into geological formations. Currently, several oilfields worldwide have adopted carbon dioxide displacement for improving oil recovery. However, CO2 hydrate is produced in the wellbore during injection. Hydrate is a clathrate envelope, water molecules form a lattice structure in hydrates, the gas molecules fill the holes between the lattice (Fig. 1).
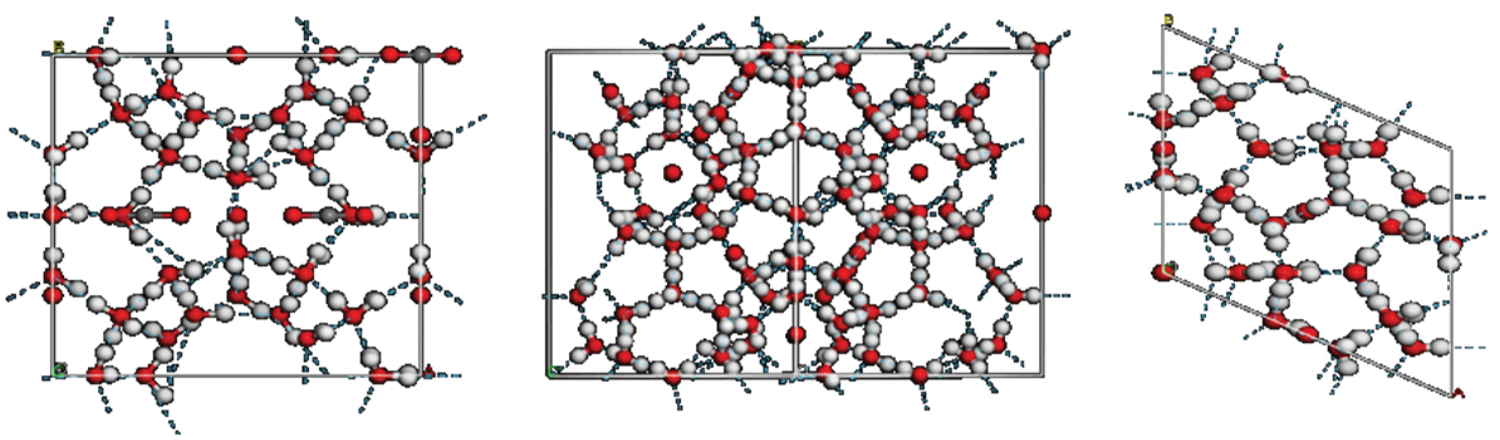
Figure 1: Crystal structures of different types of hydrate
Toschev et al. [1] proposed the probability distribution function (PDF) method after hundreds of parallel nucleation control experiments using platinum and cadmium electrolysis. First, the probability distribution equation of theoretical nucleation was established, then the experimentally induced time was arranged with an experimental probability matrix, and finally the permutation curve was fitted to the theoretical probability distribution equation. Adisasmito et al. [2] deduced a hydrate nucleation mechanism by verifying gas hydrate formation on the ice surface and through experimental study of the cyclopropane hydrate kinetics, which is the hypothesis of unstable clustering nucleation. Baez et al. [3] proposed the interface nucleation hypothesis, and Kvamme [4] proposed a similar hypothesis. Takeya et al. [5] applied the PDF method to analyze CO2 hydrate nucleation data. Radhakrishnan et al. [6] found that the energy barriers of accumulation were much larger than those of decomposition when the cluster energy was measured. This resulted in decomposition being thermodynamically favored over accumulation, causing the unstable clustering nucleation hypothesis to be rejected, and the local nucleation hypothesis to be proposed. Moon et al. [7] proposed a similar model, and Roelands et al. [8] further improved the model. In the same year, Kirsch et al. [9] discovered that the probability of forming nuclei within a certain time interval could be expressed using Poisson’s law of distribution, which established a method for describing the theoretical probability distribution equation.
Sloan et al. [10] proposed a relationship between critical size and energy barriers in “Clathrate Hydrates of Natural Gases”, finding that a smaller critical size would lead to lower energy barriers. When the energy barrier was sufficiently small, increasing the supersaturation level led to spontaneous nucleation. Based on the Kolmogorov–Johnson–Mehl–Avrami equation, Kashchiev et al. [11] proposed a method to estimate the nucleation rate using the degree of supercooling and the related mathematical model, which was applicable to nucleation of a single gas component hydrate under stable cooling. In the same year, Jacobson et al. [12] proposed the “speckle mechanism” by simulating the molecular dynamics of methane and CO2, and analyzing the above hypotheses, finding that the unstable clustering hypothesis underestimates the essential role of gas molecules in hydrate nucleation, and that the cluster needs to overcome the free energy barrier before reaching the critical growth size. The local structure hypothesis overestimates the importance of the gas molecular weight required for effective local rearrangement. The spatial configuration of dissolved gas molecules near the interface has a greater influence on gas entry and water nucleation in the cage, and the interfacial nucleation hypothesis might be affected by nucleation beginning at the vapor side of the interface. In other studies, Maeda [13] measured the nucleation rate of natural gas hydrate, obtained the nucleation curve of natural gas hydrate, and considered the nucleation rate to be linearly correlated with system size [14–17].
Some studies have focused on the hydrate crystal nucleus and nucleation [18–22]. But there are few researches on the bubble effect and particle effect of hydrate crystal nucleus. Ohno et al. [23] first discovered hydrate bubbles in glaciers in 2004, but did not conduct in-depth research; Takahashi et al. [24] studied the bubble effect of hydrate, observed and analyzed the bubble characteristics of hydrate, and believed that the bubble effect affected the formation rate of hydrate, but there was no further study on the cause of the bubble effect. Jonathan et al. [25] studied the effect of bubble size and density on the conversion of methane into hydrate. Bagherzadeh et al. [26] studied the formation of bubbles during the decomposition of methane hydrate by means of molecular simulation, and believed that if methane molecules did not diffuse quickly enough from the liquid phase, methane molecules would coalescence and form bubbles. However, this is only an appearance, which does not explain why the bubble will appear “spot” overflow in the process of hydrate decomposition, because the conduction of pressure and temperature is gradually diffused. Yu et al. [27] studied the formation process of hydrate in methane bubble in the presence of salt. In order to study the bubble effect and particle effect of CO2 hydrate in the decomposition process, hydrate formation in the reactor was investigated through a low-temperature and high-pressure reactor and the induction time of freeze plugging in the wellbore during the process of carbon dioxide burial and storage was measured. In the present study, we observed the microscopic characteristics of CO2 hydrate in the reaction kettle using electron microscopy, and analyzed the effects of microscopic particle characteristics of the CO2 hydrate crystal nucleus on the optical properties, formation state, and decomposition characteristics of the hydrate. Finally, the root cause of the particle effect and bubble effect of hydrate was determined by molecular simulation. The results are of great significance for CO2 sequestration.
CO2 (purity 99.99%, provided by Daqing Xuelong Qigong Co., Ltd.) and distilled water (obtained by secondary distillation in the laboratory).
The CO2 hydrate formation experiment was conducted using a visual reaction kettle. A schematic diagram of the experimental device is shown in Fig. 2. The maximum pressure of the experimental unit was 15 MPa (Measurement accuracy: 0.01 MPa), and the temperature could be controlled from –5°C to 40°C (Measurement accuracy: 0.1°C). The experimental device was mainly composed of a temperature control system, temperature and pressure monitoring system, reaction kettle with an observation window, and a CO2 gas cylinder.
Freon in the storage tank (Fig. 2a) conducted heat exchange with antifreeze in the circulation system, mainly through the compressor and afterward, which reduced the temperature of the entire system. The heating and temperature control systems were used because different experimental temperatures were required. In the experiments, antifreeze liquid was mainly heated in the cooling tank, and the temperature of the entire system was increased using the circulation system. The temperature control system used a thermal resistance temperature probe to detect the reaction kettle temperature, and then controlled the entire experiment temperature using the control instrument.
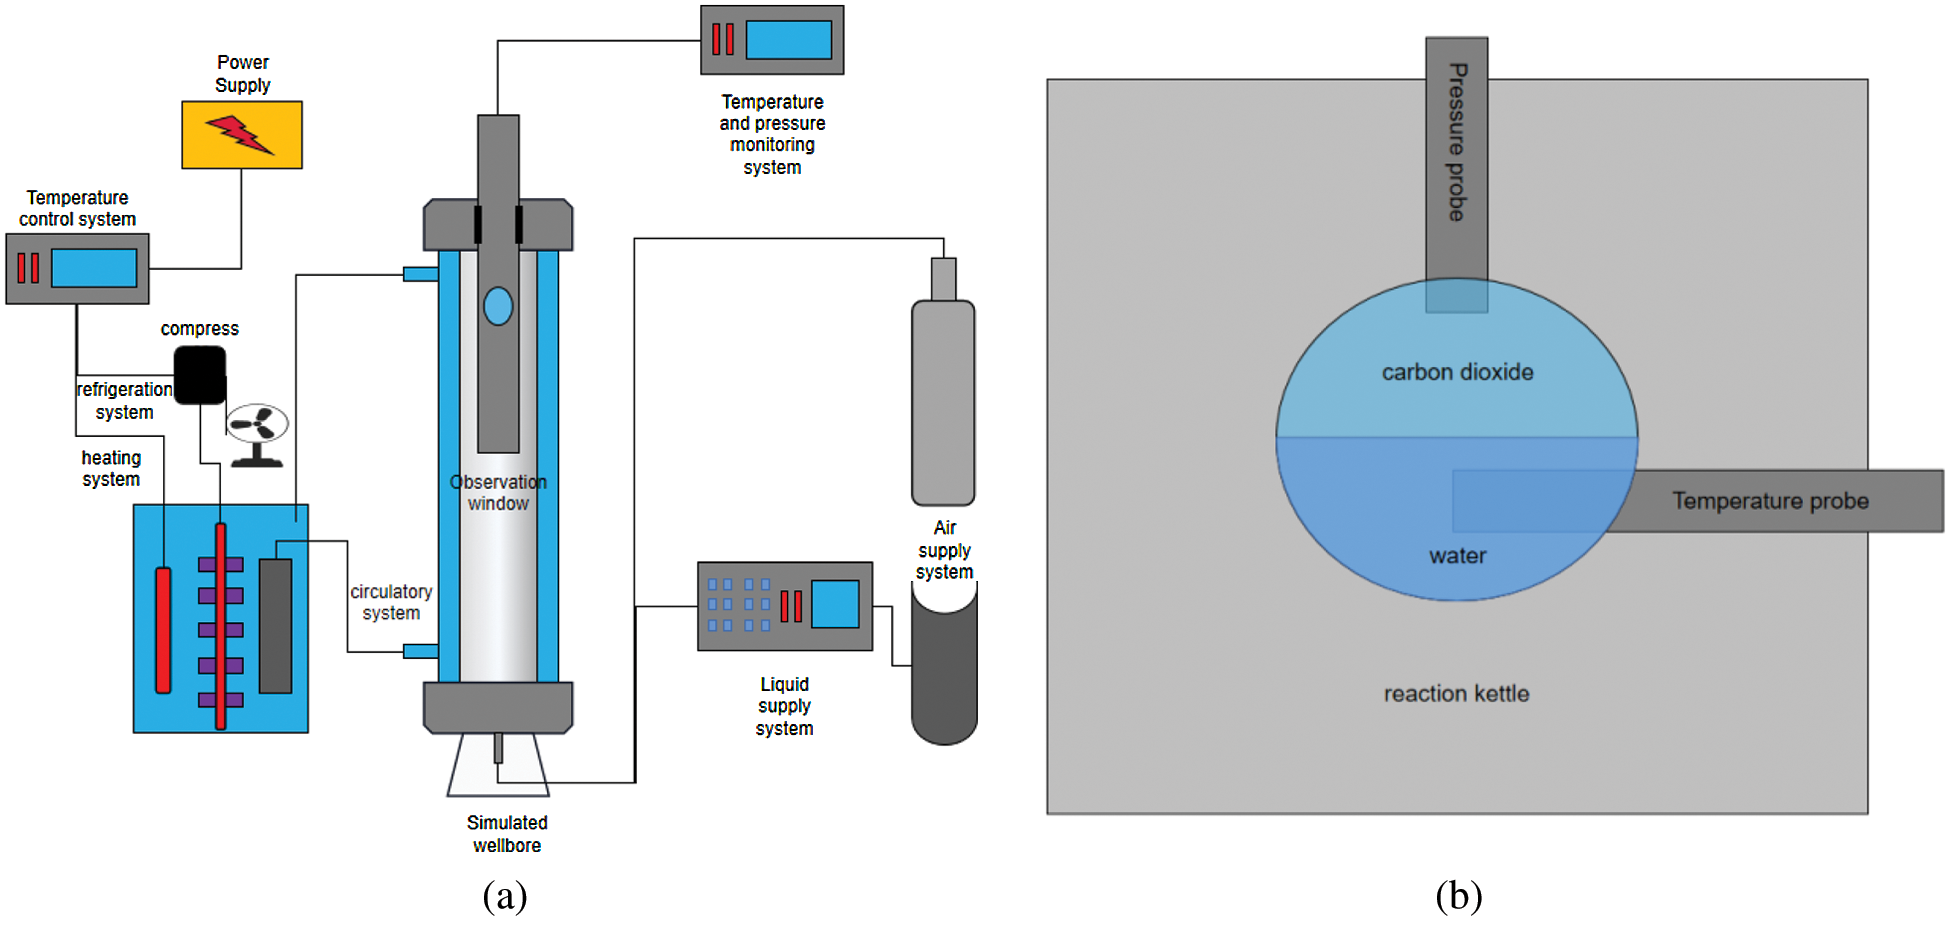
Figure 2: Experimental setup of CO2 hydrate formation (a) Structure diagram of carbon dioxide hydrate generation unit (b) Schematic diagram of temperature and pressure monitoring mode
The experimental device was provided by the China Nantong Huaxing Petroleum Instrument Factory. The height of the reactor was 0.5 m and the temperature error in the reactor during multiple tests was ±0.1°C. The temperature rise rate in the reactor was approximately 3–5 min, whereas the temperature decrease rate was approximately 5–10 min. However, since the temperature control system adopts a constant-temperature water bath cycle, the water bath temperature can be set in advance at the beginning of the experiment. After the temperature was stabilized, the cycle was turned on. This method can allow the temperature in the reactor to reach the target temperature rapidly at the beginning of the experiment (approximately 1 min). Since the reactant is carbon dioxide, we chose a nickel-chromium alloy as the material for the entire reactor because it has good corrosion resistance and thermal stability. The formation state of hydrate in the pipeline can be observed through an observation window at the upper part of the reactor. Since the hydrate formation reaction requires low temperature and high pressure, sapphire glass was selected as the material for the observation window, with a diameter of 50 mm. During the formation of hydrate, the temperature and pressure in the reactor will change; therefore, we placed temperature and pressure sensors into the reactor and measured the change in temperature and pressure by applying an external electrical signal (Fig. 2b).
Considering that hydrate is gradually accumulated during the freezing process of well bore, the borehole wall maintains a low temperature during the freezing process, and there is a cooling time at the beginning of the experiment, it is unreasonable to characterize the induction time of hydrate formation by monitoring the temperature and pressure. In addition, only the hydrate accumulated on the shaft wall will have an effect on the freeze plugging in the well bore. Therefore, the induction time of hydrate formation was measured through observation window. It was believed that the timing started upon the formation of hydrate in the observation window; this time was the initial time of hydrate formation induction time. If the hydrate is completely filled in the observation window, it is considered that freeze plugging has occurred, and at this moment, the reaction is terminated.
First, distilled water was added into the reaction kettle until the liquid level reached halfway on the observation window. Next, the cylinder was opened to allow CO2 into the rector. The temperature and pressure monitoring system was then switched on to observe temperature and pressure changes in the reactor. The reaction temperature was set using the temperature control system and the reaction pressure was set using the gas cylinder. When the temperature in the storage tank reached the experimental temperature, coolant circulation was initiated and the experiment began. Hydrate formation in the reaction kettle was observed. The time at which hydrate started forming in the reactor was set as the reaction start time, and the time at which hydrate filled the reactor was used as the reaction end time. The characteristics of hydrate formation and changes in temperature and pressure in the reaction kettle were observed. The experimental Steps (1)–(5) were repeated several times to confirm the accuracy of the experimental results.
2.5 Molecular Dynamics Simulation
Since it is difficult for the nonpolar gas molecules and polar water molecules to form stable crystal state, we placed a part of the solid crystal hydrate in the initial structure as crystal nucleus. The energy of the initial structure is minimized by running a short NVT simulation of approximately 400 ps for the relaxation of solid–liquid interface. After relaxation, the entire system was simulated using NPT ensemble, and the trajectory file was obtained. Velocity Verlet algorithm calculated the motion equation of the atoms, and the time step is 1 fs. Water molecules can adopt rigid models, such as SPC or TIP4P, to constrain their bond angle length. Methane is described by the EPM2 model. The potential energy parameters of the interactions between different types of atoms were obtained by the standard Lorentz–Berthelot mixing rule. The temperature and pressure were controlled at 275 K and 10 MPa, respectively. The truncation radius of the short-range interaction was 12 Å, and the long-range Coulomb force adopted the PPPM algorithm.
3.1 Induction Time for CO2 Hydrate Formation
In this study, the induction time of carbon dioxide hydrate formation was studied based on the hydrate freezing and plugging process in the well bore. So in this study, the time at which hydrate was observed through the observation window was set as the start time, while the time at which hydrate in the reaction kettle complete generated was set as the end time. The hydrate formation process observed at 2.5°C is shown in Fig. 3 as an example.
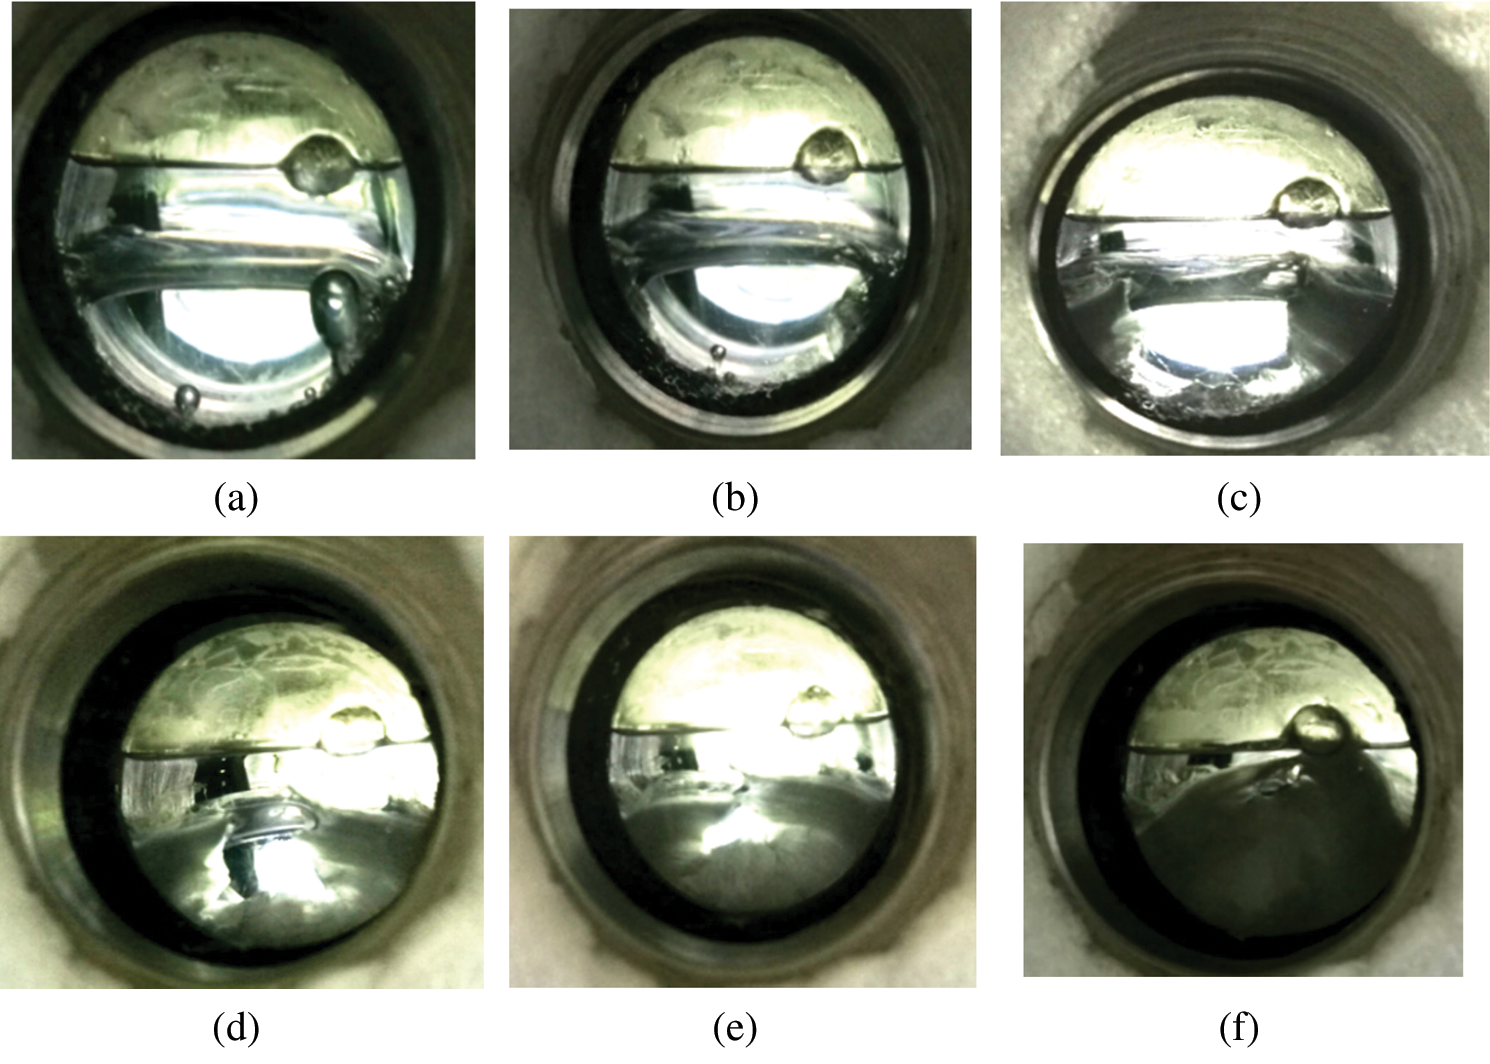
Figure 3: Hydrate formation process at 3.5°C (a) 0 min, (b) 2 min, (c) 7 min, (d) 11.5 min, (e) 15 min, (f) 21.5 min
As shown in Fig. 3, CO2 hydrate is preferred at the boundary of the observation window and at the interface between liquid carbon dioxide and water. From the observation window, it can be seen that the formation of small hydrates indicates the initial time of the reaction. With an increase in the reaction time, the hydrates gradually accumulate in the water phase (Figs. 3a–3f) and fill the observation window. In addition, there is a liquid carbon dioxide interface at the interface between the water phase and gaseous carbon dioxide (Fig. 3a). This can be attributed to the fact that the system is at a relatively high temperature (approximately 25°C at room temperature) initially. Once the system temperature is decreased, the dissolved carbon dioxide gradually precipitates and forms a carbon dioxide layer.
The experimental pressure was set at 4 MPa. Initial temperatures of 0.5°C, 1.5°C, 2.5°C, and 3.5°C were tested, and temperature changes in the reaction kettle were measured over time, as shown in Fig. 4.
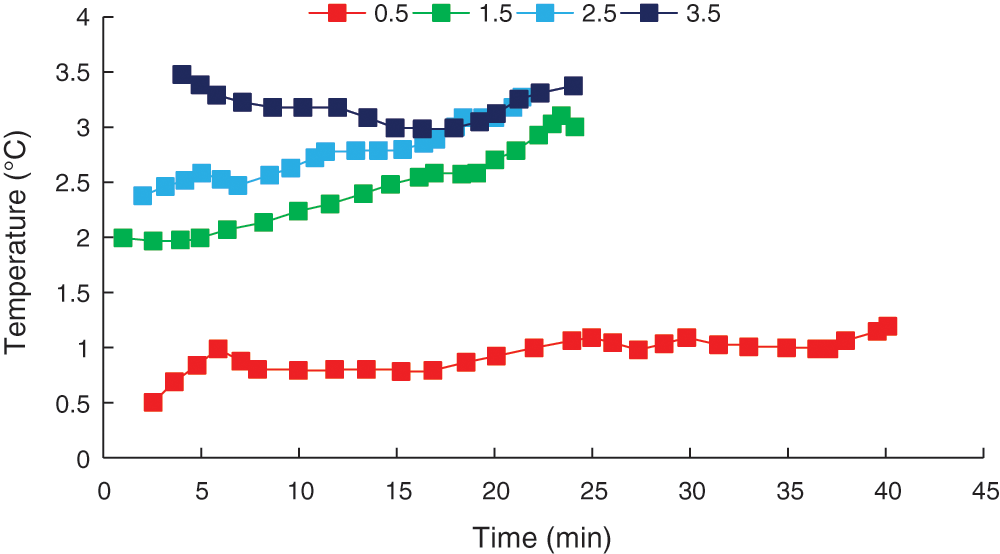
Figure 4: Temperature change curve
As shown in the temperature change curve (Fig. 4), the reactor temperature showed a slow increasing trend over time. This was attributed to CO2 hydrate forming faster and releasing large amounts of heat, which increased the system temperature. When the initial temperature was 3.5°C, the system temperature initially decreased and then increased over time. This difference was due to liquid CO2 present at the initial stage of the reaction at this temperature. As the reaction was quite violent, liquid CO2 was transformed into gaseous CO2, absorbing heat in the process and reducing the temperature. Gaseous CO2 then reacted with water to form the hydrate, emitting heat and increasing the system temperature.
Experiments were conducted at 2°C and initial pressures of 3 MPa, 3.5 MPa, 5 MPa and 5.5 MPa, and the pressure varied over time, as shown in Fig. 5.
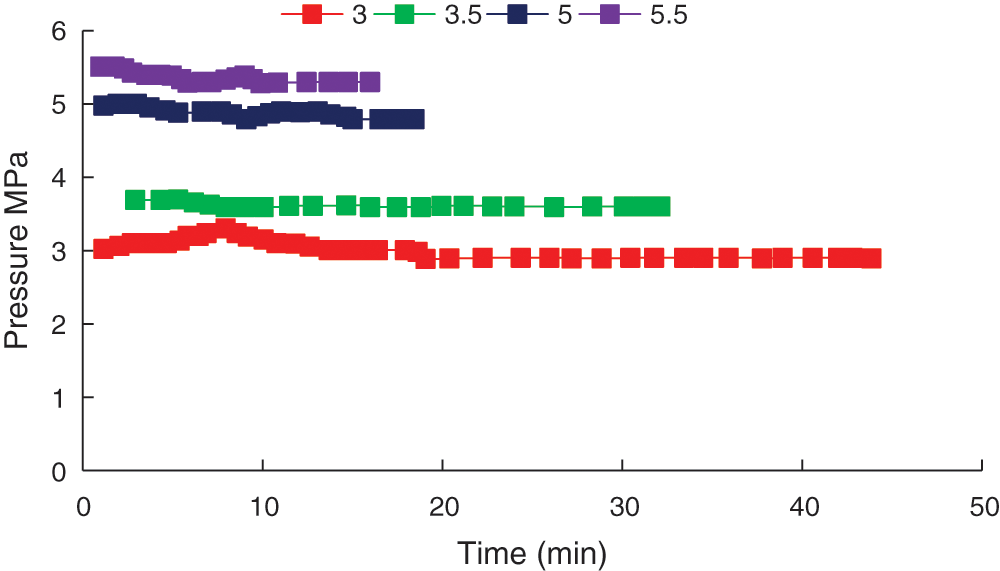
Figure 5: Pressure change curve under different pressure conditions
The pressure initially dropped when the hydrate started to form. An earlier drop point indicated earlier hydrate formation, showing that hydrate formation was easier. At the same temperature, a higher pressure resulted in easier hydrate formation. When the initial pressure was 3 MPa, the pressure in the reactor initially increased. This was attributed to the initial reaction being relatively violent, which increased the reactor temperature, making dissolved gaseous CO2 more likely to escape from the water under low pressure conditions, which caused the reactor pressure to increase.
As shown in Fig. 6, a thick liquid CO2 layer was stored at 5.5 MPa.
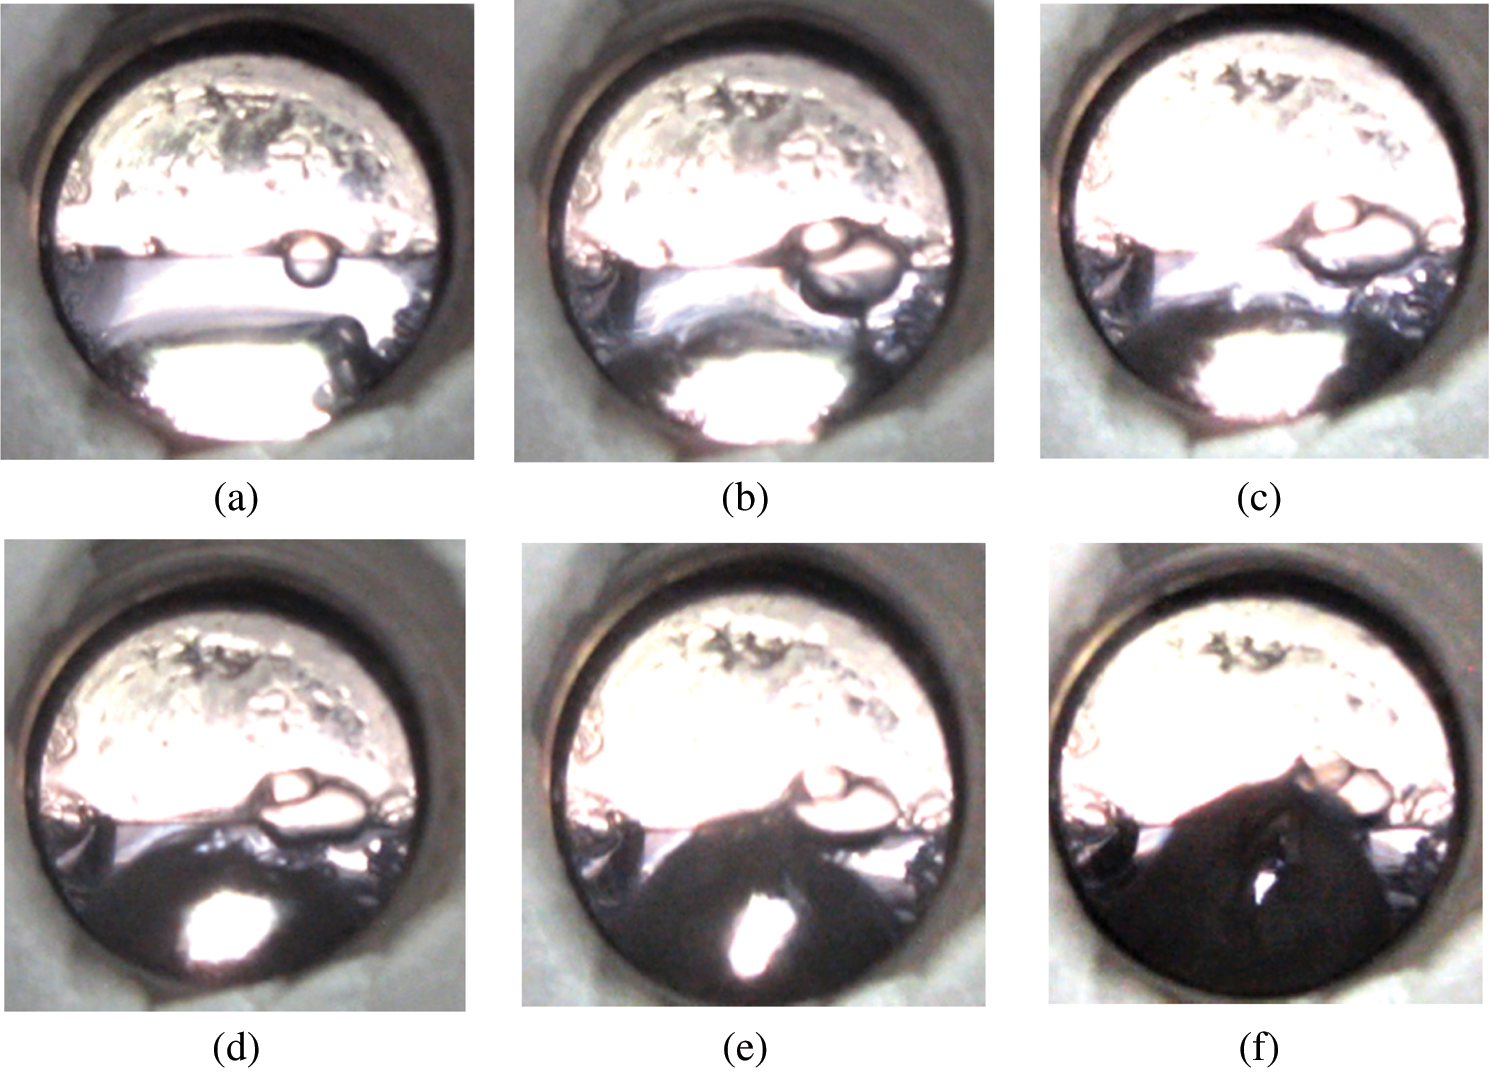
Figure 6: Hydrate formation at 5.5 MPa (a) 0 min, (b) 3 min, (c) 7 min, (d) 10 min, (e) 12.5 min, (f) 16 min
The induction times for CO2 hydrate formation at different temperatures and pressures are shown in Tab. 1.
Table 1: Induction time of CO2 hydrate formation at different temperatures and pressures
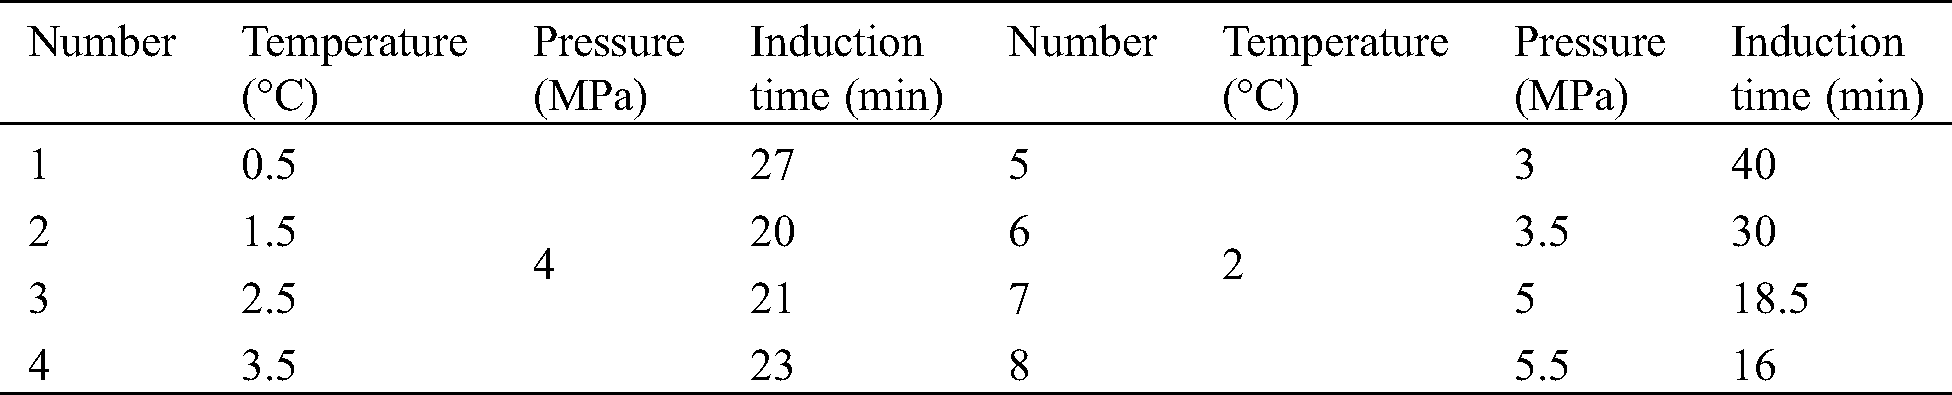
Under low temperature and high pressure conditions, the induction time for hydrate formation was relatively short. This was attributed to a lower set temperature causing a greater degree of subcooling and greater driving force, resulting in a more complete reaction. Under normal circumstances, the induction time for hydrate formation in the reactor was about 15–40 min. The formation states of CO2 hydrate at different temperatures are compared, as shown in Fig. 7.
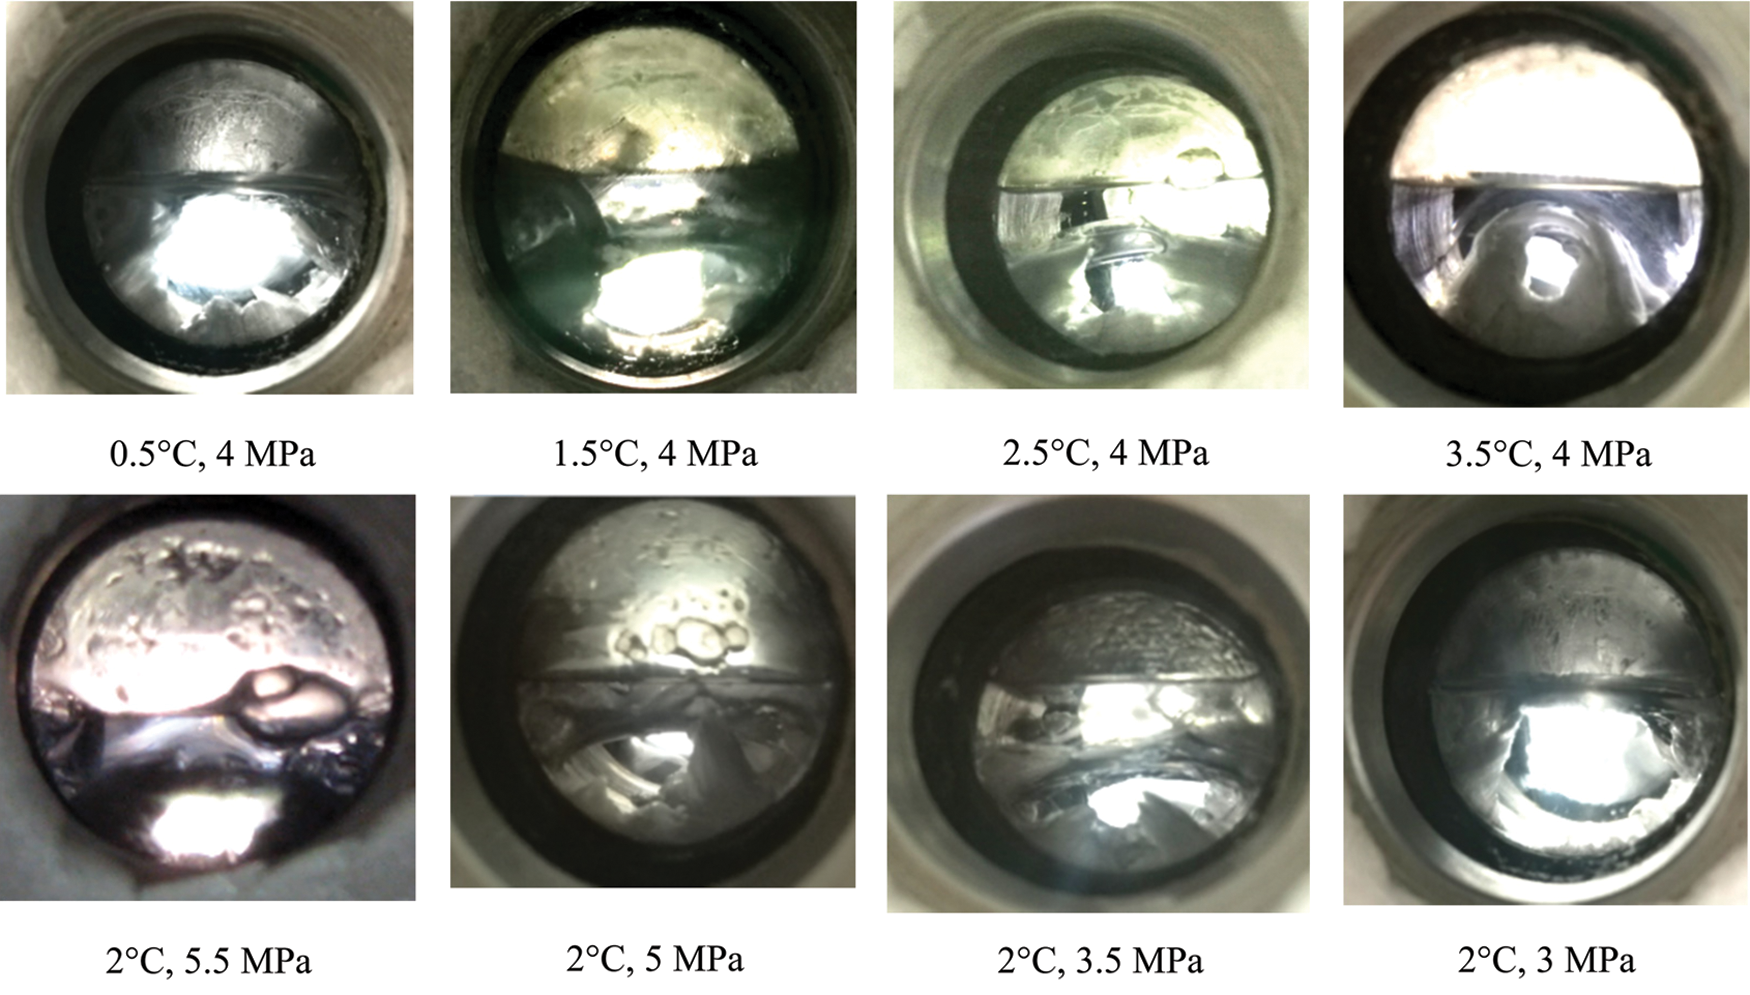
Figure 7: Liquid carbon dioxide level in reactor under different temperature and pressure
The liquid carbon dioxide layer is very thin at 0.5°C and 4 MPa; however, this does not suggest that the amount of carbon dioxide is less. In addition to the liquid carbon dioxide, the water phase will still dissolve a large amount of carbon dioxide, and this carbon dioxide will be added to the reactants. Therefore, the temperature, pressure, and phase characteristics in the reactor will change in a complex manner during the formation of CO2 hydrate.
3.2 Microscopic Bubble Characteristics of CO2 Hydrate Decomposition
To observe the CO2 hydrate decomposition process and microscopic bubble characteristics inside the reactor, a vertical hydrate reactor was placed horizontally and the microscopic characteristics of CO2 hydrate decomposition were observed via microscope, as shown in Fig. 8.
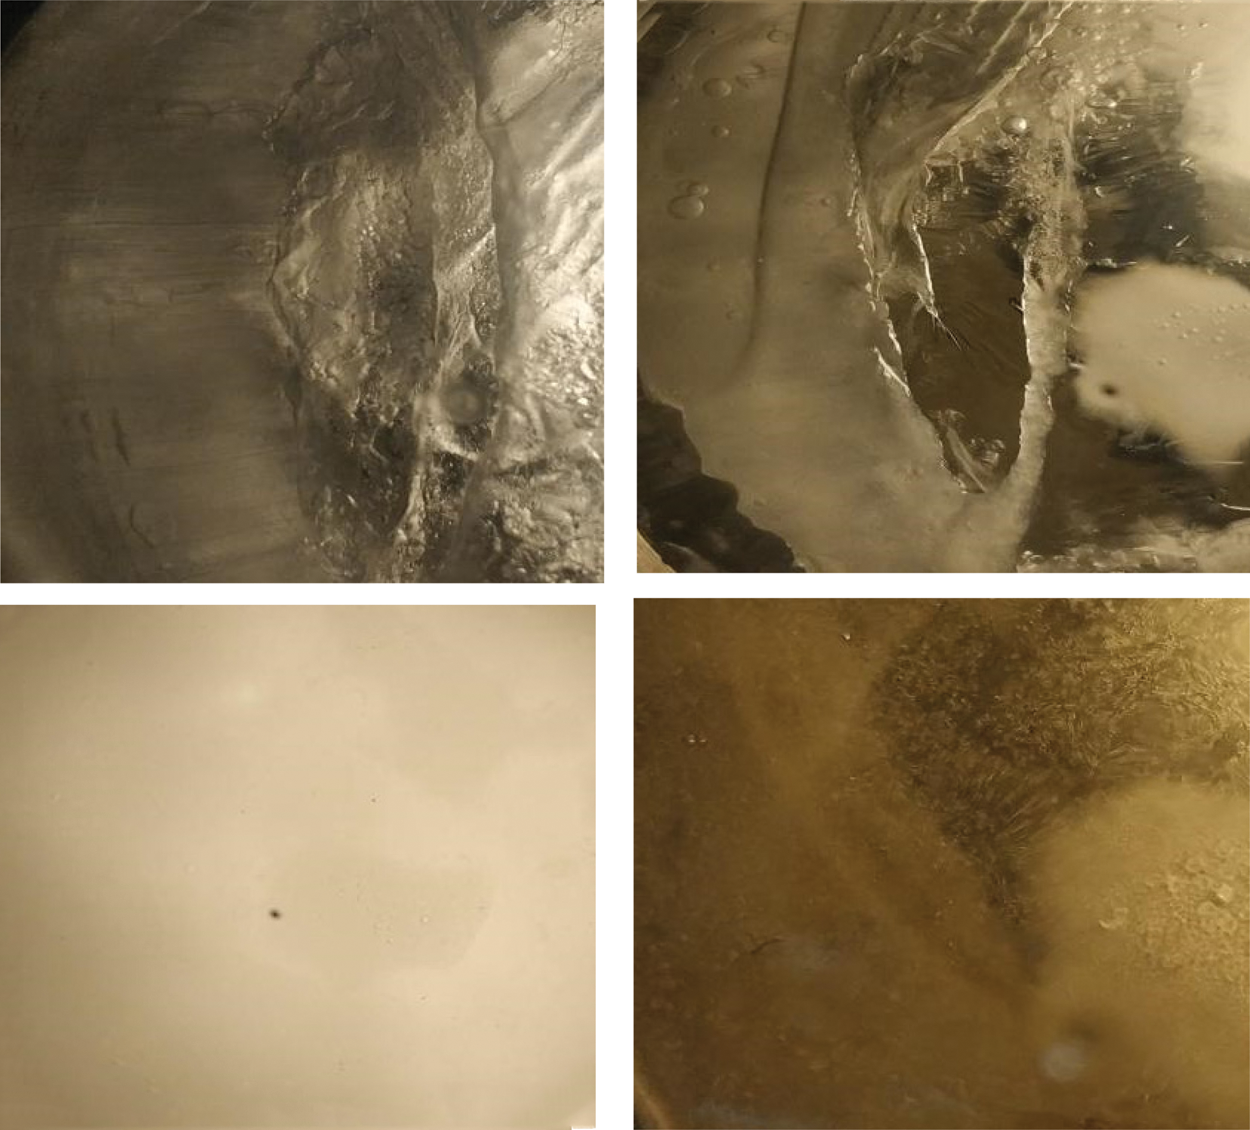
Figure 8: CO2 decomposition process
Hydrate was rapidly decomposed from the outside to inside. During the decomposition process, the apparent interface between the hydrate and liquid mixture was observed, accompanied by numerous CO2 bubbles. This was mainly due to the increased reactor temperature during the decomposition process, which caused decreased CO2 solubility, the precipitation of many CO2 bubbles, and the production of CO2 in the hydrate cage structure during decomposition, resulting in the formation of many bubbles. The CO2 hydrate decomposition process was observed using a microscope, as shown in Figs. 9 and 10.
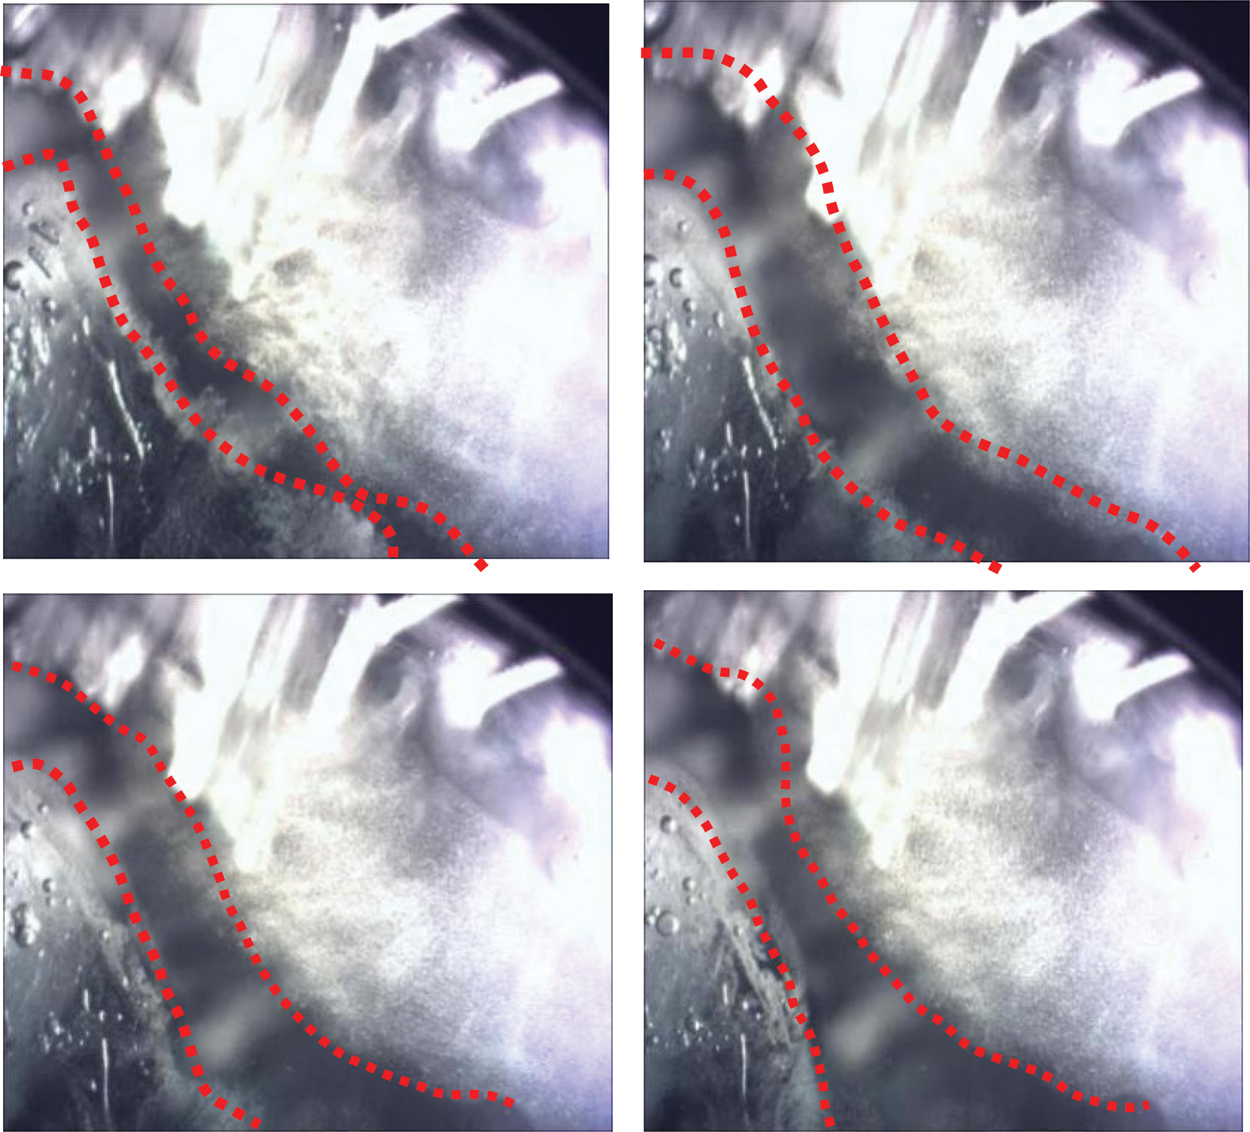
Figure 9: Microscopic characteristics of CO2 hydrate decomposition
As the CO2 hydrate decomposed, the apparent interface between the hydrate and liquid mixture was observed. Furthermore, the carbon dioxide hydrate phase contained many air bubbles. The bubble distribution reflexes the hydrate decomposition. The air bubble was produced at a relatively high temperature, and the bubbles increase the speed of hydrate decomposition. Our analysis shows that the formation of bubbles disperses carbon dioxide hydrate into numerous small hydrate nucleation particles. Meanwhile, a large number of bubbles speed up the hydrate decomposition process.
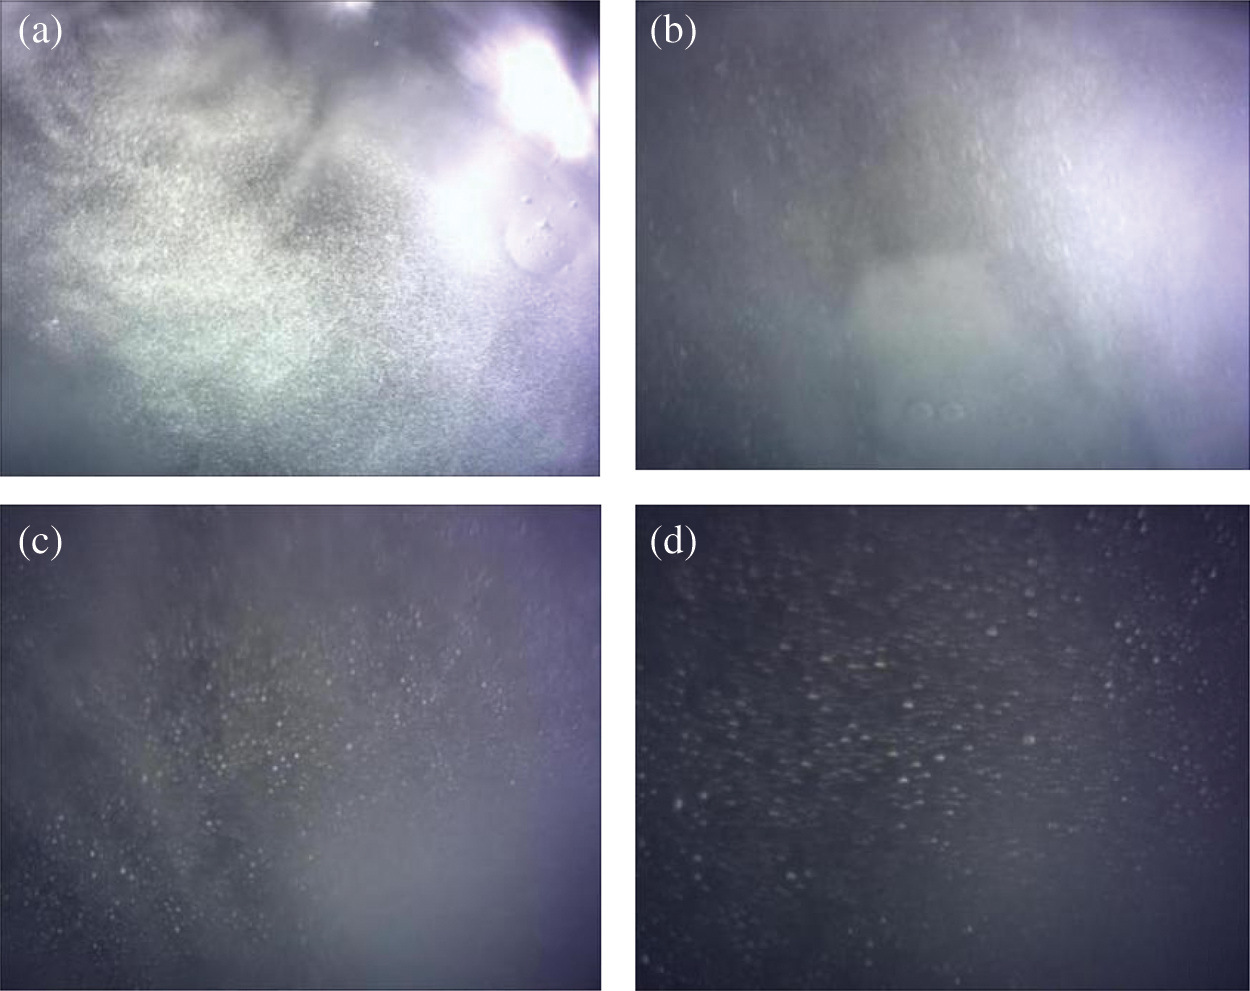
Figure 10: Bubble phenomenon during CO2 hydrate decomposition
Fig. 10a shows the distribution of bubbles in the hydrate at the time of initial decomposition. Bubbles were scattered in hydrate crystals. At this time, most of the hydrate did not decompose and the system did not have strong fluidity, so the bubbles were relatively stable and could be obviously observed through a microscope. With the gradual intensification of decomposition (Fig. 10b), the number of bubbles increased, and the hydrate decomposition was violent, so the system has a certain fluidity. As a result, bubbles are produced on a large scale. It is difficult for microscopes to capture bubbles, and the field of vision of bubbles is relatively fuzzy. When the hydrate is completely decomposed in the system, the temperature in the system gradually stabilizes. In addition to CO2 escaping from the hydrate, dissolved CO2 in water was also precipitated in large quantities. (Fig. 10c) Meanwhile, the field of vision in the microscope gradually became blurred owing to the large number of bubbles in the reactor. The number of bubbles gradually decreased with decreasing decomposition rate, finally stabilizing (Fig. 10d).
The characteristics of varying temperature and pressure during CO2 hydrate decomposition at different initial temperatures were measured, as shown in Figs. 11 and 12.
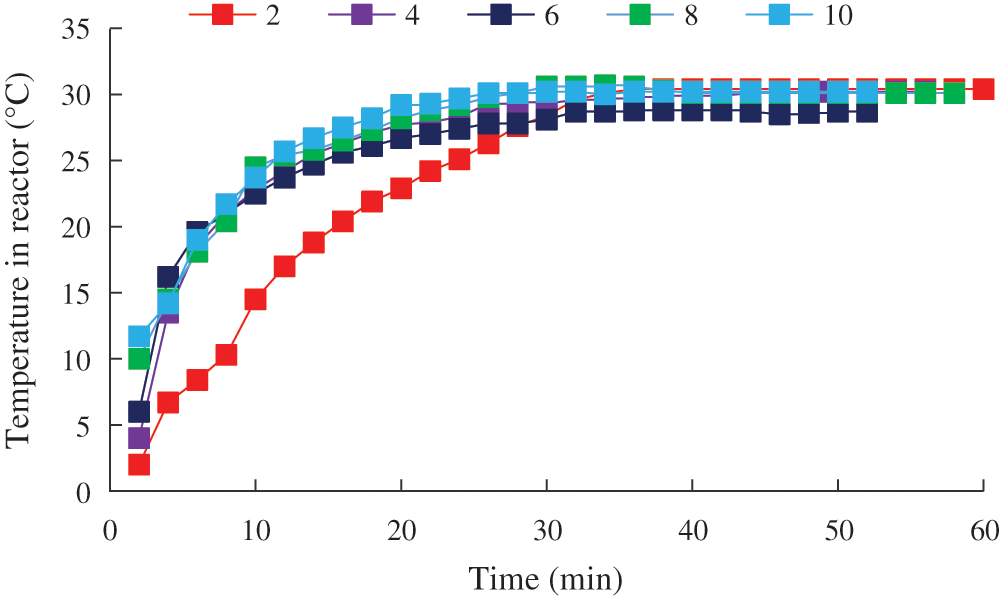
Figure 11: Temperature change in the reactor during CO2 hydrate decomposition
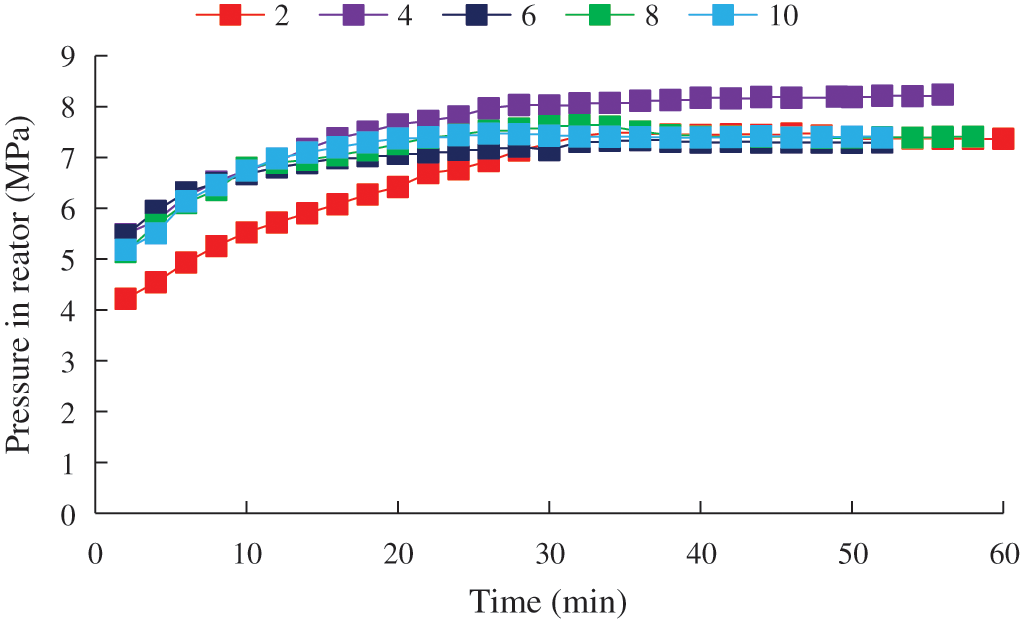
Figure 12: Pressure change in the reactor during CO2 hydrate decomposition
The pressure and temperature stabilization time in the reactor at different generation temperatures was always about 30 min. This indicated that there was no apparent difference in the hydrate decomposition rate under different experimental conditions, which might be due to the good heating effect of the experimental apparatus in its horizontal placement, resulting in no apparent changes in temperature and pressure.
3.3 CO2 Hydrate Particle Phenomenon
During CO2 hydrate decomposition, owing to bubbles escaping, the hydrate decomposed into hydrate particles (hydrate crystal nucleus), which must be generated at the moment of formation. The light transmittance of CO2 hydrate from the beginning of the reaction to complete formation was observed and compared to analyze the CO2 hydrate particle phenomenon, as shown in Fig. 13.
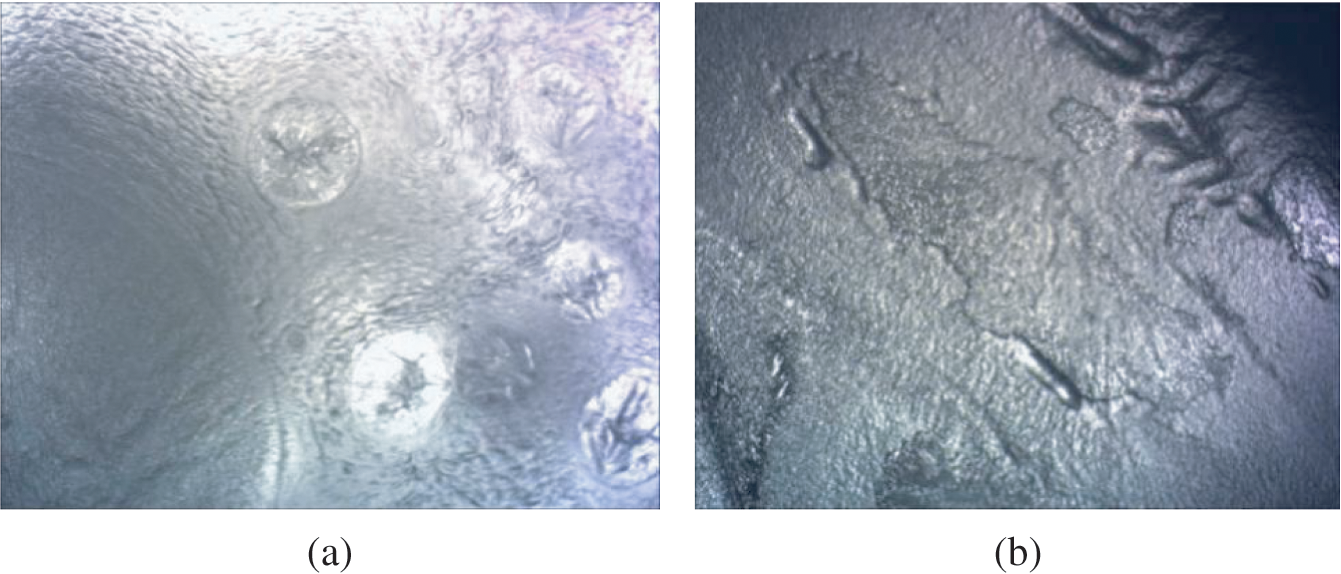
Figure 13: Microscopic photos of CO2 hydrate (a) Microstructure of CO2 hydrate at the beginning of formation (b) Microstructure of fully formed CO2 hydrate
CO2 hydrate was not fully formed at the reaction start, with only scattered particles floating at the CO2 and water interface. The light transmittance of the reactor was strong at this time, while the light transmittance of CO2 hydrate at reaction completion was poor. This phenomenon was attributed to the CO2 hydrate crystal nuclei not initially being closely connected after formation, with the single crystal nucleus being relatively independent (as shown in Fig. 14a). When hydrate crystal nuclei were generated at the water–CO2 interface, they were scattered and distributed, which had relatively little influence on light transmittance. However, as the reaction progressed, the hydrate particles gradually accumulated, and a relationship was gradually established between the hydrate crystal nucleus particles. Accordingly, the light transmittance of the hydrate and water decreased due to differences in their refractive indexes (Fig. 14b).
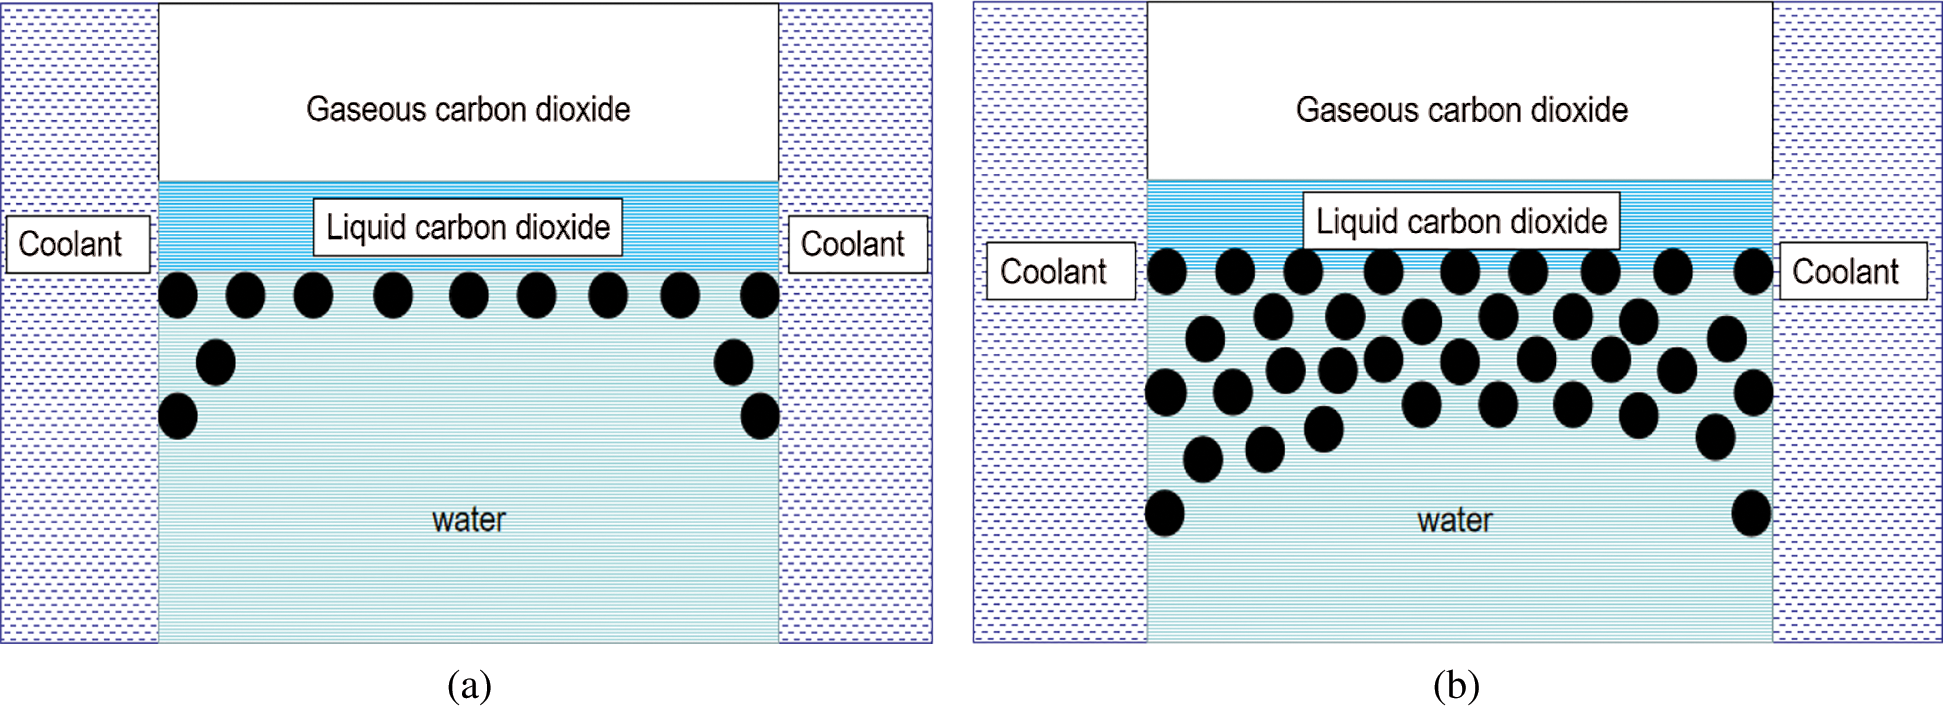
Figure 14: Light transmittance of CO2 hydrate at different times (a) Distribution of hydrate crystal nucleus at reaction initiation (b) Distribution of hydrate crystal nucleus after reacting for some time
The particle effect of the hydrate crystal nucleus not only affected the light permeability of the hydrate in the reactor, but also influenced its formation characteristics. CO2 hydrates at the two-phase interface of CO2 and water initially and after a period of the reaction were compared, as shown in Fig. 15.
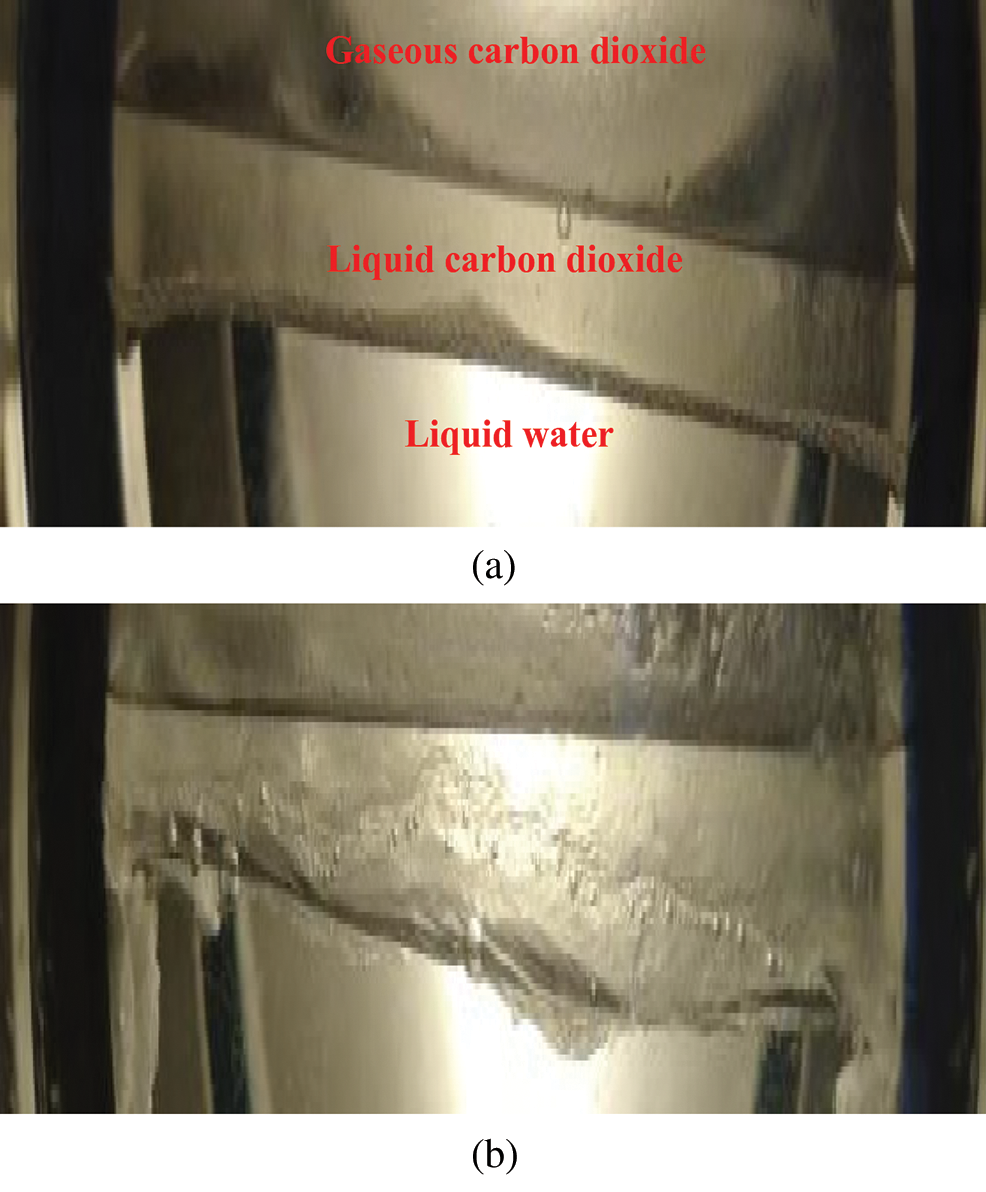
Figure 15: Accumulation and migration of CO2 hydrate crystal nucleus (a) Initial reaction time (b) After reaction progression
Owing to the particle effect, the hydrate crystal nucleus had a flowing property at the initial stage of the reaction, existing as a hydrate slurry. Furthermore, as the hydrate density was lower than the densities of liquid CO2 and water, and the hydrate crystal nucleus was relatively independent and had a certain fluidity, the hydrate crystal nucleus was transported upward. CO2 also dissolved and diffused into the water phase, causing further hydrate formation, accumulation, and, finally, formation of a solid CO2 hydrate layer.
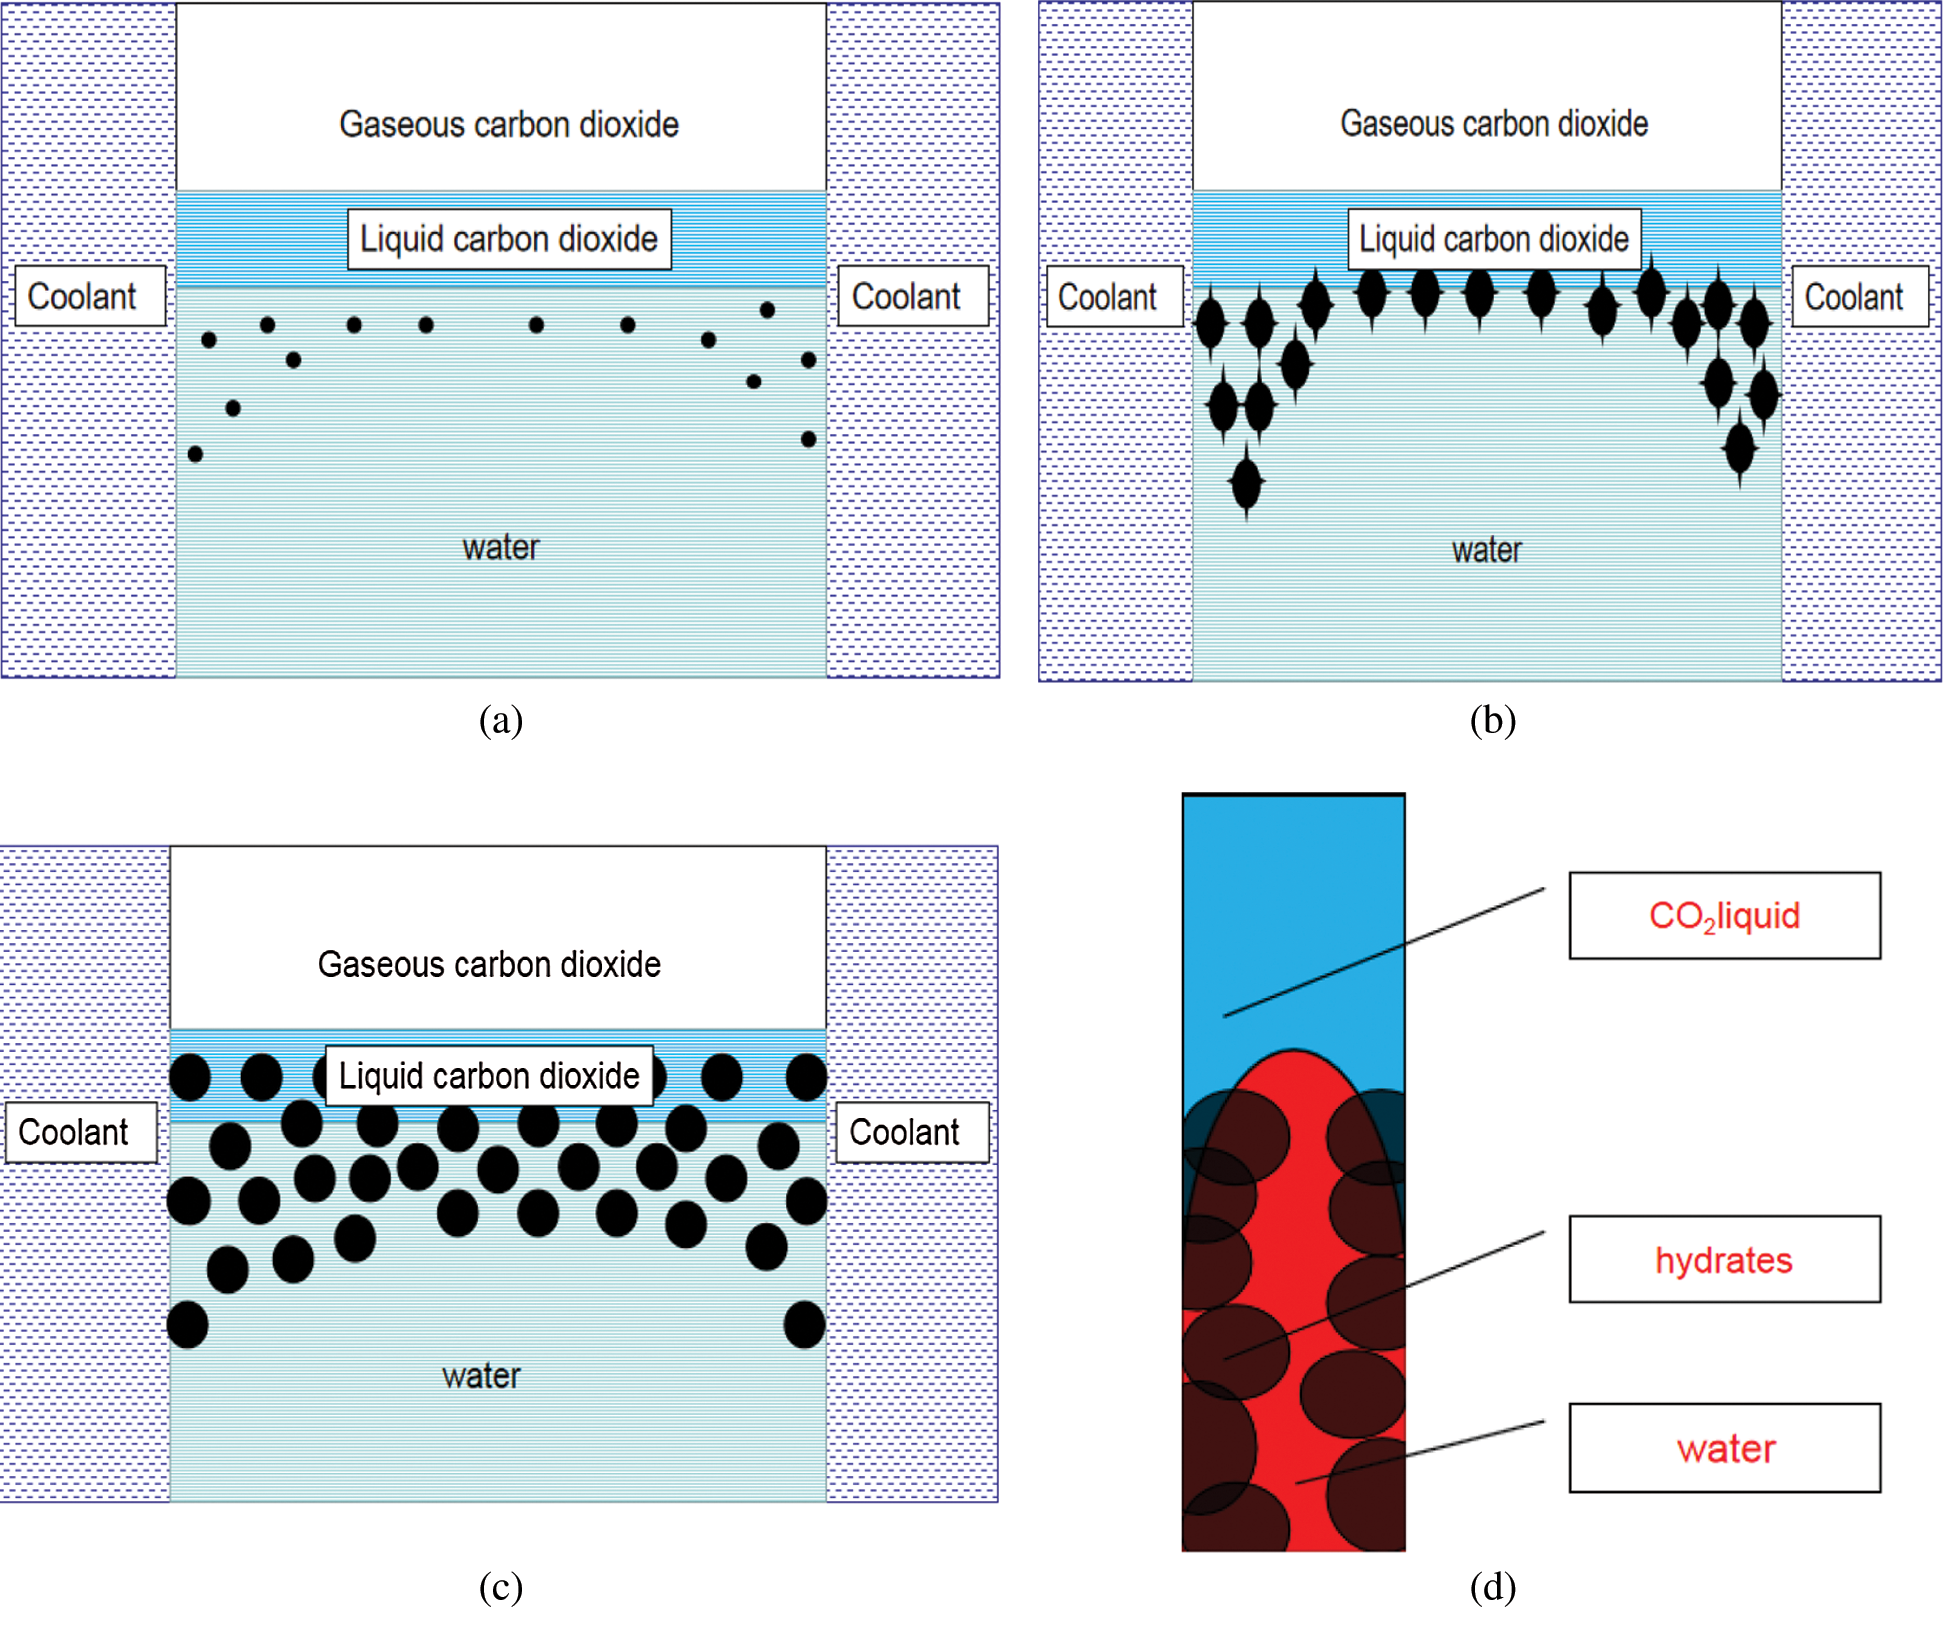
Figure 16: Growth and action principle of hydrate in the reactor (a) Initial distribution of hydrate crystal nucleus (b) Gradual growth of hydrate crystal nucleus (c) Interaction between hydrate crystal nucleus and water (d) Upshifting process of aqueous phase in tiny pores between hydrate crystal nuclei
At the initial stage, when the pressure and temperature conditions met the hydrate formation conditions, the hydrate crystal nucleus started to form (Fig. 16a). As the reaction time increased, the hydrate crystal nucleus grew gradually (Fig. 16b). Eventually, the crystal nucleus moves upward under the influence of gravity. Simultaneously, the crystal nucleus interacted with the crystal nucleus to form tiny pores, and liquid water moved upward under the influence of surface tension between the solid and liquid, forming hydrates in the liquid CO2 phase (Figs. 16c, 16d). Here, we believe that in the process of gradual growth and coalescence of hydrate crystal nucleus, relatively small pores will be generated between the crystal nucleus, and these fine pores will produce capillary effect. Because these crystal nuclei extend from the aqueous phase to the liquid phase of carbon dioxide, the bottom water phase with higher density will migrate upward under the action of capillary force, enter into the liquid phase of carbon dioxide, and further produce carbon dioxide hydrate. But as the reaction progresses, the connections between the crystal nuclei become tighter. In the end, all hydrate crystal nuclei were fused to form a dense hydrate layer, and the water phase at the bottom cannot enter the liquid carbon dioxide layer at the top, which lead to no further hydrate formation at the top and the reaction will be terminated.
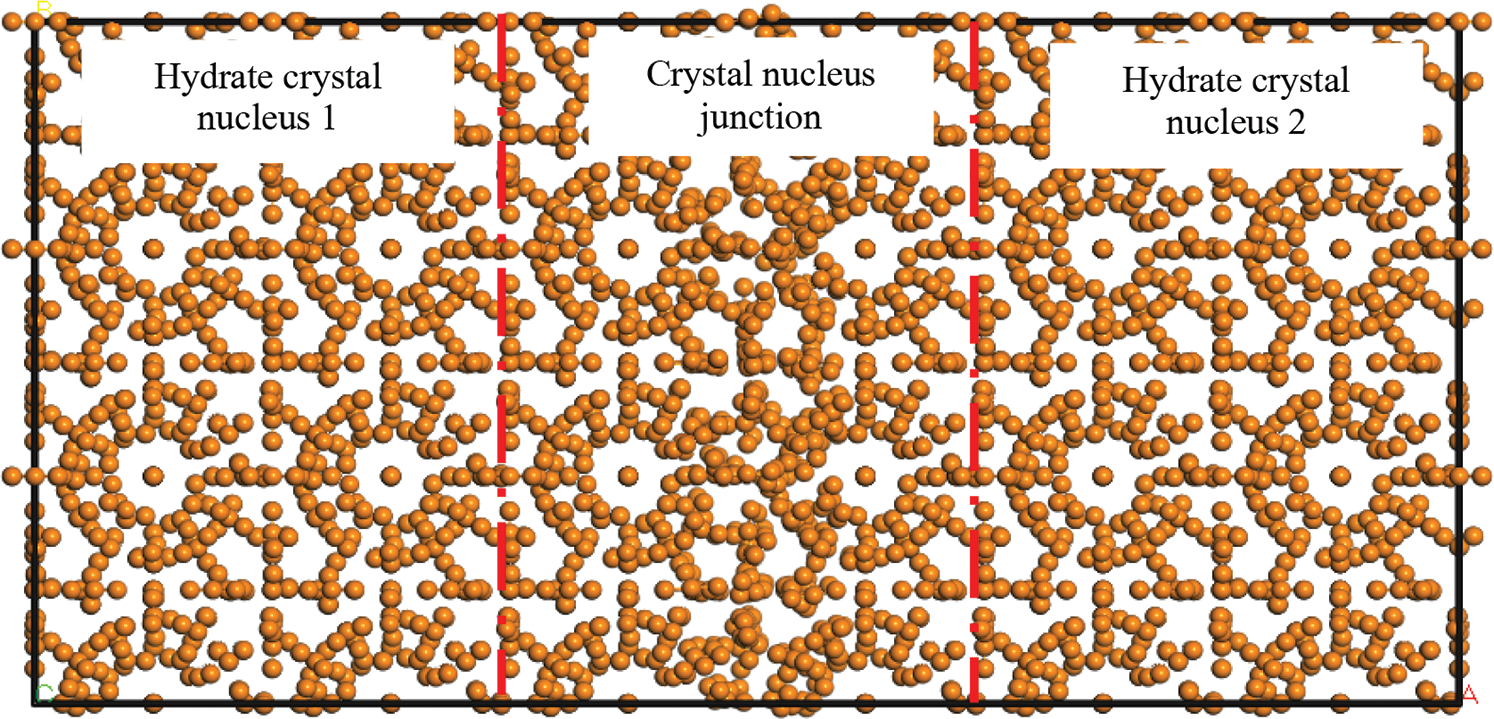
Figure 17: Hydrogen bonding between crystal nuclei during hydrate growth
This particle effect was due to disordered hydrogen bonds at the junction of hydrate crystal nuclei during their gradual growth (Fig. 17). Hydrates in other positions had a regular cage structure. Therefore, when the temperature or pressure of the system changed, the disordered hydrogen bonds at the crystal nucleus junction were broken first, again forming independent hydrate crystal nuclei (independent hydrate particles). However, owing to irregular hydrogen bond fracture, the enveloped gas molecules escaped, causing the appearance of crystal nucleus particles to be accompanied by bubble generation.
3.4 Molecular Dynamics Simulation of Hydrate
To investigate the particle effects of carbon dioxide hydrate, molecular dynamics simulation of hydrate formation was conducted. Several researchers have studied the molecular dynamics simulation of hydrate formation [28,29]. Since hydrates mainly consist of hydrogen bond interactions between oxygen atoms and hydrogen atoms in water, forming a cage structure in which different gas molecules are wrapped. So both methane hydrate and carbon dioxide hydrate have particle effects. Wang et al. [30], Wang et al. [31], Jonathan et al. [32] studied the formation of methane and carbon dioxide hydrate by using similar molecular field and simulation methods, so methane hydrate and carbon dioxide hydrate have strong similarity. Methane hydrate with a more mature simulation technology is adopted to investigate the particle characteristics of hydrate. The formation process of methane hydrate is simulated according to the simulation method described in Section 2.4. Because the nucleation process of hydrate is random, most nucleation processes of hydrate are regular; however, after conducting several simulations, irregular nucleation processes may also occur. The irregular nucleation process of hydrate was analyzed, as shown in the Fig. 18.
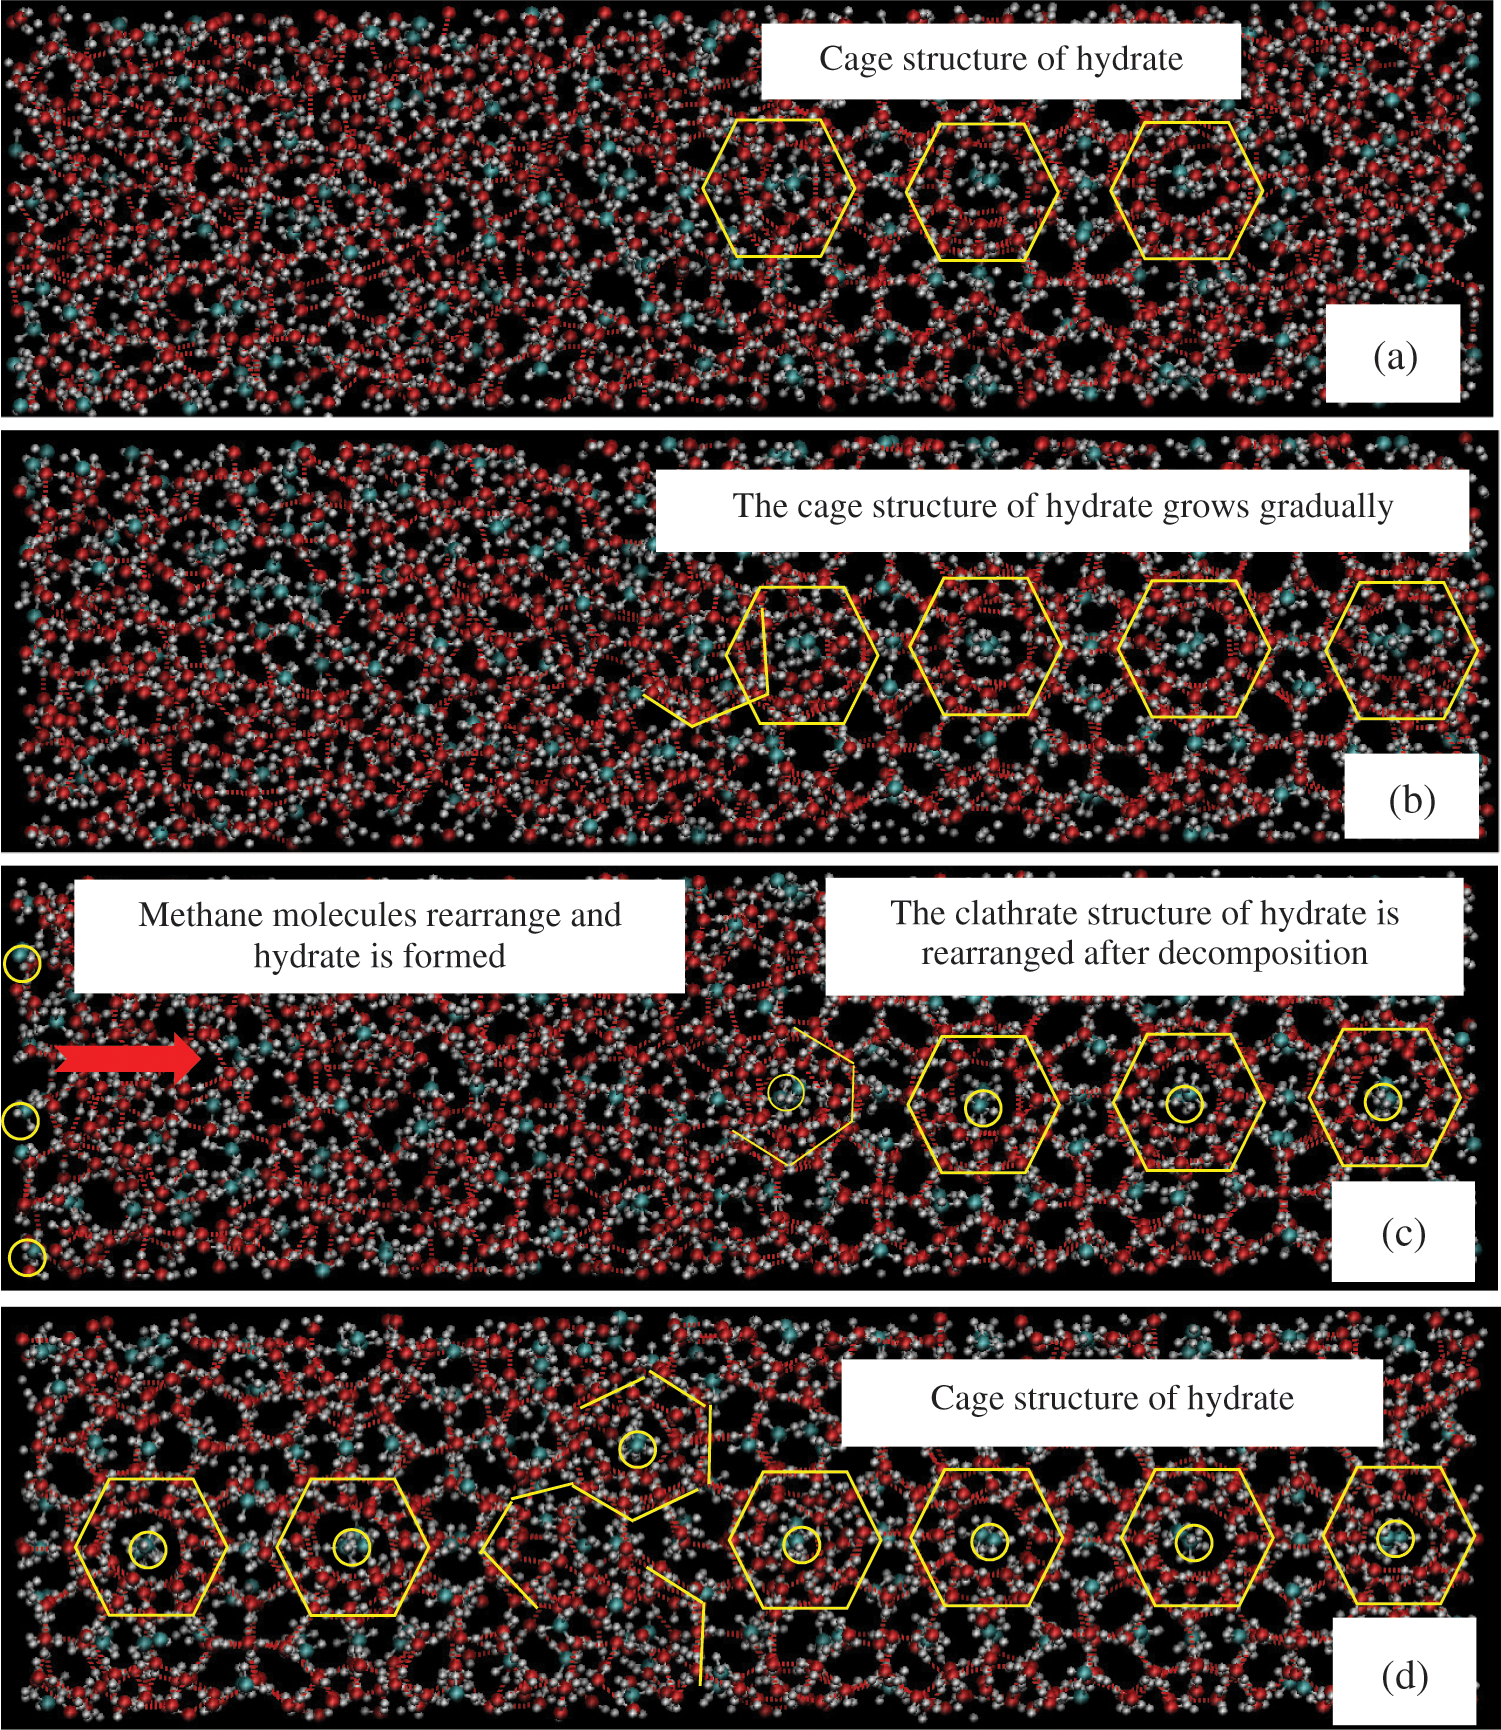
Figure 18: Changes in cage structure of hydrate crystals during the formation process
As shown in Fig. 18, the cage structure comprising water molecules accumulated gradually during the growth process of hydrate crystal nucleus, and the water molecules were connected through hydrogen bonds to form a complex cage structure. The cage structure of hydrate crystal nucleus contains several methane gas molecules. The comparison of Figs. 18b and 16c suggest that when the hydrate crystal nucleus on the left starts to form, the hydrate crystal nucleus on the right will appear abnormal, which is mainly shown as complex cage structure and disordered hydrogen bond. With the formation of hydrate cage structure on the left, the formation speed of the hydrate cage structure on the right will decrease significantly, and even the formed cage structure will decompose. As shown in Fig. 18d, the cage structures on the left and right sides are further formed until the two groups of cage structure are connected, the cage structure at the connection point is more complex, and even the cage structure of hydrate is not completely formed; the hydrogen bond at this position is chaotic. Therefore, the connection points between the hydrate crystal nucleus and the crystal nucleus are not close and show a loose state, which results in the granular form of the hydrate crystal nucleus. Once the temperature or pressure in this structure changes, the connection points between the crystal nucleus will disperse initially, thereby resulting in hydrate particle and bubble effects.
To verify our results, we used Material Studio software to model and interleave two groups of hydrate crystal nuclei. We believe that the contact location of the two groups of crystal nuclei is the chaotic region of molecules, and the molecules on both sides are the boundary regions, as shown in Fig. 19.
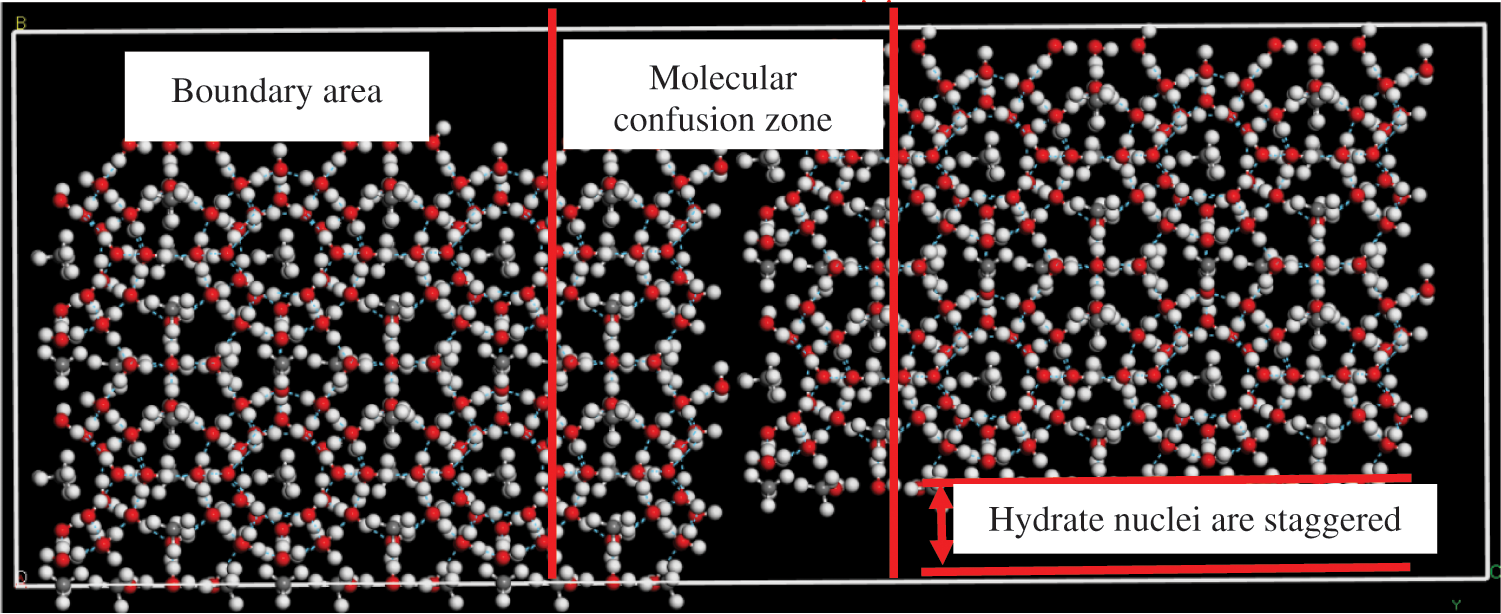
Figure 19: Interleaving of two groups of hydrate crystal nuclei
Since hydrogen bonds between the water molecules break rapidly during the decomposition of hydrate crystal cells, it is impossible to accurately observe the motion characteristics of molecules at different positions during the decomposition of hydrate. Therefore, by investigating the changes in the root mean square displacement and velocity correlation function with time during hydrate decomposition, we analyzed the molecular motion law during hydrate decomposition. The molecular simulation ensemble was selected as the NPT ensemble, decomposition temperature was 293 K, pressure was 0.04 GPa, simulation time was 10 ps, and time step length was 0.1 fs. The changes in root mean square (RMS) displacement and velocity correlation functions of molecules at different positions during the hydrate decomposition were simulated, as shown in Fig. 20.
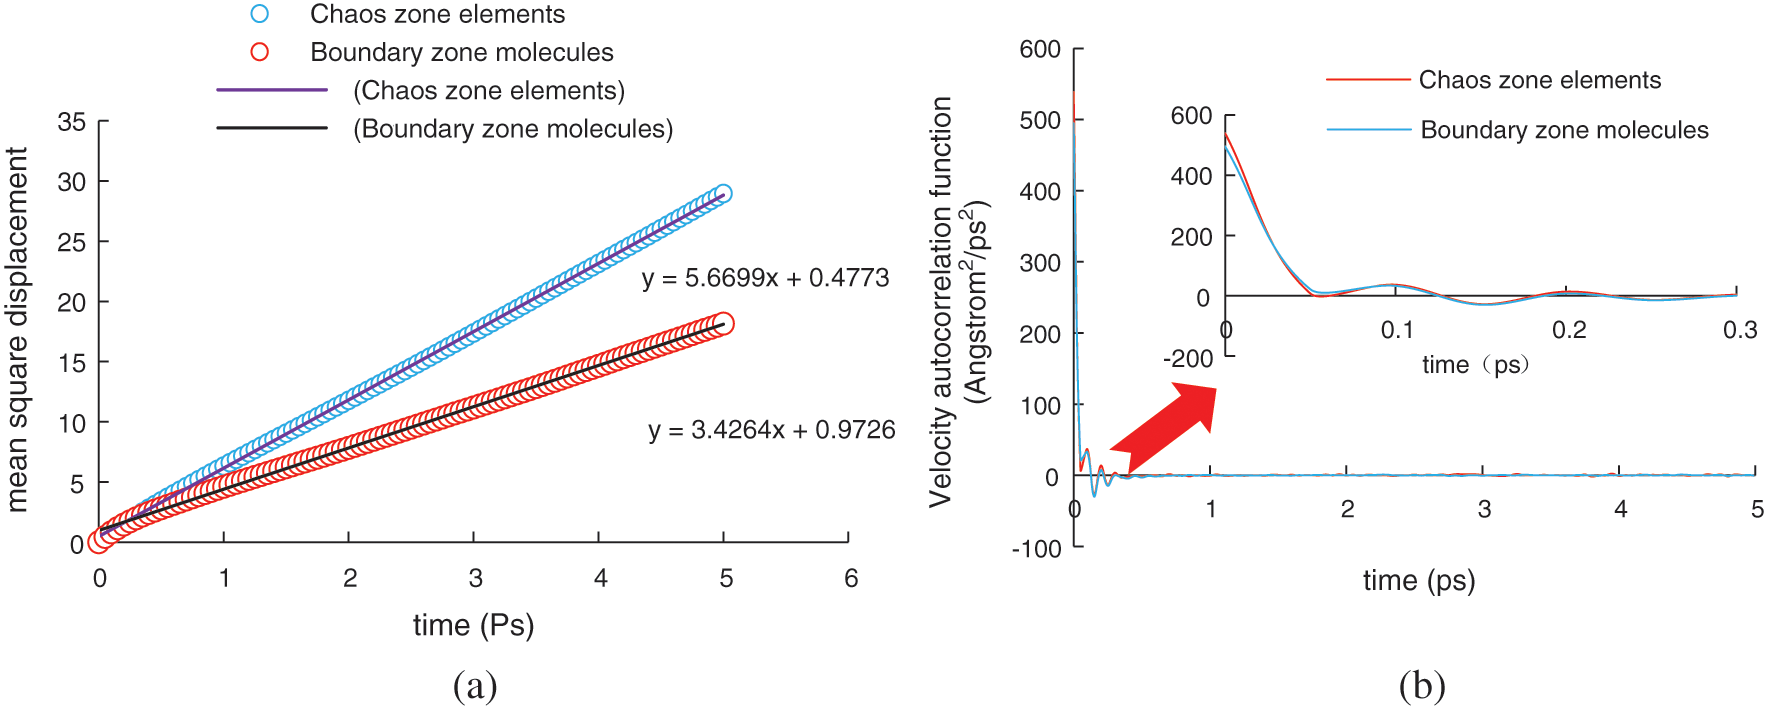
Figure 20: Changes in RMS displacement and velocity correlation functions of molecules at different positions and different times (a) Changes in RMS displacement of molecules at different locations (b) Variation characteristics of molecular velocity correlation functions at different locations
During the hydrate decomposition, the RMS displacement of molecules changes linearly, as shown in Fig. 18a. The linear coefficient of the RMS displacement of the molecules in the intermediate chaotic region and in the boundary region is 5.6699 and 3.4264, respectively, indicating that the diffusion velocity of molecules in the intermediate chaotic region is significantly higher than that in the boundary region. However, there is no obvious change in the velocity correlation function of molecules at different positions, as shown in Fig. 18b. At the initial moment of decomposition, the velocity correlation function of molecules in the boundary region and intermediate chaotic region is 494 and 538 Å2/ps2, respectively. This indicates that at the initial stage of hydrate decomposition, hydrogen bonds between the water molecules in the intermediate chaotic region are more fragile than those in the boundary region, which will lead to the preferential hydrate decomposition in the chaotic region between the hydrate crystal nucleus, thereby forming particle and bubble effects.
(1) During CO2 hydrate formation, the reaction kettle temperature, pressure, and phase behavior underwent relatively complex changes. Under the conditions tested, the induction time of hydrate generation was around 15–40 min. However, the induction time was extended by the liquid CO2 layer hindering contact between gaseous CO2 and water.
(2) A large number of CO2 bubbles were produced during hydrate decomposition. During the decomposition process, CO2 bubbles were mainly formed by precipitation due to increased temperature in the reactor and decreased solubility of CO2 and the CO2 bubbles in the hydrate cage structure.
(3) When the reaction started, only floating scattered particles were present at the interface between CO2 and water. At this time, the reactor showed strong light transmittance and flow performance. As the reaction progressed, the crystal nucleus of the hydrate moved upward under the influence of gravity, CO2 was dissolved and diffused into the water phase, and hydrates were further formed and accumulated, finally forming a solid CO2 hydrate layer. After reaction completion, CO2 hydrate showed poor light transmittance.
(4) The particle effect during the hydrate decomposition can be attributed to the hydrogen bond disorder between the hydrate crystal nucleus during the formation of the hydrate crystal nucleus.
Acknowledgement: This research was conducted at the Key Laboratory of Enhanced Oil & Gas Recovery of Ministry of Education at Northeast Petroleum University (Daqing, China). The authors gratefully acknowledge the support of the National Natural Science Foundation of China (No. 51574089) and Heilongjiang Provincial Department of Education (TSTAU-R2018018) and the Innovative scientific research project for Postgraduates of Northeast Petroleum University (YJCX2016-013NEPU).
Funding Statement: This work was supported by the National Natural Science Foundation of China (No. 51574089) and Heilongjiang Provincial Department of Education (TSTAU-R2018018) and the Innovative scientific research project for Postgraduates of Northeast Petroleum University (YJCX2016-013NEPU).
Conflicts of Interest: The authors declare that they have no conflicts of interest to report regarding the present study.
1. Toschev, S., Milchev, A., Stoyanov, S. (1972). On some probabilistic aspects of the nucleation process. Journal of Crystal Growth, 13, 123–127. DOI 10.1016/0022-0248(72)90073-5. [Google Scholar] [CrossRef]
2. Adisasmito, S., Frank III, R. J., Sloan Jr, E. D. (1991). Hydrates of carbon dioxide and methane mixtures. Journal of Chemical and Engineering Data, 36(1), 68–71. DOI 10.1021/je00001a020. [Google Scholar] [CrossRef]
3. Baez, L. A., Clancy, P. (1994). Computer simulation of the crystal growth and dissolution of natural gas hydrates. Annals of the New York Academy of Sciences, 715(1), 177–186. DOI 10.1111/j.1749-6632.1994.tb38833.x. [Google Scholar] [CrossRef]
4. Kvamme, B. (2000). A Unified theory for the kinetics of hydrate formation. Gas Hydrates: Challenges for the Future, 912, 496–501. DOI 10.1111/j.1749-6632.2000.tb06804.x. [Google Scholar] [CrossRef]
5. Takeya, S., Hori, A., Hondoh, T., Uchida, T. (1994). Freezing-memory effect of water on nucleation of CO2 hydrate crystals. Journal of Physical Chemistry B, 104(17), 4164–4168. DOI 10.1021/jp993759+. [Google Scholar] [CrossRef]
6. Radhakrishnan, R., Trout, B. L. (2002). A new approach for studying nucleation phenomena using molecular simulations: Application to CO2 hydrate clathrates. Journal of chemical physics, 117(4), 1786–1796. DOI 10.1063/1.1485962. [Google Scholar] [CrossRef]
7. Moon, C., Taylor, P. C., Rodge, P. M. (2003). Molecular dynamics study of gas hydrate formation. Journal of the American Chemical Society, 125(16), 4706–4707. DOI 10.1021/ja028537v. [Google Scholar] [CrossRef]
8. Roelands, C. P. M., Jiang, S., Kitamura, M. (2006). Antisolvent crystallization of the polymorphs of L-histidine as a function of supersaturation ratio and of solvent composition. Crystal Growth & Design, 6(4), 955–963. DOI 10.1021/cg050529d. [Google Scholar] [CrossRef]
9. Kirsch, P. D., Quevedo-Lopez, M. A., Li, H. J. (2006). Nucleation and growth study of atomic layer deposited HfO2 gate dielectrics resulting in improved scaling and electron mobility. Journal of Applied Physics, 99(2), 023508. DOI 10.1063/1.2161819. [Google Scholar] [CrossRef]
10. Sloan Jr, E. D., Koh, C. A. (2007). Clathrate hydrates of natural gases. CRC Press, 2007. DOI 10.120/9781420008494. [Google Scholar] [CrossRef]
11. Kashchiev, D., Borissova, A., Hammond, R. B. (2010). Effect of cooling rate on the critical undercooling for crystallization. Journal of Crystal Growth, 312(5), 698–704. DOI 10.1016/j.jcrysgro.2009.12.031. [Google Scholar] [CrossRef]
12. Jacobson, L. C., Molinero, V. (2010). A Methane-water model for coarse-grained simulations of solutions and clathrate hydrates. Journal of Physical Chemistry B, 114(21), 7302–7311. DOI 10.1021/jp1013576. [Google Scholar] [CrossRef]
13. Maeda, N. (2015). Nucleation curves of model natural gas hydrates on a quasi-free water droplet. AIChE Journal, 61(8), 2611–2617. DOI 10.1002/aic.14898. [Google Scholar] [CrossRef]
14. Maeda, N. (2016). Nucleation curves of methane propane mixed gas hydrates in hydrocarbon oil. Chemical Engineering Science, 155, 1–9. [Google Scholar]
15. Maeda, N. (2018). Nucleation curves of methane hydrate from constant cooling ramp methods. Fuel, 223, 286–293. [Google Scholar]
16. Maeda, N., Shen, X. (2019). Scaling laws for nucleation rates of gas hydrate. Fuel, 253, 1597–1604. DOI 10.1016/j.fuel.2019.05.096. [Google Scholar] [CrossRef]
17. Maeda, N. (2019). Nucleation curve of carbon dioxide hydrate from a linear cooling ramp method. Journal of Physical Chemistry A, 123(37), 7911–7919. DOI 10.1021/acs.jpca.9b06633. [Google Scholar] [CrossRef]
18. Sa, J. H., Sum, A. K. (2019). Promoting gas hydrate formation with ice-nucleating additives for hydrate-based applications. Applied Energy., 251, 113352. DOI 10.1016/j.apenergy.2019.113352. [Google Scholar] [CrossRef]
19. Zerpa, L. E., Rao, I., Aman, Z. M., Koh, C. A., Sloan, E. D. (2013). Amadeu K. Sum, Multiphase flow modeling of gas hydrates with a simple hydrodynamic slug flow model. Chemical Engineering Science, 99, 298–304. DOI 10.1016/j.ces.2013.06.016. [Google Scholar] [CrossRef]
20. Nguyen, N. N., Berger, R., Butt, H. (2019). Surface premelting and interfacial interactions of semi-clathrate hydrate. Journal of Physical Chemistry, 123, 24080–24086. [Google Scholar]
21. Nguyen, N. N., Nguyena, A. V., Nguyen, K. T., Rintoul, L., Dang, L. X. (2016). Unexpected inhibition of CO2 gas hydrate formation in dilute TBAB solutions and the critical role of interfacial water structure. Fuel, 185, 517–523. DOI 10.1016/j.fuel.2016.08.006. [Google Scholar] [CrossRef]
22. Bai, Y., Cao, G., An, H., Zhang, H. (2020). Generation laws and distribution characteristics of carbon dioxide hydrate in a reaction kettle. Experimental Thermal and Fluid Science, 116, 110125. DOI 10.1016/j.expthermflusci.2020.110125. [Google Scholar] [CrossRef]
23. Ohno, H., Lipenkov, V. Y., Hondoh, T. (2004). Air bubble to clathrate hydrate transformation in polar ice sheets: A reconsideration based on the new data from Dome Fuji ice core. Geophysical Research letters, 31(21), 1–4. DOI 10.1029/2004GL021151. [Google Scholar] [CrossRef]
24. Takahashi, M., Kawamura, T., Yamamoto, Y., Ohnari, H., Himuro, S. et al. (2003). Effect of shrinking microbubble on gas hydrate formation. Journal of Physical Chemistry B, 107(10), 2171–2173. DOI 10.1021/jp022210z. [Google Scholar] [CrossRef]
25. Jonathan, L., Charles, E., Edward, T., Ladner, P. (2007). Effect of bubble size and density on methane conversion to hydrate. Journal of Petroleum Science and Engineering, 56(1–3), 97–100. DOI 10.1016/j.petrol.2005.08.007. [Google Scholar] [CrossRef]
26. Bagherzadeh, S. A., Alavi, S., Ripmeeste, R. J., Englezos, P. (2015). Formation of methane nano-bubbles during hydrate decomposition and their effect on hydrate growth. Journal of Chemistry Physical, 142(21), 214701. DOI 10.1063/1.4920971. [Google Scholar] [CrossRef]
27. Yu, L. C. Y., Charlton, T. B., Aman, Z. M., Wu, D. T., Koh, C. A. (2019). Hydrate growth on methane gas bubbles in the presence of salt. Langmuir, 36(1), 84–95. DOI 10.1021/acs.langmuir.9b03451. [Google Scholar] [CrossRef]
28. Geng, C., Wen, H., Zhou, H. (2009). Molecular simulation of the potential of methane reoccupation during the replacement of methane hydrate by CO2. Journal of Physical Chemistry A, 113(18), 5463–5469. DOI 10.1021/jp811474m. [Google Scholar] [CrossRef]
29. Hou, D., Zhao, T., Ma, H., Li, Z. (2015). Reactive molecular simulation on water confined in the nanopores of the calcium silicate hydrate gel: Structure, Reactivity, and mechanical properties. Journal of Physical Chemistry C, 119(3), 1346–1358. DOI 10.1021/jp509292q. [Google Scholar] [CrossRef]
30. Wang, L., Jiang, G., Zhang, X. (2020). Modeling and molecular simulation of natural gas hydrate stabilizers. European Journal of Remote Sensing, 97(40), 1–12. DOI 10.1080/22797254.2020.1738901. [Google Scholar] [CrossRef]
31. Wang, Q., Tang, Q., Tian, S. (2020). Molecular dynamics simulation of sI methane hydrate under compression and tension. Open Chemistry, 18(1), 69–76. DOI 10.1515/chem-2020-0008. [Google Scholar] [CrossRef]
32. Jonathan, G. H., Kwong, H. Y. (2019). Carbon dioxide’s liquid-vapor coexistence curve and critical properties as predicted by a simple molecular model. Journal of Physical Chemistry C, 123(22), 13401–13409. [Google Scholar]
 | This work is licensed under a Creative Commons Attribution 4.0 International License, which permits unrestricted use, distribution, and reproduction in any medium, provided the original work is properly cited. |