DOI:10.32604/jrm.2021.012015
| Journal of Renewable Materials DOI:10.32604/jrm.2021.012015 | |
| Article |
Numerical Simulation of Urea Based SNCR Process in a Trinal-Sprayed Precalciner
College of Materials Science and Engineering, Nanjing Tech University, Nanjing, 211816, China
*Corresponding Author: Hongtao Kao. Email: Kaoht@163.com
Received: 10 June 2020; Accepted: 28 July 2020
Abstract: In order to study the combustion characteristics, NOx emission and NH3 slip in a new trinal-sprayed precalciner, the simulations of combustion and aqueous urea solution based selective non-catalytic reduction (SNCR) process were conducted by computational fluid dynamics in this precalciner, the effects of different injection heights, different injection flow rates and stratified injection under different flow rates on SNCR process were studied. The results showed that the flow field was symmetrically distributed in the precalciner, and the flue gas from the rotary kiln formed the recirculation region on both sides of the cone body, which increased the residence time of the solid particles. The temperature was mainly between 1100 K and 1250 K in the middle and upper column of the precalciner, which met the demand of the pulverized coal combustion and raw material decomposition. The concentration of NO at the outlet of the precalciner was 559 ppm, moreover, different injection heights and different injection flow rates had a strong influence on NOX removal efficiency and NH3 slip. The aqueous urea solution should be injected at SNCR-1 to prolong the residence time of NH3, and injection flow rate had an optimal flow rate but not the higher the better. When the injection flow rate under stratified injection was 0.019 kg/s, which could play a better optimization role on NO removal efficiency on the basic of the injection flow rate. In consideration of cost effective, a stratified injection with an injection flow rate of 0.019 kg/s and an injection height of 20 m, 25 m and 30 m was suggested as a compromise of a satisfactory NOx reduction rates and reasonable NH3 slip. Under this condition, numerical simulation result showed that NOx concentration at the outlet of precalciner was 297.27 mg/Nm3 and NH3 slip was 4.67 mg/Nm3, meeting emission standard.
Keywords: Trinal-sprayed precalciner; selective non-catalytic reduction; aqueous urea solution; NOx reduction
The process of cement production is referred to as “two grinding and one calcination”, which includes the grinding of raw meals, the formation of clinker, and the grinding of clinker mixed with other additives, like slag, gypsum and so on. Before fed into the rotary kiln for calcination, the raw materials should be preheated and decomposed by the precalciner. The precalciner, which is used for coal combustion and the decomposition of calcium carbonate, is another important piece of equipment for cement production. In order to save raw meals and fuel, refuse-derived fuel [1,2] (RDF) and municipal sewage sludge [3,4] are put into the precalciners for cement production. At the same time, a great deal of exhaust gas was produced by fuel combustion, such as NOX, which damages the environments seriously. NOX produced by cement production is the third largest source of nitrogen oxide contaminants after power plant and automotive exhaust. To meet increasingly stringent emission standards, selective catalytic reduction [5,6] (SCR) has been widely applied to power plant and automotive exhaust for NOx reduction. However, in consideration of cost effective, the most popular methods are staged combustion [7,8] and selective non-catalytic reduction (SNCR) [9–12] for reducing NOX emissions in cement plant recent years. So, understanding the operation condition of the precalciner is essential in order to obtain good denitration efficiency.
The decomposition of calcium carbonate is the main chemical reaction in the precalciner. Temperature is a significant influence factor for the calcination of calcium carbonate according to the reaction (1). When the temperature is above 873 K, calcium carbonate decomposes slowly. With the temperature increases, when the temperature exceeds 1173 K, the decomposition rate of calcium carbonate improves greatly. Otherwise, CO2 pressure also has a huge impact on CaCO3 decomposition. Fig. 1 displays the relation between equilibrium CO2 pressure and temperature on limestone and the curve can be described by the Eq. (2). Here,  is given in atmospheres (1 atm = 0.101 MPa), and T is given in Kelvin. When the CO2 partial pressure in the system is lower than the equilibrium CO2 pressure over CaCO3, calcium carbonate begin to decomposes in five steps: a) the process of heat transfer from the gas to the surface of particle, b) the interior of the particle conducts heat to the reaction surface through the calcium oxide layer, c) chemical reactions on the reaction surface, d) the mass transfer of the reaction product carbon dioxide through the oxide layer, e) the mass transfer of calcium carbonate from the particle surface to the atmosphere.

Figure 1: Equilibrium CO2 pressure over CaCO3


The complex flow field is formed in the precalciner due to the interaction of tertiary air and flue gas from the rotary kiln, and the pulverized coal particles and calcium carbonate are in a suspended state. The gas stream formed by tertiary air and flue gas not only affect the trajectory of solid particles but also decide their residence time. The heat released by coal particles supplies enough energy for the decomposition of the raw meals.
A high calcium carbonate decomposition rate is beneficial to decrease the coal consumption of the rotary kiln so as to reduce the thermal load of the rotary kiln. So, the coal must burn around the calcium carbonate suitably. However, the traditional cold model experiment cannot simulate and predict the complex reacting process. At the same time, NOX produced by pulverized coal combustion has become an increasingly serious problem in the sustainable development of the cement industry.
In recent years, many scholars and research institutions have conducted a large number of studies on the precalciners from experiments to numerical simulation. According the research results, the temperature [9,10,13], the gas composition [9,14], CaCO3 and CaO [15–18] have a different effect on NOX reduction. In the appropriate temperature window, the higher the temperature, the higher the denitrification efficiency. Moreover, the different gases in the precalciner, like O2, CO, H2 and CiHi, also have impact on NOX reduction. What’s more, CaCO3 and CaO can be used as the catalyst to promote CO to reduce NOX, but inhibit NOX reduction by NH3, besides experimental studies, numerical simulations of the precalciners were also studied by many scholars and research institutions. Xie et al. [19] used a 3D model for SLC-S precalciner using standard  model and discrete phase model in order to predict the flow field and particle concentration distribution in the precalciner by adding a raw meal inlet. Huang et al. [20] proposed a new method idea to solve the pole problem of the double-spray precalciner by the RNG (renormalization group)
  model and developed a four-mixture-fraction model to predicted the multi-component mutual transportation and the formation of NO in the precalciner. Fidaros et al. [21] studied the relationship between velocity, temperature, gas concentration and particle trajectory in a low NOX precalciner. Moreover, Computational Fluid Dynamics (CFD) validation studied of combustion characteristics and NOX emissions based on the actual incinerator had also been published [22], on this basis, the co-combustion characteristics and NOX emissions in municipal solid waste incinerators with ammonia based SNCR process were studied [11,23]. What’s more, reburning zone conditions [24], CaO [25] and different gas compositions [26] on NOx removal efficiency by selective non-catalytic reduction were explored by CFD software for obtaining the law of NOx formation in different coal types. In addition, An et al. [27] studied NOX emission by injecting aqueous urea solution directly based on the 7-step global mechanism. Norbert found that the performance of the 12-step reduced mechanism was better than the 7-step mechanism [28].
In conclusion, it becomes apparent that numerical simulation is important because it not only saves human and material resources but also optimizes operation conditions of precalciners to reduce coal consumption, improve the final cement quality and reduce NOX emission on the basis of simulation results. Although the above studies had done a great deal of work about different types of precalciners, there is a little research about the newer trinal-sprayed precalciners (TTF) regardless of combustion characteristics or NOX removal efficiency. Compared with the older precalciner, the newer TTF precalciners have simpler structure, stronger adaptability to fuel, three-sprayed effect, and strong turbulent recirculation, and the feeding modes of pulverized coal and raw material have changed. These unique features make the combustion characteristics in the newer TTF precalciner different from the older precalciner. Therefore, it is significant to analyze the transport of gas-solid two-phase flow in the newer TTF precalciner under cold and hot condition for cement production by numerical simulation. Besides, aqueous urea solution was injected into the precalciner by different injection heights, different injection flow rates and stratified injection under different flow rates to optimize selective non-catalytic reduction process on this basis, which may be beneficial to reduce NOX emission and provide the groundwork for SNCR process in trinal-sprayed precalciner.
Fig. 2 shows the geometric structure of the trinal-sprayed precalciner. The precalciner is 45.88 m high and is divided into three column sections and one vertebral body section. The three columns are 9.22 m, 12.9 m and 9.1 m from top to bottom, respectively. The cylinder is 7.1 m in diameter and the cone is 5.6 m high. The tertiary air and raw meal duct are symmetrically distributed on both sides of the cylinder at the lower part of the cylinder. The tertiary air enters the horizontal direction tangentially from the lower part of the precalciner column, and the flue gas is sprayed into the precalciner through the shrinkage of the flue chamber, and meets the tertiary air to form a “swirl-spray” effect. The mass fraction of aqueous urea solution is 50% and aqueous urea solution is injected into the precalciner through the SNCR nozzles, which contains three groups and 12 nozzles on the walls and the distribution of each group is shown in Fig. 2B. The heights of low (first), middle (second) and high (third) groups of nozzles are 20 m, 25 m and 30 m, respectively, where we call them SNCR-1, SNCR-2 and SNCR-3, respectively. Fig. 3 is the grid of the precalciner, the precalciner is divided into structured hexahedral structured grid and the number of grids was about 938380. The grids around the coal-injection pipes and raw meals pipes region were encrypted to accommodate the complex structure.

Figure 2: Precalciner structure
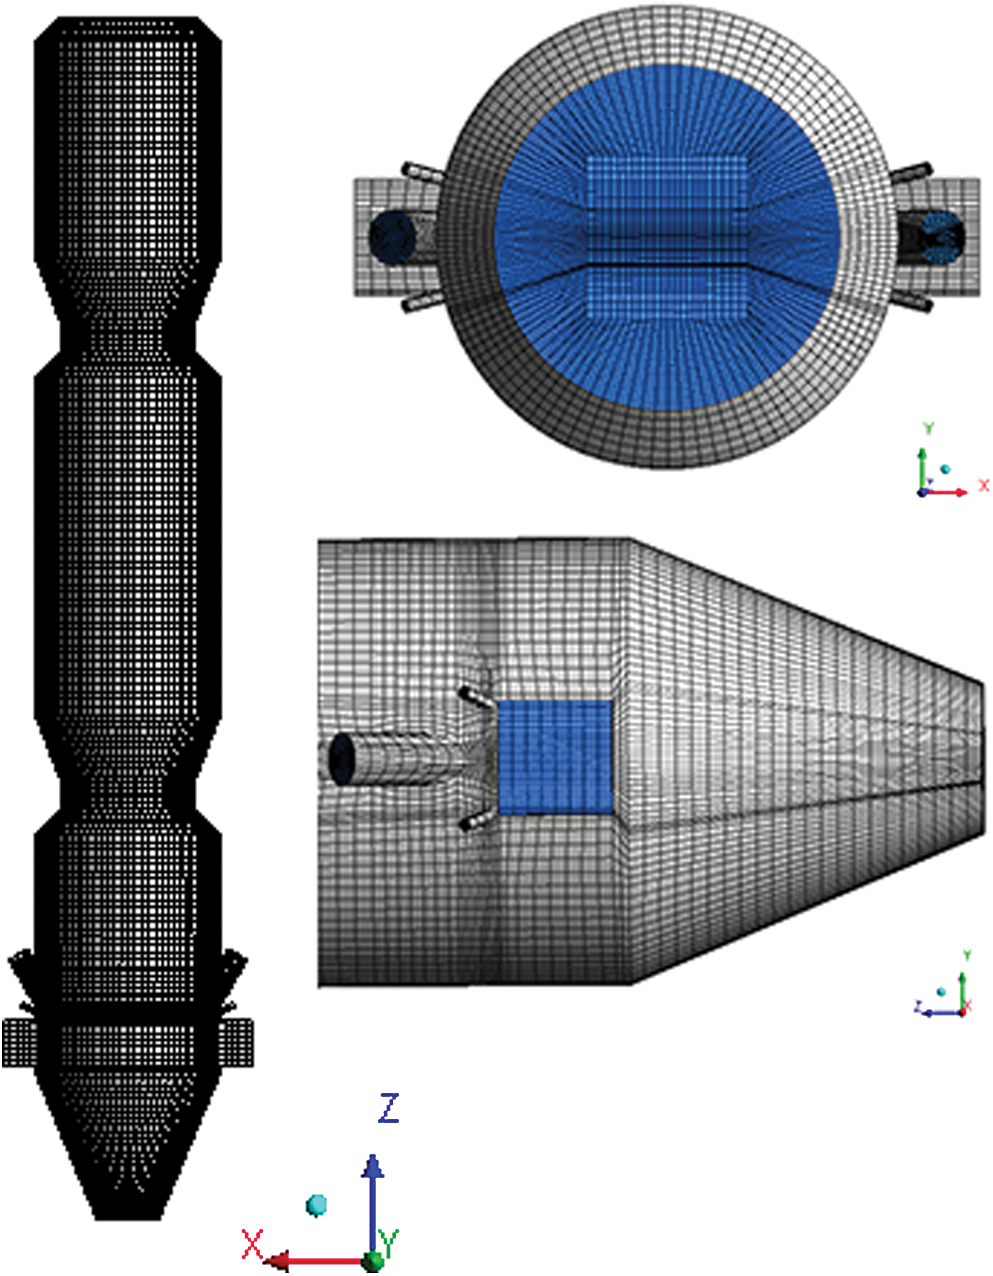
Figure 3: Precalciner mesh
2.1 Fundamental Governing Equation
Computational fluid dynamics is based on the basic governing equations of fluid mechanics including the continuity equation, momentum equation and energy equation. These equations are the three fundamental physical principles that all flows must follow and the corresponding governing equation is as follows:
(1) Continuity equation [29]:

where  is density,
  is time, and
  are the components of the velocity vector in the axial, radial, and circumferential directions, respectively.
The Eq. (3), which is in square brackets, is  . So, the Eq. (3) becomes:

(2) Momentum equation (Navier-Stokes equation) [29]:
For Newtonian fluids, the Navier-Stokes equation in x, y, z directions is as follows:


where  is pressure,
  is volume force on unit mass fluid micelles, and
  is shear stress, which is calculated from:


and  is the molecular viscosity coefficient and
  is second viscosity coefficient. Stokes made the assumption:

(3) Energy equation [29]:
The law of conservation of energy is a fundamental law that a flow system containing heat exchange must follow. The equation is expressed as follows:

where T is temperature, cp is specific heat capacity, k is heat transfer coefficient, and ST is viscous dissipative term.
Comparing other turbulence models, the  model is the most widely used model in engineering fluid calculations, including the standard
  model, RNG
  model, and the realizable
  model. Among these models, the realizable
  model is more suitable for simulating the gas flow in the precalciner because of the advantages of simulating jet impact, circular aperture incident flow, secondary recirculation and swirl compared to the other two models.
In the realizable  model, the transport equation of
  and
and  is shown as follows [30]:


where


In these equations,  represents the viscosity coefficient,
  is the time-average strain rate.
  and
and  are the prandtl number corresponding to the turbulent flow energy
  and the dissipation rate
  , respectively,
  is turbulent kinetic energy caused by the average velocity gradient.
Considering the characteristics of radiation between the gas phase and the particles, this research adopts the P1 radiation model, which is represented in the following [31]:

where


The physical-chemical process of a series of solid phases in the precalciner, which contains the pulverized coal combustion and the raw material decomposition, is gas-solid interaction in complex field. In this paper, the gas phase and solid phases are identified as the primary phase and the discrete system, respectively. So, the discrete phase model (DPM) [32] is used to simulate the movement of solid particles and the interaction between solid phases and the gas phase.
Because of the strong turbulent motion in the precalciner, the stochastic tracking model was used to simulate the particle dispersion due to turbulence in the fluid phase, the discrete random walk (DRW) model was adopted to account for the turbulence generation or dissipation in the gaseous phase. In addition, considering gravity and drag force, the force balance equation of the particles in three directions in Lagrangian coordinates is as follows:


where up, vp and wp are the velocity components of the particle in the axial, radial, and circumferential directions, respectively, u, v and w are that of the fluid -phase in the axial, radial, and circumferential directions, respectively, and  and
and  are particle density and fluid particle, respectively. FD(u-up) is the drag force per unit particle mass.
2.5 Pulverized Coal Combustion Model
The pulverized coal particles, when injected into the precalciner, undergo a series of physical-chemical processes including inert heating, water evaporation, devolatilization, char-burning and ash cooling. Among these steps, devolatilization and char-burning are the main processes of coal combustion.
The process of the volatile devolatilization is simulated by the single-kinetic-rate devolatilization model [33], which assumes that the rate of volatilization is a first-order function of the content of volatiles in the particle:

where mp and mp,0 are particle mass and initial particle mass, respectively, and  and
and  are the initial mass fraction of the volatiles in the particles and that of the water, respectively.
After the volatiles are released and burned out, the remaining char starts to undergo the surface combustion reaction and the reactionkinetics/finite diffusion rate model was used:

where


In these equations, Ap represents particle surface area, Pox is partial pressure of oxygen,  and TP are initial particle temperature and the gas temperature around particles, respectively. dp represents particle diameter following the distribution of Rosin-Rammler and the distribution of particle diameter was shown in Tab. 1.
Table 1: Particle diameter distribution parameters

The species transport model was adopted by the reactions involved in the simulation process [34]. In the species transport model, the mass fraction Yi of the substance is estimated by solving the convection-diffusion equation of the ith substance, and the solution equation can be expressed as:

In this equation, is mass diffusion flux caused by concentration gradient,
  is the net rate of chemical reaction of substance i and Si is the extra generation rate of discrete phase.
In this paper, the decomposition of raw meals is mainly the decomposition of calcium carbonate (Eq. (1)). The pre-exponential and activation energy of the decomposition reaction of calcium carbonate are 2.47E6 s−1 and 178 kJ/mol, respectively, and the decomposition rate of calcium carbonate is calculated as follows:

where CaCO3inlet and CaCO3outlet are the flow rate of calcium carbonate at the inlet and at the outlet, respectively.
The kinetics of fuel NOX formation is complex, and its reaction mechanism researched by many scholars has not been fully understood. It is generally believed that NO generation is a simple two-step model (Fig. 4).

Figure 4: The main reaction path of fuel-N
According to the reaction mechanism, the production rates of HCN and NO can be used as reaction source terms to simulate the generation of NO in the precalciner:


Aqueous urea solution, which is injected into the precalciner through different nozzles, is used as reducing agent to reduce NOX in this article. The injection type of aqueous urea solution is cone pattern. The non-uniform droplet size distribution is carried out in simulation, which meets the Rosin-Rammler distribution, meanwhile, the motion of the droplet particles are calculated by the Lagrangian formulation and the interaction of the liquid solutions and the gas phases is introduced through particle sources of Eulerian gas-phase equations. What’s more, the dispersion of particles due to turbulence in the fluid phase was considered. Because the temperature in the precalciner is far below the formation temperature of thermal-NOX, only fuel-NOX is considered in this article.
We assume that one droplet is formed by a single urea particle. Water evaporates before urea begins its subliming process. The temperature of the injected droplets is controlled by both the convective and radiative heat transfer with the flue gases and the transfer coupled with the latent heat of vaporization. Below the boiling point, the vaporization rate is controlled by convection and diffusion according to the Eq. (37) [35].

where Sh is the Sherwood number, D is dynamic diffusivity, d is droplet diameter,  is flue gas density,
  and
and  are vapor mass fraction at the surface and surrounding fluid, respectively. The concentration of vapor at the droplet surface is evaluated by assuming that the partial pressure of vapor at the interface is equal to the saturated vapor pressure, at the particle droplet temperature.
When the particle reaches the boiling temperature (vapor pressure becomes higher than gaseous pressure), the mass transfer is determined by the latent heat of vaporization. Assuming constant droplet temperature during boiling:

where Q is the convective and radiative heat transfer, hlatent is latent heat of evaporation.
The reactions between NH3 and NO are used Brouwer’s seven-step mechanism (Tab. 2). Brouwer assumed that the breakdown of urea is instantaneous and 1 mole of urea is assumed to produce 1.1 moles of NH3 and 0.9 moles of HNCO.
Table 2: Seven-step reduced mechanism for SNCR with urea

The study of SNCR process is consist of three main parts, different injection heights, different injection flow rates and stratified injection under different flow rates on NOX removal efficiency were explored.
Tab. 3 shows the SNCR operating conditions. In this SNCR process, 0.019 kg/s corresponded to normalized stoichiometric ratios (NSR) and all injection speeds were kept constant at 25 m/s. In the first part, the effect of injection heights on NOX removal efficiency was explored, in general, NOX removal efficiency is closely related to temperature, and the temperature of the precalciner are different in different height. So, this part of the study focused on exploring the effect of heights on NOX removal efficiency. The aqueous urea solution was injected through SNCR-1, SNCR-2 and SNCR-3 at 0.019 kg/s, respectively. In the second part, the effect of injection flow rates on NOX reduction was explored, injection flow rates of the aqueous urea solution would affect the production of ammonia, thereby influencing the efficiency of denitrification. So, this part of the study focused on exploring the effect of NSR on NOX reduction with a ratio of the gradient of 0.2, and the total flow rate was tested at 0.019 kg/s, 0.0228 kg/s, 0.0266 kg/s, 0.0304 kg/s, 0.0342 kg/s and 0.038 kg/s. In the third part, on the basis of the second part, urea solution was injected through SNCR-1, SNCR-2 and SNCR-3 by the fixed ratio to study the effect of the stratified injection on NOx removal efficiency, and the injection ratio of SNCR-1, SNCR-2 and SNCR-3 was 7:2:1.
Table 3: The SNCR operating conditions

The mesh-independent verification of the computational grid is important factors affecting the accuracy of simulation, because this paper focused on the reduction of NOX emission by SNCR denitration technology, the variation of temperature, O2 concentration and NOX concentration of the precalciner outlet was selected for the mesh-independent verification. Five mesh numbers (614,256 cells, 845,568 cells, 938,380 cells, 1,201,054 cells, 1,434,456 cells,) were simulated to record the changes of temperature, O2 concentration and NOX concentration of the precalciner outlet. As shown in Tab. 4, a mesh dependency test was performed to determine the appropriate mesh number. The results showed that the mesh used in this study (938,380 cells) was mesh-independent.
Table 4: Mesh-independent verification

Boundary conditions are also important factors affecting the accuracy of simulation. The measured operating conditions of the precalciner are presented in Tabs. 5–7. In addition to calcium carbonate, raw materials also contain clay, sand and other substances, and because calcium carbonate accounts for a large proportion of raw materials, the decomposition of calcium carbonate is mainly used by most scholars [17–19] for the decomposition reaction of raw meals. So all raw meals were simplified to calcium carbonate in this article. The bituminous coal and the raw meals come from Weinan County of shaanxi Province and Weihui County of Henan Province, respectively. In this simulation, the fixed non-slip state and reflection condition were applied on the surfaces of walls, and the wall is insulated for heat exchange. The outlet value is set as the pressure outlet, given the gauge pressure value −1000 Pa. The pressure-based solver was used for numerical simulation through ANSYS FLUENT, and the pressure velocity coupling was applied to the spatial discretization of SIMPLE algorithm equation using the first-order upwind format.
Table 5: Proximate analysis and ultimate analysis of shaanxi bituminous coal

Table 6: Raw materials compositions (%)

Table 7: Boundary condition of the inlet

Figs. 5 and 6 show the profiles of velocity, vector and local zoom. From the Figs. 5 and 6, it can be observed that the velocity fields were all symmetrically distributed. The direction of the lower cone speed was dominated by the rising flue gas from the rotary kiln, forming a spray shape. The formation of the recirculation region (① and ②) on both sides of the cone body increased the residence time of the gas and the particles and facilitated heat exchange and decomposition between the raw meals and the gas. Because the tertiary air changed the flow direction of the rising flue gas such that the gas was cut off, the speed reached the minimum at the intersection of the tertiary air and the flue gas from the rotary kiln, and the first sprayed effect was formed. Subsequently, the gas continued to rise through the lower constriction and the upper constriction, respectively, forming the second and third sprayed effect. With the existence of the spayed region, the pulverized coal particle and raw meal were in suspended condition and fully exchange heat with the flue gas.

Figure 5: The profiles of velocity, vector and local zoom at x=0. (a) Contour, (b) Vector and (c) Zoom
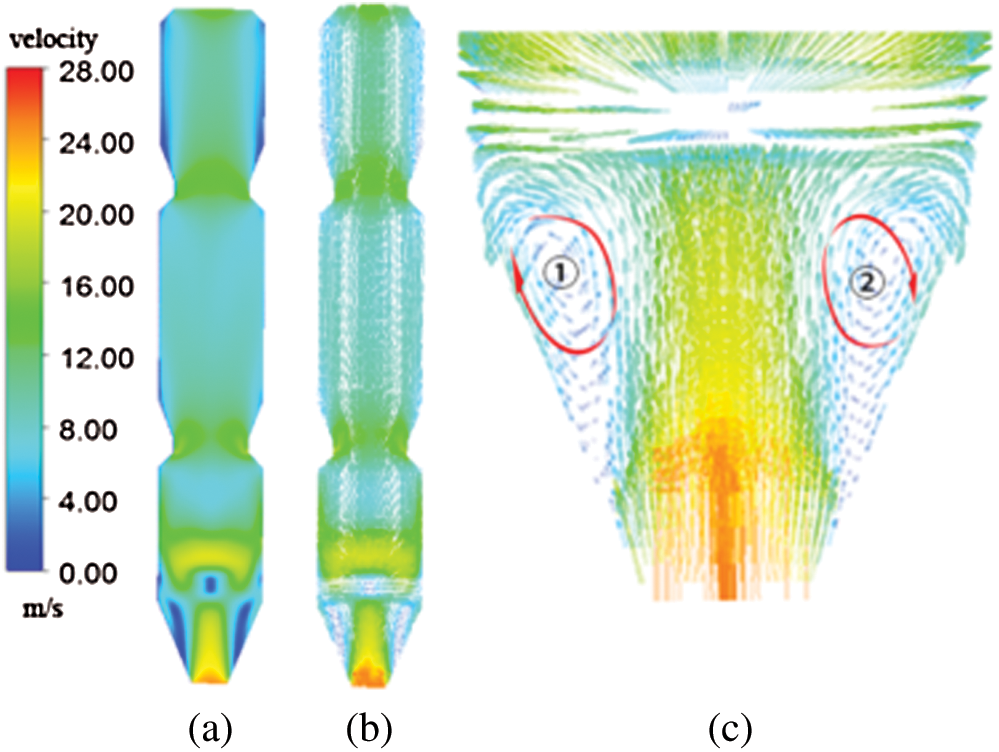
Figure 6: The profiles of velocity, vector and local zoom at y=0. (a) Contour, (b) Vector and (c) Zoom
Fig. 7 displays the average velocity along the z direction. From Fig. 7, it can be seen that the maximum average velocity in the precalciner was at the inlet of the flue gas. When the flue gas entered the precalciner at the height of 5 m, the average velocity in the precalciner decreased rapidly. Then, the average flow velocity underwent four increased. The increase of first three average flow velocities, which was caused by the three sprayed effect in the precalciner, was firstly increased and then rapidly decreased at heights of 5 m~7 m, 13 m~17 m and 32 m~34 m, respectively. The fourth increase of average flow velocity was the reason for the decrease of the diameter of the outlet.

Figure 7: Average velocity along the z direction
Fig. 8 displays the motion path of the gas, the tertiary air and the mixing gas. It can be seen that the dominant motion form of the gas in the precalciner was jet rising flow, and the gas rose vertically along the z-axis in the center of the precalciner. Due to the interaction between the tertiary air and the flue gas, the streamlines on both sides were disordered, and some vortices and swirls appeared near the wall of the precalciner. The simulation result of the average residence time of the gas phase in the precalciner was about 5 s, which is very close to actual design parameters (4.8 s). There is no significant difference between the two results, indicating the reliability of the simulation result.

Figure 8: Motion path of the gas, the tertiary air and the mixing. (a) Flue gas (b) Tertiary air (c) Mixing gas and (d) Zoom
Pulverized coal combustion and calcium carbonate decomposition occurred almost simultaneously in the precalciner, to reveal the complex thermal process. The coupling of coal combustion and CaCO3 decomposition was simulated. Fig. 9 presents the contours of temperature. It can be observed that there were two high temperature regions in the precalciner. The first region was in the lower part of the cone resulting in the high temperature of the flue gas from the rotary kiln, and the other was in pulverized coal main combustion area due to the heat generation of coal combustion instantly. After that, the temperature decreased slightly and was between 1100 K and 1250 K.

Figure 9: Contours of temperature
In this article, in order to simplifying the model, the decomposition of the CaCO3 is considered to be the only decomposition reaction. Fig. 10 shows the simulation result of the contours of the mass fraction of CaCO3 and CaO. Overall, we can see that the mass fraction of CaCO3 dropped gradually along with the height of the precalciner, but the mass fraction of calcium oxide increased remarkably, which indicates that the calcium carbonate converted to calcium oxide by absorbing the heat of coal combustion. Locally, calcium carbonate decomposition is mainly concentrated in the middle and lower column section of the precalciner, and the decomposition rate of calcium carbonate decreased in the upper cylinder of the precalciner. Finally, almost all the of calciumcarbonate decomposed into calcium oxide, and only a small amount of unreacted calcium carbonate escaped from the outlet. According to the simulation result, the flow rate of calcium carbonate at the outlet is 7.19 kg/s, so the decomposition rate of CaCO3 was 90.51% calculated by Eq. (34), which corresponded to actual measured result [24,36].

Figure 10: Contours of the mass fraction of (a) CaCO3 and (b) CaO
The distributions of the average gas temperature and concentrations along the z direction are displayed in Fig. 11. It can be observed that when z < 7 m, the temperature decreased rapidly because the calcium carbonate was decomposed into calcium oxide by absorbing the heat. The temperature and CO2 concentration, with the value at = 7 m, reached the minimum on account of the tertiary air. On the contrary, the mole fraction of O2 reached the maximum. When 7 m < z < 12 m, the temperature and CO2 concentration increased sharply due to large quantities of heat and CO2 produced by coal combustion. At the same time, O2 concentration decreased rapidly because of O2 consumed by coal combustion. When z >12 m, the gas temperature and O2 concentration started to decrease smoothly. This is because the rest of the calcium carbonate continued to decompose by absorbing the heating from the high-temperature gas and the remaining coke continued to burn. According to the simulation result, the temperature at the outlet of the precalciner was 1113 K, which was close to the online measurement value of 1128 K. Moreover, CO2 concentration continued to increase slowly because of calcium carbonate decomposition. In a word, when 20 m < z < 30 m, the gas concentrations were relatively stable and the temperature was in the SNCR temperature window. In addition, compared with the lower column of the precalciner, the gas flow in the middle column of the precalciner is also more stable (Fig. 8), which was more suitable for the injection of urea solution, so SNCR nozzles should be designed in this position.

Figure 11: The distributions of the average gas temperature and concentrations along the z direction
3.3 Formation and Analysis of Nitric Oxide
NOX concentration was affected by two factors in the precalciner, containing fuel-NOX produced by coal combustion and thermal-NOX from the rotary kiln. According the on-line measurements, NOX concentration from the rotary kiln is about 750 ppm. The contours of NO are shown in Fig. 12. It could be observed that the concentration of NO, appearing at the bottom of the precalciner, was the highest, which could be attributed to the thermal-NOx produced in the rotary kiln. The lower part of the cylinder at x = 0, a small area with very low NO content was formed near the tertiary air because of the tertiary air without NO, and the concentration of NO in the center of the precalciner and near the wall were about 400 ppm and 500 ppm, respectively. The lower part of the cylinder at y = 0, the lowest and the highest concentration of NO were about 300 ppm and 450 ppm, respectively.

Figure 12: Contours of NO
Fig. 13 showed the average NO concentration along the z direction, it can be observed that when z < 7 m, NO concentration in the precalciner dropped rapidly, which is attributed to the dilution effect of tertiary air and the reduction of NO by CO produced by incomplete combustion of pulverized coal. When 7 m < z < 12 m, due to sufficient oxygen in the precalciner, pulverized coal particles burned violently, meanwhile, fuel-N was oxidized completely to form NO rapidly. When z >14 m, because most pulverized coal particles have burned completely, the concentration of NO was stable gradually and NO concentration at the outlet was 559 ppm, which was close to the online measurement value of 615 ppm.

Figure 13: The average NO concentration along the z direction
3.4 Analysis of SNCR Process under Different Injection Conditions
3.4.1 Effects of Different Injection Heights
The contours of NO concentration and NH3 concentration under different injection heights are displayed in Figs. 14 and 15, respectively. Furthermore, the NO and NH3 concentrations at the outlet under different injection heights are shown in Fig. 16.

Figure 14: The contours of NO concentration in the precalciner under different injection heights

Figure 15: The contours of NH3 concentration in the precalciner under different injection heights

Figure 17: The average NO concentration under different injection heights along the z direction
It can be seen from the Figs. 14 and 15 that the distributions of NO and NH3 were similar for different cases, which could be attributed to the fact that, when urea was injected into the precalciner, the NH3 formed at high temperature reacted with NO and O2, especially in the four injection locations, a large amount of NO was reduced to form N2. The difference was that the NO concentration in case 2 was the highest, and the NO concentration in case 0 is the lowest, the following reason could explain this phenomena, the average temperature at case 0 is higher than case 2 (Fig. 11) and was more suitable for SNCR reaction. Moreover, the distributions of NO for different cases were uneven, which could attribute to uneven temperature distribution (Fig. 9), the higher the temperature, the more complete the reaction between NH3 and NO, and the less NO content at the corresponding SNCR injection position. As shown in Fig. 15, NH3 concentration in case 0 was the highest and NH3 concentration in case 2 was the lowest for the three cases. This is also because urea pyrolysis is more complete and more NH3 was formed at high temperature. In addition, NH3 was only monitored near the four injection positions, and there was almost no NH3 elsewhere, which indicated that NH3 reacted completely with NO. The average NO concentration under different injection heights along the z direction is displayed. As can be seen from the Fig. 17, when the aqueous urea solution was injected, a large amount of NH3 reacted with NO, causing the concentration of NO to dropped sharply first, then a small amount of NH3 remaining continued to rise and reacted with NO in the precalciner, and the downward trend of NO concentration slowed down. According the simulation results, NO concentrations at the outlet were between 304.28 mg/Nm3 and 328.84 mg/Nm3, which meet the NOx emission standard (400 mg/Nm3). Moreover, the higher the injection heights, the higher NH3 slips, but all NH3 slips were less than 10 mg/Nm3, which were lower than the NH3 emission standard.

Figure 16: NO and NH3 concentration at the outlet under different injection heights
3.4.2 Effects of Different Flow Rates
The contours of NO concentration and NH3 concentration under different flow rates are displayed in Figs. 18 and 19, respectively, and the average NO concentration under different flow rates along the z direction is shown in Fig. 20. Moreover, NO and NH3 concentrations at the outlet under different flow rates are shown in Fig. 21.
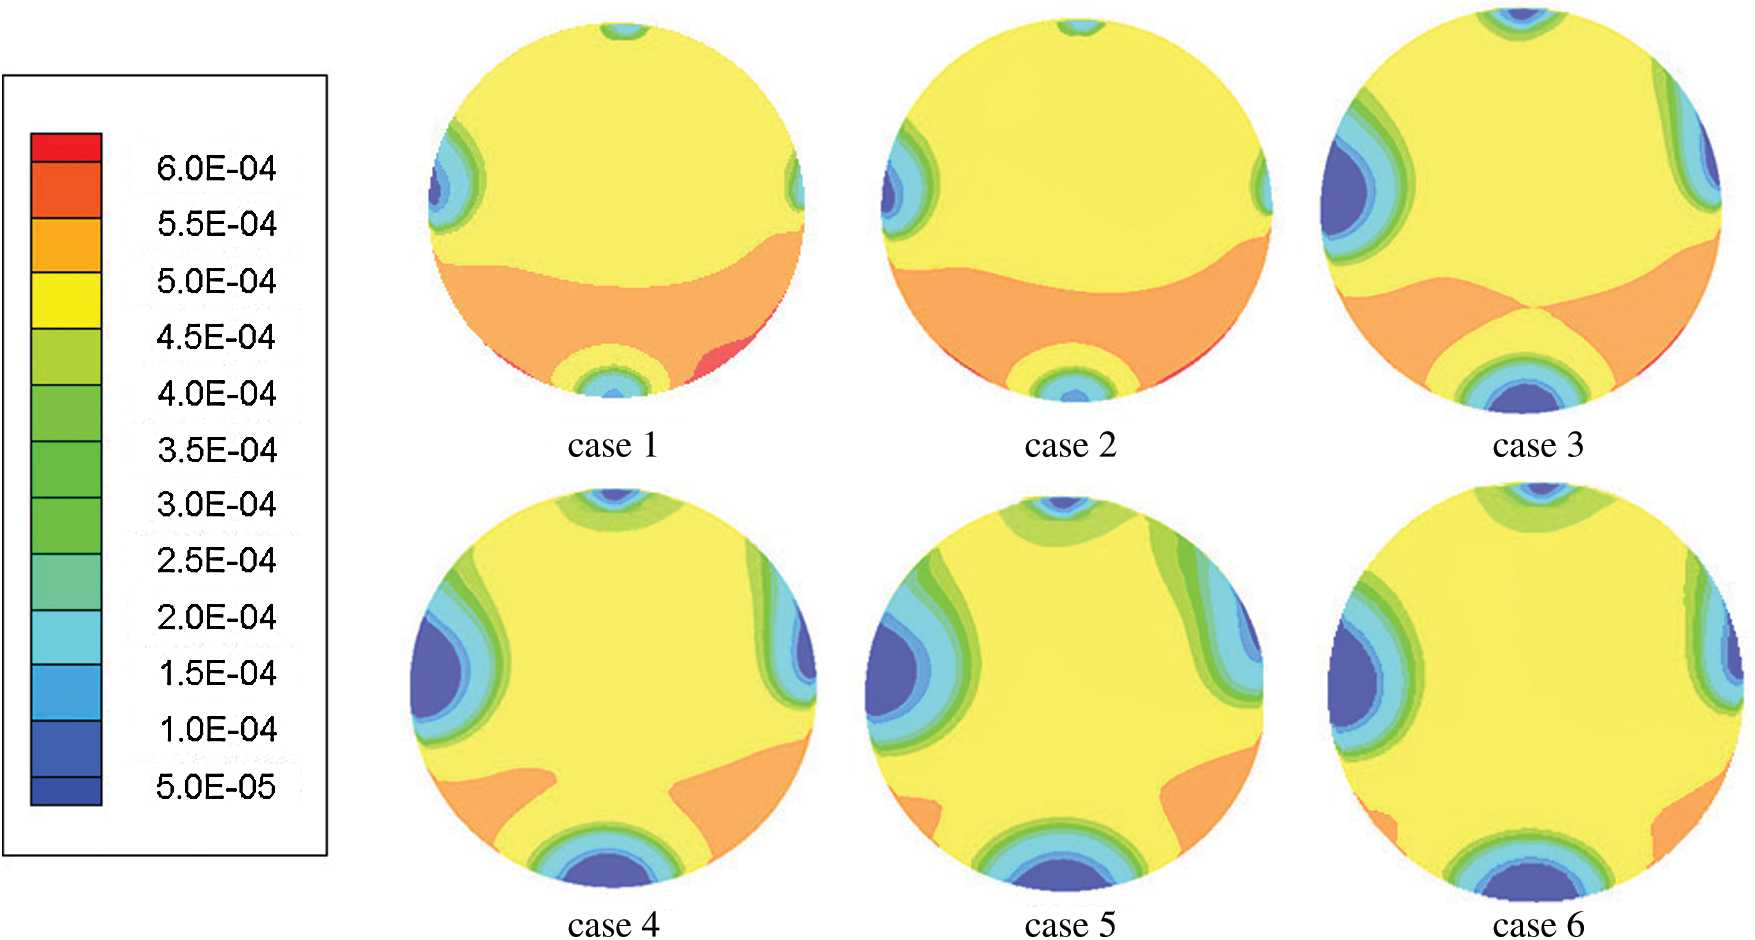
Figure 18: The contours of NO concentration in the precalciner under different flow rates at SNCR-1

Figure 19: The contours of NH3 concentration in the precalciner under different flow rates at SNCR-1

Figure 20: The average NO concentration under different flow rates along the z direction

Figure 21: NO and NH3 concentration at the outlet under different flow rates
As can be seen from Figs. 18 and 20, as the flow rate increased, the NO concentration gradually decreased and the distribution of NO became more uniform. This is because with the increase of urea, more NH3 produced by the decomposition of urea reacted with NO, which increased NOX removal efficiency and resulted in a more uniform distribution of NO on the cross section. As shown in Fig. 19, the distribution of NH3 was similar to the Fig. 15, that is, the high concentrations of NH3 were only detected at the four injection locations and the other regions was almost zero, which also proved that the reaction between NH3 and NO was complete. With the flow rate increased, NH3 concentration increased slightly at SNCR-1, but the increase was not obvious, at this situation, on the one hand, the NH3 generated by urea pyrolysis was largely consumed by NO reaction, moreover, although the decomposition of urea was instantaneous. It could be seen from the Fig. 20 that the rapid descent stage of NO after urea injection was 20 m~22 m, which was mainly affected by the upward gas flows in the precalciner, leading to the rise of unreacted NH3 along with the airflow. These dual function caused NH3 concentration was not high at SNCR-1. According to the simulation results, the NO concentrations at the outlet were 226.24 mg/Nm3~297.27 mg/Nm3, and the reduction efficiency were 37.92% to 54.74%. In addition, the NSR increased by 0.2 every time, the NO concentration decreased by 21.92 mg/Nm3, 16.61 mg/Nm3, 21.92 mg/Nm3, 18.84 mg/Nm3 and 3.51 mg/Nm3, respectively. It can be seen that when NSR was greater than 1.8, the effect of flow rates on NO removal efficiency was small, and NH3 slip exceeded emission standards (10 mg/Nm3). So the SNCR injection flow rates had an optimal flow rate but not the higher the better. Results showed the optimal flow rate was 0.0342 kg/s with NO emission concentration of 226.24 mg/Nm3 and NH3 slip of 3.43 mg/Nm3.
3.4.3 Effects of Stratified Injection under Different Flow Rates
The contours of NO concentration and NH3 concentration under the ratio of 7:2:1 are displayed in Figs. 22 and 23, respectively. Moreover, NO and NH3 concentration at the outlet under different condition are shown in Figs. 24 and 25.

Figure 22: The contours of NO concentration in the precalciner under fixed ratio injection at SNCR-3

Figure 23: The contours of NH3 concentration in the precalciner under fixed ratio injection at SNCR-3

Figure 24: NO concentration at the outlet under different condition

Figure 25: NH3 concentration at the outlet under different condition
Compared to the effect of injection height and flow rates, both NO and NH3 concentrations at SNCR-3 were lower by fixed ratio injection, which could attribute to the effect of stratified injection, the former was because large amounts of NO was reduced at SNCR-1 and SNCR-2, resulting in the lower NO concentration at SNCR-3, the latter was because the aqueous urea solution was not injected into SNCR-3 completely, NH3 produced by urea decomposition was consumed by reacting with NO between 20 m and 30 m, leading to a lower NH3 concentration at SNCR-3. Moreover, the distribution of NO under stratified injection was more nonuniform in Fig. 22 compared to Figs. 14 and 18. This is also because when z = 30 m, the temperature distribution (Fig. 9) was more uneven, resulting in different denitration efficiency, which further led to more uneven NO distribution at SNCR-3.
From Figs. 24 and 25, it can be observed that NO concentrations at the outlet were 226.24 mg/Nm3~297.27 mg/Nm3, the reduction efficiency was 39.36% to 53.85%, and NH3 slip was 4.67 mg/Nm3~10.59 mg/Nm3. Moreover, NO concentrations at the outlet in case 8, case 9 and case 10 were lower than that at the outlet in case 0, case 3 and case 4, respectively, which could be attributed to proper stratified injection could slow down the competition of SNCR reaction [37]. However, NO concentrations at the outlet in case 11, case 12 and case 13 were higher than that at the outlet in case 5, case 6 and case 7. This may be because although stratified injection could reduce the competition of SNCR reaction, with the increase of aqueous urea solution at SNCR-3, the shorter reaction time played a more important role in SNCR reaction. Therefore, the flow rate of aqueous urea solution at SNCR-3 had a strong effect on the slip of unreacted NO, and decreasing the flow rate of that at SNCR-3 was conducive to reducing NOX emission. What’s more, NH3 slips of case 8, case 9, case10, case 11 and case 12 were much higher than that of case 0, case 3, case 4, case 5 and case 6, respectively, which could be attribute to the residence time of NH3 was shorter at SNCR-3 and the reduction of NO was incomplete, leading to higher NH3 slip. Therefore, the flow rate of aqueous urea solution at SNCR-3 had an adverse effect on the slip of NH3, and the greater the flow rate, the more serious the slip of NH3. Besides, NH3 slip at the outlet in case 7 and case 13 was similar, as mentioned above, when NSR > 1.8, the effect of flow rate on the reduction efficiency of NO was small, meaning that NH3 slip was serious.
In a word, the effects of stratified injection and different flow rates on NOx removal efficiency were different, When the flow rate of stratified injection was 0.019 kg/s, NO concentration at the outlet of the precalciner dropped the most, meanwhile, NH3 slip met the emission standard. Therefore, the optimal injection flow rate under stratified injection was 0.019 kg/s with NO emission concentration of 297.27 mg/Nm3 and NH3 slip of 4.67 mg/Nm3, which could play a better optimization role on NO removal efficiency on the basic of the injection flow rate.
In this article, a numerical simulation of the full-scale trinal-sprayed precalciner was enforced to study the transport of gas-solid two-phase flow, combustion characteristics, NOx emission and NH3 slip in the precalciner. The results showed the flue gas from the rotary kiln formed the recirculation region on both sides of the cone body, which increased the residence time of the solid particles, and facilitated heat exchange between the raw meals and the gas and CaCO3 decomposition, further, there were high temperature and low temperature zones in the precalciner, the high temperature zone was mainly distributed in the cone of the precalciner and pulverized coal main combustion area, and the low temperature zone was mainly distributed in the middle and upper column section of the precalciner. In addition, the calcium carbonate decomposition was mainly concentrated in the middle and lower column section of the precalciner, and the predicted CaCO3 decomposing rate was 90.51%, which was in accordance with the actual measured data.
The concentration of nitric oxide was predicted and the NO concentration at the outlet was 559 ppm. Moreover, different injection heights and different injection flow rates had a strong effect on NOX removal efficiency and NH3 slip. The aqueous urea solution should be injected at SNCR-1 to prolong the reaction time between NH3 and NO, and injection flow rate had an optimal flow rate but not the higher the better. When the injection flow rate under stratified injection was 0.019 kg/s, which could play a better optimization role on NO removal efficiency on the basic of the injection flow rate. In consideration of cost effective, A stratified injection with an injection flow rate of 0.019 kg/s and an injection height of 20 m, 25 m and 30 m was suggested as a compromise of a satisfactory NOx reduction rate and reasonable NH3 slip. Under this condition, numerical simulation result showed that NOx concentration at the outlet of precalciner was 297.27 mg/Nm3 and NH3 slip was 4.67 mg/Nm3, meeting emission standard.
Funding Statement: This work was supported by the general institute of building materials research of china (No. 2017YFC0210801) and the Priority Academic Program Development of Jiangsu Higher Education Institutions (PAPD).
Conflicts of Interest: The authors declare that they have no conflicts of interest to report regarding the present study.
1. Hashem, F. S., Razek, T. A., Mashout, H. A. (2019). Rubber and plastic wastes as alternative refused fuel in cement industry. Construction and Building Materials, 212, 275–282. DOI 10.1016/j.conbuildmat.2019.03.316. [Google Scholar] [CrossRef]
2. Hossain, M. U., Poon, C. S., Kwong, W. M. Y., Khine, A. (2019). Techno-environmental feasibility of wood waste derived fuel for cement production. Journal of Cleaner Production, 230, 663–671. DOI 10.1016/j.jclepro.2019.05.132. [Google Scholar] [CrossRef]
3. Wei, X., Xu, J., Jia, L., Li, H., Bo, C. et al. (2014). The utilization of lime-dried sludge as resource for producing cement. Journal of Cleaner Production, 83, 286–293. DOI 10.1016/j.jclepro.2014.07.070. [Google Scholar] [CrossRef]
4. Ping, L., Zhao, G., Lin, X., Gu, Y., Xu, J. (2020). Feasibility and carbon footprint analysis of lime-dried sludge for cement production. Sustainability, 12(6), 2500. DOI 10.3390/su12062500. [Google Scholar] [CrossRef]
5. Xu, Y., Zhang, Y., Wang, J., Yuan, J. (2013). Application of CFD in the optimal design of a SCR-DeNOx system for a 300 MW coal-fired power plant. Computers and Chemical Engineering, 49, 50–60. DOI 10.1016/j.compchemeng.2012.09.014. [Google Scholar] [CrossRef]
6. Vignesh, R., Ashok, B. (2020). Critical interpretative review on current outlook and prospects of selective catalytic reduction system for De-NOx strategy in compression ignition engine. Fuel, 276, 117996. DOI 10.1016/j.fuel.2020.117996. [Google Scholar] [CrossRef]
7. Fan, W., Li, Y., Guo, Q., Chen, C., Wang, Y. (2017). Coal-nitrogen release and NOx evolution in the oxidant-staged combustion of coal. Energy, 125, 417–426. DOI 10.1016/j.energy.2017.02.130. [Google Scholar] [CrossRef]
8. Kang, M. S., Jeong, H. J., Massoudi, F. M. (2017). Effect of staged combustion on low NOx emission from an industrial-scale fuel oil combustor in South Korea. Fuel, 210, 282–289. DOI 10.1016/j.fuel.2017.08.065. [Google Scholar] [CrossRef]
9. Fan, W., Zhu, T., Sun, Y. (2014). Effects of gas compositions on NOx reduction by selective non-catalytic reduction with ammonia in a simulated cement precalciner atmosphere. Chemosphere, 113, 182–187. DOI 10.1016/j.chemosphere.2014.05.034. [Google Scholar] [CrossRef]
10. Li, S., Ge, Y., Wei, X. (2018). Experiment on NOx reduction by advanced reburning in cement precalciner. Fuel, 224, 235–240. DOI 10.1016/j.fuel.2018.03.039. [Google Scholar] [CrossRef]
11. Hu, Z., Jiang, E., Ma, X. (2019). Numerical simulation on operating parameters of SNCR process in a municipal solid waste incinerator. Fuel, 245, 160–173. DOI 10.1016/j.fuel.2019.02.071. [Google Scholar] [CrossRef]
12. Cheng, G., Zhang, C. (2018). Desulfurization and denitrification technologies of coal-fired flue gas. Polish Journal of Environmental Studies, 27(2), 481–490. DOI 10.15244/pjoes/75959. [Google Scholar] [CrossRef]
13. Li, Y., Fan, W. (2019). Effect of char gasification on NOx formation process in the deep air-staged combustion in a 20 kW down flame furnace. Applied Energy, 164, 258–267. DOI 10.1016/j.apenergy.2015.11.048. [Google Scholar] [CrossRef]
14. Li, S., Wei, X., Guo, X. (2012). Effect of H2O vapor on NO reduction by CO: experimental and kinetic modeling study. Energy & Fuels, 26(7), 4277–4283. DOI 10.1021/ef300580y. [Google Scholar] [CrossRef]
15. Wu, H., Ren, Q., Cai, J. (2019). Research on the dynamic process of NO heterogeneous and homogeneous reduction with cement raw meal in vertical tubular reactor. Journal of the Energy Institute, 93(3), 878–888. DOI 10.1016/j.joei.2019.07.011. [Google Scholar] [CrossRef]
16. Fu, S., Song, Q., Tang, J. (2014). Effect of CaO on the selective non-catalytic reduction deNO process: experimental and kinetic study. Chemical Engineering Journal, 249, 252–259. DOI 10.1016/j.cej.2014.03.102. [Google Scholar] [CrossRef]
17. Fu, S., Song, Q., Yao, Q. (2015). Experimental and kinetic study on the influence of CaO on the N2O + NH3 + O2 system. Energy & Fuels, 29(3), 1905–1912. DOI 10.1021/ef502512f. [Google Scholar] [CrossRef]
18. Fu, S., Song, Q., Yao, Q. (2015). Study on the catalysis of CaCO3 in the SNCR deNOx process for cement kilns. Chemical Engineering Journal, 262, 9–17. DOI 10.1016/j.cej.2014.09.048. [Google Scholar] [CrossRef]
19. Xie, J., Mei, S. (2007). Numerical simulation of gas-solid flow in SLC-S precalciner by adding a raw meal inlet. Kuei Suan Jen Hsueh Pao/Journal of the Chinese Ceramic Society, 35, 1382–1388. [Google Scholar]
20. Huang, L., Lu, J., Xia, F., Li, W. (2006). 3-D mathematical modeling of an in-line swirl-spray precalciner. Chemical Engineering and Processing: Process Intensification, 45(3), 204–213. DOI 10.1016/j.cep.2005.09.001. [Google Scholar] [CrossRef]
21. Fidaros, D. K., Baxevanou, C. A., Dritselis, C. D. (2007). Numerical modelling of flow and transport processes in a calciner for cement production. Powder Technology, 171(2), 81–95. DOI 10.1016/j.powtec.2006.09.011. [Google Scholar] [CrossRef]
22. Hu, Z., Ma, X., Chen, Y., Liao, Y., Wu, J. et al. (2015). Co-combustion of coal with printing and dyeing sludge: numerical simulation of the process and related NOX emissions. Fuel, 139, 606–613. DOI 10.1016/j.fuel.2014.09.047. [Google Scholar] [CrossRef]
23. Xia, Z., Li, J., Wu, T., Chen, C., Zhang, X. (2014). CFD simulation of MSW combustion and SNCR in a commercial incinerator. Waste Management, 34(9), 1609–1618. DOI 10.1016/j.wasman.2014.04.015. [Google Scholar] [CrossRef]
24. Huang, L., Lu, J., Hu, Z., Wang, S. (2006). Numerical simulation and optimization of NO emissions in a precalciner. Energy & Fuels, 20(1), 164–171. DOI 10.1021/ef0502857. [Google Scholar] [CrossRef]
25. Sun, Y., Fan, W., Zhu, T., Hong, X. (2017). Effect of CaO on NOx reduction by selective non-catalytic reduction under variable gas compositions in a simulated cement precalciner atmosphere. International Journal of Environmental Research and Public Health, 14(12), 1474. [Google Scholar]
26. Mikulčić, H., Vujanović, M., Fidaros, D. K., Priesching, P., Minić, I. et al. (2012). The application of CFD modelling to support the reduction of CO2 emissions in cement industry. Energy, 45(1), 464–473. DOI 10.1016/j.energy.2012.04.030. [Google Scholar] [CrossRef]
27. An, H., Yang, W. M., Li, J., Zhou, D. Z. (2015). Modeling analysis of urea direct injection on the NOx emission reduction of biodiesel fueled diesel engines. Energy Conversion and Management, 101, 442–451. DOI 10.1016/j.enconman.2015.06.008. [Google Scholar] [CrossRef]
28. Modliński, N. (2015). Numerical simulation of SNCR (selective non-catalytic reduction) process in coal fired grate boiler. Energy, 92, 67–76. DOI 10.1016/j.energy.2015.03.124. [Google Scholar] [CrossRef]
29. Anderson, J. (2002). Computational fluid dynamics. China: Tsinghua University Press. [Google Scholar]
30. Shih, T. H., Liou, W. W., Shabbir, A., Yang, Z., Jiang, Z. (1995). A new κ-ε eddy viscosity model for high reynolds number turbulent flows. Computers & Fluids, 24(3), 227–238. DOI 10.1016/0045-7930(94)00032-T. [Google Scholar] [CrossRef]
31. Sazhin, S. S., Sazhina, E. M. (1996). The P-1 model for thermal radiation transfer: advantages and limitations. Fuel, 75(3), 289–294. DOI 10.1016/0016-2361(95)00269-3. [Google Scholar] [CrossRef]
32. Gómez, M. A., Porteiro, J., Míguez, J. L. (2016). Numerical simulation of the combustion process of a pellet-drop-feed boiler. Fuel, 184, 987–999. [Google Scholar]
33. Fluent Inc. User’s Guide. (2006). [Google Scholar]
34. Branco, J., Coelho, P. J., Costa, M. (2016). Experimental and numerical investigation of turbulent diffusion flames in a laboratory combustor with a slot burner. Fuel, 175, 182–190. DOI 10.1016/j.fuel.2016.02.046. [Google Scholar] [CrossRef]
35. Miller, R. S., Harstad, K., Bellan, J. (1998). Evaluation of equilibrium and non-equilibrium evaporation models for many-droplet gas-liquid flow simulations. International Journal of Multiphase Flow, 24(6), 1025–1055. DOI 10.1016/S0301-9322(98)00028-7. [Google Scholar] [CrossRef]
36. Mei, S., Xie, J., Chen, X., He, F., Yang, H. et al. (2017). Numerical simulation of the complex thermal processes in a vortexing precalciner. Applied Thermal Engineering, 125, 652–661. DOI 10.1016/j.applthermaleng.2017.07.041. [Google Scholar] [CrossRef]
37. Valera, M. A., Marsh, R., Runyon, J., Pugh, D., Beasley, P. (2017). Ammonia–methane combustion in tangential swirl burners for gas turbine power generation. Applied Energy, 185, 1362–1371. DOI 10.1016/j.apenergy.2016.02.073. [Google Scholar] [CrossRef]
 | This work is licensed under a Creative Commons Attribution 4.0 International License, which permits unrestricted use, distribution, and reproduction in any medium, provided the original work is properly cited. |