DOI:10.32604/jrm.2021.011912
| Journal of Renewable Materials DOI:10.32604/jrm.2021.011912 | |
| Article |
Development of a Soil Stabilizer for Road Subgrade Based on Original Phosphogypsum
1College of Materials Science and Engineering, Nanjing Tech University, Nanjing, 210009, China
2China Construction Installation Engineering Co., Ltd., Nanjing, 210023, China
3Jiangsu YongGang Group Co., Ltd., Suzhou, 215628, China
*Corresponding Author: Sudong Hua. Email: huasudong@126.com
Received: 05 June 2020; Accepted: 07 July 2020
Abstract: The research used industrial by-products original phosphogypsum (PG) as the main raw material, slag (SG) and Portland cement (PC) as auxiliary materials, and the optimal additive amount was determined according to the compressive strength value of the sample. Comprehensively evaluate the water resistance and volume stability of the samples, and determine the best formula for new roadbed stabilized materials. The results showed that when the weight ratio of PG, slag and cement was OPG:SG:PC = 6:3:1, and mixed with 5% micro silica fume (MSF) and 3‰ hydroxypropyl methyl cellulose (HPMC), the sample’s comprehensive performance was the best, specifically, the sample’s compressive strength in 60 days reached 28.8 MPa, the softening coefficient reached 0.9, and the expansion rate was stable at about −0.2%. In addition, the mechanism of action of enhancers MSF and HPMC was analyzed according to use Vicat device, X-ray diffractometer and scanning electron microscope. The best formula SP3GH3 has the best curing effect on soil. The 28-day unconfined compressive strength (UCS) of the sample reached 2.4 MPa, the expansion rate was less than 0.09%, and the water stability coefficient was above 0.79, which was higher than that of the samples cured by traditional cement and lime during the same period.
Keywords: Original phosphogypsum; subgrade stabilized material; compressive strength; softening coefficient; expansion rate
Phosphogypsum (PG) is a by-product of the industrial wet production of phosphoric acid and phosphate [1,2], the main component of the original PG is CaSO4 • 2H2O, and some impurities such as H3PO4 and fluoride, etc. [3]. In recent years, with the development of the economy, the global annual output of PG has stabilized between 160 million tons and 280 million tons. In particular, China produces more than 50 million tons of PG each year [4–6].
Because the chemical composition of PG is similar to natural gypsum [7], it is widely used to make cement products. Huang et al. [8] succesfully studied the use of PG instead of dihydrate gypsum as a component of calcium sulfoaluminate aluminate cement. Taher et al. [9] used pre-heat treated PG for the production of Portland cement. Da Costa and others developed a soil modifier using PG and lime to increase crop yields [10]. In addition to applications in industrial raw materials and agriculture, PG is also widely used in the field of building materials. Degirmenci studied the possibility of making cement binders using industrial waste fly ash and PG. By testing the unit weight, water absorption, volume stability, compressive strength and flexural strength of the binder samples, it was proved that cemented adhesives can be used to produce interior wall materials such as bricks and blocks [11].
Although PG is widely used, its consumption in the world is not high. Mainly because the original PG contains impurities, if it is used directly, it will affect the performance. Although pre-treatment will improve the use efficiency, it will consume more energy and cause secondary pollution. The most common solution is still the accumulation of open areas, which has led to the occupation of a large amount of cultivated land [12]. More importantly, some harmful substances in PG will infiltrate into the soil with rainwater during rainy and snowy weather, and then penetrate into the groundwater, resulting in soil compaction, soil and water hazardous substances exceeding standards, and seriously threatening people’s daily lives [13,14].
In recent years, on the one hand, as the Chinese government has enhanced its efforts to protect the natural environment, many mines have been banned from mining, which has caused the prices of raw materials such as cement and lime to rise sharply and the cost of infrastructure construction to remain high. On the other hand, Chinese domestic infrastructure construction continues unabated, forcing Chinese researchers to seek waste to replace traditional infrastructure materials [15–19].
It would be a good idea to use PG to stabilize the soil. On the one hand, it can consume a large amount of PG, on the other hand, it can solve the plight of shortage of raw materials. The current research focuses on the “stability of contaminated soil” and “stability of subgrade soil” [20–22]. However, in most studies on stabilizers, the content of PG does not exceed 50%, and the amount of stabilizers in the roadbed is low. The main reason is that when the amount of stabilizer is too small, the compressive strength of the roadbed will not be high, and excessive use will lead to poor volume stability [19,23–26]. Therefore, PG is not widely used in road construction. In this paper, a novel soil stabilization material based on PG and suitable for road subgrade construction was developed to replace traditional cement and lime materials by adding modifiers. In this new stabilizer, the mass ratio of PG to the entire stabilizer reaches 60%. At the same time, only 10% of the stabilizer content in the roadbed can meet the basic requirements of road construction.
The main raw materials used in this experimental study include original phosphogypsum (PG), slag (SG), Portland cement (PC). The main additives are: (1) Micro silicon powder (MSF). MSF is rich in active SiO2, which can increase the degree of hydration reaction and enhance the strength and other properties of the stabilizer. Its designed dosage was 4%, 5% and 6%, respectively; (2) Sodium aluminate (SA), molecular weight is 81.97, which can accelerate slurry solidification and reduce retardation of PG. Its designed dosage was 1%, 2%, 3%, and 4%, respectively; (3) Hydroxypropyl methylcellulose (HPMC), which is mainly used for water retention and thickening, has a molecular weight of 86,000 and design doses of 1 ‰, 2 ‰, 3 ‰, and 4 ‰, respectively; (4) Flocculant polyacrylamide (PAA), molecular weight was 10000000, and the designed dosage was 0.1‰, 0.5‰, 1‰, and 1.5‰ respectively; (5) Lignin fiber (LF) which is used to improve the elongation of the sample and reduce the shrinkage caused by drying in the early stage. The pH is 7.0 ± 1.0, and the design doses are 1 ‰, 2 ‰, 3 ‰, and 4 ‰ respectively. The PG and SG were from Suqian, Jiangsu Province, China, the PC was from Anhui Conch Group Co., Ltd., and other additives were from Nanjing, Jiangsu Province, China.
Tab. 1 is the main chemical composition of PG, SG, PC and MSF after XRF spectrum analysis. From the data in the table, we can see that the main components of PG are SO3, CaO, SiO2 and Al2O3. On the other hand, research had found that the main crystal phase of PG is gypsum [7,27].
Table 1: Chemical composition of raw material
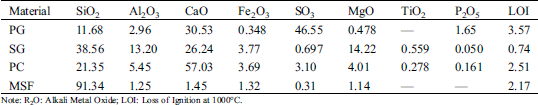
Note: R2O: Alkali Metal Oxide; LOI: Loss of Ignition at 1000°C.
The PG used in the experiment was taken directly from the phosphate fertilizer plant, and the moisture content is 12.3%, so it should be air-dried at room temperature before use. In addition, the specific gravity of PG is 2.34 g/cm3, and the particle size distribution is shown in Fig. 1.
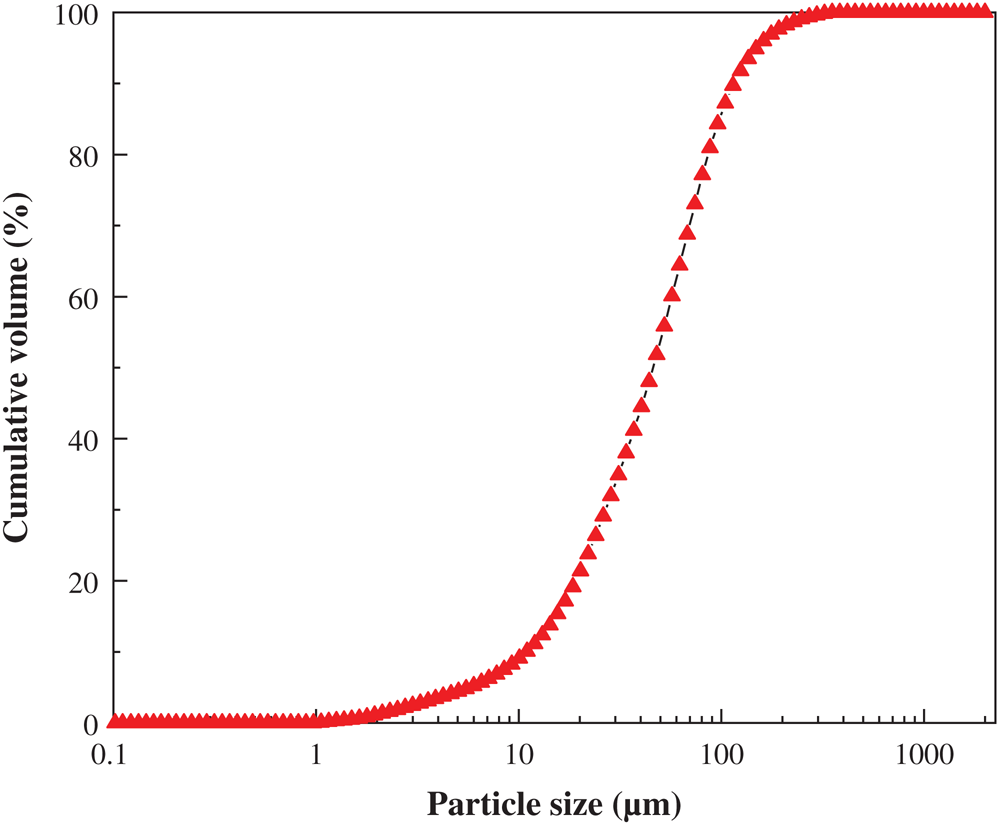
Figure 1: Particle size distribution of PG
2.2 Procedure for Recipe Optimization
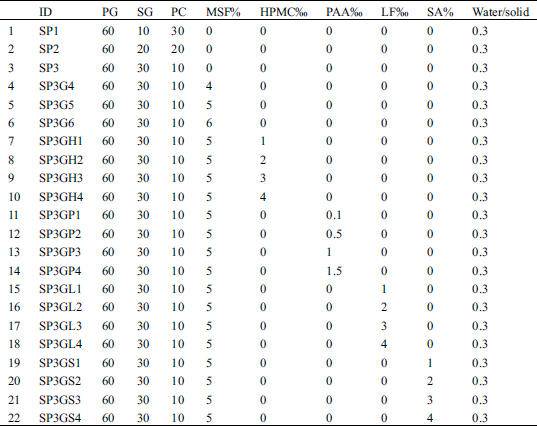
First, in order to ensure that the content of PG in the soil stabilized material is high, its weight ratio was set to 60% of the total weight, and different weight ratios of the remaining SG and PC were determined according to the orthogonal test method. Subsequently, the optimal base formulation was determined based on the compressive strength of the hardened paste. Finally, according to the total weight of the basic formula, other additives were added at different weight ratios to modify the optimal basic formula. The specific weight ratio of each raw material and additive is shown in Tab. 2.
Table 2: Weight ratio of each raw material
First, according to the ratio in Tab. 2, the raw material with a total weight of 1.5 kg was added to the cement mixing pot (ASTM C305). After stired for 2 minutes, the color of the raw material became uniform and the components have been evenly mixed. Then, weigh a certain amount of water in the beaker according to the standard consistency of the raw material, put the weighed additive into the beaker, and stired with a glass rod to make the additive fully dissolved in water. Next, the mixed cementitious material powder and the dissolved additive solution were poured into a container of a cement slurry mixer. Stired slowly for 2 minutes, then quickly for 1 minute, and obtained the required slurry. After calculation, the standard consistency of the slurry was 30%.
The prepared slurry was cast into a 20 mm × 20 mm × 20 mm cube plastic mold, and 15 samples were cast for each formula in order to test the compressive strength of the samples at different curing ages and water resistance of the samples. The samples after demoulded must be placed in a standard curing room for curing, and the temperature in the curing room should be controlled at 20 ± 2°C, and the humidity should be controlled at 96%.
In order to test the volume change rate of the sample, the sample needs to be made, and six prism samples were required for each group of formulas. The stirred slurry was cast into a steel mold with a size of 10 mm × 10 mm × 50 mm. In addition, the prism sample ends were equipped with embedded steel nails to facilitate the test of the length. The steel nails must be installed at the two ends of the mold before the slurry was cast. Similarly, after the slurry was cast, the sample needs to be cured. The device and sample are shown in Fig. 2.
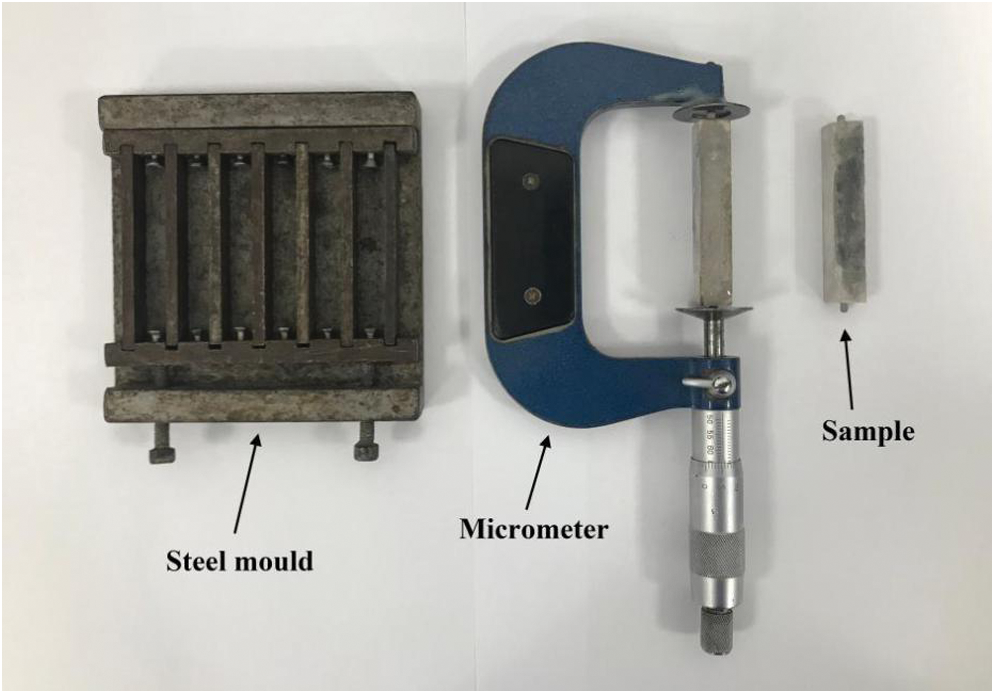
Figure 2: Device for testing expansion
The compressive strength was tested by WHY-200 microcomputer-controlled automatic compression tester. Three small squares of 20 mm × 20 mm × 20 mm cured for the same age were used for compressive strength test. The average value of 3 data was used to determine compressive strength of the sample. The ages tested included 3 days, 7 days, 28 days, and 60 days.
After the slurry sample was hardened and formed, it could be demoulded, and then the vernier sample was measured with a vernier caliper and recorded as the initial length of the sample l0. Then, placed the sample in the standard curing room to curing. After the sample curing time has expired, continued to measure the length and recorded it as the final sample length ln. Finally, calculated the volume change rate K of the sample according to Eq. (1).

The hardened cubes of cemented material were cured for 60 days after demolding. Taken 3 samples and soaked them in a plastic container filled with water. The distance between the samples should not be less than 2 cm and the water surface should be more than 2 cm above the sample. After 3 days of immersion, the sample was taken out and wiped clean for compressive strength test, the strength value was recorded as Pu1. The compressive strength value of the unsoaked samples was recorded as Pu0. Finally, the softening coefficient Ru was calculated according to the following formula (2). The larger the softening coefficient value, the stronger the water resistance of the sample.

According to the standard ASTM C191, using the Vicat device to test the setting time and exothermic characteristics of the formulation, the water-solid ratio was 0.3. The dried hardened body sample was ground and passed through a 200 mesh sieve, and the powder sample was subjected to X-ray diffraction analysis (Rigaku-2500, Japan), scanning range: 5–90° 2θ; step length: 0.02° 2θ; scanning speed: 10° 2θ min-1. A scanning electron microscope (JEOL, JSM-5900, Japan) was used to observe the microstructure of the hardened body. Before the test, all samples were coated with a thin layer of gold conductive layer.
2.4.5 Evaluation of Curing Performance
The formulation of the stabilized material was selected and added to the dried and sieved soil (The soil is silty soil and common in eastern China) at a content of 10%. According to the optimal moisture content of the mixture of 16%, calculated the amount of water to be added, and then stired evenly with a blender. The stirred mixture was placed in a hollow cylindrical steel mold with an inner diameter of Φ 50 mm × 50 mm, and pressed by a hydraulic jack. After the samples were prepared, they should be placed in a standard curing box for curing. Finally, the samples were tested for unconfined compressive strength (UCS), volume stability and water resistance according to the standard GB/T 50123-2019 (Chinese standard). In addition, the water stability of the sample was reflected by the coefficient of water stability. The calculation formula of the coefficient of water stability Wu is shown in formula (3). In the equation, Cu1 represents the UCS of the sample after soaking, and Cu0 represents the UCS of the sample without soaking. The larger the coefficient of water stability value, the stronger the water resistance of the sample.

New soil stabilization materials will be studied for use in road subgrades. Therefore, the compressive strength of new materials must become the main factor for performance evaluation.
Fig. 3 shows the change in compressive strength of the sample at different ages after being formulated according to the basic formula in Tab. 2. Except that the content of the original PG in the basic formula has been determined to be 60%, it can be seen from the strength value in Fig. 3 that the best basic formula is SP3 (SG:PC = 3:1), and the compressive strength of the samples after curing for 7 d, 28 d, and 60 d were 16.8 MPa, 18.2 MPa, and 20.8 MPa, respectively, which were higher than the SP1(SG:PC = 1:3) and SP2(SG:PC = 2:2). The more products produced by the hydration reaction, the higher the compressive strength of the sample. As can be seen from Fig. 3, after curing for a period of time, the compressive strength tends to be stable. The main reason is that when the age increases, the hydration reaction will terminate, and products such as hydrated calcium silicate will not increase any more [28,29].
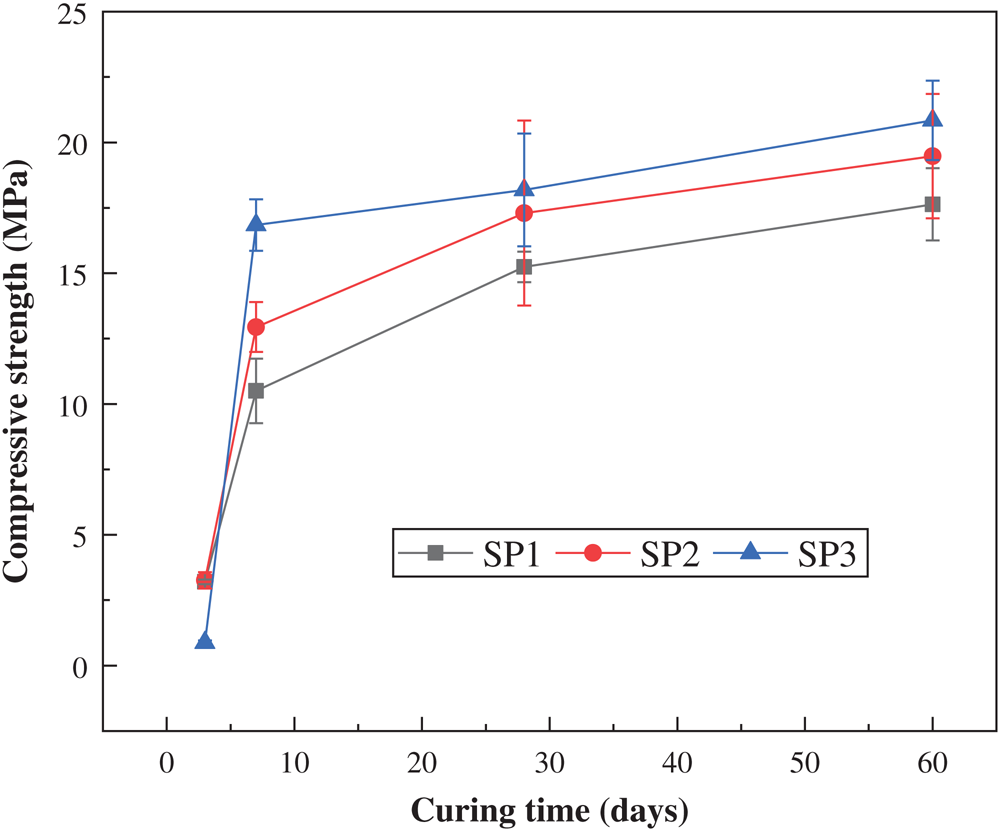
Figure 3: Compressive strength of different basic formulations
Due to the delayed setting of PG, the early strength of the sample is low [30]. It can be found from Fig. 4 that the compressive strength of the sample made from only the basic formula after standard cured for 3 days is only 0.8 MPa. With the addition of enhancer MSF, the early compressive strength of the samples had improved significantly, usually greater than 2 MPa. After curing for 60 days, it reached 25.8 MPa, which was higher than the 20.8 MPa of the sample without adding MSF. The main reason is that when the hydration reaction occurs in the stable material, CaOH will be produced, and the volcanic ash reaction will occur after CaOH meets the active SiO2 in the MSF, which promotes the production of hydrated calcium silicate and reduced the porosity of the sample and improves the compressive strength [31,32].
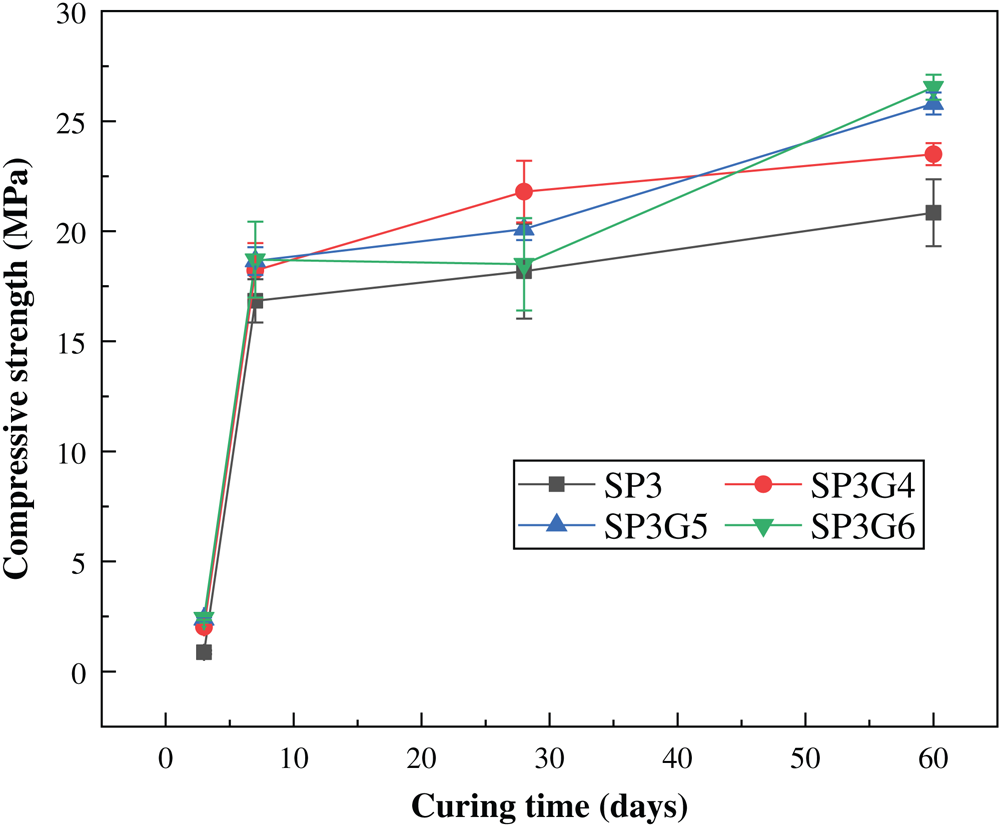
Figure 4: Effect of MSF on the compressive strength of the basic formula
From Fig. 5(a) we can find that the addition of HPMC would slightly weaken the overall compressive strength of the sample. Among them, the addition of 3‰ HPMC has the smallest effect on the compressive strength of the sample. Instead, with the increase of the curing time of the sample, HPMC helps to improve the compressive strength, which is close to 30 MPa after 60 days.
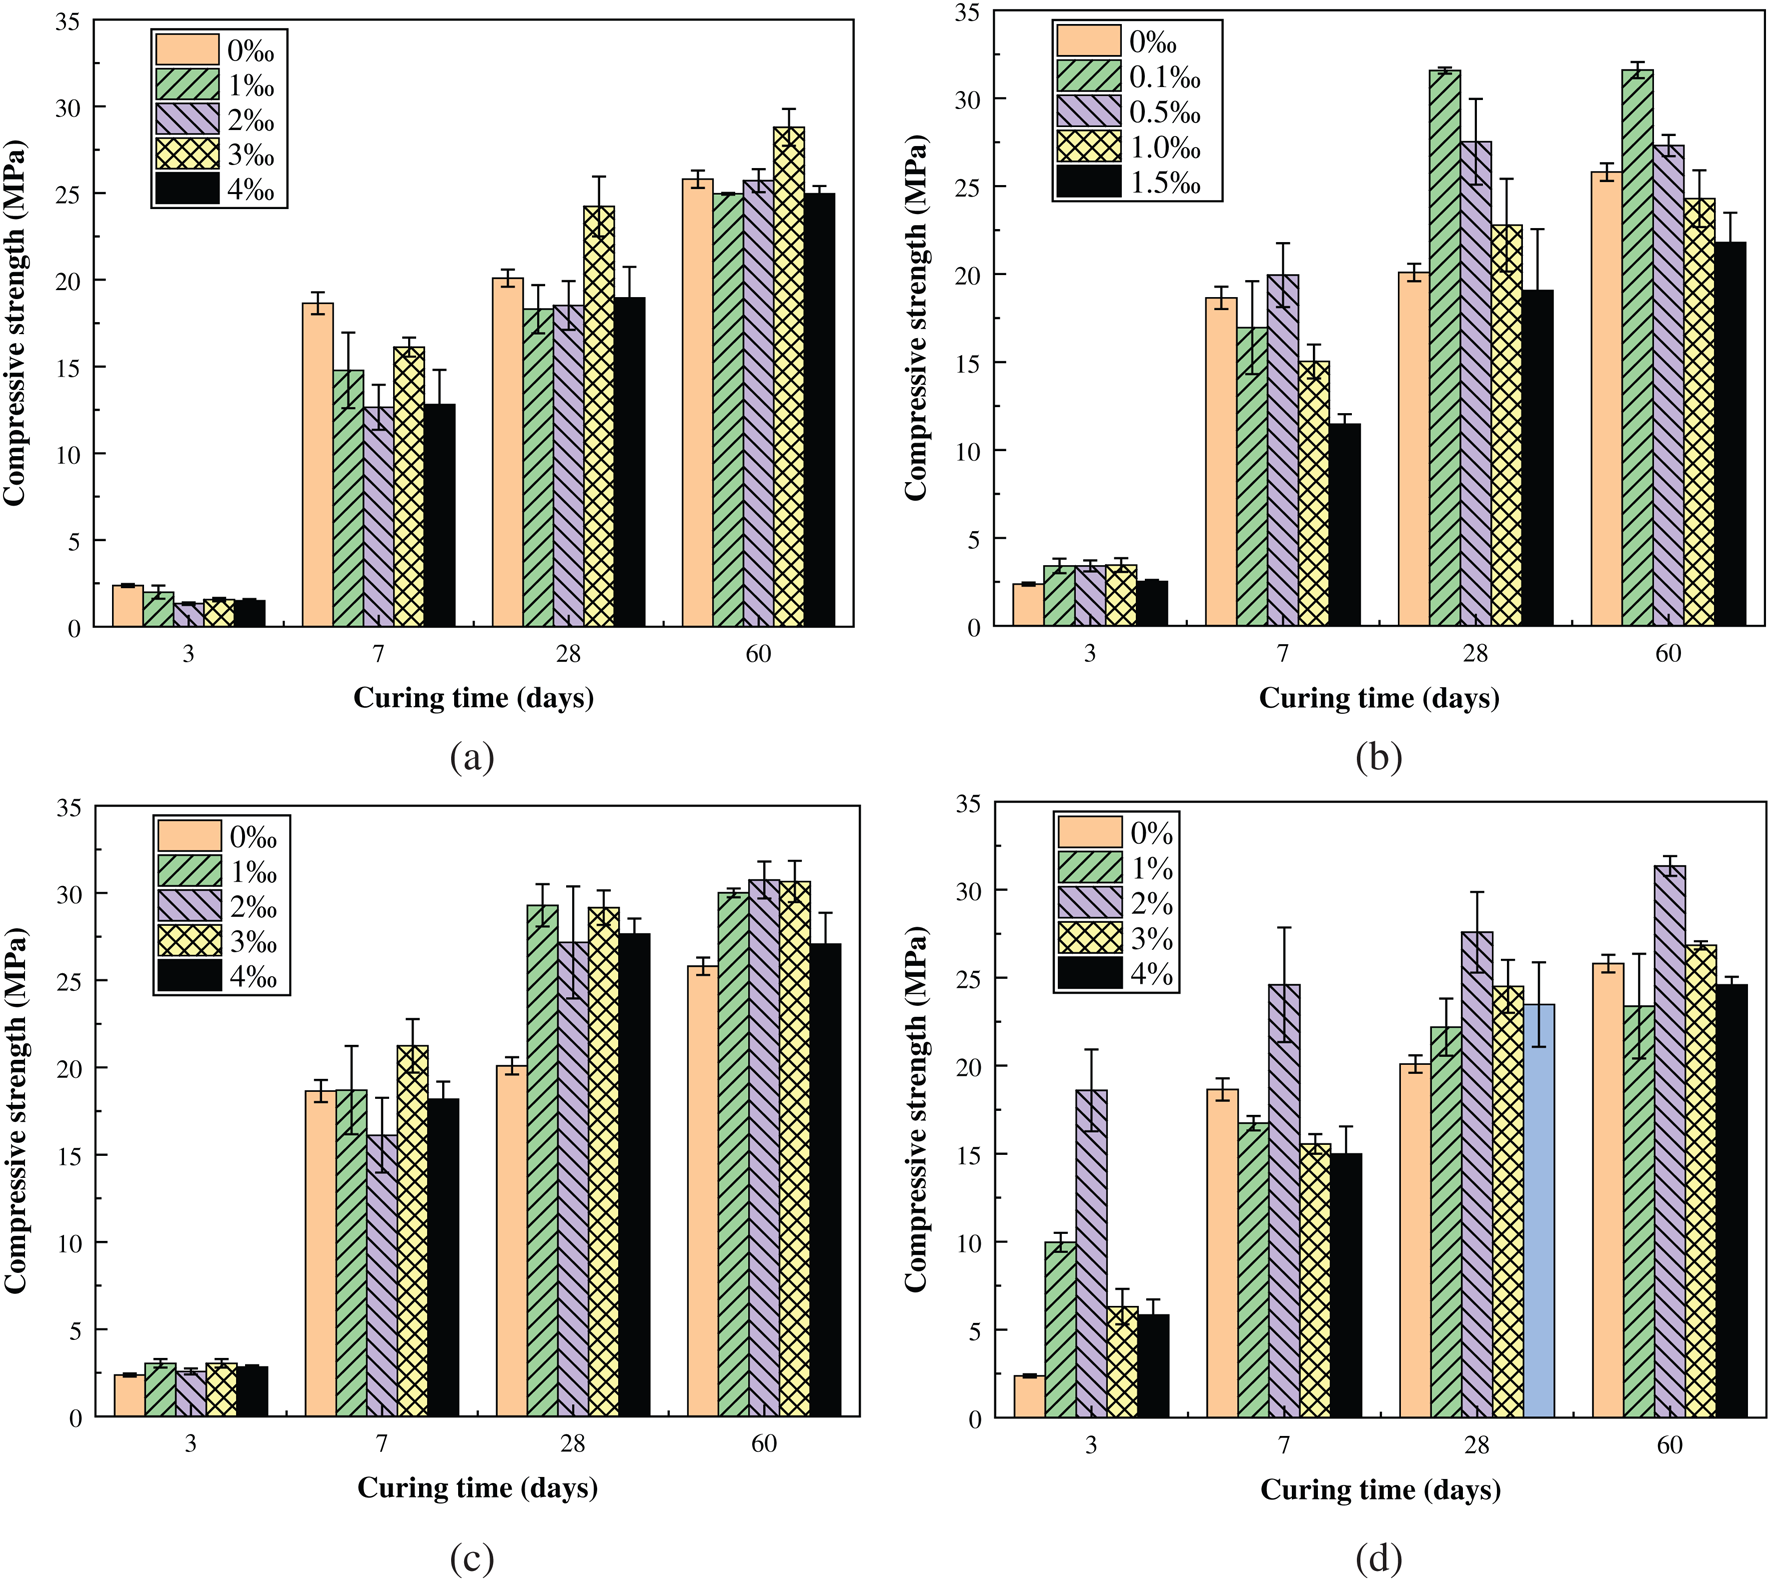
Figure 5: Relationship between the compressive strength of the sample and the dosage of additive. (a) Influence of HPMC dosage. (b) Influence of PAA dosage. (c) Influence of LF dosage. (d) Influence of SA dosage
It can be seen from Fig. 5(b) that the addition of PAA has a more significant effect on improving the compressive strength of the sample than HPMC. In particular, the effect is most obvious when the addition dosage is 0.1‰. The compressive strength of the sample after 28 days of standard curing had exceeded 30 MPa, and the increase rate has exceeded 22%.
Similar to PAA, LF can further increased the compressive strength of the sample. However, the compressive strength of the sample did not seem to change much when the dosage of LF is increased. According to the change trend of compressive strength in Fig. 5(c), it can be seen that the optimal dosage of LF is 3‰.
Different from the previous three additives, SA has a greater effect on the compressive strength of the sample, especially the early strength of the sample. In particular, when the dosage was 2%, the sample had the highest early compressive strength, and the compressive strength of standard cured for 3 days reached 18.6 MPa, which was nearly 7 times higher than the sample without SA. In addition, under different SA dosage, the compressive strength values of the samples were also quite different. Except for the 2% dosage, the effect of SA at other levels on the compressive strength of the sample is not obvious.
Fig. 6 shows the volume expansion rate trends of the three types of samples: basic formula samples, samples with 5% enhancer MSF, and other samples containing the optimal dosage of additives. It can be clearly seen from the figure that there are three types of change trends. The first type is the sample added with 3‰ HPMC. The volume was relatively stable, and the expansion rate was slightly reduced, and then remained basically unchanged. The second type is the sample that shrinks first and then expands slowly until it was stable. The third type is the sample with 2% SA added, whose volume has been expanding. The first and second types of samples exhibited volume shrinkage in the early period, which is the drying shrinkage of the sample. In the later period, it may be that CaSO4 • 2H2O in PG was more participated in the hydration reaction, and more hydrated calciumsulfoaluminate (Commonly known as: ettringite) was generated, which caused the sample volume to expand. In particular, the swelling rate of the sample mixed with 3‰ HPMC had the smallest change. The main reason is that, on the one hand, HPMC has good water retention, which can reduce the evaporation of moisture in the sample and reduce the degree of drying shrinkage. On the other hand, HPMC has the effect of delaying the hydration reaction, which maked the ettringite production rate slow down, and ettringite absorbed water and swelled, which maked up for the shrinkage of the sample caused by drying [23,33,34]. However, the samples with 2% SA began to swell after demoulded. The reason may be that SA accelerated the hydration reaction, which caused a large amount of ettringite in the early stage [35–37].
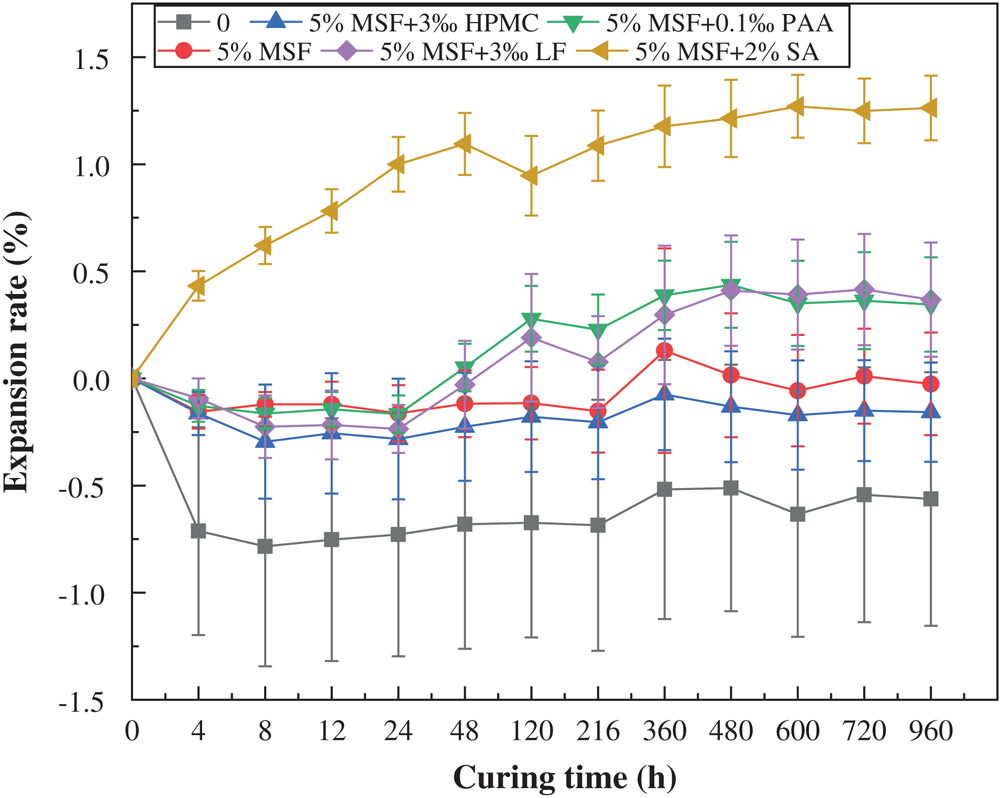
Figure 6: Effect of different additives on sample volume
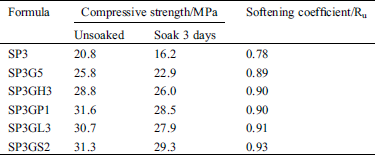
It can be seen from Tab. 3 that the sample made from the SP3 has the worst water resistance due to its poor structure and low compressive strength. After 3 days of immersion in water, the compressive strength is only 16.2 MPa and the softening coefficient is the smallest, only 0.78. The other five formulations with added enhancers had higher softening coefficients than the base formulation after 3 days of immersion in water. Among them, the softening coefficients of SP3G5, SP3GH3, SP3GP1 and SP3GL3 samples remained basically around 0.9. The samples made with SP3GS2 immersed in water for 3 days, the compressive strength reached 29.3 MPa, and the softening coefficient was 0.93, which was higher than other samples. This may be related to the change in the pore size in the sample caused by the addition of sodium aluminate, which results in the sample becoming denser and preventing the water molecules from entering the sample [35].
Table 3: Softening coefficients of different formulas
Based on the modification effect of the best basic formula SP3, we found that formula SP3GH3 had the best overall performance. On this basis, we analyzed the formula SP3 and formula SP3GH3 through XRD pattern, hydration heat release curve and micro-morphology, and studied the principle of stabilized material SP3GH3 performance improvement.
It can be seen from the XRD pattern in Fig. 7 that the main substance of the sample was PG, the reaction of the sample was not strong in the early stage. After standard curing for 28 days, the hydration reaction of the sample tends to be stable. The main products of sample SP3 and sample SP3GH3 include calcium carbonate and aluminum carbonate hydrate, ettringite, calcite and some unreacted gypsum. Among them, calcium, aluminum and other hydration products are the main source of the stable structure of the sample [34,35].
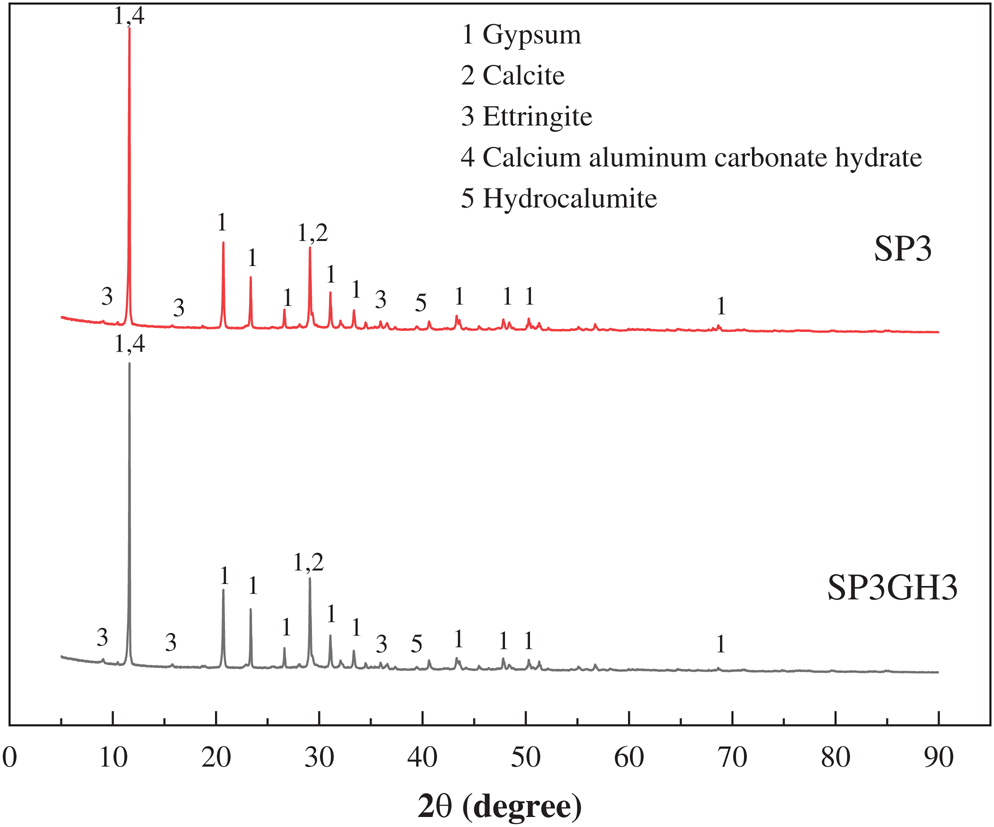
Figure 7: XRD patterns of SP3 and SP3GH3 (28 days)
Fig. 8 is a graph showing changes in the exothermic curves of sample SP3 and sample SP3GH3. On the one hand, it can be seen that the sample SP3GH3 produces more heat than sample SP3, and it can be considered that the addition of 5% enhancer MSF can promote the degree of hydration of the sample. On the other hand, the exothermic time period of sample SP3GH3 is longer than that of sample SP3. It may be that HPMC hinders the free flow of water molecules and reduces the hydration reaction rate [29,30].
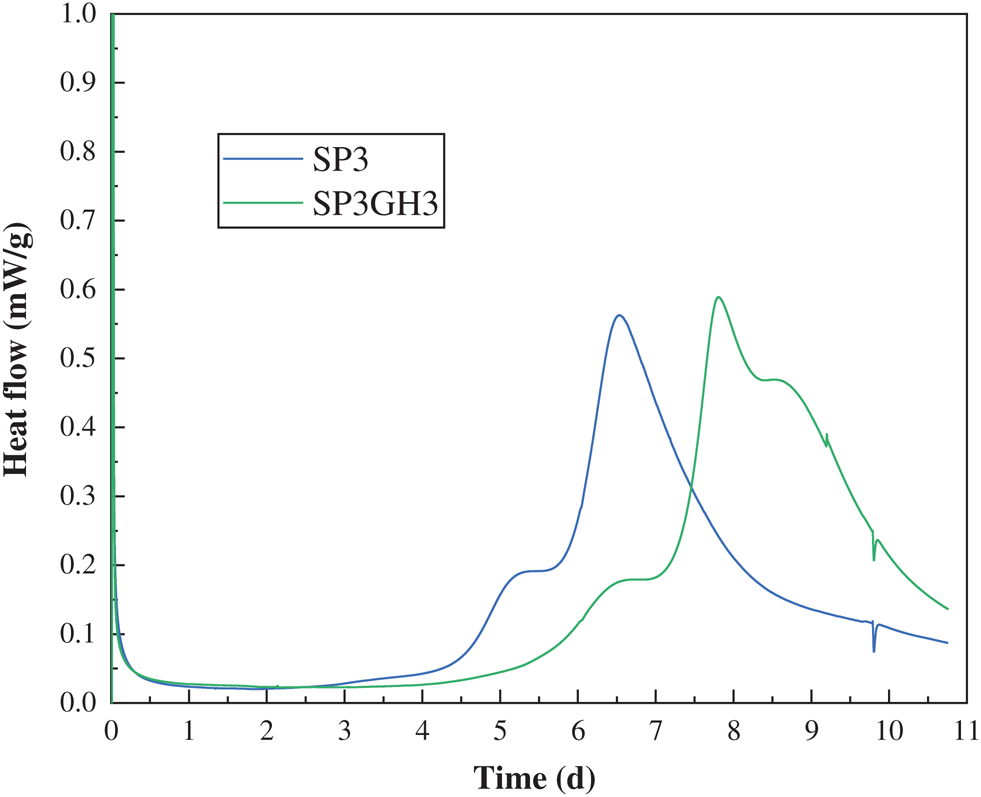
Figure 8: Heat flow curves of SP3 and SP3GH3
Sample SP3 has fewer active ingredients and a lower degree of early hydration. It can be seen from Fig. 9a that there are more large particles of PG that did not participate in the reaction. Sample SP3G5 was added with the enhancer MSF and the active ingredient SiO2 was introduced to increase the degree of hydration reaction and the amount of large-granular PG was reduced (as shown in Fig. 9b). Figs. 9c and 9d are the morphology of sample SP3G5 and sample SP3GH3 after 28 days of standard curing. It can be seen that the SP3GH3 sample has more hydration product C-S-H gel and less acicular ettringite. On the one hand, it may be that MgO agglomerated ettringite to make the structure close-knit [38]. On the other hand, it may be that HPMC hindered the free movement of water molecules and sulfate ions, and hinders the production of ettringite [23,39,40].
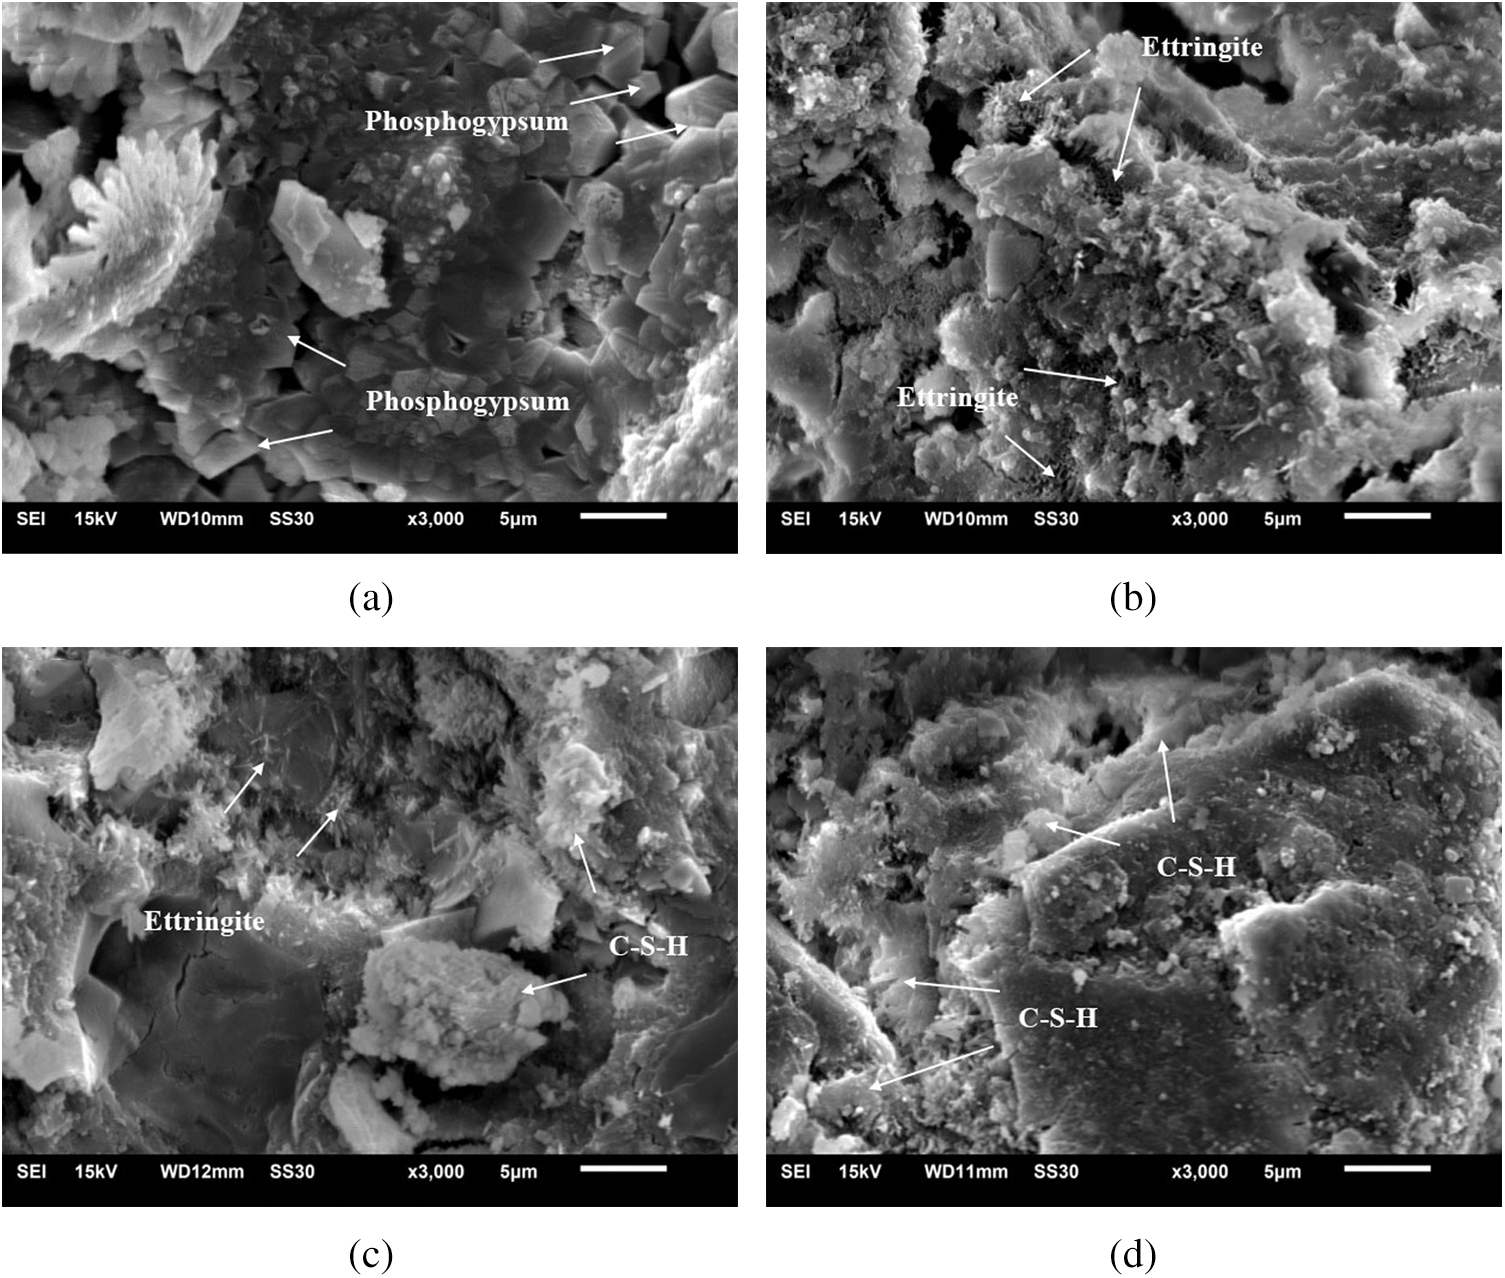
Figure 9: SEM images of the samples: (a) SP3 cured for 3 days; (b) SP3G5 cured for 3 days; (c) SP3G5 cured for 28 days; (d) SP3GH3 cured for 28 days
4 Evaluation of Soil Solidification Performance
After comprehensive evaluation of the compressive strength and volume stability of pure pulp samples, the SP3GH3 (Best basic formula + 5% MSF + 3‰ HPMC) with high compressive strength, good water resistance and the most stable volume was identified as the best formula.
In order to test the stabilizing effect of the stabilized material on the soil, we selected representative formulas: basic formula SP3, modified formula SP3GH3 and traditional cement-lime formula, and then conducted the stability test on the roadbed silty soil. Here we consider that, on the one hand, the cost of cement, lime and other raw materials is relatively high, which is not suitable for large-scale application in road construction. On the other hand, if the amount of lime in the subgrade is too high, the subgrade will expand [41,42]. Therefore, after comprehensive consideration, the dosage of cement and lime in the soil is determined to be 2% and 5% respectively. The test results of the samples are shown in Fig. 10 and Tab. 4.
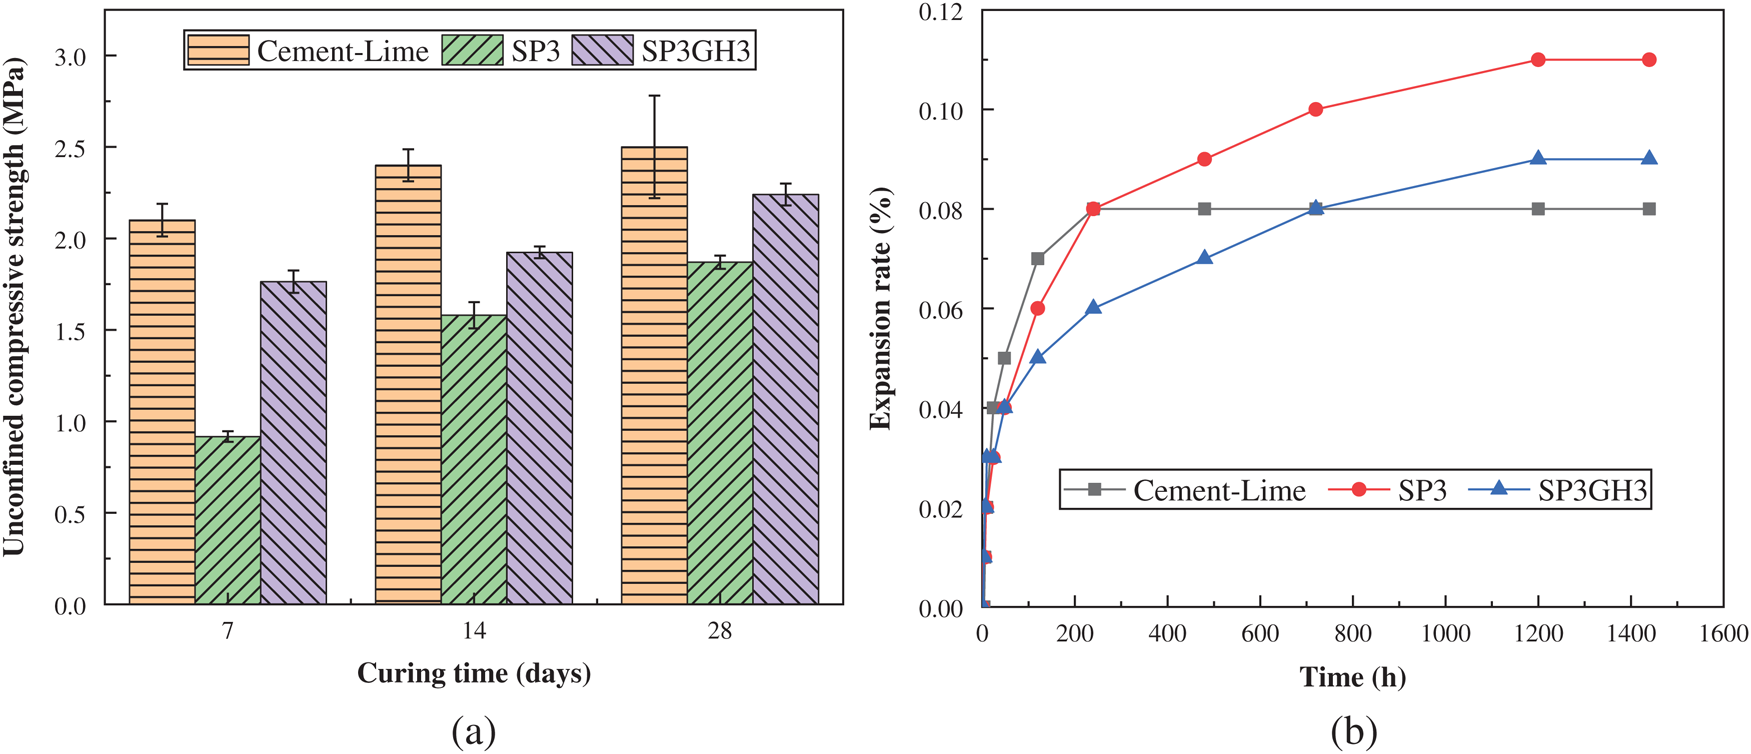
Figure 10: UCS and expansion rate of solidified soil. (a) UCS of samples at different ages. (b) Variation trend of samples expansion rate
Table 4: Water stability of soil after curing with different stabilized material
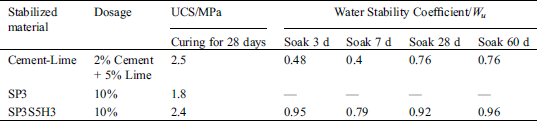
It can be found from Fig. 10a that the UCS of the soil samples solidified with the SP3GH3 had been significantly improved compared to the samples solidified with the SP3. After curing for 3 days, the compressive strength of the samples exceeds 1.7 MPa, an increase of more than 84%. After 28 days of curing, it reached 2.4 MPa, which is basically close to the strength of the cement-lime solidified sample during the same period. At the same time, it can also be found in Fig. 10b that the expansion rate of the sample solidified with SP3GH3 has a significantly lower expansion rate than the sample solidified with SP3. Especially in the early period, the expansion rate was even much lower than the sample cured with cement-lime. The test results in Tab. 4 mainly reflect the water resistance of the samples. It can be seen that the samples cured with SP3GH3 had the best water resistance, and the water stability coefficient remained basically above 0.79. However, the soil sample stabilized by the SP3 has no basic regular morphology after immersed in water for 3 days, and the UCS was basically equal to 0. This may be because the degree of hydration reaction in SP3 was small, and the amount of calcium aluminum hydrate with a stable structure is too little to consolidate the soil. On the other hand, the SP3 contains a large amount of PG, which will cause the production of ettringite, and the expansion of ettringite after water absorption will be detrimental to the stability of the sample structure [23,43,44].
Optimize and screen the raw materials of the formula, determined the optimal blending amount of the main basic materials and other various additives. Then the compressive strength, water resistance, volume stability, microscopic analysis and soil stabilization effect of the optimized formula were evaluated and draw the following conclusions:
Adding the optimal 5% enhancer MSF can increase the degree of early hydration reaction in the sample and effectively reduce the retarding effect of PG. The 3-day compressive strength of the sample modified by MSF exceeded 2.3 MPa, and the compressive strength increased by more than 170% compared with the sample without MSF added during the same period.
HPMC can delay the loss of water in the sample and reduce the drying shrinkage of the sample. The proper amount of HPMC delayed the hydration reaction and reduced the speed of ettringite formation. Eventually, the swelling caused by ettringite absorbs water to compensate for the shrinkage caused by drying.
In terms of comprehensive compressive strength, water resistance and volume stability, the comprehensive performance of the basic formula compounded with 5% MSF and 3‰ HPMC was the best. The soil stabilization effect, especially the water resistance, has been greatly improved. After 60 days of immersion in water, the water stability coefficient is as high as 0.96, which is higher than the 0.76 of the traditional cement-lime stabilized soil sample during the same period.
The main raw materials of SP3GH3 are industrial by-products such as PG, which are inexpensive and have many sources. Compared with cement and lime, it has greater advantages in performance and application cost. In the future, we will study and develop a general dosage prediction formula to provide technical guarantee for the large-scale application of phosphogypsum-based soil stabilizing materials.
Funding Statement: This work was supported by the Jiangsu Provincial Science and Technology Department’s Social Development-Major Science and Technology Demonstration Project (Grant No. BE2018697), the Jiangsu Provincial Science and Technology Department Social Development Project (Grant No. BE2017704) and the Scientific Research Project of the Suqian Municipal Transportation Bureau.
Conflicts of Interest: The authors declare that they have no conflicts of interest to report regarding the present study.
1. Gijbels, K., Lacobescu, R. I., Pontikes, Y., Vandevenne, N., Schreurs, S. et al. (2018). Radon immobilization potential of alkali-activated materials containing ground granulated blast furnace slag and phosphogypsum. Construction and Building Materials, 184, 68–75. DOI 10.1016/j.conbuildmat.2018.06.162. [Google Scholar] [CrossRef]
2. Min, C., Li, X., He, S., Zhou, S., Zhou, Y. et al. (2019). Effect of mixing time on the properties of phosphogypsum-based cemented backfill. Construction and Building Materials, 210, 564–573. DOI 10.1016/j.conbuildmat.2019.03.187. [Google Scholar] [CrossRef]
3. Nizevicene, D., Vaiciukyniene, D., Michalik, B., Bonczyk, M., Vaitkevicius, V. et al. (2018). The treatment of phosphogypsum with zeolite to use it in binding material. Construction and Building Materials, 180, 134–142. DOI 10.1016/j.conbuildmat.2018.05.208. [Google Scholar] [CrossRef]
4. Rashad, A. M. (2017). Phosphogypsum as a construction material. Journal of Cleaner Production, 166, 732–743. DOI 10.1016/j.jclepro.2017.08.049. [Google Scholar] [CrossRef]
5. Tian, T., Yan, Y., Hu, Z., Xu, Y., Chen, Y. et al. (2016). Utilization of original phosphogypsum for the preparation of foam concrete. Construction and Building Materials, 115, 143–152. DOI 10.1016/j.conbuildmat.2016.04.028. [Google Scholar] [CrossRef]
6. Huang, Y., Qian, J., Liu, C., Liu, N., Shen, Y. et al. (2017). Influence of phosphorus impurities on the performances of calcium sulfoaluminate cement. Construction and Building Materials, 149, 37–44. DOI 10.1016/j.conbuildmat.2017.05.028. [Google Scholar] [CrossRef]
7. Zhou, J., Yu, D., Shu, Z., Li, T., Chen, Y. et al. (2014). A novel two-step hydration process of preparing cement-free non-fired bricks from waste phosphogypsum. Construction and Building Materials, 73, 222–228. DOI 10.1016/j.conbuildmat.2014.09.075. [Google Scholar] [CrossRef]
8. Huang, Y., Qian, J., Lu, L., Zhang, W., Wang, S. et al. (2019). Phosphogypsum as a component of calcium sulfoaluminate cement: hazardous elements immobilization, radioactivity and performances. Journal of Cleaner Production, 248, 119287. DOI 10.1016/j.jclepro.2019.119287. [Google Scholar] [CrossRef]
9. Taher, M. A. (2007). Influence of thermally treated phosphogypsum on the properties of Portland slag cement. Resources, Conservation and Recycling, 52(1), 28–38. DOI 10.1016/j.resconrec.2007.01.008. [Google Scholar] [CrossRef]
10. Da Costa, C. H. M., Crusciol, C. A. C. (2016). Long-term effects of lime and phosphogypsum application on tropical no-till soybean-oat-sorghum rotation and soil chemical properties. European Journal of Agronomy, 74, 119–132. DOI 10.1016/j.eja.2015.12.001. [Google Scholar] [CrossRef]
11. Degirmenci, N. (2008). Utilization of phosphogypsum as raw and calcined material in manufacturing of building products. Construction and Building Materials, 22(8), 1857–1862. DOI 10.1016/j.conbuildmat.2007.04.024. [Google Scholar] [CrossRef]
12. Zhou, J., Zhang, Y., Shu, Z., Wang, Y., Yakubu, Y. et al. (2019). Enhancing waterproof performance of phosphogypsum non-fired ceramics by coating silane-coupled unsaturated polyester resin. Materials Letters, 252, 52–55. DOI 10.1016/j.matlet.2019.05.105. [Google Scholar] [CrossRef]
13. Lian, G., Wang, B., Lee, X., Li, L., Liu, T. et al. (2019). Enhanced removal of hexavalent chromium by engineered biochar composite fabricated from phosphogypsum and distillers grains. Science of the Total Environment, 697, 134119. DOI 10.1016/j.scitotenv.2019.134119. [Google Scholar] [CrossRef]
14. Nizevičienė, D., Vaičiukynienė, D., Kielė, A., Vaičiukynas, V. (2018). Mechanical activation on phosphogypsum: hydrosodalite system. Waste and Biomass Valorization, 10(11), 3485–3491. [Google Scholar]
15. Liu, W. F., Wang, Z. M., Hou, H. M. (2018). Comparative study on legislation of utilization of construction wastes as resources in china and abroad. IOP Conference Series: Earth and Environmental Science, 153, 062046. DOI 10.1088/1755-1315/153/6/062046. [Google Scholar] [CrossRef]
16. Li, W., Gao, S. (2018). Prospective on energy related carbon emissions peak integrating optimized intelligent algorithm with dry process technique application for China’s cement industry. Energy, 165, 33–54. DOI 10.1016/j.energy.2018.09.152. [Google Scholar] [CrossRef]
17. Shan, Y., Liu, Z., Guan, D. (2016). CO2 emissions from China’s lime industry. Applied Energy, 166, 245–252. DOI 10.1016/j.apenergy.2015.04.091. [Google Scholar] [CrossRef]
18. Zhang, X., Wu, L., Zhang, R., Deng, S., Zhang, Y. et al. (2013). Evaluating the relationships among economic growth, energy consumption, air emissions and air environmental protection investment in China. Renewable & Sustainable Energy Reviews, 18, 259–270. DOI 10.1016/j.rser.2012.10.029. [Google Scholar] [CrossRef]
19. Ji, J., Zou, Z., Tian, Y. (2019). Energy and economic impacts of China’s 2016 economic investment plan for transport infrastructure construction: an input-output path analysis. Journal of Cleaner Production, 238, 117761. DOI 10.1016/j.jclepro.2019.117761. [Google Scholar] [CrossRef]
20. Illera, V., Garrido, F., Serrano, S., Garcia-Gonzalez, M. T. (2004). Immobilization of the heavy metals Cd, Cu and Pb in an acid soil amended with gypsum- and lime-rich industrial by-products. European Journal of Soil Science, 55(1), 135–145. DOI 10.1046/j.1365-2389.2003.00583.x. [Google Scholar] [CrossRef]
21. Aguilar-Carrillo, J., Garrido, F., Barrios, L., Garcia-Gonzalez, M. T. (2006). Sorption of As, Cd and T1 as influenced by industrial by-products applied to an acidic soil: equilibrium and kinetic experiments. Chemosphere, 65(11), 2377–2287. DOI 10.1016/j.chemosphere.2006.04.092. [Google Scholar] [CrossRef]
22. Shen, W., Zhou, M., Ma, W., Hu, J., Cai, Z. (2009). Investigation on the application of steel slag-fly ash-phosphogypsum solidified material as road base material. Journal of Hazardous Materials, 164(1), 99–104. DOI 10.1016/j.jhazmat.2008.07.125. [Google Scholar] [CrossRef]
23. Ding, J., Shi, M., Liu, W., Wan, X. (2019). Failure of roadway subbase induced by overuse of phosphogypsum. Journal of Performance of Constructed Facilities, 33(2), 04019013. DOI 10.1061/(ASCE)CF.1943-5509.0001278. [Google Scholar] [CrossRef]
24. Taylor, H. F. W., Famy, C., Scrivener, K. L. (2001). Delayed ettringite formation. Cement and Concrete Research, 31(5), 683–693. DOI 10.1016/S0008-8846(01)00466-5. [Google Scholar] [CrossRef]
25. Mashifana, T. P., Okonta, F. N., Ntuli, F. (2018). Geotechnical properties and microstructure of lime-fly ash-phosphogypsum-stabilized soil. Advances in Civil Engineering, 2018(5), 3640868. DOI 10.1155/2018/3640868. [Google Scholar] [CrossRef]
26. Ding, J., Shi, M., Liu, W., Hong, Z. (2017). In situ stabilization of problematic mixtures in a failed roadway subbase. Journal of Performance of Constructed Facilities, 31(3), 04017002. DOI 10.1061/(ASCE)CF.1943-5509.0000966. [Google Scholar] [CrossRef]
27. Hua, S., Wang, K., Yao, X. (2016). Developing high performance phosphogypsum-based cementitious materials for oil-well cementing through a step-by-step optimization method. Cement and Concrete Composites, 72, 299–308. DOI 10.1016/j.cemconcomp.2016.05.017. [Google Scholar] [CrossRef]
28. Yao, K., Chen, Q. S., Xiao, H. W., Liu, Y., Lee, F. H. (2020). Small-strain shear modulus of cement-treated marine clay. Journal of Materials in Civil Engineering, 32(6), 04020114. DOI 10.1061/(ASCE)MT.1943-5533.0003153. [Google Scholar] [CrossRef]
29. Yao, K., Li, N., Chen, D. H., Wang, W. (2019). Generalized hyperbolic formula capturing curing period effect on strength and stiffness of cemented clay. Construction and Building Materials, 199, 63–71. DOI 10.1016/j.conbuildmat.2018.11.288. [Google Scholar] [CrossRef]
30. Potgieter, J. H., Potgieter, S. S., McCrindle, R. I., Strydom, C. A. (2003). An investigation into the effect of various chemical and physical treatments of a South African phosphogypsum to render it suitable as a set retarder for cement. Cement and Concrete Research, 33(8), 1223–1227. DOI 10.1016/S0008-8846(03)00036-X. [Google Scholar] [CrossRef]
31. Meng, W., Kumar, A., Khayat, K. H. (2019). Effect of silica fume and slump-retaining polycarboxylate-based dispersant on the development of properties of portland cement paste. Cement and Concrete Composites, 99, 181–190. DOI 10.1016/j.cemconcomp.2019.03.021. [Google Scholar] [CrossRef]
32. Xu, X., Lin, X., Pan, X., Ji, T., Liang, Y. et al. (2020). Influence of silica fume on the setting time and mechanical properties of a new magnesium phosphate cement. Construction and Building Materials, 235, 117544. DOI 10.1016/j.conbuildmat.2019.117544. [Google Scholar] [CrossRef]
33. Su, L., Ma, B., Jian, S., Zhao, Z., Liu, M. (2013). Hydration heat effect of cement pastes modified with hydroxypropyl methyl cellulose ether and expanded perlite. Journal of Wuhan University of Technology-Mater. Sci. Ed., 28(1), 122–126. DOI 10.1007/s11595-013-0652-2. [Google Scholar] [CrossRef]
34. Ma, B., Su, L., Jian, S., Song, X. (2012). Early stage hydration mechanism of cellulose ether modified thin layer cement pastes. Journal of Wuhan University of Technology-Mater. Sci. Ed., 27(6), 1172–1176. DOI 10.1007/s11595-012-0624-y. [Google Scholar] [CrossRef]
35. Han, J., Wang, K., Shi, J., Wang, Y. (2014). Influence of sodium aluminate on cement hydration and concrete properties. Construction and Building Materials, 64, 342–349. DOI 10.1016/j.conbuildmat.2014.04.089. [Google Scholar] [CrossRef]
36. Zhang, W., Yao, X., Yang, T., Liu, C., Zhang, Z. (2018). Increasing mechanical strength and acid resistance of geopolymers by incorporating different siliceous materials. Construction and Building Materials, 175, 411–421. DOI 10.1016/j.conbuildmat.2018.03.195. [Google Scholar] [CrossRef]
37. Lawrence, C. D. (1995). Mortar expansions due to delayed ettringite formation. Effects of curing period and temperature. Cement and Concrete Research, 25(4), 903–914. DOI 10.1016/0008-8846(95)00081-M. [Google Scholar] [CrossRef]
38. Yao, K., Wang, W., Li, N., Zhang, C., Wang, L. X. (2019). Investigation on strength and microstructure characteristics of nano-MgO admixed with cemented soft soil. Construction and Building Materials, 206, 160–168. DOI 10.1016/j.conbuildmat.2019.01.221. [Google Scholar] [CrossRef]
39. Xu, X. Y., Lin, X. J., Pan, X. X., Ji, T., Liang, Y. N. et al. (2020). Influence of silica fume on the setting time and mechanical properties of a new magnesium phosphate cement. Construction and Building Materials, 235, 117544. DOI 10.1016/j.conbuildmat.2019.117544. [Google Scholar] [CrossRef]
40. Meng, W. N., Kumar, A., Khayat, K. H. (2019). Effect of silica fume and slump-retaining polycarboxylate-based dispersant on the development of properties of portland cement paste. Cement & Concrete Composites, 99, 181–190. DOI 10.1016/j.cemconcomp.2019.03.021. [Google Scholar] [CrossRef]
41. Wang, L., Roy, A., Seals, R. K., Byerly, Z. (2005). Suppression of sulfate attack on a stabilized soil. Journal of the American Ceramic Society, 88(6), 1600–1606. DOI 10.1111/j.1551-2916.2005.00304.x. [Google Scholar] [CrossRef]
42. de Melo Ferreira, S. R., de Paiva, S. C.,Oliveira Morais, J. J., Viana, R. B. (2017). Expansion evaluation of a soil of the municipality of Paulista-PE improved with lime. Materia-Rio De Janeiro, 22, e11930. [Google Scholar]
43. Kuryatnyk, T., Luz, C. A. D., Ambroise, J., Pera, J. (2008). Valorization of phosphogypsum as hydraulic binder. Journal of Hazardous Materials, 160(2), 681–687. DOI 10.1016/j.jhazmat.2008.03.014. [Google Scholar] [CrossRef]
44. Xu, F., Wei, H., Qian, W., Chen, X., Xu, T. et al. (2020). Experimental investigation on replacing cement by sintered limestone ash from the steelmaking industry for cement-stabilized soil: engineering performances and micro-scale analysis. Construction and Building Materials, 235, 117425. DOI 10.1016/j.conbuildmat.2019.117425. [Google Scholar] [CrossRef]
 | This work is licensed under a Creative Commons Attribution 4.0 International License, which permits unrestricted use, distribution, and reproduction in any medium, provided the original work is properly cited. |