Materials
| Journal of Renewable Materials |
DOI: 10.32604/jrm.2021.016387
ARTICLE
Influence of Different Forest Management Techniques on the Quality of Wood
1Department of Forestry, Saint Petersburg State Forest Engineering University named after S. M. Kirov, Saint-Petersburg, 194021, Russian
2Department of Forest Crops, Breeding and Dendrology, Bratsk State University, Bratsk, 665709, Russian
3Department of Transport and Technological Means and Equipment Forestry Complex, Mytischi Branch of Bauman Moscow State Technical University, Mytischi, 115533, Russian
4Department of Technologies and Equipment of Timber Industry, Ural State Forest Engineering University, Yekaterinburg, 620100, Russian
5Department of Applied Mathematics and Cybernetics, Petrozavodsk State University, Petrozavodsk, 185910, Russian
6Department of Technology and Equipment for Forestry Production, Mytischi Branch of Bauman Moscow State Technical University, Mytischi, 141005, Russian
7Department of Technology and Equipment of Forest Complex, Arctic State Agrotechnological University, Yakutsk, 677007, Russian
*Corresponding Author: Olga Grigoreva. Email: olgagrigoreva96@rambler.ru
Received: 02 March 2021; Accepted: 06 April 2021
Abstract: The issue of accelerated forestry plantation with high-quality wood using the best soils in terms of productivity, fertilizers, and intensive treatment has become quite relevant due to increased demand for forestry products and higher requirements for environmentally friendly use of forest resources. This paper presents the results of a study on the impact of various techniques for treating coniferous plantations, including thinning, fertilization, and herbicide processing, on wood quality key indicators. The paper examined the wood density, correlation of early and late wood zones, and the cell wall thickness for 38-year-old pine trees grown on the sample plots of Siversky leskhoz (Leningrad region, Gatchinskiy district) at different treatment and density control techniques. It has been established that the highest basis density of wood corresponds to the samples grown at the density variant of 1 t/ha and double herbicides treatment, and the lowest basis density value was recorded at the option of 4 t/ha with combined treatment. It has been shown that the increase of width index for early wood is influenced by the lower density of 1 t/ha and one-time herbicide treatment, for late wood – by the lower density of 1 t/ha and repeated treatment with herbicides. The increase in average cell wall thickness for early and late wood is observed when the density increases up to 4 t/ha and double herbicides treatment. The results obtained provide a valuable scientific contribution to general forestry knowledge and have practical value in plantation forestry.
Keywords: Agroforestry; ecosystem services; plantation forestry; wood structure; planting density
The modern forest management pattern does not fully meet the requirement of environmentally safe use of forest resources. The balance between wood harvesting and forest regeneration is broken. The allowable volume of logging defined for the territory of the wood production site as a whole is felled down in the area with limited transport access, thus, creating an ecologically stressful situation [1]. The solution may be an intensification of forest resources reproduction, namely, plantation forestry using the best land in terms of productivity, fertilizers, and intensive treatment that, among others, include certified chemicals [2].
Plantation forestry is one of the silviculture areas aimed at accelerated production of higher wood volumes on specially established crop plantations. Accelerated growth of coniferous wood at plantations is currently of great interest for both the forestry practices and the needs of wood consumers [3]. Getting the necessary volume of wood in a shorter time compared to natural stands and the possibility of placing plantations near the wood consumers makes them a profitable forestry activity. Also, the pulp and paper production sphere is undoubtedly interested that the increase in the volume of wood is accompanied by an increase in weight [4].
The need for timber of certain species on the territory of North-West Russia determines the necessity to create target forest plantations [5]. At the same time, forest crops are grown in places where full natural regeneration is impossible or when it is necessary to receive wood in a shorter time.
Plantation forestry may become the principal way of forest resource production in regions with intensive forestry and developed infrastructure, including wood industry enterprises. Experiments with thinning treatment of pine and deciduous spruce stands planted more than 50 years ago, new experiments with thinning treatment and simultaneous fertilization, and the experiments with Pskov Local Treatment Facilities with intensive treatment of pine and spruce young growths allowed specifying the recommendations for sustainable forest management and direct them to the modern problem solution using newly developed techniques [6,7]. These studies have shown that trees of different sizes react differently to fertilizers. According to the data obtained, thin trees in a 100-year-old stand were the most responsive to fertilizers. Their growth increment rate increased by 2…3 years after application, and the duration of the fertilization effect on diameter growth was 12…13 years. The middle-class trees reacted positively to the growth increment. Large trees reacted very poorly to fertilizers. Thin and medium-sized trees showed an additional growth increment of 130–135% compared to growth increment on control plots.
Following the experimental data in the works of Miller [8] and Zeller et al. [9], positive changes in the structure of annual rings was observed in coniferous wood, which led to its improved physical and mechanical properties. In general, the basis density of the wood at the experimental plots is above the average for the area under study. Thus, in the mixed treated stands, the basis wood density of both spruce and pine trees tends to increase. In the growing stands after mixed treatment, the basis wood density of spruce increases, and that of pine trees slightly decreases. Complex maintenance allows receiving sawing assortments of higher quality and pulpwood, which are different in terms of an end product output and allow saving time and technological process consumables on the manufacture of various types of paper [10,11]. By the age of logging the mature trees after complex maintenance, highly productive tree stands with the reserve exceeding the control sections were formed at the investigated plots. After the complex treatment, the share of large wood in the commodity structure of growing stock increased.
Complex care organically combines the benefits of thinning treatment and fertilization in the forest. Interest in complex care has increased even more due to the development of accelerated targeted forest regeneration systems. The developed logging and complex care programs, if properly applied, allow achieving the economically necessary effect at minimum costs [12,13]. Fertilizers are considered necessary element of the targeted forestation system as they provide the possibility to increase the productivity of stands and the yield of valuable commodity products.
The issue of the thinning effect on forest productivity, which is closely related to the formation of wood and its quality, is still under discussion. The efficiency of thinning is mainly estimated by quantitative or total stand productivity [14]. The existing approaches to establishing the parameters and regimes of thinning treatment are mostly based on the assortment structure of growing stock but do not take into account the quality of wood. Thus, the target forestation is out of consideration in this case. More suitable is the term qualitative productivity of trees and stands as a whole, as thinning treatment contributes to the formation of wood with thicker trachea walls, higher void content, and lower porosity [15]. There is a correlation between tracheal length on density, i.e., the more intense the thinning, the longer the fibers. The increase in cell wall thickness with constant cavity diameter contributes to the increase in dense wood mass.
The changes in the anatomic structure of wood are known to be determined by the age of planting under treatment, as well as the intensity and time remoteness of the maintenance procedures [16]. Wood density also depends on these factors. There is a general connection between the density of the growing wood and the content of late wood. Density is not always closely related to the width of the annual layer. Wall thickness and tracheal length, the porosity of the late zone, and surface and bulk porosity of the wood have the strongest influence on density [16,17]. A significant influence of the diameter class of trees on wood density has been noted [18]. The indices of strength and deformation properties are well correlated with density, most closely with the ultimate compressive strength and static bending depending on the age of plantings and density.
Due to the removal of secondary species trees that have lagged in growth and are defective, increasing the size of each growing tree improves the commodity structure of wood. The question of the quality of grown wood has not been studied appropriately yet. In some cases, the ratio between early and late parts of a year’s layer of wood in pine stands changes little after thinning, but still for the better, i.e., in favor of late wood. In the typical green pine stands, not only the width of the annual rings increases after a density decrease but also the width of the late part to 0.6–1.25 mm, i.e., the optimal width at which the wood has better physical and mechanical properties [19,20].
In the meantime, improving the quality of grown wood by the time of final felling significantly increases its attractiveness for consumers, i.e., wood processing companies of various profiles [12,21]. Thus, adhering to the specifics of macro- and microscopic anatomic wood elements and their relation with physical and mechanical properties allows growing wood of the target quality. The purpose of this work was to study the impact of various treatment options for coniferous plantations, including thinning, fertilization, and herbicide treatment, on the basic indicators of wood quality. The work investigated wood density, correlation of early and late wood zones, and the cell wall thickness for 38-year-old samples of pine trees grown on experimental plots treated using different treatment and density control techniques. The results obtained provide valuable scientific input to general knowledge in silviculture and are of practical interest in plantation forestry.
The pinewood density was estimated based on the wood fragments sampling from model trees in the form of disks along the length of the trunk and cores at a height of 1.3 m. The correlation of early and late wood zones was examined on a microphotometer analyzer that was originally developed in L.V. Kirensky Institute of Physics in Krasnoyarsk (Fig. 1). The layered structures were applied with subsequent output of indicators on a diagram tape and further scaling using electronic caliper TOPEX 31C624 (Poland) with an accuracy of 0.01 mm. The data obtained were grouped into ten-year periods. Microsoft Excel 2013 were used for subsequent data processing.

Figure 1: Microphotometric analyzer for studying the structure of wood and anatomical features of tree growth
Density measurements were performed in accordance with GOST 16483.1–84 [GOST 16483.1–84 Wood. Method for determination of density] on samples of a square rectangular prism form with a base of 20 mm × 20 mm and a height of 30 mm along the fiber, facets of which are smoothly sharpened. Basis density was determined by measuring the maximum moisture value of density class wood samples taken from selected sections in experimental plots according to formulas:
where Vwmax is the volume of the sample extremely saturated with moisture (m3), m0 is a mass of an absolutely dry sample (kg).
The images of growth increment were taken with the Leica DVM 5000 Digital Microscope (Leica Microsystems, USA). Since some of the growth increments do not fit into a single picture but represent several photos, it was necessary to combine them using the photo editor Adobe Photoshop CC. Afterward, a thin one-pixel black line was drawn through the most distinguishable row of cells, and the border between early and late growth wood was highlighted as well (Fig. 2). Then, the number of early and late wood cells was estimated according to this image with the line. The cell size and wall thickness specified the difference between the end of the early wood (lightly colored area) and the beginning of the late wood (dark area). Late wood cells are darker and have a smaller size with thicker walls. The thickness of the cell wall is measured in each 10 cells, that is 10% of the total number of cells.

Figure 2: Example of a drawn line through the most distinguishable row of cells
Cell wall thickness was calculated using the DG Analyzer v1.5 software with an image size of 135.47 × 101.6. All images were taken at 300 dpi, where the length of a cells’ row was measured with a curve line tool. The curve line has points in its bending nodes that may interfere with an orderly set of numbers. Therefore, this point should be deleted when approaching a bend node, and then the line will bend from the last left point. Separate lines are used to highlight late and early cells. The measurement is performed on every tenth but not less than on three cells. The outermost cells are not measured as they may be jammed. That is, depart from the edge by 2–3 cells, two dots are put on the left cell wall (the cells adjoin resulting in the thickness of two neighboring cell walls, i.e., this number should be divided in two in the future. Afterward, two dots are placed on the right cell wall with the subsequent measurement. Depart from it to the right for as many cells as necessary (every tenth cell, and at least three cells), the dots are put again in the same way as described above.
The result is a column of digits, which corresponds to the following numbers:
1. the distance from the leftmost point of the line passing through all cells to the first cell wall;
2. the width of the left wall of the first measured cell;
3. intracellular space;
4. the width of the right wall of this cell;
5. the distance to the next cell on which the measurements are made and further similarly.
After the calculations on all images are made, the values obtained should be converted to the desired scale. The size of one image was 135.47 × 101.6 mm. All images were taken at 300 dpi. In other words, 300 dpi and 1000 scale are always used at rastering. The scale of 1000 is specified at plan creation. Thus, the side of the image on the plan is measured, amounting to 135.47 m. All the images contained the following values: zoom, the size of the image width H, the microscope resolution, and the scale for checking at the bottom.
The sample plot is located on the territory of Siverskiy leskhoz: Leningrad region, Gatchinskiy district, Orlinskiy forestry, in the north-western part of square 93, bordering with sample pine crops of Druzhnoselskiy forestry in the north and sample plot planted in 1980 in the east. The total area of the experimental site amounts to 11 hectares and consists of 30 permanent sample plots (PSP) with an area of 0.32–0.80 hectares each. Such a large area allowed growing crops with different densities (Fig. 3).

Figure 3: Scheme of the sample plot
The site is relatively flat, intensively drained (former bush hayfiled of poor quality). Forestry conditions are from different herbs to herbaceous. Ditches are overgrown with willow and alder gray. In the increased (western) part, the soil area is fresh, sod medium podzolic sub sand loamy in the middle part of the soil, wet humus and peaty, medium podzolic, in some places gleyd on loams or sand (humus horizon of 0.2–0.3 m). In the lower terrain (eastern) part of the soil area, moist humus and peat on loams (organogenic horizon capacity of 0.3–0.5 m).
Preparatory work was carried out in the summer of 1975, crops planting–in May 1976. After hanging the passage axles of the tillage tool (PLO-400 plow), the soil was mechanically treated every 6 m with the formation of layers 30–35 cm high and furrows 35–40 cm deep; layers were rolled out with a chain track tractor T-130. The planting was carried out under the cord by leveled seedlings, grown from local seeds, with an open root system at a height of 24 ± 0.6 cm and the diameter of the root neck of 4.3 ± 0.2 mm. The plots under study are marked with color on Fig. 2. The growth and density rates of young trees and presented in Tab. 1.
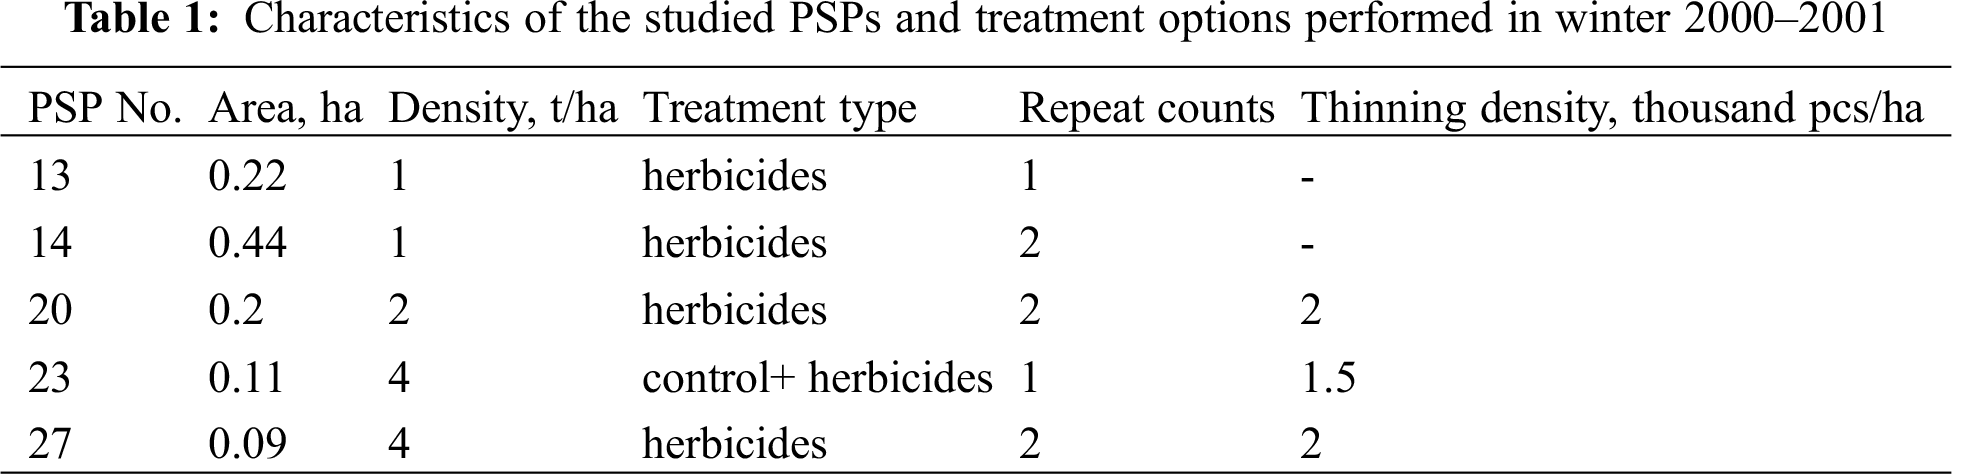
In the control subvariant, only willow, alder, and birch were removed from weed plants using the motorized Secor unit. On the herbicide subvariants, belts 1 m wide were treated along the rows with a mixture of propazine (5 kg/ha) and gardoprim (2 kg/ha) from Solo sprayer in May 1978 (3rd year of planting). In spring 1979, the treatment was repeated with increasing the dose of propazine to 7 kg/ha and that of gardoprim to 3 kg/ha. Solution consumption was 500 l/ha. In autumn 1979 and August 1982, the belt was treated with glyphosate in a dose of 3 kg/ha (solution consumption 300 l/ha), which resulted in a suppression of all herbaceous plantings. In winter 2000–2001, 26-year-old pine crops were thinned to different density values at the PSP with an introduction of herbicides (Tab. 1).
Plantation growing requires minimizing costs and getting the maximum output from 1 hectare of forest-covered area. The object of the study (pine crops) reached 38 years of age. These plantations are of interest for the analysis of volume and mass indices when growing crops for pulpwood with a felling turnover of 40 years.
Tab. 2 shows the results of basis density measurements depending on the diameter class in all investigated PSPs.
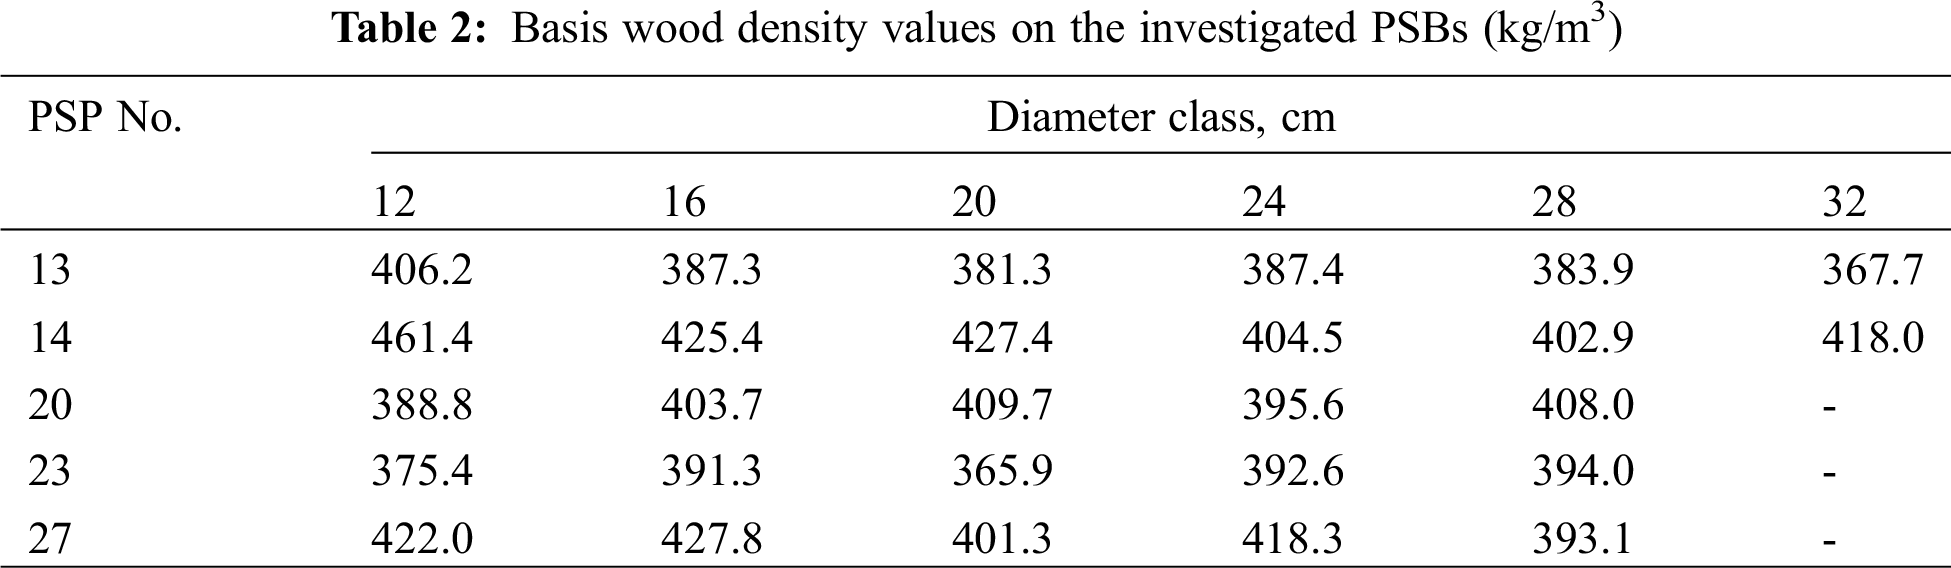
As can be seen from the table, there is a difference depending on the treatment technique. Thus, at PSP No. 13, the highest and the lowest basis density values are observed in the wood of 12th class and with a trunk diameter of 32 cm, accordingly. For samples at PSP No. 14, which received a repeated dose of herbicides compared to No. 13, the maximum and minimum basis density values are observed in the wood of 12th class and with a trunk diameter of 28 cm, respectively. For trees growing at PSP No. 20 with greater density (2 t/ha, double treatment with herbicides), the highest and the lowest basis density values are observed at 20th and 12th class, accordingly.
At PSP No. 23 (4 t/ha, herbicides, control, single treatment) the maximum basic density is traced in the wood of 28th class and the minimum in that of 12th class. For samples at PSP No. 27 (4 t/ha, double treatment with herbicides), the highest and the lowest basis density is observed in the 16th and 28th class, respectively.
As can be seen from Fig. 4, the highest basis density is observed at PSP No. 14, and the minimum value is fixed on PSP No. 23. Thus, the option of double treatment with herbicides at the density of 1 t/ha gives the maximum value of the grown wood basis density. At the same time, the minimum value corresponds to the samples grown on the mixed treated site with a density of (herbicides, control, repeated treatment).

Figure 4: Maximum, minimum, and average basis density in all PSPs
Thus, frequent thinning and repeated fertilization result in an increase of wood density. The obtained results are well consistent with the results of studies in [22,23]. However, not only these factors affect density changes, but also climatic variations are involved. According to [24], the density of pine wood increases during drought, especially in late winter and early spring.
The results of measurements of late and early wood widths depending on diameter class are presented in Figs. 5 and 6. As can be seen, the width measurements for early wood are somewhat higher compared to the width of the late wood in all PSPs.

Figure 5: Width of early wood depending on the diameter class at the examined PSPs

Figure 6: Late wood width depending on the diameter class at the examined PSPs
For PSP No. 13 (Fig. 5), the dynamics of changes in early wood width demonstrates that the width increases uniformly with the growth stage. The greatest and the smallest widths of early wood is observed on the diameters of 32 and 12 cm, respectively. Fig. 6 shows that for the late wood, the maximum and minimum widths are observed on diameters of 28 and 20 cm, accordingly, and changes depending on a diameter class of trees are increased not uniformly.
A similar pattern is observed for the samples at PSP No. 14. The greatest width of early wood is in the 24th class and the smallest–in 32nd (Fig. 5). Late wood has the greatest width by 24th class, and the smallest by 16th class (Fig. 6). For samples at PSP No.20 and 27, the indices of early and late wood widths increase with the higher diameter class, while for PSP No. 23, the decrease in width is observed Tab. 3.
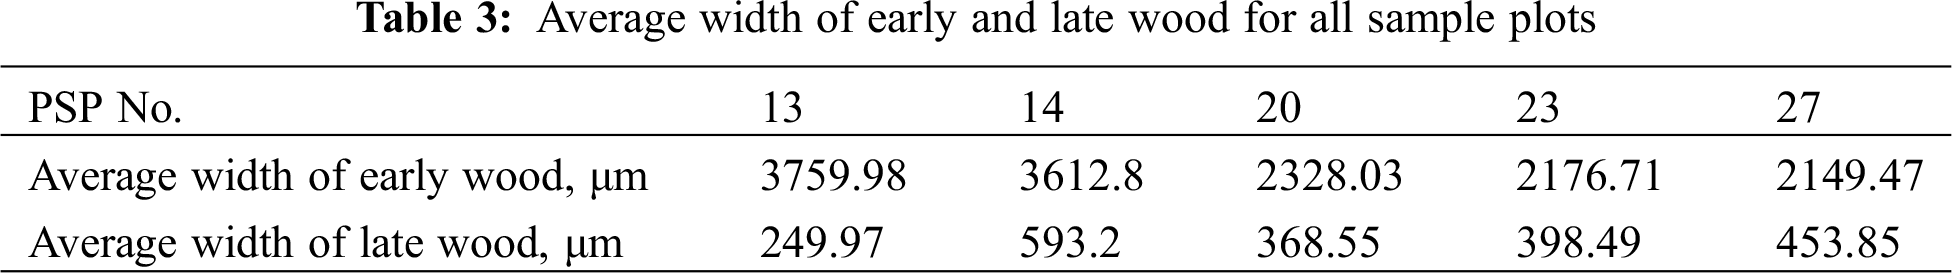
Comparing the width values of early wood in all the sample plots, it can be seen that the longest width is observed at PSP No. 13 (1 t/ha, single-time treatment with herbicides) and the shortest–at PSP No. 27 (4 t/ha, double treatment with herbicides). For the late wood, the maximum width is recorded on PSP No. 14 (1 t/ha, double treatment with herbicides) and the minimum–on PSP No. 13 (1 t/ha, a single treatment with herbicides). A general decrease in the width of latewood and an increase in the width of earlywood can be explained by the prolonged growing season and the influence of dry deposition of fertilizers as the main reasons [23]. According to the results of X-ray measurements of Pinus taeda [25], the density of wood growth increases with age, and the formation of mature wood begins from 30–45 years. Longer periods of growing trees in the canopy of two age stands provide better-quality wood.
The thickness of the cell wall was determined to specify the factors affecting the wood density. Figs. 7 and 8 show the results of measuring cell wall thickness as a function of trunk diameter.

Figure 7: Early wood cell wall thickness at all PSPs

Figure 8: Late wood cell wall thickness at all PSPs
As can be seen from Figs. 7 and 8, wall thicknesses for early and late wood differ slightly in size. Thus, for early wood fragments of PSP No. 13, the change of cell wall thickness depending on diameter class is non-uniform (Fig. 7). The greatest thickness of the cell wall is observed in the 32nd diameter class steps and the smallest–in the 12th class. Similar pattern is observed for the dependencies of the late wood wall thickness (Fig. 8), where the greatest thickness of the cell wall is observed in the wood cells of 28th diameter class and the smallest–in the 12th class.
As can be seen from the figures, the value of cell wall thickness in late wood is higher than that in early wood for trees on PSP No. 13. At PSP No. 14 with the early wood, the maximum thickness of a cell wall is observed in the wood of the 20th class, and the minimum–on the 28th class (Fig. 7). In late wood, the thickness of the cell wall is maximal in the 20th class and minimal–in the 24th class (Fig. 8). Thus, the cell wall thickness in early wood is lower than that in late wood. For the samples at PSP Nos. 20 and 27 (4 t/ha, double repeated treatment with herbicides), the thickness of the cell wall in late wood was greater compared to that of early wood. Similar situation was observed at PSP No. 23 for all diameter classes.
Hence, as can be seen from Fig. 9, the maximum value of the average cell thickness is observed on PSP No. 27 (4 t/ha, double repeated treatment with herbicides), and the minimum value is noted at the 13th sample plot (1 t/ha, a single treatment with herbicides).

Figure 9: Average cell wall thickness of early and late wood
Hence, as can be seen from Fig. 9, the greatest average cell thickness of late wood is observed on PSP No. 27 (4 t/ha, double repeated treatment with herbicides), and the minimum value is noted at the 13th sample plot (1 t/ha, a single treatment with herbicides). Thus, the obtained results show that the initial planting density has little effect on the stock and density of coniferous wood, while the choice of treatment technique and conditions of the growing area play a more significant role.
The results obtained are well consistent with the findings of other works [26–30]. Studies conducted in the Arkhangelsk region showed that the thinning of 30–40-years-old pine stands improved the quality of wood since the percentage of late wood increased by 13% in 4 years [28]. Similar indicators were obtained after thinning in forests of Zhytomyr and Pre-Carpathian regions (Ukraine). The percentage of late wood increases slightly by only 2.4–3.4%, indicating better physical and mechanical properties [29]. Papers of Grigoryeva [31] and Vagveldi et al. [32] discuss the forest treatment effect on multisectional permanent sample plots planted in the conditions of berry-type pine. Thinning of young trees with an intensity of more than 50% by the number of trees leads to an increase in the share of early wood and, consequently, to a deterioration in the quality of grown wood raw materials. The latter causes heterogeneity of wood structure and deformation of lumber produced from it.
According to the above results, the biggest differences in the growth increment of pine trees by the width of one-year layers were found in the first 4 years after thinning, especially in the second year after it. As the thinning intensifies, the width of the year-layer at the breast height in the trees of I class growth gradually increases. Linear thinning of the growing stock combined with selective growth after treatment in class I trees at breast height increased markedly in case of medium and heavy thinning intensity. Trees of II growth class reacted most positively to highly intense thinning. Comparison of the radial growth size and percentage of late wood allows selecting the optimum thinning regime in the conditions of berry-type pine trees to recommend treatment at the age of 15…20 years with the intensity of 50% by the number of trees, pass cuts at the age of 40…50 years with the intensity of 26…35% by the stock. Reduction of the thinning procedures to two does not lead to deterioration of forest management indicators with significant improvement of economic effect [33,34].
4 Conclusions and Recommendations
According to the analysis results, the greatest values of average basis density for all sample plots have been determined in trees grown with a density of 1 t/ha and double treatment with herbicides. The minimum basis density is noticed for samples with a greater density of 4 t/ha and combined treatment, including weeds removal and single-time herbicide treatment. By comparing the widths of early wood in all experimental plots, the lower density of 1 t/ha and a one-time herbicide treatment have been established to affect the width increase. For late wood, a lower density of 1 t/ha and herbicide treatments (2 repetitions) also affect the width level. An increase in the average cell wall thickness for early and late wood occurs when the density increases to 4 t/ha and double herbicide treatments are applied.
Noteworthy is that the effect of initial planting density and crop types on the stock and density in the pinewood is quite ambiguous. The choice of planting density and its further reduction for the pine should be differentiated from the conditions of the growing area and the purpose of further wood growth, whether it would be a balance raw material or sawmill. Increasing the density of crops leads to an increase in volume and mass indices. The studied forestation conditions allow concluding that growing spruce for pulpwood and a sawmill would result in wood raw materials volume with large mass indices for pulping while growing for sawlogs will increase physical and mechanical properties of wood.
Acknowledgement: The work was carried out within the confines of the scientific school “Advances in lumber industry and forestry”.
Availability of Data and Materials: Data will be available on request.
Funding Statement: The authors received no specific funding for this study.
Conflicts of Interest: The authors declare that they have no conflicts of interest to report regarding the present study.
1. Sungurova, N., Marich, S., Alexandrova, Y., Popkova, I. (2019). The correlations between planting material quality and artificial pine plantations parameters. IOP Conference Series: Earth and Environmental Science, 316(1), 12071. DOI 10.1088/1755-1315/316/1/012071. [Google Scholar] [CrossRef]
2. Sedjo, R. A. (2015). The comparative economics of plantation forestry: A global assessment. UK: Routledge. [Google Scholar]
3. Schirmer, J., Pirard, R., Kanowski, P. (2015). Promises and perils of plantation forestry, forests, business and sustainability. UK: Routledge. [Google Scholar]
4. McEwan, A., Marchi, E., Spinelli, R., Brink, M. (2020). Past, present and future of industrial plantation forestry and implication on future timber harvesting technology. Journal of Forestry Research, 31(2), 339–351. DOI 10.1007/s11676-019-01019-3. [Google Scholar] [CrossRef]
5. Proskurina, S., Heinimö, J., Mikkilä, M., Vakkilainen, E. (2015). The wood pellet business in russia with the role of north-west Russian regions: Present trends and future challenges. Renewable and Sustainable Energy Reviews, 51, 730–740. DOI 10.1016/j.rser.2015.06.051. [Google Scholar] [CrossRef]
6. Ilintsev, A., Nakvasina, E., Aleynikov, A., Tretyakov, S., Koptev, S. et al. (2018). Middle-term сhanges in topsoils properties on skidding trails and cutting strips after long-gradual cutting: A case study in the boreal forest of the north-east of russia. Croatian Journal of Forest Engineering: Journal for Theory and Application of Forestry Engineering, 39(1), 71–83. [Google Scholar]
7. Nakvasina, E. N., Voevodkina, A. V., Volkov, A. G., Zakharov, A. Y., Koptev, S. V. et al. (2019). Thinning effects on stand formation and modifications of a young pine/birch forest: A boreal zone case study. Folia Forestalia Polonica, 61(3), 197–210. DOI 10.2478/ffp-2019-0019. [Google Scholar] [CrossRef]
8. Miller, R. B. (2018). Wood anatomy. Access Science. DOI 10.1036/1097-8542.748200. [Google Scholar] [CrossRef]
9. Zeller, L., Ammer, C., Annighöfer, P., Biber, P., Marshall, J. et al. (2017). Tree ring wood density of Scots pine and european beech lower in mixed-species stands compared with monocultures. Forest Ecology and Management, 400, 363–374. DOI 10.1016/j.foreco.2017.06.018. [Google Scholar] [CrossRef]
10. Ivanova, A. V., Morkovina, S. S., Kolesnichenko, E. A., Matveev, S. M. (2018). Management of reforestation processes using innovative technologies. Spain: IBIMA. [Google Scholar]
11. Ospanov, A., Muslimov, N., Timurbekova, A., Jumabekova, G., Almaganbetova, A. et al. (2019). The study of indicators of the quality test of poly-cereal whole meal flour for making pasta. Journal of Hygienic Engineering and Design, 27, 32–38. [Google Scholar]
12. Kunitskaya, O. A., Sidorov, M., Fedorova, P., Burmistrova, O., Nazarova, I. et al. (2020). Using machine vision to improve the efficiency of lumber mills. Journal of Physics: Conference Series. International Conference on Future of Engineering Systems and Technologies, 1478, no. 1, 12020. DOI 10.1088/1742-6596/1478/1/012020. [Google Scholar] [CrossRef]
13. Bulat, M. P., Bulat, P. V., Denissenko, P. V., Esakov, I. I., Grachev, L. P. et al. (2018). Ignition of lean and stoichiometric air-propane mixture with a subcritical microwave streamer discharge. Acta Astronautica, 150, 153–161. DOI 10.1016/j.actaastro.2017.11.030. [Google Scholar] [CrossRef]
14. Río, M. D., Bravo-Oviedo, A., Pretzsch, H., Löf, M., Ruiz-Peinado, R. (2017). A review of thinning effects on Scots pine stands: From growth and yield to new challenges under global change. Forest Systems, 26(2), eR03S. [Google Scholar]
15. Vallejos, J., Moya, R., Serrano, R. (2015). Effects of thinning on diameter, heartwood, density and drying defects of gmelina arborea. Maderas. Ciencia y Tecnología, 17(2), 365–372. DOI 10.4067/S0718-221X2015005000034. [Google Scholar] [CrossRef]
16. Yin, J., Song, K., Lu, Y., Zhao, G., Yin, Y. (2015). Comparison of changes in micropores and mesopores in the wood cell walls of sapwood and heartwood. Wood Science and Technology, 49(5), 987–1001. DOI 10.1007/s00226-015-0741-9. [Google Scholar] [CrossRef]
17. Bulat, P. V., Volkov, K. N., Ilyina, T. Y. (2016). Interaction of a shock wave with a cloud of particles. Mathematics Education, 11(8), 2949–2962. [Google Scholar]
18. Carson, S. D., Cown, D. J., McKinley, R. B., Moore, J. R. (2014). Effects of site, silviculture and seedlot on wood density and estimated wood stiffness in radiata pine at mid-rotation. New Zealand Journal of Forestry Science, 44(1), 26. DOI 10.1186/s40490-014-0026-3. [Google Scholar] [CrossRef]
19. Primicia, I., Colomo, R. A., Rodríguez, J. B. I., Puertas, F., Traver, C. et al. (2016). Influence of thinning intensity and canopy type on Scots pine stand and growth dynamics in a mixed managed forest. Forest Systems, 25(2), e057. DOI 10.5424/fs/2016252-07317. [Google Scholar] [CrossRef]
20. Bulat, P. V., Zasukhin, O. N., Upyrev, V. V., Silnikov, M. V., Chernyshov, M. V. (2017). Base pressure oscillations and safety of load launching into orbit. Acta Astronautica, 135, 150–160. DOI 10.1016/j.actaastro.2016.11.042. [Google Scholar] [CrossRef]
21. Kunitskaya, O. A., Shadrin, A. A., Burmistrova, O. N., Markov, O. B., Gasparyan, G. D. et al. (2019). Wood treatment with hydro impact: A theoretical and experimental study. Bulgarian Journal of Agricultural Science, 25(2), 158–166. [Google Scholar]
22. Węgiel, A., Bembenek, M., Łacka, A., Mederski, P. S. (2018). Relationship between stand density and value of timber assortments: A case study for Scots pine stands in north-western Poland. New Zealand Journal of Forestry Science, 48(1), 1–9. DOI 10.1186/s40490-018-0117-7. [Google Scholar] [CrossRef]
23. Pretzsch, H., Biber, P., Schütze, G., Kemmerer, J., Uhl, E. (2018). Wood density reduced while wood volume growth accelerated in central european forests since 1870. Forest Ecology and Management, 429, 589–616. DOI 10.1016/j.foreco.2018.07.045. [Google Scholar] [CrossRef]
24. Vaughan, D., Auty, D., Kolb, T., Dahlen, J., Sánchez Meador, A. J. et al. (2021). Wood density variation in naturally regenerated stands of pinus ponderosa in northern arizona, USA. Canadian Journal of Forest Research, 99(999), 1–12. DOI 10.1139/cjfr-2020-0245. [Google Scholar] [CrossRef]
25. Topanotti, L. R., Vaz, D. R., e Carvalho, S. D. P. C., Tomazello-Filho, M., Dobner Jr, M. et al. (2021). Growth and wood density of pinus taeda L. as affected by shelterwood harvest in a two-aged stand in southern Brazil. European Journal of Forest Research (in Press). DOI 10.1007/s10342-021-01372-1. [Google Scholar] [CrossRef]
26. Kunitskaya, O. A., Tanyukevich, V. V., Khmeleva, D. V., Kulik, A., Runova, E. M. et al. (2020). Cultivation of the targeted forest plantations. Journal of Environmental Treatment Techniques, 8(4), 1385–1393. DOI 10.47277/jett. [Google Scholar] [CrossRef]
27. Aakala, T., Kuuluvainen, T. (2011). Summer droughts depress radial growth of picea abies in pristine taiga of the arkhangelsk province, northwestern russia. Dendrochronologia, 29(2), 67–75. DOI 10.1016/j.dendro.2010.07.001. [Google Scholar] [CrossRef]
28. Tyukavina, O. N., Neverov, N. A., Klevtsov, D. N. (2019). Influence of growing conditions on morphological and anatomical characteristics of pine needles in the northern taiga. Journal of Forest Science, 65(1), 33–39. DOI 10.17221/JFS. [Google Scholar] [CrossRef]
29. Irland, L., Kremenetska, E. (2009). Practical economics of forest ecosystem management: The case of the Ukrainian Carpathians. Ecological Economics and Sustainable Forest Management: Developing a Trans-Disciplinary Approach for the Carpathian Mountains, vol. 59, pp. 180–200. Ukrainian National Forestry University Press. [Google Scholar]
30. Bulat, M. P., Bulat, P. V. (2013). The analysis centric isentropic compression waves. World Applied Sciences Journal, 27(8), 1023–1026. DOI 10.5829/idosi.wasj.2013.27.08.13719. [Google Scholar] [CrossRef]
31. Grigoryeva, O. I. (2006). Influence of heavy thinning and fertilizers on components of forest ecosystem. Actual Problems of Forest Complex, 13, 157–160. [Google Scholar]
32. Vagveldi, A., Feher, S., Horvath, B., Coman, S., Kovacs, G. et al. (2016). Cultivation and exploitation of forest plantations. Hungary: University of West Hungary Pres. [Google Scholar]
33. Grigorev, I., Frolov, I., Kunitskaya, O., Burmistrova, O., Manukovsky, A. Y. et al. (2019). Non-destructive testing of internal structure of the low-quality wood. International Journal of Civil Engineering and Technology, 10(1), 2104–2123. [Google Scholar]
34. Kunitskaya, O. A., Shadrin, A. A., Kremleva, L. V., Mueller, O. D., Ivanov, V. A. et al. (2019). Modeling of the processes of the modification of the current volume warming by drainage and pressing. Bulgarian Journal of Agricultural Science, 25(2), 167–177. [Google Scholar]
 | This work is licensed under a Creative Commons Attribution 4.0 International License, which permits unrestricted use, distribution, and reproduction in any medium, provided the original work is properly cited. |