Materials
| Journal of Renewable Materials |
DOI: 10.32604/jrm.2021.016166
ARTICLE
Experimental Investigation on Hydrophobic Behavior of Carbon Spheres Coated Surface Made from Microplastics
State Key Laboratory of Multiphase Flow in Power Engineering, Xi’an Jiaotong University, Xi’an, 710049, China
*Corresponding Author: Hui Jin. Email: jinhui@mail.xjtu.edu.cn
Received: 13 February 2021; Accepted: 31 March 2021
Abstract: In this paper, a simple method to plate a hydrophobic coating on the inner surface of a small-scaled tube was proposed, where the coating consisted of carbon microspheres. Three common plastics polystyrene, polycarbonate and polyethylene were used as the feedstocks to be processed in supercritical water in a quartz tubular reactor. After reaction, the contact angle of droplet on the inner surface of the quartz tube was turned out to be over 100°, significantly larger than that of the blank tube 54°. When processing polystyrene in the 750°C supercritical water for 10 min, the largest contact angle was obtained, up to 145°. Besides, in this sample, the size of carbon spheres was smallest, about 2.09 μm diameter on average. When comparing among different types of plastics under the same condition, the contact angle of surface made from PC took the dominant position over that of PS and PE, 124°, 100° and 90°, respectively. In the sample made from PC, carbon spheres adhered into a mountainlike shape, producing a binary geometric structure. Furthermore, this research could be helpful in the discussion of plastic waste management and carbon spheres fabrication with low cost.
Keywords: Plastic wastes; hydrothermal method; carbon spheres; supercritical water; hydrophobicity
Plastics were listed as one of the greatest inventions of the 20th century. In the past 100 years, different types of plastics with diverse structures, functions, applications were produced, and occupy an irreplaceable position in human society [1], bringing with the consequent increase in output and waste volume. Therefore, the recycling of waste plastics has become one of the most difficult environmental problems to solve at present. However, the stable property of those high-molecular petroleum products will make the waste plastic exist for over a century [2]. White pollution caused by the waste plastic poses great threat to the ecological environment, affecting the survival of wildlife, especially the marine life, and plastic has accounted for about 80%−85% of marine litter [3]. As for the microplastics, with an equivalent diameter of less than 5 mm [1,4], are very difficult to degrade in nature environment, posing a great threat to marine life [5]. Small pieces of plastics mean a large specific surface area, making it more likely to absorb toxic substance, which brings more possibility for marine biota to be directly exposed to additives after microplastics are ingested [2]. While China is the country with the largest output of plastics in the world, accounting for 28% of the resin output on the earth [6], it is really an imminent problem to be solved. Plastic is organic high polymer itself, through depolymerization, plastics could be conversed to functional carbon materials. Graphite, graphene, fullerene, diamond, carbon black, activated carbon, carbon fiber, etc., carbon materials and related composite materials have played an important role in human society with their unique properties [7,8].
Carbon spheres (CSs) are usually property stable and have excellent performance in many uses. The traditional preparation methods of CSs that have been reported include chemical vapor deposition (CVD) [9,10], emulsion method, template method [11], arc discharge method [12], high temperature pyrolysis method [13,14]. However, those methods have more or less some defects hard to solve, such as difficulty in control of particle size and uniformity, unsatisfactory size and structure. In addition, these methods require high temperature or first synthesis of suitable templates, which results in high energy consumption, complex equipment, and low yield.
In the year of 1913, Bergius [15] first proposed the concept of hydrothermal carbonization, using the method to process cellulose in order to simulate the formation process of coal. Since then the hydrothermal method has usually been applied in processing wet biomass for the advantage that its reaction condition is in aqueous phase, so compared with flash pyrolysis, the pre-drying step is skipped, which provides us with much more convenience and helps cut the cost at the same time [16]. In 2001, Wang et al. [17] adopted the hydrothermal carbonization (HTC) method to process sucrose, first finding abundant carbon spheres (CSs) after reaction under the condition of 190°C in aqueous phase. Then more attention was paid to the solid phase products of hydrothermal conversion of carbohydrate or biomass [18–20], and found that the solid product, in most cases, were spherical carbon. Many studies had discussed the formation mechanism, the intermediate 5-hydroxymethylfurfural (HMF) was believed to polymerize into carbonaceous spheres [19,21,22]. After some specific means of processing, CSs show multiple excellent functions that could be useful in wide range applications such as batteries [17,23], special templates [24], catalyst carrier [25], supercapacitors [26,27], absorption material [8], and even biomedical area [28], etc. To make sure if any metal materials have positive effects on the conversion process, Cui et al. [29] tested the effect of Fe2O3 nanoparticles and Fe ions on hydrothermal carbonization. One application that deserves a mention is from Joula et al. [30] in 2015, the report demonstrated a method that the CSs made from carbohydrate through HTC after annealing, could be spin-coated on glass substrates, the CSs deposited surface exhibited super hydrophobicity, the maximum contact angle (CA) was as big as 153°.
In industrials, hydrophobic surfaces are usually adopted for heat transfer enhancement, resistance decrease, improvement of corrosion resistance, and the most popular methods of that are techniques of surface modification [31], including etching method [32,33], electrodeposition method [34] and thermal spraying [35]. However, etching and electrodeposition methods required pretreatment by laser to obtain micro-structured surface, which costs long machining time and high equipment expenses. Thermal spraying method takes less cost but it is usually applied to flat or large curved surface. When considering making a coat on the inner surface of a small-scaled tube, those regular methods could hardly work.
Originating from hydrothermal method, supercritical water technique is an effective way to efficiently process organic materials with large moisture content [36–38]. Since the reaction itself is carried out in water, the natural advantages of hydrothermal method in the treatment of wet biomass are also applicable in the treatment of wet plastics [39,40]. In the supercritical hydrothermal reaction, the high solubility, low viscosity, and high diffusibility of water provide good reaction conditions for the decomposition of polymers [37,41–44]. Supercritical water oxidation technology (SCWO) has been used in different parts of industry like hazardous wastewater disposal, catalyst precursor synthesis. Bai et al. [36,45–47] reported that CSs could be found after reaction through investigation on some different types of plastics in supercritical water.
Accordingly, it could be deduced that the CSs deposited surface has hydrophobicity. Therefore, the experiments were designed to take advantage of the high efficiency of SCW technique to reach efficient utilization of waste plastic, and at the same time, manufacturing hydrophobic surface. In this paper, several common plastics polystyrene (PS), polycarbonate (PC) and polyethylene (PE) were employed as feedstocks, reacting in SCW surroundings for a specific time, afterwards, the micro structure of CSs and the hydrophobic performance of different surfaces were listed to make comparison.
To avoid uncertain errors at the first stage of research, experiments were simplified that standard plastics were employed instead of wastes directly. Therefore, standard polystyrene (PS), polycarbonate (PC) and polyethylene (PE) were chosen as feedstocks, which were purchased from Sabic Innovative Plastics (Guangdong, China). The elemental analysis, proximate analysis and thermalgravimetric analysis data of the feedstocks were provided in supplementary information file.
Quartz tube was employed as reactor (inner diameter: 3 mm, outer diameter: 5 mm, total length: 200 mm, volume: 1.34 mL after sealing), for the reason that after reaction the solid phase products could evenly deposit on the inner surface of the reactor. Besides, other devices include Sartorius Group GL224-1SCN analytical balances, micro injector (100 μL for adding water, 5 μL for dropping droplet), Fernsen resistance furnace, EVDM20101-B 3D digital microscope, WGL-125B electric heating blast drying oven, JSM-7800F thermal field emission scanning electron microscope, STA449F3 thermogravimetric analyzer; Bruker Vetex70 infrared spectrometer.
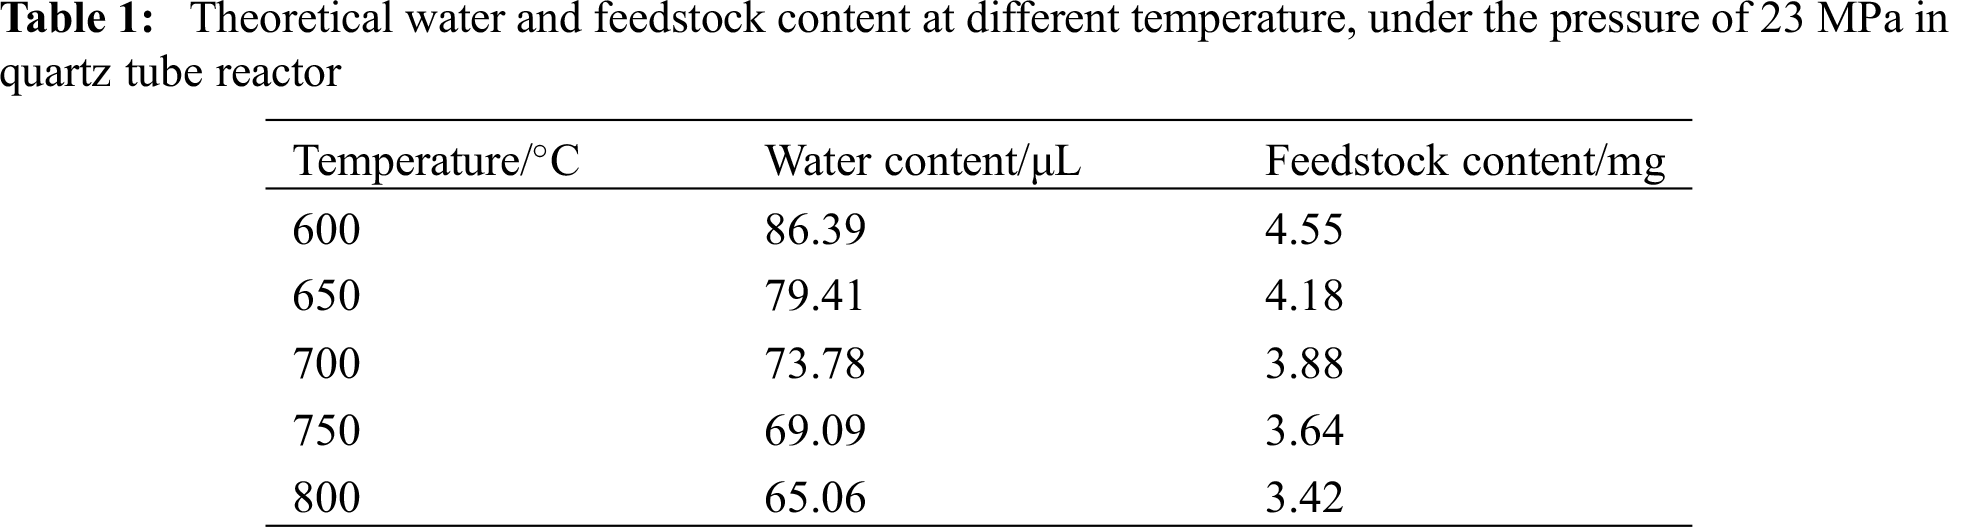
In consider of the intensity of quartz tube, reaction pressure was set at 23 MPa to make sure that the operation was carried out safely. As the physical parameters of supercritical water varies, the dosage of water and feedstock need changing at different temperature, as listed in Tab. 1.
Right after adding feedstock and water, high-temperature hydrogen flame was used to seal the other end of the tube. Then the quartz tube reactor was put at the center of resistance furnace, where the temperature has been preset.
When time was up, immediately took out the reactor for cooling. It was obvious that the coatings were different when the reactor was put at opposite direction. As can be seen in Fig. 1, the solid phase product deposited on the inner surface of the tube much more evenly when the reactor was put upside down than that put upright.
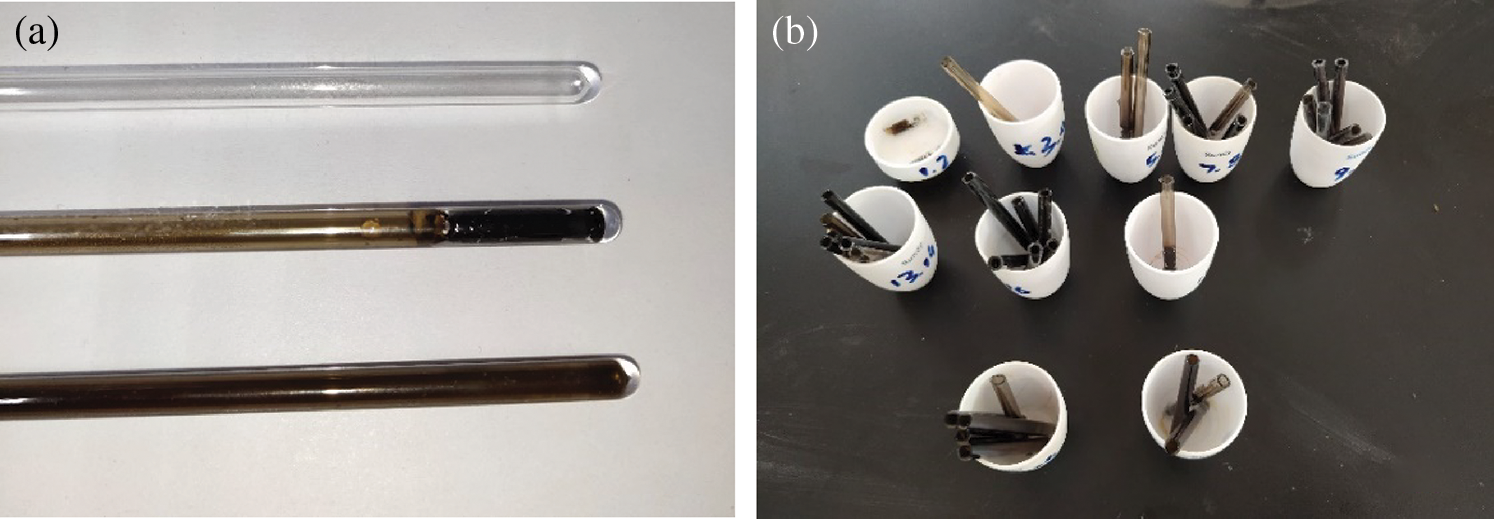
Figure 1: (a) Comparison between blank tube and processed samples (upright and upside-down position); (b) Cut pieces of tubes
Afterwards, the tube was cut into segments. The moment that the tube was cut, a sound of air expansion could be heard, proving that gas production reaction had taken place in the reactor [36,46]. Then each sample was labeled and put into 105°C drying oven, keeping for 15 h to get rid of liquid.
Generally, a solid surface on which the droplet contact angle (CA) is larger than 90° is considered to be hydrophobic. As for a superhydrophobic surface, the CA should be over 150° and roll-off angle (RA) less than 10°. The tube reactor we used was so small-scaled and curved, making it rather difficult to measure by professional optical devices. Therefore, a digital microscope, a portable display and some brackets were used to build a simple system to take photos of droplet on the inner surface. (see in SI Fig. A1) To minimize the influence of accidental errors, the operation was repeated over 20 times and the largest three CA photos were picked out and taken average of them. Since the tubular reactor was so small-scaled and the 2 μL little droplet was nearly the same order of magnitude as the tube that the radian of the base could not be ignored. Photos of droplet were imported into AutoCAD, and two arcs were drawn to describe the cross-sectional contour of the tube and the droplet. From the two arcs, the three intersection point of the air-water-solid phase and the contact angle (CA) were obtained.
For more detailed micro data, some solid products that attached on the inner surface were scraped and analyzed by JSM-7800F thermal field emission scanning electron microscope. Besides, the solid product was grinded into powder and sent into Bruker Vetex70 infrared spectrometer for analyzation.
To investigate if temperature has any influence on the surface hydrophobic performance, PS was chosen as feedstock to set the temperature variable series, from 600°C to 800°C.
As shown in Figs. 2 and 3, the inner surface coated by solid product from SCW reaction has obviously better hydrophobic performance than the blank one. when the reaction temperature was 750°C, the CA of the sample was unusually large, up to as big as 145°, nearly meeting the requirements of super hydrophobicity. Besides, except for the special case, there is an obvious upward trend with the temperature going up.
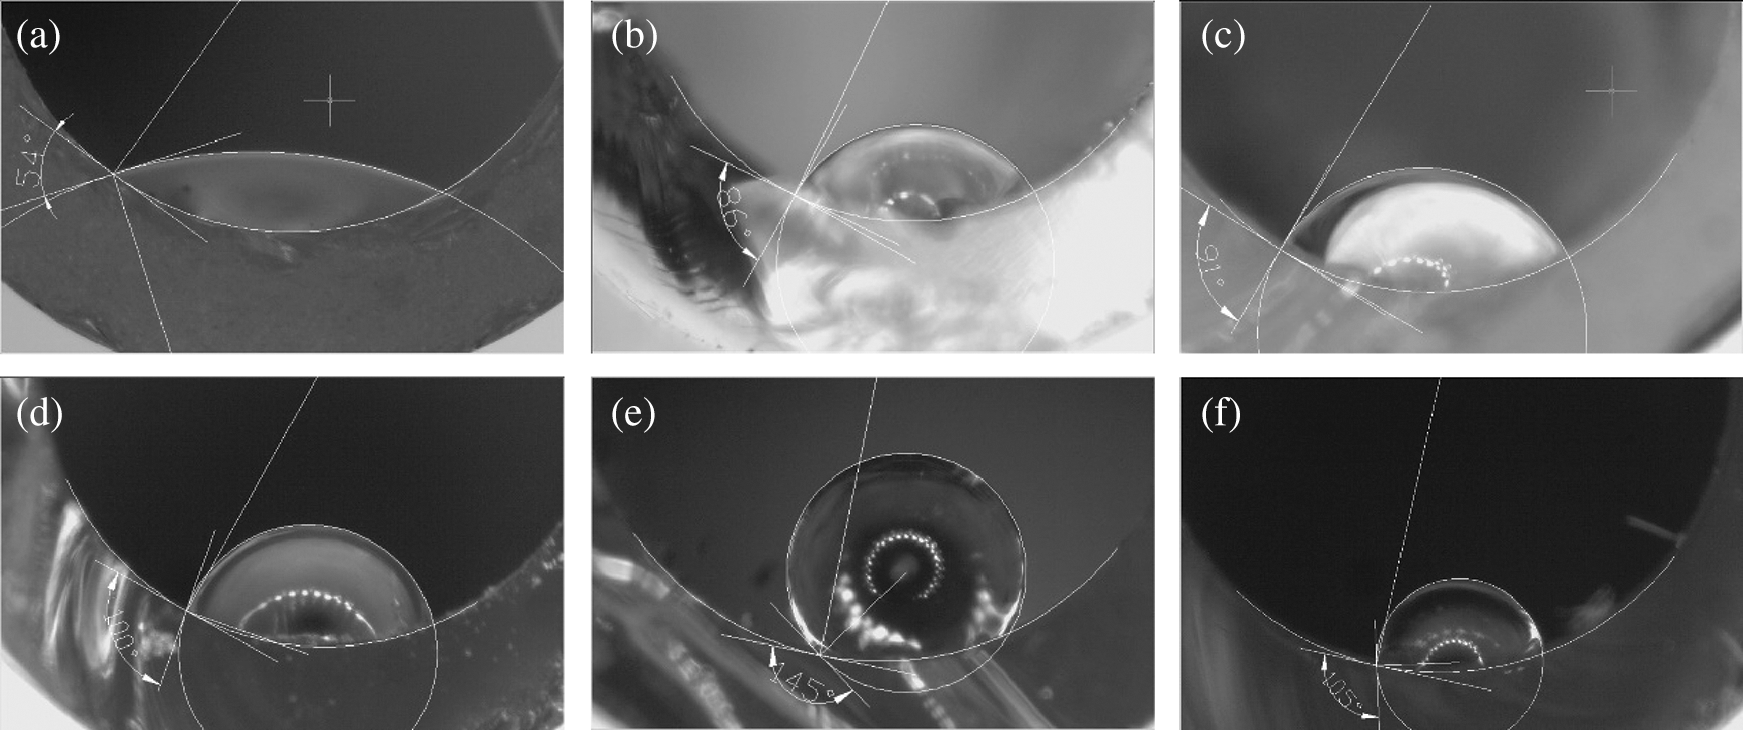
Figure 2: The state of inner surface made from PS processed in SCW at different temperature but same pressure 23 MPa; (a) blank control; (b) 600°C; (c) 650°C; (d) 700°C; (e) 750°C; (f) 800°C
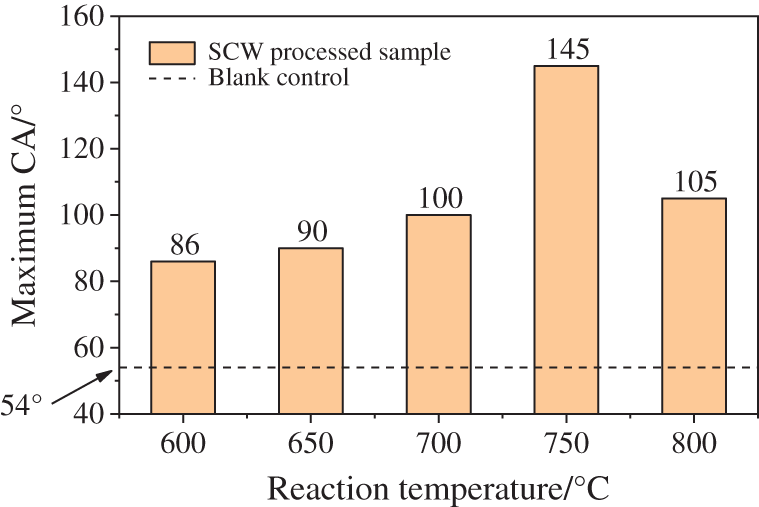
Figure 3: Hydrophobic behavior comparison between blank control and SCW processed samples at different temperature
To investigate the effects of the processing time on the surface hydrophobic performance, the time variable series was designed, from 5 to 30 min, still PS acted as feedstocks. The measurement results were listed in Figs. 4 and 5.
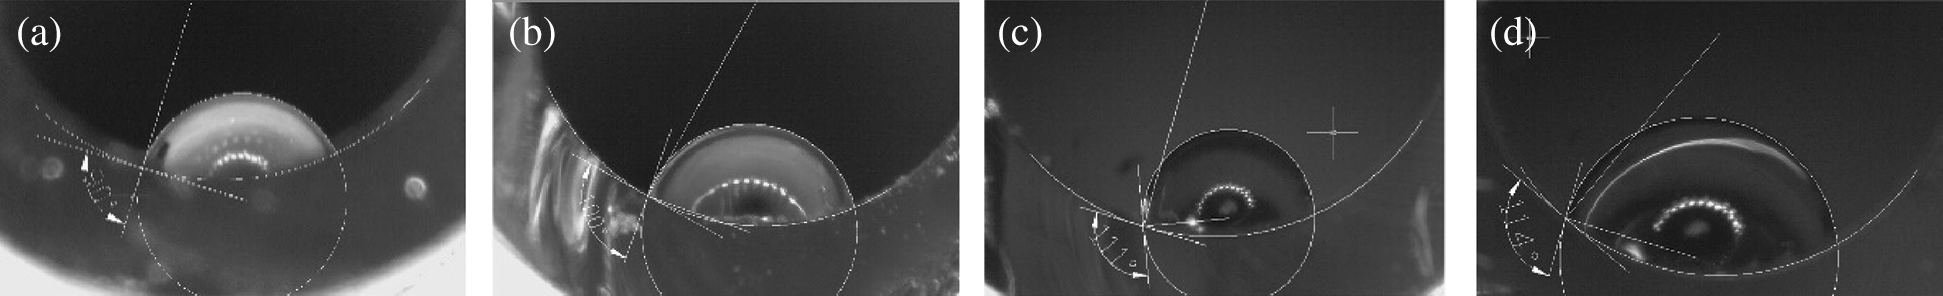
Figure 4: The state of inner surface made from PS processed in SCW for different time but same pressure 23 MPa; (a) 5 min; (b) 10 min; (c) 20 min; (d) 30 min
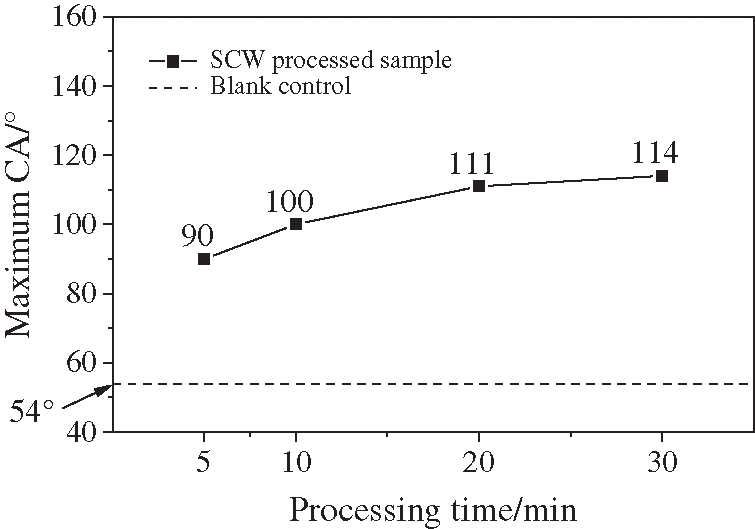
Figure 5: Hydrophobic behavior comparison between blank tube and SCW processed samples for different time
From this set of experiments, a simple conclusion could be reached that CA was getting larger with the processing time prolonging, but the growth rate is getting smaller at the same time. Bai et al. [46] has reported that in SCW surroundings, gasification reaction of polycarbonate (PC) was most active in the first 5 mins, and the gas products content is proved to stay constant within 10 min. So it could be deduced that after enough reaction time, finally the CA of the coated surface would be no larger than 120°.
To make the experiments more comprehensive, plastic PC and PE were employed as feedstocks in the reaction under the same condition.
Through processing different plastics, several similar coated inner surfaces were obtained. But the CA of droplet on each surface was quite different, see in Fig. 6. PC was 124°, much larger than the plastic PS of 100°, while PE was a little bit smaller, about 90°. The result indicated that the discrepancy of hydrophobic behaviors might originate from the micro-structures or functional groups of solid products.
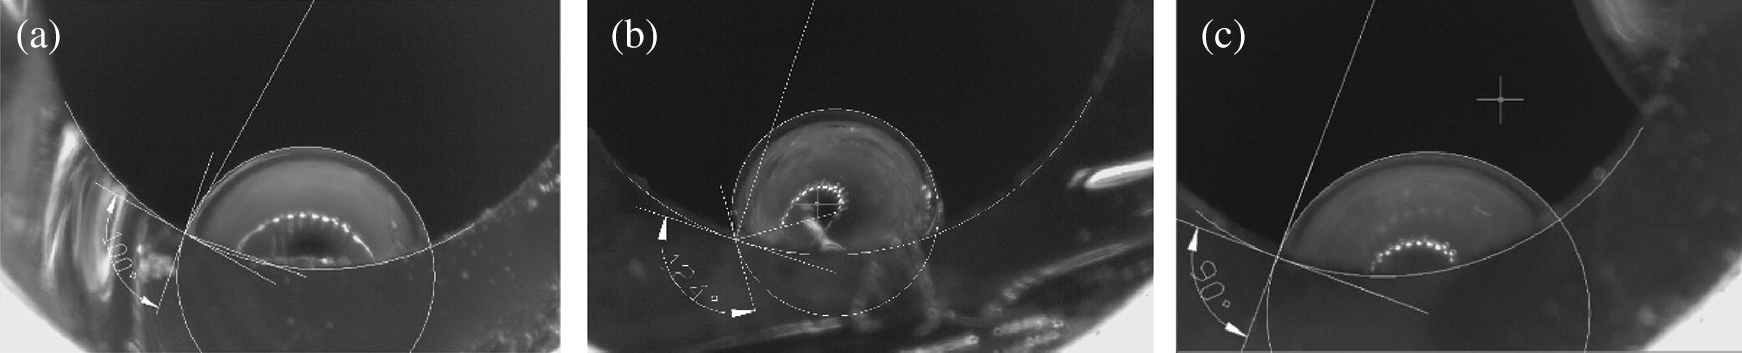
Figure 6: The state of inner surface made from different plastics, but all processed in 23 Mpa SCW for 10 mins; (a) Polystyrene (PS); (b) Polycarbonate (PC); (c) Polyethylene (PE)
It is well known that the hydrophobicity of a surface was decided by its micro-structure and chemical composition. Most of the wetting states of the roughened surface could be assumed to be the Wenzel [48] or Cassie-Baxter [49] state. Wenzel held the point that roughened surface made the contact area larger than the smooth surface, thus improving the hydrophobicity (or hydrophilicity) of original surface, see Eq. (1). While Cassie and Baxter considered it to be a composite contact, where the interface between droplet and solid surface was actually made up of gas-liquid and gas-solid interfaces, see Eq. (2).
where, r: roughness factor; θ*: contact angle of droplet on the coated surface; θ1: contact angle of droplet on flat smooth surface; θ2: contact angle of droplet in the air, considered to be 180°; f1 and f2: the fractions of solid surface and air in contact with liquid.
Actually, the two theories are not so definitely different, they could both explain most wetting states in normal rough surface. Some instances turned out to be at the intermediate state between them, and even more complex and sophisticated model was raised to explained wetting mechanism on rough and composite surface [50].
According to SEM images of the coating materials, densely packed carbon spheres made up the rough surface, and such low energy materials with micro-structure made the Cassie state more stable. Considering it was in line with Cassie state, the sample processed in 750°C SCW for 10 min, θ1 was 145° and regarding the sample with the smallest CA 86° as the fine and compact surface, f1 was calculated to be 0.169, which meant that 16.9% of the water surface contacted with carbon spheres and over 80% contacted with the air cushion.
According to the SEM and EDS characterization chart (see in Fig. 7), the carbon element distribution was roughly the same as the layered and spherical solids in the scanning electron microscope images, indicating that the solid in the SEM images is indeed lamellar and spherical carbons. According to the element report of EDS analysis, the content of carbon in the analysis results of each sample accounted up to 99% (the element N/Mn/Fe that could not be found in the analysis results has been discharged).
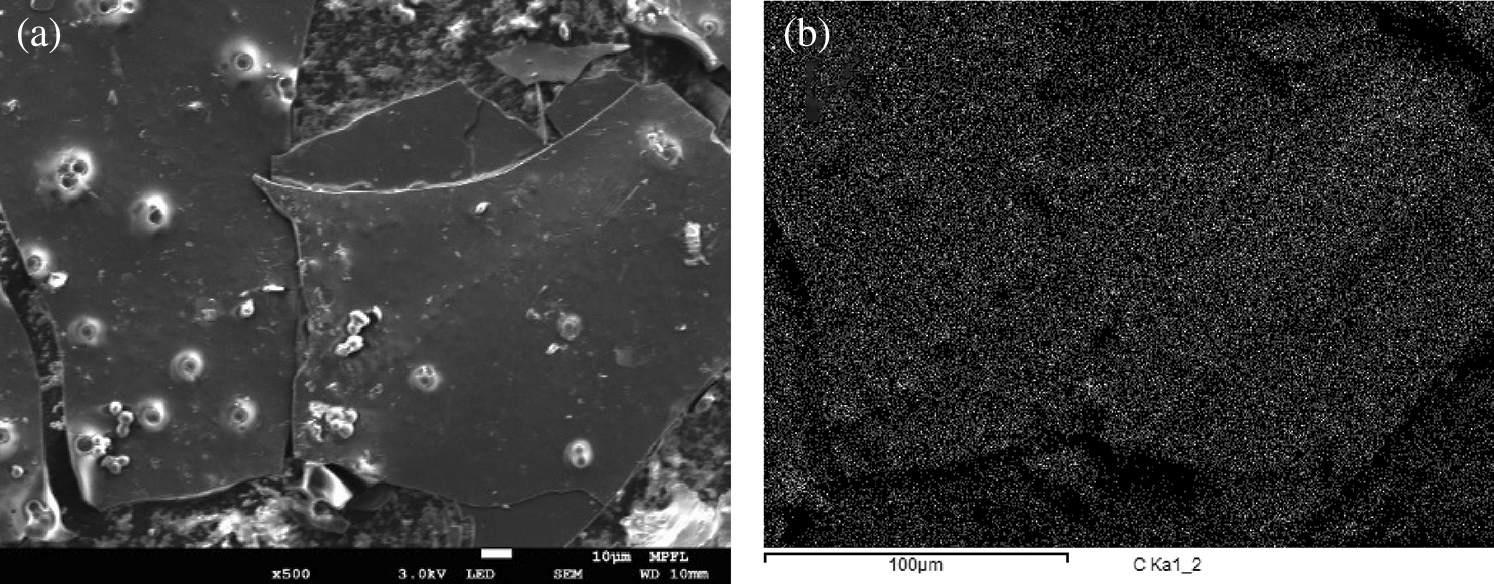
Figure 7: A comparison of micro characterization; PS-SCW-600°C-10 min sample; (a) scanning electron microscope (SEM); (b) elemental dispersive spectrometer (EDS)
In general, solid products were consisted of layered and spherical carbons, and the spherical carbons proportion was growing with the reaction temperature going up, see in Fig. 8. At the temperature of 600°C, spherical carbon was hardly seen, but there could be found a tendency for carbon spheres to nucleate and grow. With the increasing of reaction temperature, it could be easily seen that spherical carbon was replacing the layered ones. When the temperature reached 800°C, the image was filled with carbon spheres, with a good sphericity and uniformity.
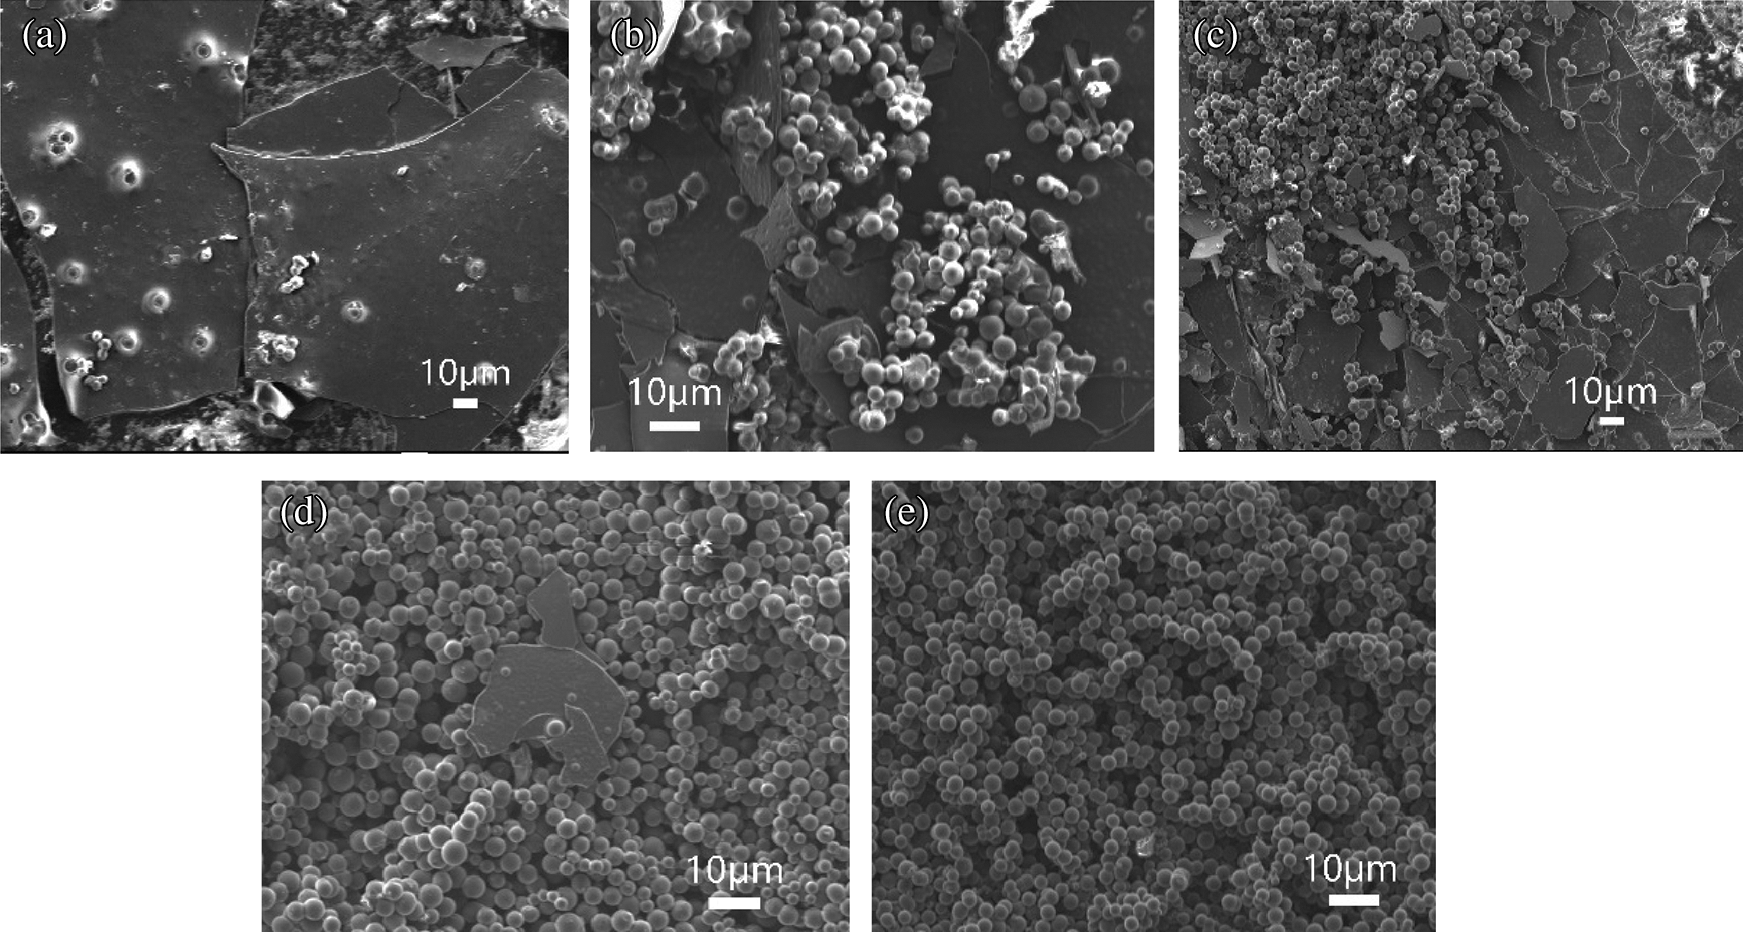
Figure 8: SEM characterization images of PS processed in 23 MPa SCW for 10 min but at different temperatures; (a) 600°C; (b) 650°C; (c) 700°C; (d) 750°C; (e) 800°C
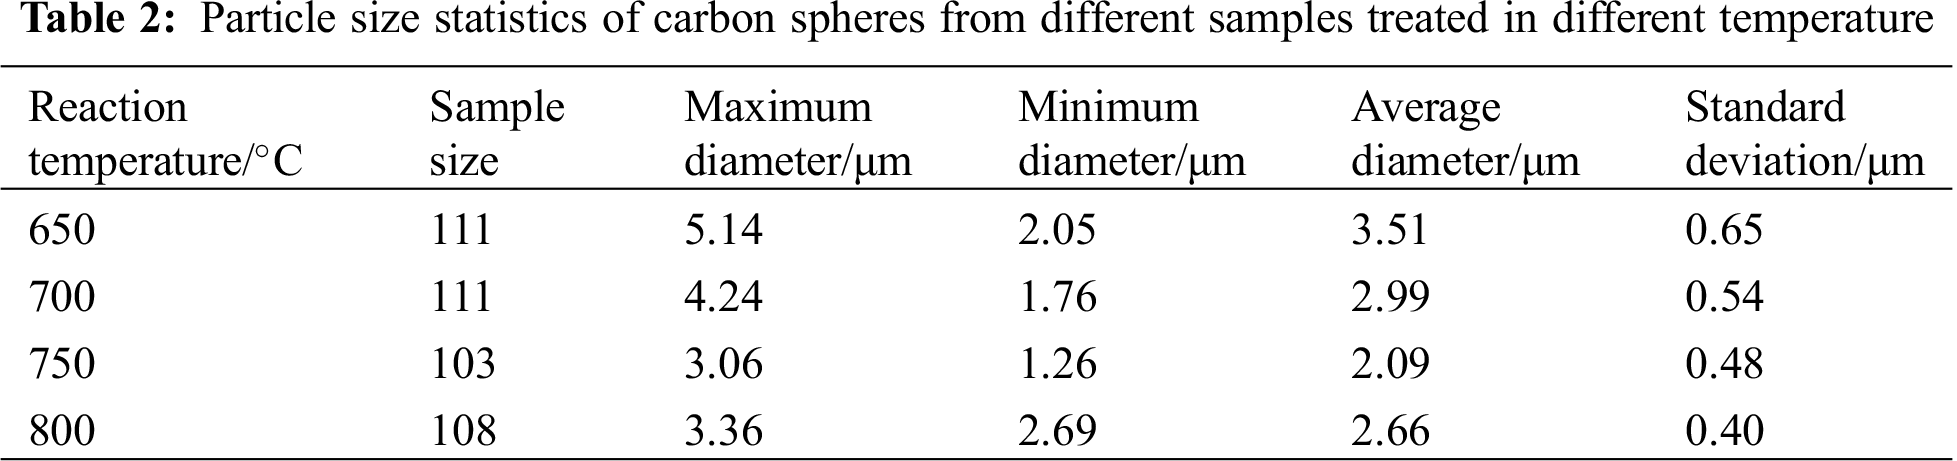
After getting a series of SEM images, an application named Nano Measurer was used to count the diameter of each carbon sphere. Following the rules of quadrat sample method, after setting scale, over 100 sphere samples were picked into calculation and the particle distribution results are as follows (sample processed at 600°C was skipped for no integral spheres in the image). The statistics were listed in Tab. 2, and from Figs. 9 and 10a, it can be seen intuitively that in the temperature range from 650–800°C, the average particle size showed a trend of first decreasing and then increasing as the reaction temperature increased. While the standard deviation of carbon spheres kept a significant trend of decreasing, implying that the uniformity was getting better with the increasing of temperature.
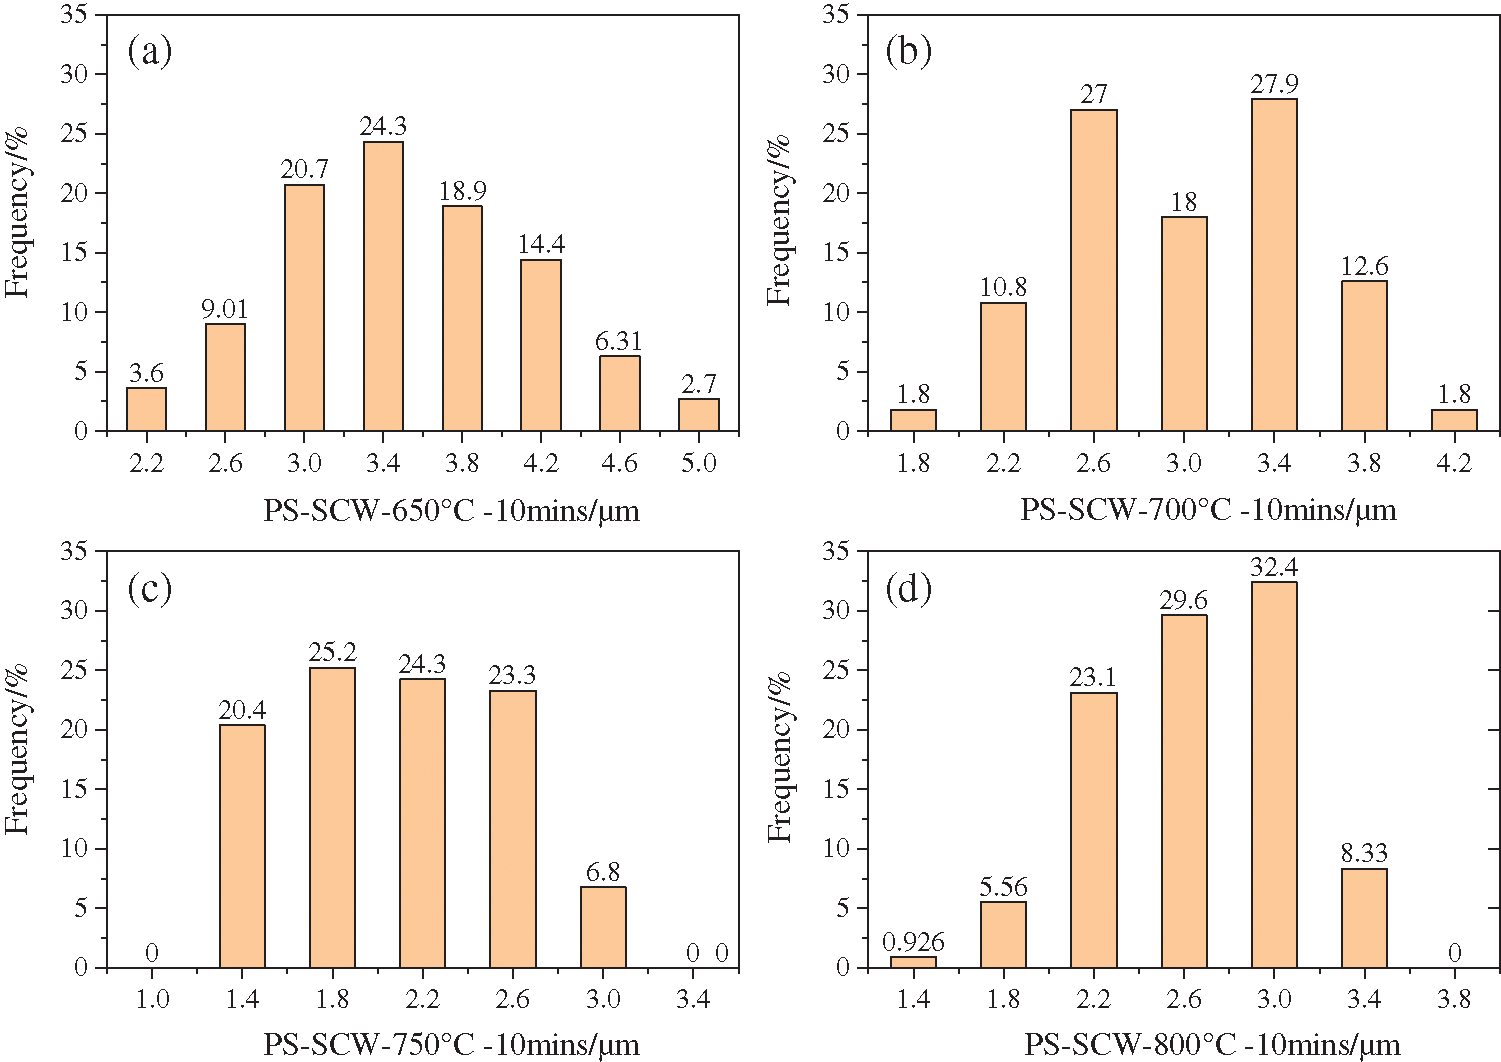
Figure 9: Particle size distribution of carbon spheres produced from PS processed in SCW at different temperatures; (a) 650°C; (b) 700°C; (c) 750°C; (d) 800°C
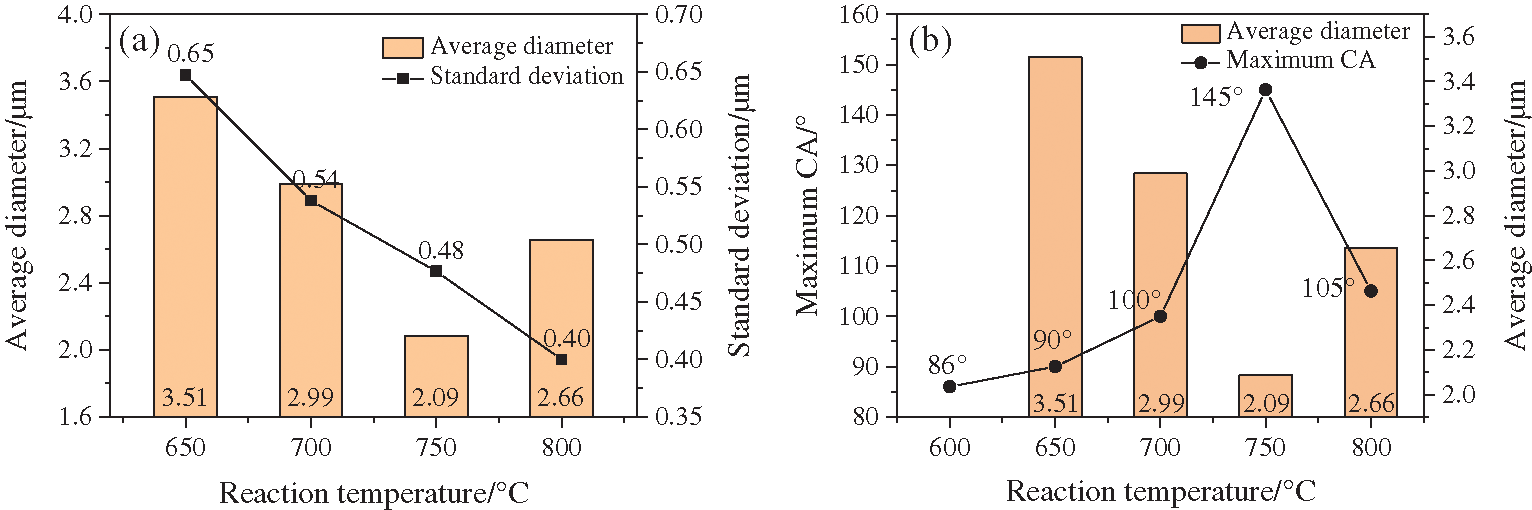
Figure 10: Chat showing that the size of carbon spheres varied with reaction temperature: (a) connection between average diameter and standard deviation; (b) connection between average diameter and maximum CA
To find out the connection of hydrophobic behavior and the particles sizes, comparison between CA and average diameter was made in Fig. 10b. Surprisingly, the extremums of both CA and average diameter matched well, both appearing at the temperature of 750°C. As the temperature continued to rise to 800°C, carbon spheres with a perfect uniformity and integrity were obtained, but their average particle size increased a little bit compared to those processed at 750°C, and as a result, the CA on the coating decreased. Accordingly, in the series experiments of temperature variable, there could be drawn a preliminary conclusion that when most of the solid products were spherical carbon, the smaller the spheres were, the larger CA on the coating obtained.
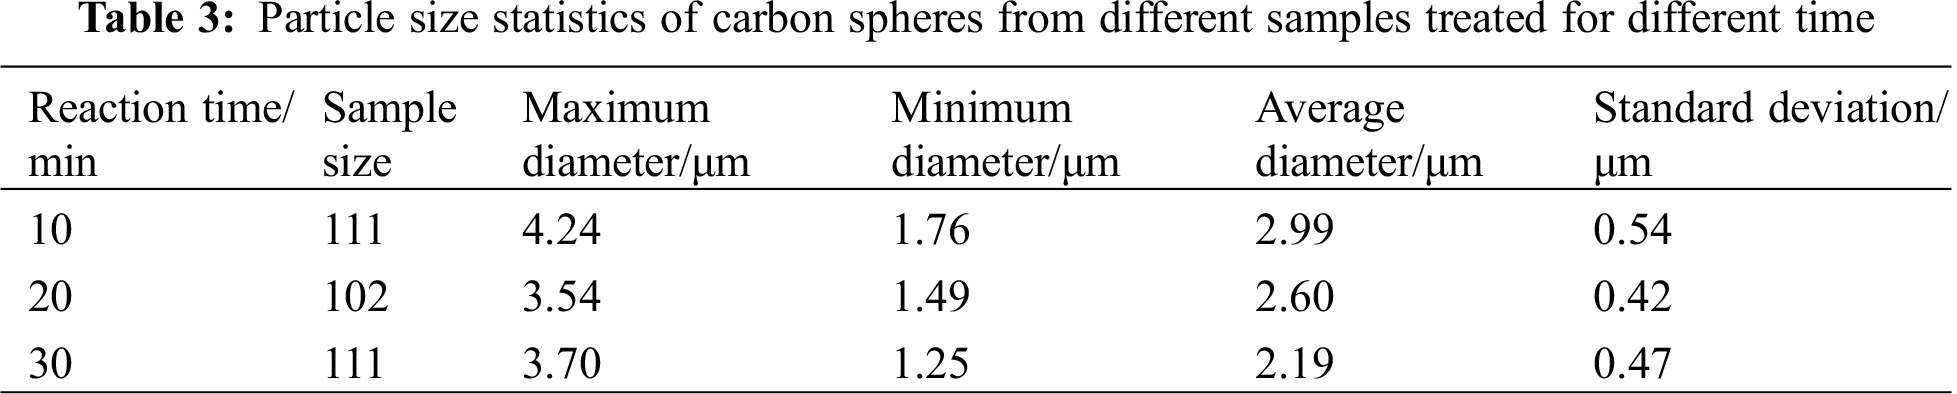
SEM characterization for the samples of time variable series experiments showed that there were still a considerable content of layered carbon and that the carbon spheres were likely to grow between the gaps of layered carbon, see in Fig. 11. Some of the spherical carbon were big while others little, of which the uniformity were not so good as those processed at 800°C. Likewise, the carbon spheres in the image were counted and the results are listed below (Fig. 12 and Tab. 3). It demonstrated that when the time prolonged, the average diameter of carbon spheres dropped from 2.99 to 2.19 μm, decreasing by 26.8%, while the standard deviation of diameter remained around 0.5 μm.
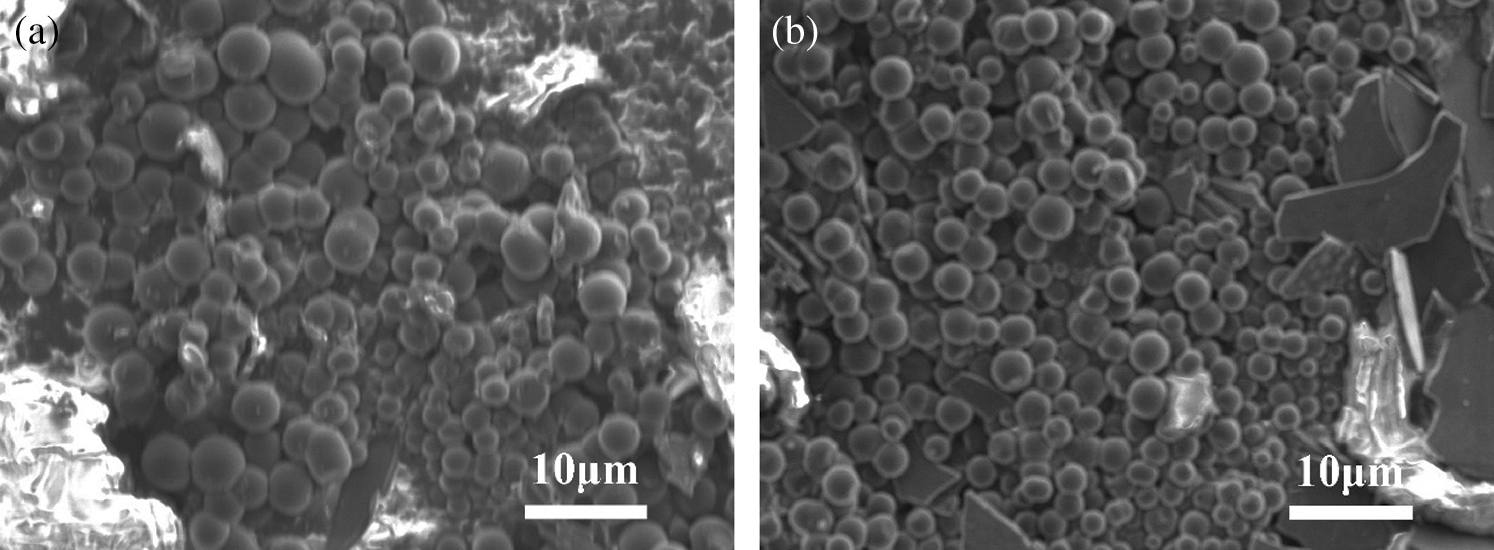
Figure 11: SEM characterization images of PS processed in 23 MPa, 700°C SCW for different time; (a) 20 min; (b) 30 min
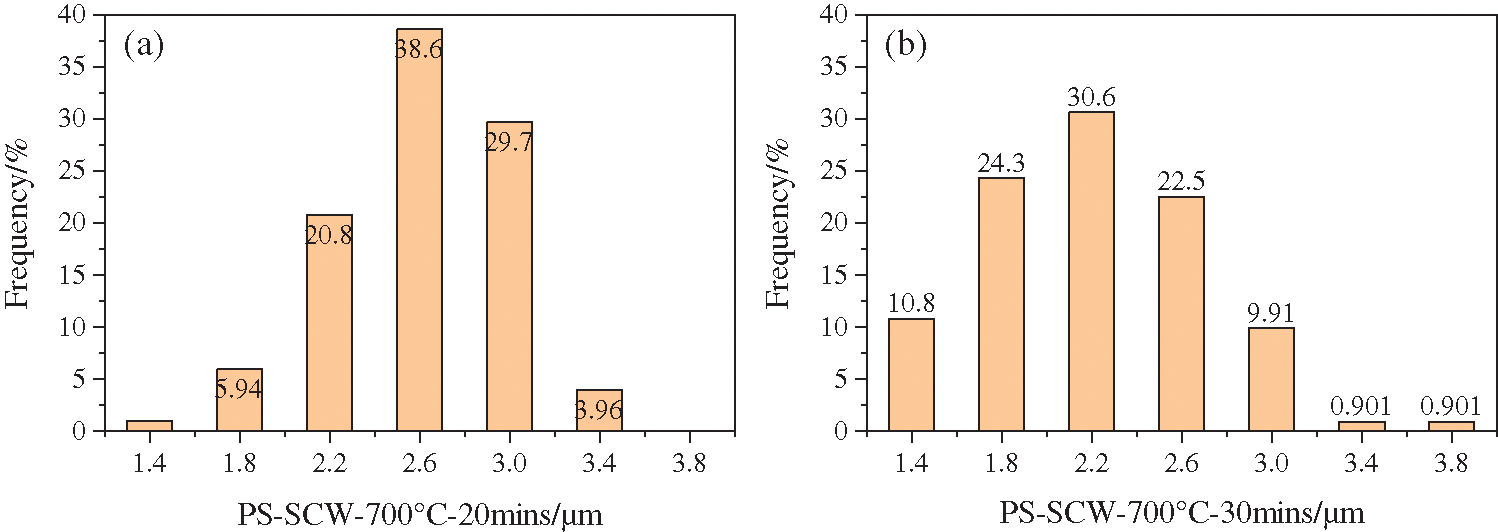
Figure 12: Particle size distribution of carbon spheres produced from PS processed in SCW for different time; (a) 20 min; (b) 30 min
When the CA and the average diameters were put together for comparison (Fig. 13), it showed that in experiments when time was set as the variable, the hydrophobic performance of coated surface became better as the carbon spheres shrank.
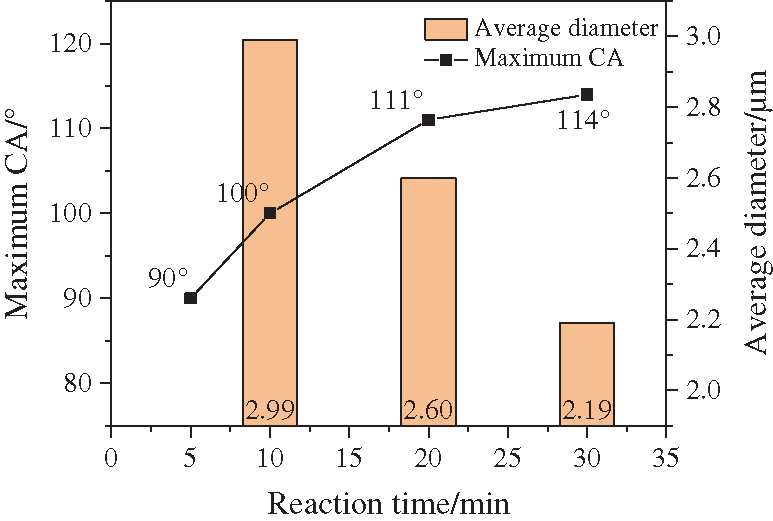
Figure 13: Comparison between CA and average diameter in series experiments of time variable
Besides of temperature and time variable, polycarbonate (PC) and polyethylene (PE) were chosen as feedstocks to repeat the experiment and SEM characterization, in order to explore some other factors that affect the hydrophobic performance. As shown in Fig. 14, the images of PS and PE were obviously similar, both filled with single spherical carbons and a little bit layered one. By the way, the CA on coated surface were 100° for PS and 90° for PE, respectively, both at the same standard. As for the PC sample, of which the CA was 124°C, much higher than that of PS and PE. Besides, the micro-structure of PC sample was also totally different, from the image we could see a roughly shape of spherical carbon, attaching to each other, into a mountainlike appearance. This difference might be caused by the high oxygen content in elemental analysis, see in SI Tab A1.
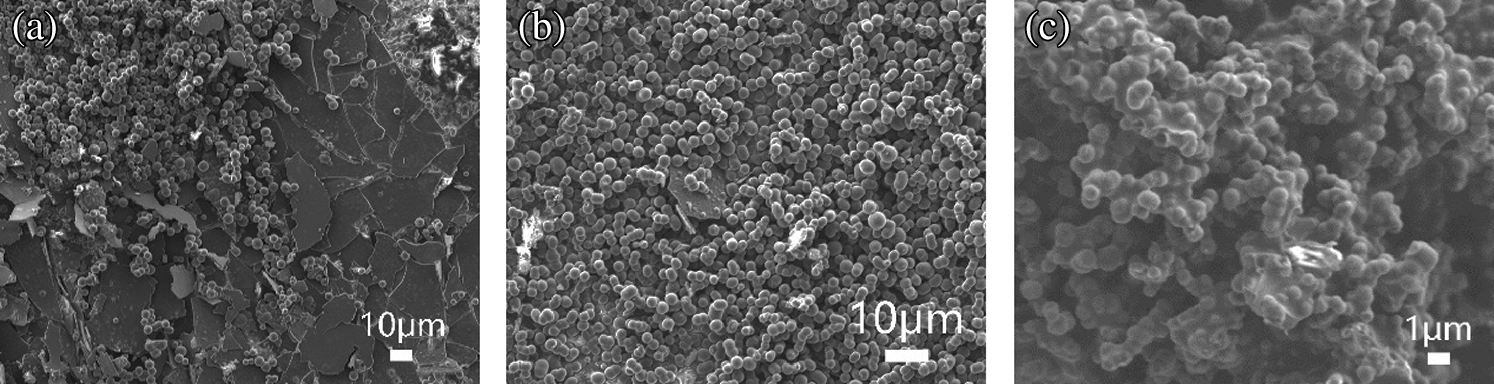
Figure 14: SEM characterization images of plastics processed in 23 MPa, 700°C SCW for 10 mins; (a) PS; (b) PE; (c) PC
The special micro-structure of PC sample reminded us of the lotus surface, which was considered to be the representative of two-level wax surface structure [51]. There are quantities of micron-level waxy papillae on the surface of the lotus leaf, while on the papillae there are a big amount of nanoscale burrs, which helps reduce both the contact area and the energy of the surface, making it superhydrophobic. Also, Qu et al. [52] reported a method to fabricate large-scale superhydrophobic surface by collecting the rapeseed oil smoke. They reported the SEM images of the surface as a moniliform structure, were similar to our mountainlike shape, to some extent.
Accordingly, when considering the factors that could affect the hydrophobicity of the surface, beside of the content and scale of carbon spheres, the geometric structure also mattered a lot. The sample with binary geometric structure usually performs better than those without, for helping trap more air to prevent the penetration of the water droplet into the cavities, improving the hydrophobicity.
The solid product made from different feedstocks processed in 23 MPa 700°C SCW were grinded into powder together with KBr and analyzed by Bruker Vetex70 infrared spectrometer. As shown in Fig. 15, peaks observed at around 3000 cm−1 (3080 cm−1, 3060 cm−1, 3024 cm−1, 2292 cm−1 and 2850 cm−1) certified the existence of =CH– and –CH2– groups, which were the compositions of the main chains of PS. In the curve of SCW treated PS, those vibrations were missing (framed portions), demonstrating that after supercritical hydrothermal reaction, the high polymer was broken into pieces, left with aromatic compounds (at the peak positions of 1563 cm−1, 1433 cm−1). When we treated styrene under the same condition, it turned out to be the similar products to that of PS, indicating that the hydrothermal treatment would lead to the depolymerization and structural rearrangement of polymers [53].
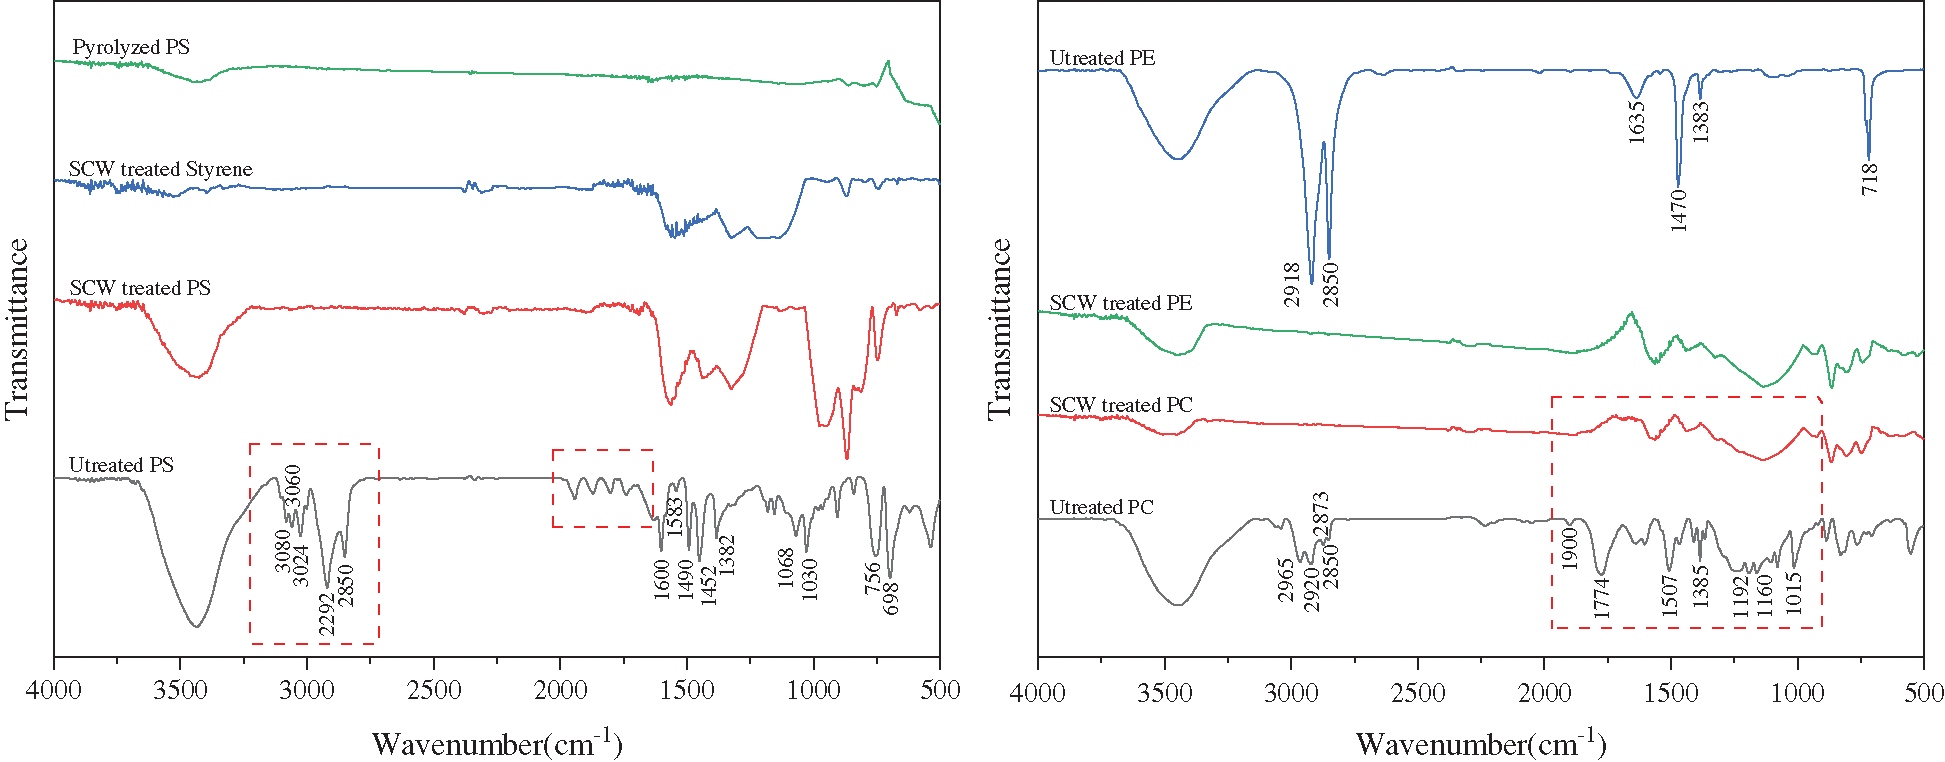
Figure 15: The results of FTIR spectrum of feedstocks and the products
And the same happened to plastics PC and PE, the main chains of the polymers were broken during the conversion, and the left products were seemed to have aromatic structures similarly. Combining existing reports [54], the solid products from SCW processed plastics were considered to be mesocarbon microbeads (MCMB) [55], which are a series of mid-products of pyrolysis and carbonization of polycyclic aromatic hydrocarbons. During the hydrothermal conversions, water played an essential role in the depolymerization process and the formation of carbon spheres [56,57].
In summary, this work was carried out to propose a feasible methodology to reuse plastic wastes. Actually, the feedstocks employed in the experiments were pure standard plastics instead of wasted ones, because simplified models could help to reach convincing rules. Combining Bai et al. [36,39,46,47] researches, plastics after treated through supercritical water gasification (SCWG), hydrogen-rich gases were produced, and the same time toxic gases like dioxins that produced with incineration were avoided. Therefore, this is a harmless way to dispose plastics. For the next stage of research, plastics mixture and real plastic wastes would be employed in our research to see if it really works with this problem, and measures would be taken like additives to further enhance the hydrophobicity of the carbon spheres coated surface. Anyway, the present research would not only be helpful in the discussion of plastic reuse, but also provide a new idea in fabricate hydrophobic surface.
In this paper, quartz tube was chosen as the reactor, and the base of hydrophobic coating at the same time, in order to get a well-coated surface made from carbon microspheres. The CA of droplets was the evaluation scale of the hydrophobicity of a surface. Besides, Micro characterization info was provided, and some specific details are as follows:
SCW could be an essential factor in the formation of CSs, because in the sample of straightly pyrolyzed PS there were only irregular-shaped carbons found, while processed in SCW, evenly coated surface was obtained.
When PS, PC and PE were in 23 MPa SCW, as the temperature rose, the content of spherical carbon in the solid product increased. When it was 600°C, layered carbon took the dominant place, and there was a trend that spheres were nucleating and growing. When it was 800°C, over 99% of the solid product were carbon spheres with a diameter ranged from 2.6 to 3.4 μm.
When setting the same temperature, as the time prolonged from 10 to 30 mins, though the content of spherical carbons and layered ones kept roughly constant, the size of CSs shrank obviously, dropped from 2.99 to 2.19 μm, bringing with a slight improvement of CA from 100° to 114°.
Sphere scale and the geometric structure could be the two main influencing factors of the hydrophobicity of the coated surface. According to the results, larger CA usually comes along with smaller size of carbon spheres, e.g., the sample with a smallest diameter of 2.09 μm was found out to have the largest CA of 145°. Under 23 MPa 700°C SCW condition, the CA on the surface made from PC was 124°, much higher than 100° of PS. Because the CSs were attaching to each other, making it a binary geometric structure, which helped further improve the hydrophobicity [52].
Funding Statement: This work is supported by the National Key R&D Program of China (2020YFA0714400), and Shaanxi Science & Technology Co-ordination & Innovation Project (2021GY-164).
Conflicts of Interest: The authors declare that they have no conflicts of interest to report regarding the present study.
1. Andrady, A. L., Neal, M. A. (2009). Applications and societal benefits of plastics. Philosophical Transactions of the Royal Society B: Biological Sciences, 364(1526), 1977–1984. DOI 10.1098/rstb.2008.0304. [Google Scholar] [CrossRef]
2. Cole, M., Lindeque, P., Halsband, C., Galloway, T. S. (2011). Microplastics as contaminants in the marine environment: A review. Marine Pollution Bulletin, 62(12), 2588–2597. DOI 10.1016/j.marpolbul.2011.09.025. [Google Scholar] [CrossRef]
3. Auta, H. S., Emenike, C. U., Fauziah, S. H. (2017). Distribution and importance of microplastics in the marine environment: A review of the sources, fate, effects, and potential solutions. Environment International, 102 165–176. DOI 10.1016/j.envint.2017.02.013. [Google Scholar] [CrossRef]
4. Arthur, C., Baker, J., Bamford, H. (2008). Proceedings of the international research workshop on the occurrence, effects, and fate of microplastic marine debris. University of Washington Tacoma, Tacoma, WA, USA. [Google Scholar]
5. La Daana, K. K., Officer, R., Lyashevska, O., Thompson, R. C., O’Connor, I. (2017). Microplastic abundance, distribution and composition along a latitudinal gradient in the Atlantic Ocean. Marine Pollution Bulletin, 115(1–2), 307–314. DOI 10.1016/j.marpolbul.2016.12.025. [Google Scholar] [CrossRef]
6. Geyer, R., Jambeck, J. R., Law, K. L. (2017). Production, use, and fate of all plastics ever made. Science Advances, 3(7), e1700782. DOI 10.1126/sciadv.1700782. [Google Scholar] [CrossRef]
7. Matei Ghimbeu, C., Vidal, L., Delmotte, L., Le Meins, J. M., Vix-Guterl, C. (2014). Catalyst-free soft-template synthesis of ordered mesoporous carbon tailored using phloroglucinol/glyoxylic acid environmentally friendly precursors. Green Chemistry, 16(6), 3079–3088. DOI 10.1039/c4gc00269e. [Google Scholar] [CrossRef]
8. Demir-Cakan, R., Baccile, N., Antonietti, M., Titirici, M. M. (2009). Carboxylate-rich carbonaceous materials via one-step hydrothermal carbonization of glucose in the presence of acrylic acid. Chemistry of Materials, 21(3), 484–490. DOI 10.1021/cm802141h. [Google Scholar] [CrossRef]
9. Miao, J. Y., Hwang, D. W., Chang, C. C., Lin, S. H., Narasimhulu, K. V. et al. (2003). Uniform carbon spheres of high purity prepared on kaolin by CCVD. Diamond and Related Materials, 12(8), 1368–1372. DOI 10.1016/S0925-9635(03)00109-2. [Google Scholar] [CrossRef]
10. Miao, J. Y., Hwang, D. W., Narasimhulu, K. V., Lin, P. I., Chen, Y. T. et al. (2004). Synthesis and properties of carbon nanospheres grown by CVD using kaolin supported transition metal catalysts. Carbon, 42(4), 813–822. DOI 10.1016/j.carbon.2004.01.053. [Google Scholar] [CrossRef]
11. Yang, C. M., Weidenthaler, C., Spliethoff, B., Mayanna, M., Schüth, F. (2005). Facile template synthesis of ordered mesoporous carbon with polypyrrole as carbon precursor. Chemistry of Materials, 17(2), 355–358. DOI 10.1021/cm049164v. [Google Scholar] [CrossRef]
12. He, X., Wu, F., Zheng, M. (2007). The synthesis of carbon nanoballs and its electrochemical performance. Diamond and Related Materials, 16(2), 311–315. DOI 10.1016/j.diamond.2006.06.011. [Google Scholar] [CrossRef]
13. Fitzer, E., Schaefer, W., Yamada, S. (1969). The formation of glasslike carbon by pyrolysis of polyfurfuryl alcohol and phenolic resin. Carbon, 7(6), 643–648. DOI 10.1016/0008-6223(69)90518-1. [Google Scholar] [CrossRef]
14. Jin, Y. Z., Gao, C., Hsu, W. K., Zhu, Y., Huczko, A. et al. (2005). Large-scale synthesis and characterization of carbon spheres prepared by direct pyrolysis of hydrocarbons. Carbon, 43(9), 1944–1953. DOI 10.1016/j.carbon.2005.03.002. [Google Scholar] [CrossRef]
15. Bergius, F. (1913). Production of hydrogen from water and coal from cellulose at high temperatures and pressures. Journal of the Society of Chemical Industry, 32(9), 462–467. DOI 10.1002/(ISSN)1934-9971. [Google Scholar] [CrossRef]
16. Kruse, A., Dahmen, N. (2015). Water–A magic solvent for biomass conversion. The Journal of Supercritical Fluids, 96, 36–45. DOI 10.1016/j.supflu.2014.09.038. [Google Scholar] [CrossRef]
17. Wang, Q., Li, H., Chen, L., Huang, X. (2001). Monodispersed hard carbon spherules with uniform nanopores. Carbon, 39(14), 2211–2214. DOI 10.1016/S0008-6223(01)00040-9. [Google Scholar] [CrossRef]
18. Sevilla, M., Fuertes, A. B. (2009). Chemical and structural properties of carbonaceous products obtained by hydrothermal carbonization of saccharides. Chemistry—A European Journal, 15(16), 4195–4203. DOI 10.1002/chem.200802097. [Google Scholar] [CrossRef]
19. Titirici, M. M., Antonietti, M., Baccile, N. (2008). Hydrothermal carbon from biomass: A comparison of the local structure from poly-to monosaccharides and pentoses/hexoses. Green Chemistry, 10(11). DOI 10.1039/b807009a. [Google Scholar] [CrossRef]
20. Hu, B., Wang, K., Wu, L., Yu, S. H., Antonietti, M. et al. (2010). Engineering carbon materials from the hydrothermal carbonization process of biomass. Advanced Materials, 22(7), 813–828. DOI 10.1002/adma.200902812. [Google Scholar] [CrossRef]
21. Yao, C., Shin, Y., Wang, L. Q., Windisch, C. F., Samuels, W. D. et al. (2007). Hydrothermal dehydration of aqueous fructose solutions in a closed system. The Journal of Physical Chemistry C, 111(42), 15141–15145. DOI 10.1021/jp074188l. [Google Scholar] [CrossRef]
22. Zhang, M., Yang, H., Liu, Y., Sun, X., Zhang, D. et al. (2012). Hydrophobic precipitation of carbonaceous spheres from fructose by a hydrothermal process. Carbon, 50(6), 2155–2161. DOI 10.1016/j.carbon.2012.01.024. [Google Scholar] [CrossRef]
23. Wang, Q., Li, H., Chen, L., Huang, X. (2002). Novel spherical microporous carbon as anode material for Li-ion batteries. Solid State Ionics, 152–153, 43–50. DOI 10.1016/S0167-2738(02)00687-2. [Google Scholar] [CrossRef]
24. Sun, X., Li, Y. (2004). Ga2O3 and gaN semiconductor hollow spheres. Angewandte Chemie International Edition, 43(29), 3827–3831. DOI 10.1002/(ISSN)1521-3773. [Google Scholar] [CrossRef]
25. Hu, F. P., Wang, Z., Li, Y., Li, C., Zhang, X. et al. (2008). Improved performance of Pd electrocatalyst supported on ultrahigh surface area hollow carbon spheres for direct alcohol fuel cells. Journal of Power Sources, 177(1), 61–66. DOI 10.1016/j.jpowsour.2007.11.024. [Google Scholar] [CrossRef]
26. Fan, Y., Yang, X., Zhu, B., Liu, P. F., Lu, H. T. (2014). Micro-mesoporous carbon spheres derived from carrageenan as electrode material for supercapacitors. Journal of Power Sources, 268, 584–590. DOI 10.1016/j.jpowsour.2014.06.100. [Google Scholar] [CrossRef]
27. He, X., Ling, P., Qiu, J., Yu, M., Zhang, X. et al. (2013). Efficient preparation of biomass-based mesoporous carbons for supercapacitors with both high energy density and high power density. Journal of Power Sources, 240, 109–113. DOI 10.1016/j.jpowsour.2013.03.174. [Google Scholar] [CrossRef]
28. Yan, A., Lau, B. W., Weissman, B. S., Külaots, I., Yang, N. Y. C. et al. (2006). Biocompatible, hydrophilic, supramolecular carbon nanoparticles for cell delivery. Advanced Materials, 18(18), 2373–2378. DOI 10.1002/(ISSN)1521-4095. [Google Scholar] [CrossRef]
29. Cui, X., Antonietti, M., Yu, S. H. (2006). Structural effects of iron oxide nanoparticles and iron ions on the hydrothermal carbonization of starch and rice carbohydrates. Small, 2(6), 756–759. DOI 10.1002/(ISSN)1613-6829. [Google Scholar] [CrossRef]
30. Joula, M. H., Farbod, M. (2015). Synthesis of uniform and size-controllable carbon nanospheres by a simple hydrothermal method and fabrication of carbon nanosphere super-hydrophobic surface. Applied Surface Science, 347, 535–540. DOI 10.1016/j.apsusc.2015.04.118. [Google Scholar] [CrossRef]
31. Safonov, A. I., Kuznetsov, D. V., Surtaev, A. S. (2020). Fabrication of hydrophobic coated tubes for boiling heat transfer enhancement. Heat Transfer Engineering, 1–14. DOI 10.1080/01457632.2020.1794632. [Google Scholar] [CrossRef]
32. Wang, Y., Wang, W., Zhong, L., Wang, J., Jiang, Q. et al. (2010). Super-hydrophobic surface on pure magnesium substrate by wet chemical method. Applied Surface Science, 256(12), 3837–3840. DOI 10.1016/j.apsusc.2010.01.037. [Google Scholar] [CrossRef]
33. Liu, Y., Yin, X., Zhang, J., Wang, Y., Han, Z. et al. (2013). Biomimetic hydrophobic surface fabricated by chemical etching method from hierarchically structured magnesium alloy substrate. Applied Surface Science, 280, 845–849. DOI 10.1016/j.apsusc.2013.05.072. [Google Scholar] [CrossRef]
34. Kwon, M. H., Shin, H. S., Chu, C. N. (2014). Fabrication of a super-hydrophobic surface on metal using laser ablation and electrodeposition. Applied Surface Science, 288, 222–228. DOI 10.1016/j.apsusc.2013.10.011. [Google Scholar] [CrossRef]
35. Zhang, C., Wu, Y., Liu, L. (2012). Robust hydrophobic Fe-based amorphous coating by thermal spraying. Applied Physics Letters, 101(12), 121603. DOI 10.1063/1.4754140. [Google Scholar] [CrossRef]
36. Bai, B., Liu, Y., Wang, Q., Zou, J., Zhang, H. et al. (2019). Experimental investigation on gasification characteristics of plastic wastes in supercritical water. Renewable Energy, 135, 32–40. DOI 10.1016/j.renene.2018.11.092. [Google Scholar] [CrossRef]
37. Wang, C., Zhu, C., Cao, W., Wei, W., Jin, H. (2021). Catalytic mechanism study on the gasification of depolymerizing slag in supercritical water for hydrogen production. International Journal of Hydrogen Energy, 46(3), 2917–2926. DOI 10.1016/j.ijhydene.2020.06.061. [Google Scholar] [CrossRef]
38. Wang, C., Zhu, C., Huang, J., Li, L., Jin, H. (2021). Enhancement of depolymerization slag gasification in supercritical water and its gasification performance in fluidized bed reactor. Renewable Energy, 168, 829–837. DOI 10.1016/j.renene.2020.12.104. [Google Scholar] [CrossRef]
39. Cao, C., Bian, C., Wang, G., Bai, B., Xie, Y. et al. (2020). Co-gasification of plastic wastes and soda lignin in supercritical water. Chemical Engineering Journal, 388, 124277. DOI 10.1016/j.cej.2020.124277. [Google Scholar] [CrossRef]
40. Thomason, T. B., Modell, M. (1984). Supercritical water destruction of aqueous wastes. Hazardous Waste, 1(4), 453–467. DOI 10.1089/hzw.1984.1.453. [Google Scholar] [CrossRef]
41. Peterson, A. A., Vogel, F., Lachance, R. P., Fröling, M., Antal, J. M. J. et al. (2008). Thermochemical biofuel production in hydrothermal media: A review of sub- and supercritical water technologies. Energy & Environmental Science, 1(1), 32. DOI 10.1039/b810100k. [Google Scholar] [CrossRef]
42. Ding, W., Shi, J., Wei, W., Cao, C., Jin, H. (2021). A molecular dynamics simulation study on solubility behaviors of polycyclic aromatic hydrocarbons in supercritical water/hydrogen environment. International Journal of Hydrogen Energy, 46(3), 2899–2904. DOI 10.1016/j.ijhydene.2020.05.084. [Google Scholar] [CrossRef]
43. Jin, H., Wang, H., Wu, Z., Ge, Z., Chen, Y. (2021). Numerical investigation of the effect of surface roughness on flow and heat transfer characteristics of single sphere particle in supercritical water. Computers & Mathematics with Applications, 81, 562–572. DOI 10.1016/j.camwa.2019.10.011. [Google Scholar] [CrossRef]
44. Jin, H., Wang, Y., Wang, H., Wu, Z., Li, X. (2021). Influence of stefan flow on the drag coefficient and heat transfer of a spherical particle in a supercritical water cross flow. Physics of Fluids, 33(2), 023313. DOI 10.1063/5.0041572. [Google Scholar] [CrossRef]
45. Bai, B., Jin, H., Zhu, S., Wu, P., Fan, C. et al. (2019). Experimental investigation on in-situ hydrogenation induced gasification characteristics of acrylonitrile butadiene styrene (ABS) microplastics in supercritical water. Fuel Processing Technology, 192, 170–178. DOI 10.1016/j.fuproc.2019.04.020. [Google Scholar] [CrossRef]
46. Bai, B., Liu, Y., Meng, X., Liu, C., Zhang, H. et al. (2020). Experimental investigation on gasification characteristics of polycarbonate (PC) microplastics in supercritical water. Journal of the Energy Institute, 93(2), 624–633. DOI 10.1016/j.joei.2019.06.003. [Google Scholar] [CrossRef]
47. Bai, B., Liu, Y., Zhang, H., Zhou, F., Han, X. et al. (2020). Experimental investigation on gasification characteristics of polyethylene terephthalate (PET) microplastics in supercritical water. Fuel, 262, 1–8. DOI 10.1016/j.fuel.2019.116630. [Google Scholar] [CrossRef]
48. Wenzel, R. N. (1936). Resistance of solid surfaces to wetting by water. Industrial & Engineering Chemistry, 28(8), 988–994. DOI 10.1021/ie50320a024. [Google Scholar] [CrossRef]
49. Cassie, A. B. D., Baxter, S. (1944). Wettability of porous surfaces. Transactions of the Faraday Society, 40, 546–551. DOI 10.1039/tf9444000546. [Google Scholar] [CrossRef]
50. Extrand, C. W. (2003). Contact angles and hysteresis on surfaces with chemically heterogeneous islands. Langmuir, 19(9), 3793–3796. DOI 10.1021/la0268350. [Google Scholar] [CrossRef]
51. Cheng, Y. T., Rodak, D. E. (2005). Is the lotus leaf superhydrophobic? Applied Physics Letters, 86(14), DOI 10.1063/1.1895487. [Google Scholar] [CrossRef]
52. Qu, M., He, J., Cao, B. (2010). Facile fabrication of large-scale stable superhydrophobic surfaces with carbon sphere films by burning rapeseed oil. Applied Surface Science, 257(1), 6–9. DOI 10.1016/j.apsusc.2010.05.011. [Google Scholar] [CrossRef]
53. Zhao, H., Lu, X., Wang, Y., Sun, B., Wu, X. et al. (2017). Effects of additives on sucrose-derived activated carbon microspheres synthesized by hydrothermal carbonization. Journal of Materials Science, 52(18), 10787–10799. DOI 10.1007/s10853-017-1258-4. [Google Scholar] [CrossRef]
54. Mi, Y., Hu, W., Dan, Y., Liu, Y. (2008). Synthesis of carbon micro-spheres by a glucose hydrothermal method. Materials Letters, 62(8), 1194–1196. DOI 10.1016/j.matlet.2007.08.011. [Google Scholar] [CrossRef]
55. Li, H. X., Zhang, X., Wang, Q., Zhang, K., Cao, Q. et al. (2018). Preparation of the recycled and regenerated mesocarbon microbeads-based solid acid and its catalytic behaviors for hydrolysis of cellulose. Bioresource Technology, 270, 166–171. DOI 10.1016/j.biortech.2018.09.037. [Google Scholar] [CrossRef]
56. Sevilla, M., Fuertes, A. B. (2009). The production of carbon materials by hydrothermal carbonization of cellulose. Carbon, 47(9), 2281–2289. DOI 10.1016/j.carbon.2009.04.026. [Google Scholar] [CrossRef]
57. Shen, Y., Wu, H., Pan, Z. (2012). Co-liquefaction of coal and polypropylene or polystyrene in hot compressed water at 360–430°C. Fuel Processing Technology, 104, 281–286. DOI 10.1016/j.fuproc.2012.05.023. [Google Scholar] [CrossRef]
 | This work is licensed under a Creative Commons Attribution 4.0 International License, which permits unrestricted use, distribution, and reproduction in any medium, provided the original work is properly cited. |