DOI:10.32604/jrm.2021.011678
| Journal of Renewable Materials DOI:10.32604/jrm.2021.011678 | |
| Article |
The Dynamic Experiment on Treating Acid Mine Drainage with Iron Scrap and Sulfate Reducing Bacteria Using Biomass Materials as Carbon Source
1College of Civil Engineering, Liaoning Technical University, Fuxin, 123000, China
2School of Mechanics and Engineering, Liaoning Technical University, Fuxin, 123000, China
3Fuxin Pingan Mining Co., Ltd., Fuxin, 123000, China
*Corresponding Author: Junzhen Di. Email: dijunzhen@126.com
Received: 23 May 2020; Accepted: 03 August 2020
Abstract: The study is aimed at the problem of high content of Cr6+, Cr3+ and SO42– is high and low pH value in acid mine drainage (AMD). Moreover, treatment of AMD by sulfate reducing bacteria (SRB) requires the addition of carbon source, while the treating effectiveness is not good enough on its own. The sugarcane slag, the corn cob and the sunflower straw were selected as the SRB carbon source cooperating with iron scrap to construct the dynamic columns 1, 2 and 3. The mechanism of removing Cr6+, Cr3+, SO42– and H+ and the regularity of sustained release of carbon source and TFe release was studied in AMD. The removal efficiency of heavy metal ions, the ability of sustained release of carbon source, and the ability of adjusting acid by the three dynamic columns were compared. The result shows that the average removal rates of Cr6+, Cr3+ and SO42– in effluent of dynamic column 1, filled by sugarcane slag, iron scrap and SRB, were 96.9%, 67.1% and 54.3%. The average release of TFe and chemical oxygen demand (COD) were 4.4 and 287.3 mg/L. Its average pH was 6.98. Compared with the performance of dynamic columns 1, 2 and 3, dynamic column 1 performed best in removing Cr6+, Cr3+ and SO42– from AMD and controlling the release of COD and TFe, adjusting the pH of the solution. The study is of significance in treatment of AMD by taking for biomass materials as SRB carbon source in cooperation with iron scrap.
Keywords: Biomass material; sulfate reducing bacteria; acid mine drainage; iron scrap
 | This work is licensed under a Creative Commons Attribution 4.0 International License, which permits unrestricted use, distribution, and reproduction in any medium, provided the original work is properly cited. |
AMD has the characteristics of extremely low pH value (usually between 2 and 4), high concentration of sulfate and heavy metal ions. The wanton emission of AMD will destroy the hydrogeological environment and ecosystems in the surrounding area of the mine. This will also aggravate the problem of water supply around the coal mining area. At present, AMD was treated mainly by the methods of neutralization and precipitation [1], constructed wetland method [2], adsorption [3] and microbial method [4]. Although neutralization precipitation method can remove heavy metal ions in water quickly and easily, it consumes a large amount of chemical reagents. The method will produce more pollutants again. Its effect of low concentration of wastewater treatment is poor and the effluent concentration of heavy metal ions is higher [5]. The constructed wetland method cannot be widely used because it covers larger area, the treatment effect is easily affected by the environment, the hydrogen sulfide treatment is not thorough and the residual gas pollutes the environment [6]. Taking advantage of multi-pores of materials, adsorption method treats AMD by adsorbing a variety of substances in water [7]. Natural biomass materials, such as corn stalks, peanut shells, and straw can adsorb heavy metal ions from water and adjust pH. With the characteristics of low cost and non-toxicity, the method is widely used in water treatment [8]. However, it leads to excessive COD effluent easily. Microbial method is the new and hot topic of current research. This method has the advantages of low cost and no secondary pollution. This technology can produce both environmental and social benefits as well as certain economic benefits. SRB has become the predominant organism among the various microbials of restoring AMD since SRB has the advantages of low cost, strong practicality, no secondary pollution and recyclable elemental sulfur [9]. SRB, a prokaryotic microorganism that lives in an anaerobic environment, can make organism restore SO42– into sulfide, which in return can remove SO42– and heavy metal. However, sufficient carbon source is required in treating AMD with SRB to ensure biological activity and treatment effect. Therefore, this study combined both the adsorption method and the biological method. In the process, SRB makes full use of the organic materials released by the hydrolysis of biomass materials. This not only guarantees the biological metabolic capacity of SRB, but also improves the removal effect of each pollutant ion in AMD. What’s more, it prevents the secondary pollution.
SRB needs sufficient carbon source to ensure its biological activity in treating AMD. To date, more than 100 materials have been found to provide carbon source for SRB. It mainly contains two major types of substances: organic compounds (including sodium lactate, ethanol, glucose, etc.) and biomass materials (including sawdust, sawdust, straw, etc.). Some problems, such as excessive COD concentration in the early effluent and the subsequent lack of carbon source, may appear if organic compounds are used as carbon source. However, biomass materials can provide stable carbon source for SRB through sustained release of carbon source [10]. It is reported that pure biomass materials are hard to be used by SRB. CoCos found that the biomass carbon source could be rarely degraded in the early 41 days in the experiment [11]. Used solid waste as the main carbon source material, Chang found that the sulfate reduction rate began to increase after 140 days [12]. Therefore, it is of great significance to seek an economical, stable biomass material which can be easily utilized by SRB as a sustained-release carbon source in treating AMD. It is reported that TOC in the leachate of bagasse, straw, peanut shell and sawdust accounts for over 90% on average [13], which lives up to the basic condition of organic materials as carbon source, and restores pollutant from AMD efficiently [14,15]. However, the effect is not certain yet for SRB to restore AMD since there is not enough research of low-cost and high-efficiency biomass materials. The author thinks that the bagasse, corncob and sunflower straw could be used as carbon source of SRB, based on the carbon source dissolution of biomass materials. The carbon source of biomass materials for SRB can be optimized by comparing with remediation effect of AMD. The iron scrap is lively in the nature and it has strong reducibility and can provide the required electrical for microbial metabolism [16]. However, it is easily covered by oxide film on the surface. Furthermore, it can product junction and agglomeration with treating AMD alone. Those traits are not conducive to long-term reaction, and Fe2+ and Fe3+ produced in the reaction are easy to cause secondary pollution [17]. As a result, the organic combination between iron scrap and SRB can improve the pH of AMD and reduce the inhibition against SRB in the acid environment, by the reducibility of iron scrap. Furthermore, Fe2+ and Fe3+, transformed from iron scrap, reacted with H2S which are metabolized by SRB to form sulfide precipitation. The result above reduces the harm of H2S to SRB, and prevents the secondary pollution of Fe2+ and Fe3+.
Therefore, three biomass materials, including sugarcane slag, corn cob and sunflower straw, as SRB carbon sources were selected in the study. The experimental device of dynamic column, filled with biomass materiel, iron scrap and SRB, was constructed to treat AMD. Through studying the effects and regulation of removing heavy metal ions, the ability of sustained release of carbon source and adjusting acidity, to analyze the feasibility and effectiveness of biomass materials as SRB carbon source in cooperation with iron scrap. The results of this study will be significant to the ecological rehabilitation of AMD.
2.1 Experimental Materials and Water Samples
The sugarcane slag used in the experiment was taken from a sugar mill in Yunnan Province. The corn cob and sunflower straw were taken from Fuxin local farmland. Biomass materials were washed with sterile deionized water, crushed and sieved. Iron scrap, taken from the school training factory, washed with acid of low concentrations and then washed with sterile deionized water. It was dried, ground and screened.
According to the optimized data of single factor and orthogonal before the experiment, the dynamic columns were designed. The dynamic column 1 was filled with 32 mesh sugarcane slag and 60 mesh iron scrap, the mass percentage of them being 2.1% and 97.9%, respectively. The dynamic column 2 was filled with 32 mesh corn cob and 60 mesh iron scrap, the mass percentage of them being 6.6% and 93.4%, respectively. The dynamic column 3 was filled with 10 mesh sunflower straw and 60 mesh iron scrap, the mass percentage of them being 0.9% and 99.1%, respectively.
The concentration of SO42–, Cr6+ and Cr3+ were 800–900, 8–10 and 20–25 mg/L respectively and the pH value ranged from 4.0 to 4.5 in simulated AMD.
SRB [18]: Take the wet mud under one of the coal gangue piles in Fuxin City as seed sludge, and put it into Starkey medium for anaerobic culture to obtain SRB. The SRB (NCBI accession number: MT804386) obtained belongs to Desulfotomaculum and the 16S rDNA sequence is:
TGGGGAATCTTCCGCAATGGACGAAAGCCTGACGGAGCAACGCCGCGTGAGGGAAGAAGGCCTTCGGGTTGTAAACCTCTGTCCTAAAGGAAGAAAGAAATGACGGTACTTTAGGAGGAAGCCCCGGCTAACTACGTGCCAGCAGCCGCGGTAAGACGTAGGGGGCAAGCGTTGTCCGGAATTACTGGGCGTAAAGGGCGCGTAGGTGGTCCATTAAGTTAGAGGTGAAAGTGCGGGGCTTAACCCCGTTATTGCCTCTCATACTGGTGGACTTGAGTGCTGGAGAGGGGAGTGGAATTCCCACTGTAGCGGTGAAATGCGTAGAGATTGGGAGGAACACTAGTGGCGAAGGCGGCTCTCTGGACTGCAACTGACACTGAGGCGCGAAAGCGTGGGGAGCAAACAGG.
2.2 Experimental Apparatus and Method
Three Plexiglas’s tubes with 500 mm height and 80 mm internal diameter were used as the experimental dynamic columns. The quartz sand layer with 50 mm height and 3–5 mm diameter, mixture (iron scrips and biomass material) layer with 200 mm height and quartz sand layer with 50 mm height and 3–5 mm diameter were filled in the columns in order. The three dynamic columns are injected with the equal amount of SRB and Starkey broth, that is, 2 L SRB at the concentration of 1 × 10⁶/mL and 1 L Starkey medium. Incubated the columns in a constant temperature water bath at 37°C for one week until the surface of the biomass material and the iron scrap were covered with a layer of black SRB biofilm. The water was injected from bottom with the peristaltic pump and flew out from the top. The influent flow rate, controlled by a flowmeter, was 0.7 mL/min. The experimental device was shown in Fig. 1. The hydraulic retention time of the three dynamic columns was all 24 h. The devices ran continuously for 30 d.
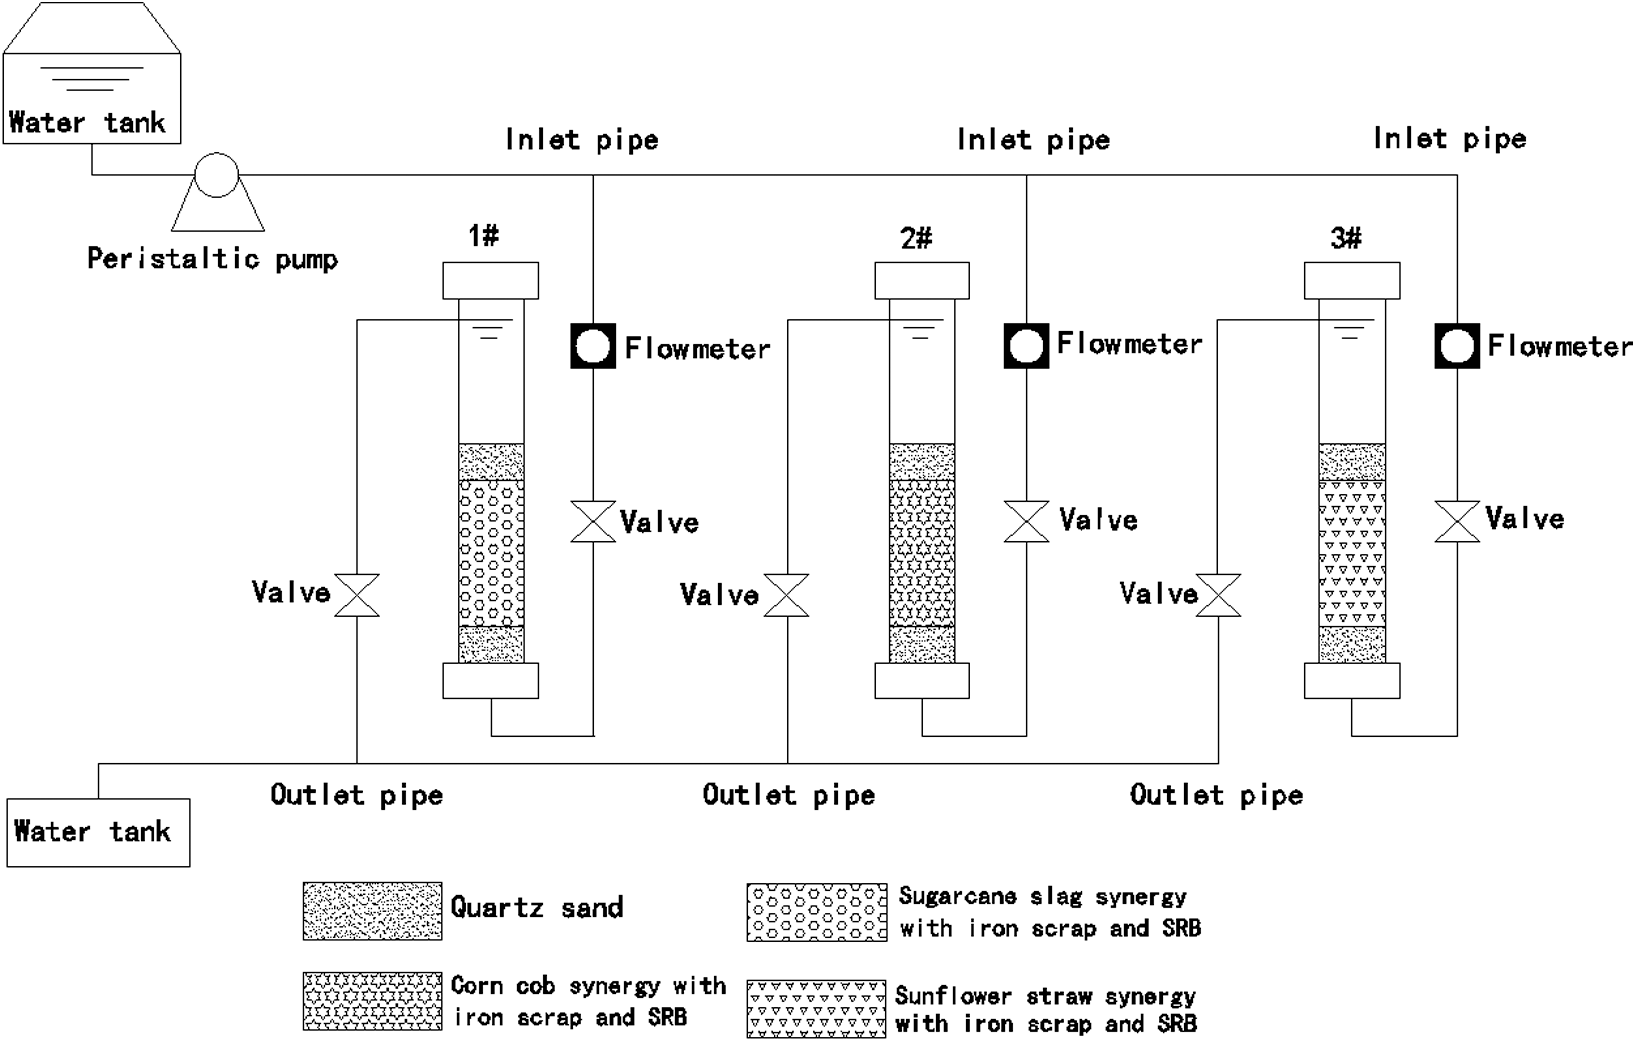
Figure 1: Dynamic experimental device
The concentration of Cr6+ was measured by diphenyl carbazide spectrophotometry (GB 7467-87), the concentration of Cr3+ was measured by potassium permanganate oxidation-diphenyl carbazide spectrophotometry (GB 7466-87), the concentration of SO42– was measured by barium chromate spectrophotometry (HJ/T 432-2007), the value of pH was measured by glass electrode, and the COD was measured by rapid digestion spectrophotometry (HJ/T 399-2007) [19].
The morphology of the filling sample was observed by ZEISS Sigma 500 scanning electron microscope (SEM), in the meantime the chemical substances on the surface of the filling sample were measured by energy-dispersive X-ray spectroscopy probe (EDS). Phase analysis was carried out by Bruker D8 Advance X-ray Diffraction (XRD) with a scan step of 10°–90°.
3.1 Analysis on the Change Laws of SO42–
The concentration and removal rate of SO42– in the three dynamic columns are shown in Fig. 2. Fig. 2 shows that the average residual amount of SO42– in dynamic columns 1, 2 and 3 were 465.2, 304.4 and 662.8 mg/L and the average removal rates of SO42– were 54.3%, 74.9% and 32.5% respectively. In the initial stage, the SO42– removal rates in three dynamic columns were lower, but their curve of removal rate increased rapidly. The maximum removal rates of SO42– were 58%, 86.2% and 44.1% on the 4th, 6th and 5th days, respectively, and then the removal rate curve show a trend of fluctuation downtrend. The removal process of SO42– is mainly the dissimilation reduction of SRB [20]. In those dynamic columns, the carbon source, which was required for the dissimilatory reduction of SRB, was generated by degradation of the decomposition of natural cellulose and lignin contained using the anaerobic fermentation microorganism [21]. In the initial stage, the microorganisms have poor biological activity due to the poisoning of heavy metal ions and the inhibition of acidity. Therefore, the removal rate of SO42– is lower. The iron scrap in dynamic columns can reduce Cr6+ and adjust acidity, so it can reduce the inhibition of microorganisms by heavy metal ions and acidity [22]. Meanwhile the hydrogen released during the reaction can provide electricity for the growth of microorganisms. Due to rapid recovery of biological activity in the three dynamic columns, the capacity of the dissimilation reduction of SRB was also increased quickly. According to Fig. 6, because of COD release decreased gradually in sugarcane slag, corn cob and sunflower straw and the surface of iron scrap gradually passivated in the three columns [23], the biological activity of SRB decreased gradually. Therefore, the curves of SO42– removal rate were fluctuating downward.
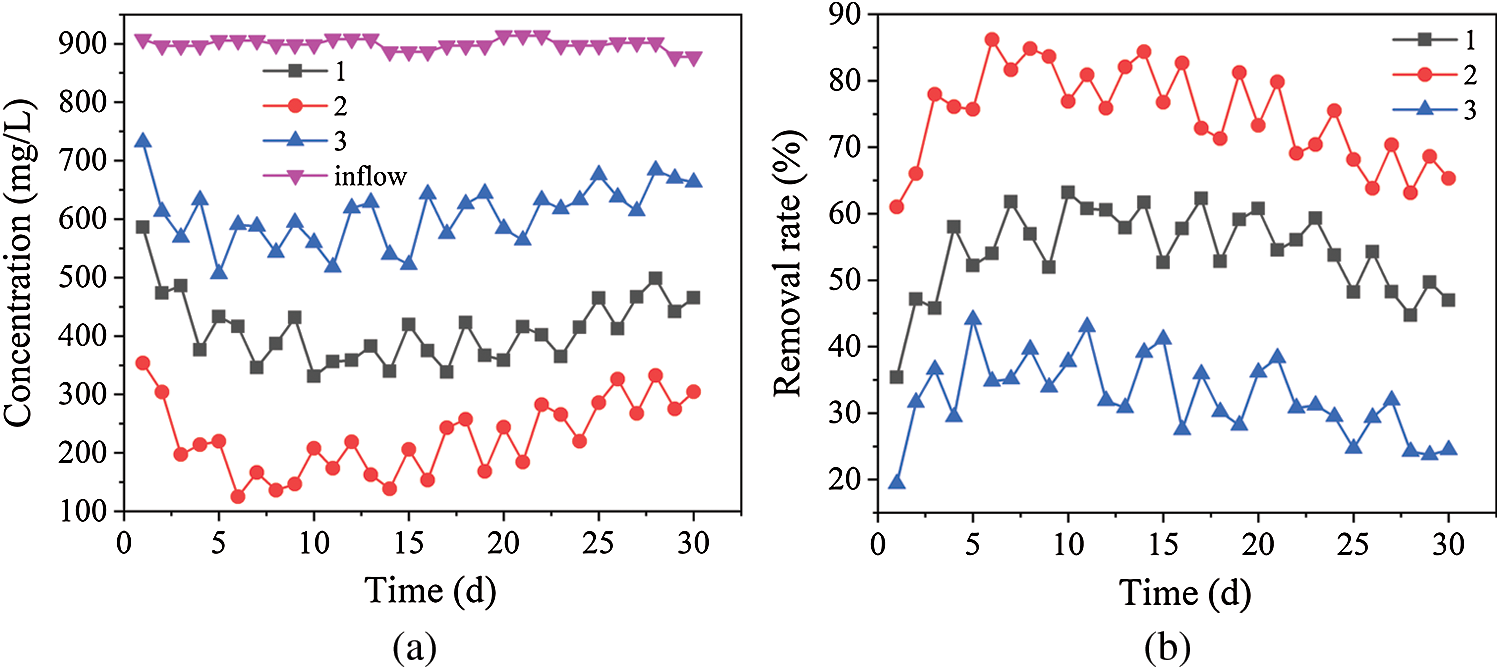
Figure 2: Removal effects of SO42– by dynamic columns 1, 2 and 3. (a) SO42– concentrations in dynamic columns 1, 2 and 3. (b) Removal rates of SO42– by dynamic columns 1, 2 and 3
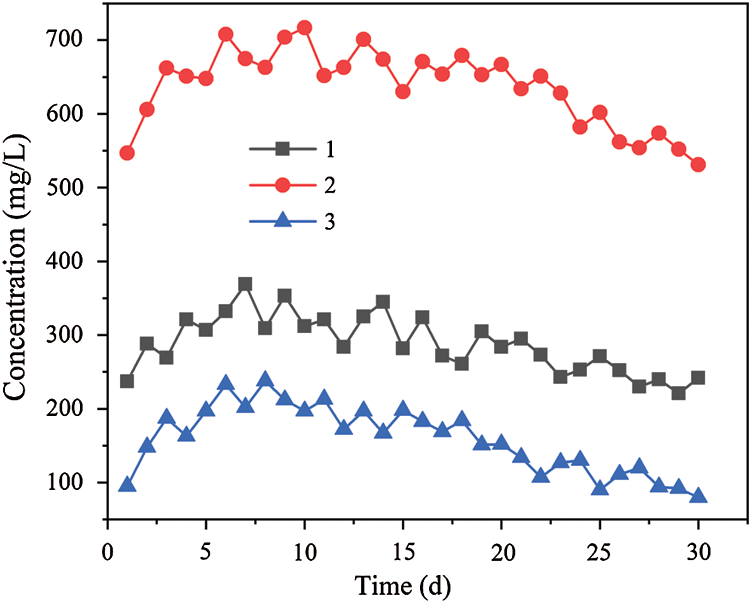
Figure 6: Changes of effluent COD concentration by dynamic columns 1, 2 and 3
3.2 Analysis on the Change Laws of Cr6+
The concentration and removal rate of Cr6+ in the three dynamic columns are shown in Fig. 3. Fig. 3 shows that the average residual amount of Cr6+ were 0.3, 0.4 and 0.5 mg/L and the average removal rates of Cr6+ were 96.9%, 96.1% and 95.2% in dynamic columns 1, 2 and 3, respectively. From the initial stage to the 15th day, the average removal rates of Cr6+ kept a high level in the three dynamic columns, and then the removal rate curves were a trend of fluctuation downtrend, But the scale of downtrend is smaller, the removal rate is more than 92%. The removal process of Cr6+ has three main processes in dynamic columns, the first one is the reduction of iron scrap and their reaction products [22], and the second one is the adsorption of biomass materials and the reduction of their hydrolysate [24]. Thirdly H2S as a metabolite of SRB has a strong reducibility, along with extracellular polymeric substance of SRB both can absorb Cr6+. Due to the stronger reduction ability of iron scrap, high-valent Cr6+ can be rapidly reduced to low-valent Cr3+. At the same time, the FeS generated by the reduction of iron scrap has been proved to be highly capable of removing heavy metals [25]. In addition, EPS generated by SRB contain a great amount of anionic group (carboxyl, hydroxyl and amidogen, etc.), which can improve the combination of cell surface and heavy metal [26,27]. The mercapto group, amino group, amide group and hydroxyl group in sugarcane slag, corn cob and sunflower straw have a strong affinity for heavy metal ions [28]. And its anaerobic fermentation products such as glucose, fructose have the characteristics of reducibility to Cr6+ [29]. Based on the above, the average rate that three dynamic columns remove Cr6+ is higher. Due to the surface passivation of iron scrap, the adsorption of biomass tending to saturation and the decrease of SRB metabolism SO42– ability, the removal ability of Cr6+ was gradually weakened in the three dynamic columns. So the removal rate curves of Cr6+ was a trend of small fluctuations downtrend. Bagasse is capable of absorbing Fe2+ [30]. The studies have shown that the rank of the amount of glucose and fructose produced by unit mass biomass materials is different: bagasse (0.089 g/g), corn cob (0.037 g/g), sunflower straw (0.014 g/g) [31]. The Fe2+ absorbed on the bagasse surface as well as glucose and fructose from anaerobic fermentation conducted a redox reaction with Cr6+, which made the removal rate in dynamic column 1 is slightly better than the ones in dynamic columns 2 and 3.
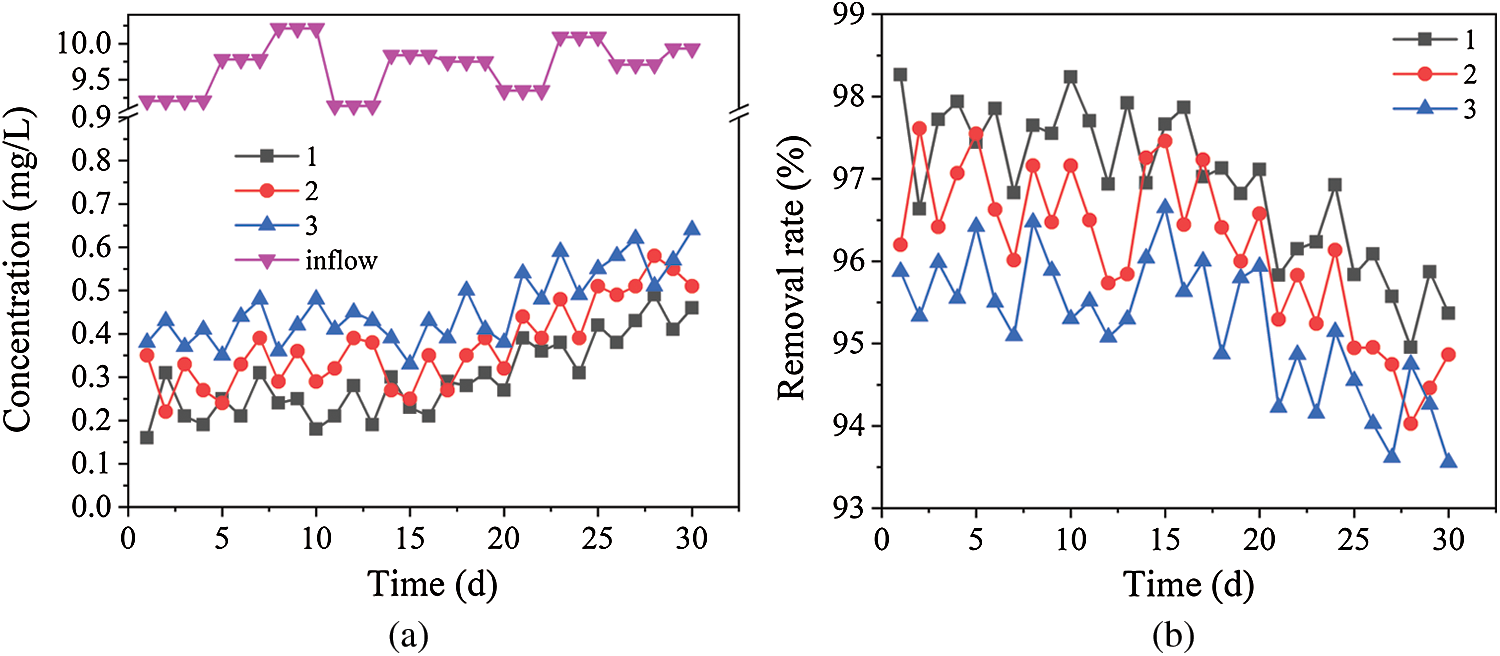
Figure 3: Removal effects of Cr6+ by dynamic columns 1, 2 and 3. (a) Cr6+ concentrations in dynamic columns 1, 2 and 3. (b) Removal rates of Cr6+ by dynamic columns 1, 2 and 3
3.3 Analysis on the Change Laws of Cr3+
The concentration and removal rate of Cr3+ in the three dynamic columns are shown in Fig. 4. Fig. 4 shows that the average residual amount of Cr3+ in dynamic columns 1, 2 and 3 were 6.9, 3.0 and 8.8 mg/L and the average removal rates of Cr3+ were 67.1%, 85.6% and 57.8% respectively. In the initial stage, the removal rate of Cr3+ decreased and then rose rapidly in the three dynamic columns. The maximum removal rates were 74.0%, 91.7% and 63.9% on the 5th days, respectively, and then the removal rate curves were a trend of fluctuation downtrend. The removal process of Cr3+ is mainly the precipitation of S2– by SO42– reduction, at the same time, the reduction process of Cr6+ will generate new Cr3+ [32]. Because the amount of S2– generated was lower due to the lower dissimilatory reduction activity of SRB, and a large amount of Cr3+ was generated by the iron scrap reduction, the removal rate curves of Cr3+ decreased in the initial stage. However, due to the enhancement of dissimilatory reduction activity of SRB, a large amount of S2– had been generated to precipitate more Cr3+, the removal rate curve of Cr3+ raised. When the amount of S2– generated by dissimilation reduction of SRB was gradually reduced due to the reduction of C/S in dynamic columns, the removal rate curves of Cr3+ were a trend of fluctuation downtrend. Compared with Figs. 2 and 4, the order of the average removal rates of SO42– (2 > 1 > 3) is highly consistent with the order of the average removal rate of Cr3+ (2 > 1 > 3). It can be seen that the removal capability of Cr3+ is positively correlated with dissimilation reduction ability of SRB in the three dynamic columns.
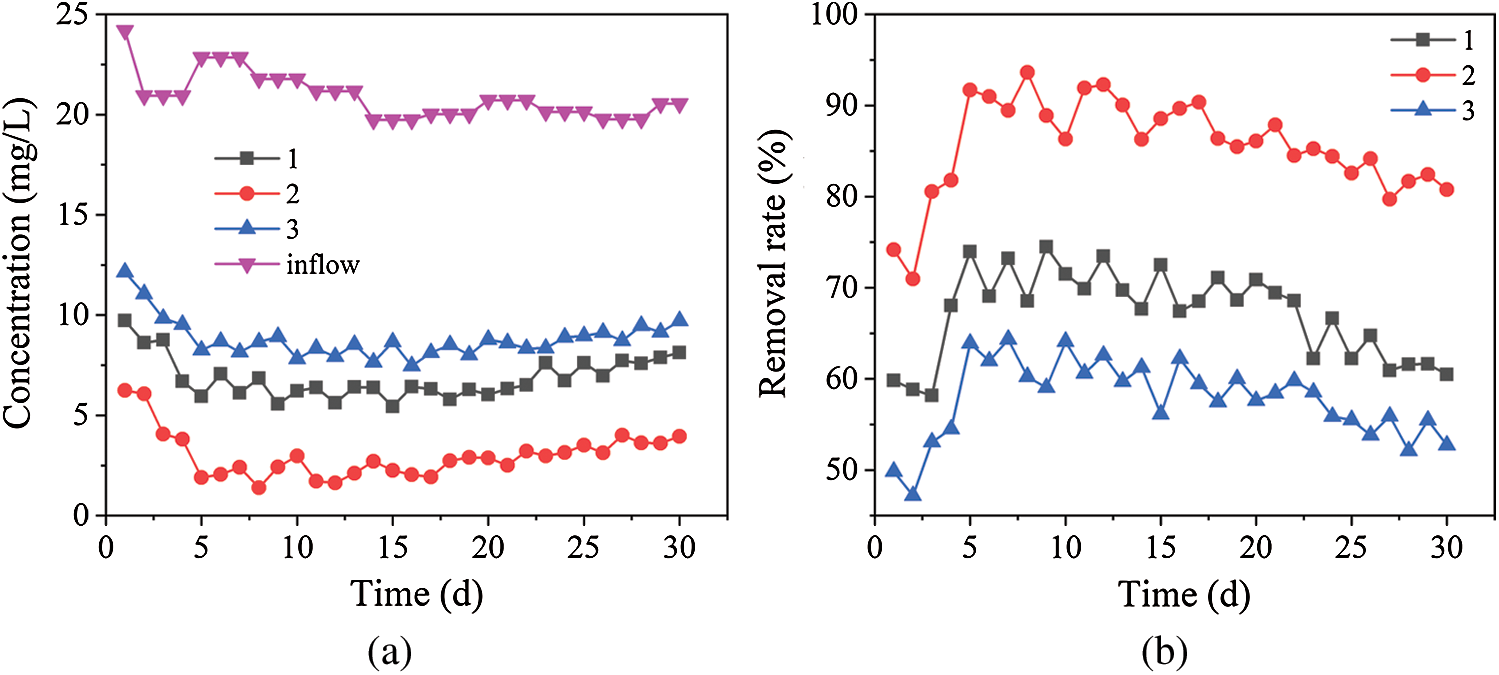
Figure 4: Removal effects of Cr3+ by dynamic columns 1, 2 and 3. (a) Cr3+ concentrations in dynamic columns 1, 2 and 3. (b) Removal rates of Cr3+ by dynamic columns 1, 2 and 3
3.4 Analysis on the Change Laws of pH
The pH values in the three dynamic columns are shown in Fig. 5. The average pH of the effluent was 6.98, 6.23 and 7.96 respectively in dynamic columns 1, 2 and 3. At the initial stage, the pH value of the AMD solution increased quickly in the three dynamic columns. The pH value was affected by the reduction of iron scrap and the combination of H+ with ligands, which in the biomass materials on the surface. The difference between ligands binding and H+ directly results in the obvious difference of the pH of effluent. On the first day the pH had ranged from the original 4.23 to 6.37, 6.14 and 8.32 respectively. It can be seen that the metabolic activity of SRB hasn’t reached its optimal state according to the effect of SO42– removal. Because the iron scrap had the reduction reaction with the H+ from AMD in the acid environment, the pH value increased rapidly. The reason why pH value in dynamic column 3 was higher than the ones in dynamic columns 1 and 2, is that the interior pores of sunflower straw are thin and loose, and there is a larger specific surface area and more points to adsorb H+. the sunflower straw is superior to bagasse [33]. The previous studies show that the combination of bagasse with H+ is superior to the corn cob [14]. For H+, when pH is low, it is easy to bind to adsorption sites on the surface of sunflower [34]. After sunflower straw adsorbs a large amount of H+, the unit area of the remaining H+ from the contact reaction with iron filings in dynamic column 3 system increases, which promotes the further consumption of H+, improves the pH value of the system, reduces the toxicity of acidity to SRB, and promotes the growth of SRB and alkaline substances. In the middle stage of the reaction, the H+ binding site on the surface of biomass material decreases. The reaction between iron filings and H+ tends to be stable. The SRB activity in the system is enhanced, and the SRB metabolism also produces alkalinity, which makes the pH value of the effluent from dynamic columns 1–3 tends to be stable. However, the removal rates of H+ is reduced due to the passivation of iron scrap surface and the decrease of SRB bioactivity in the later stage. Therefore, the pH value curves of the effluent showed a slow downward trend.
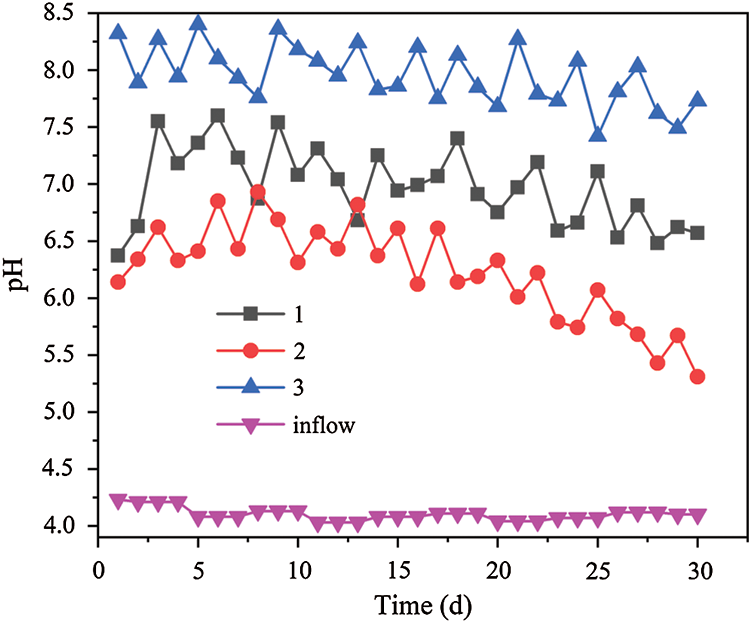
Figure 5: Changes of effluent pH value by dynamic columns 1, 2 and 3
3.5 Analysis on the Change Laws of COD
The released amount of COD is shown in Fig. 6 in the three dynamic columns. Fig. 6 showed that the average COD concentration of effluent were 287.3, 636.5 and 158.1 mg/L respectively in columns 1, 2 and 3. In the initial stage, the effluent COD values of the three dynamic columns (especially columns 1 and 3) were lower, but then the curve of COD concentration value rose more rapidly. On the 6th day, the COD values of the effluent reached the maximum value of 332, 708 and 233 mg/L, respectively, and then the COD value of the effluent showed a downward trend. The process of COD released is mainly caused by the decomposition of natural cellulose and lignin in biomass materials by anaerobic fermentation microorganisms [35], and the hydrogen released from iron reaction can promote microbial fermentation activity, but the metabolism of SRB can consume part of COD. Therefore, in the initial stage, the anaerobic fermentation products of biomass materials increased gradually with the enhancement of anaerobic microorganism activity, and the COD value curve of effluent increased rapidly. With the progress of the reaction, the amount of cellulose (hemicellulose) that was easily degraded in the biomass material gradually decreased [36], and the output of hydrogen was also reduced owing to the passivation of the iron scrap surface. The amount of biodegradable cellulose and hemicellulose from the biomass material rank as followings: corn cob (0.37 and 0.32 g/g) [37], bagasse (0.35 and 0.25 g/g) [38], and sunflower straw (0.27 and 0.16 g/g) [39]. It can be seen from Fig. 6 that the amount of the COD value in the three dynamic columns is dynamic column 2 > dynamic column 1 > dynamic column 3. The gap of COD value is due to the different amount of biodegradable cellulose and hemicellulose. SRB needed to consume COD when the SO42– was transformed in the anaerobic environment. The appropriate amount of COD can improve the growth of SRB, while the excess COD may lead to the secondary pollution. The COD released from the corn cob in dynamic column 2 is desirable for the growth of SRB according to the SO42– removal in the three dynamic columns. The content of COD is still higher after the utilization of SRB, which can lead to the secondary pollution. The research also shows that the bagasse in dynamic column 1 can provide a more durable carbon source compared with the sunflower straw in dynamic column 3 and help SRB metabolize SO42–. In the meantime, the less amount of COD in dynamic column 1 can reduce the possibility of secondary pollution.
3.6 Analysis on the Change Laws of TFe
The released amount of TFe is shown in Fig. 7 in the three dynamic columns. The average TFe concentration of effluent were 4.4, 15.8 and 1.1 mg/L respectively in dynamic columns 1, 2 and 3. On the first day, the TFe concentration of the effluent in the three dynamic columns were 5.37, 17.38 and 1.42 mg/L respectively. Compared with dynamic column 1 and dynamic column 3, the TFe concentration from dynamic column 2 was significantly higher. There were three main reasons for this phenomenon. Firstly, the effluent pH value of dynamic column 2 is lower than that of dynamic column 1 and dynamic column 3. Secondly, iron filings in the acidic environment of dynamic column 2 formed Fe2+ and Fe3+, and Fe2+ and Cr6+ generated Fe3+ and Cr3+ through redox reaction, which promoted the iron filings to move towards the reaction direction of Fe2+. Finally, the activity of SRB in dynamic column 2 was significantly higher than that in dynamic column 1 and dynamic column 3. The metabolism of SRB with high activity produced a large amount of S2–, and the reaction of S2– with Cr3+ generate precipitation, which promoted the iron filings to react in the direction of Fe2+ formation. In the initial stage, the effluent TFe concentration of the dynamic columns 1 and 2 (especially column 2) were higher, but then the curve of the TFe concentration decreased slowly. At the 11th and 17th days, the effluent TFe concentration reached the minimum of 2.6 and 14.0 mg/L respectively, and then the TFe concentration of the effluent showed a rising trend. However, the effluent TFe concentration of dynamic column 3 remained relatively low and the curve fluctuated gently. The release process of TFe in the dynamic columns was mainly the redox reaction of iron scrap with Cr6+ and H+, and the consumption of TFe was mainly the adsorption of biomass materials and precipitation of S2– and OH–. Therefore, due to the rapid reaction of a large number of iron scrap and relatively weak biological activity in the early stage, the release of TFe is higher in effluent. With the progress of the reaction, the amount of S2– produced by the dissimilation reduction become smaller because of the gradual weakening of the biological activity from strong. Therefore, the TFe concentration curves of the dynamic column 1 and 2 first dropped and then rose. At the same time, because the effluent of dynamic column 3 was weakly alkaline, and the sunflower straw has sparse pores and loose pores, which has larger specific surface area and more adsorption sites, the effluent TFe concentration of the dynamic column 3 is always kept low.
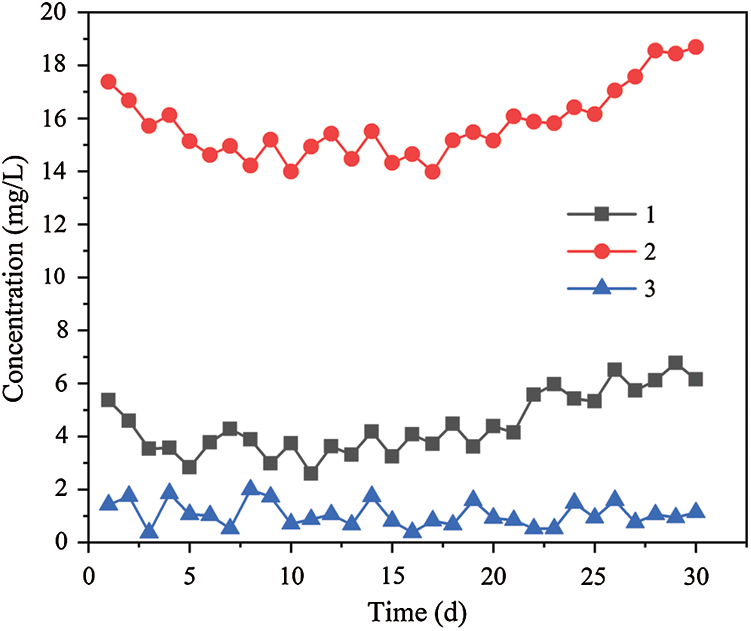
Figure 7: Changes of effluent TFe concentration by dynamic columns 1, 2 and 3
4 Analysis of Instrument Characterization
The fillings of dynamic columns 1, 2 and 3 were dried and grinded to be analyzed by EDS. The results were shown in Fig. 8.
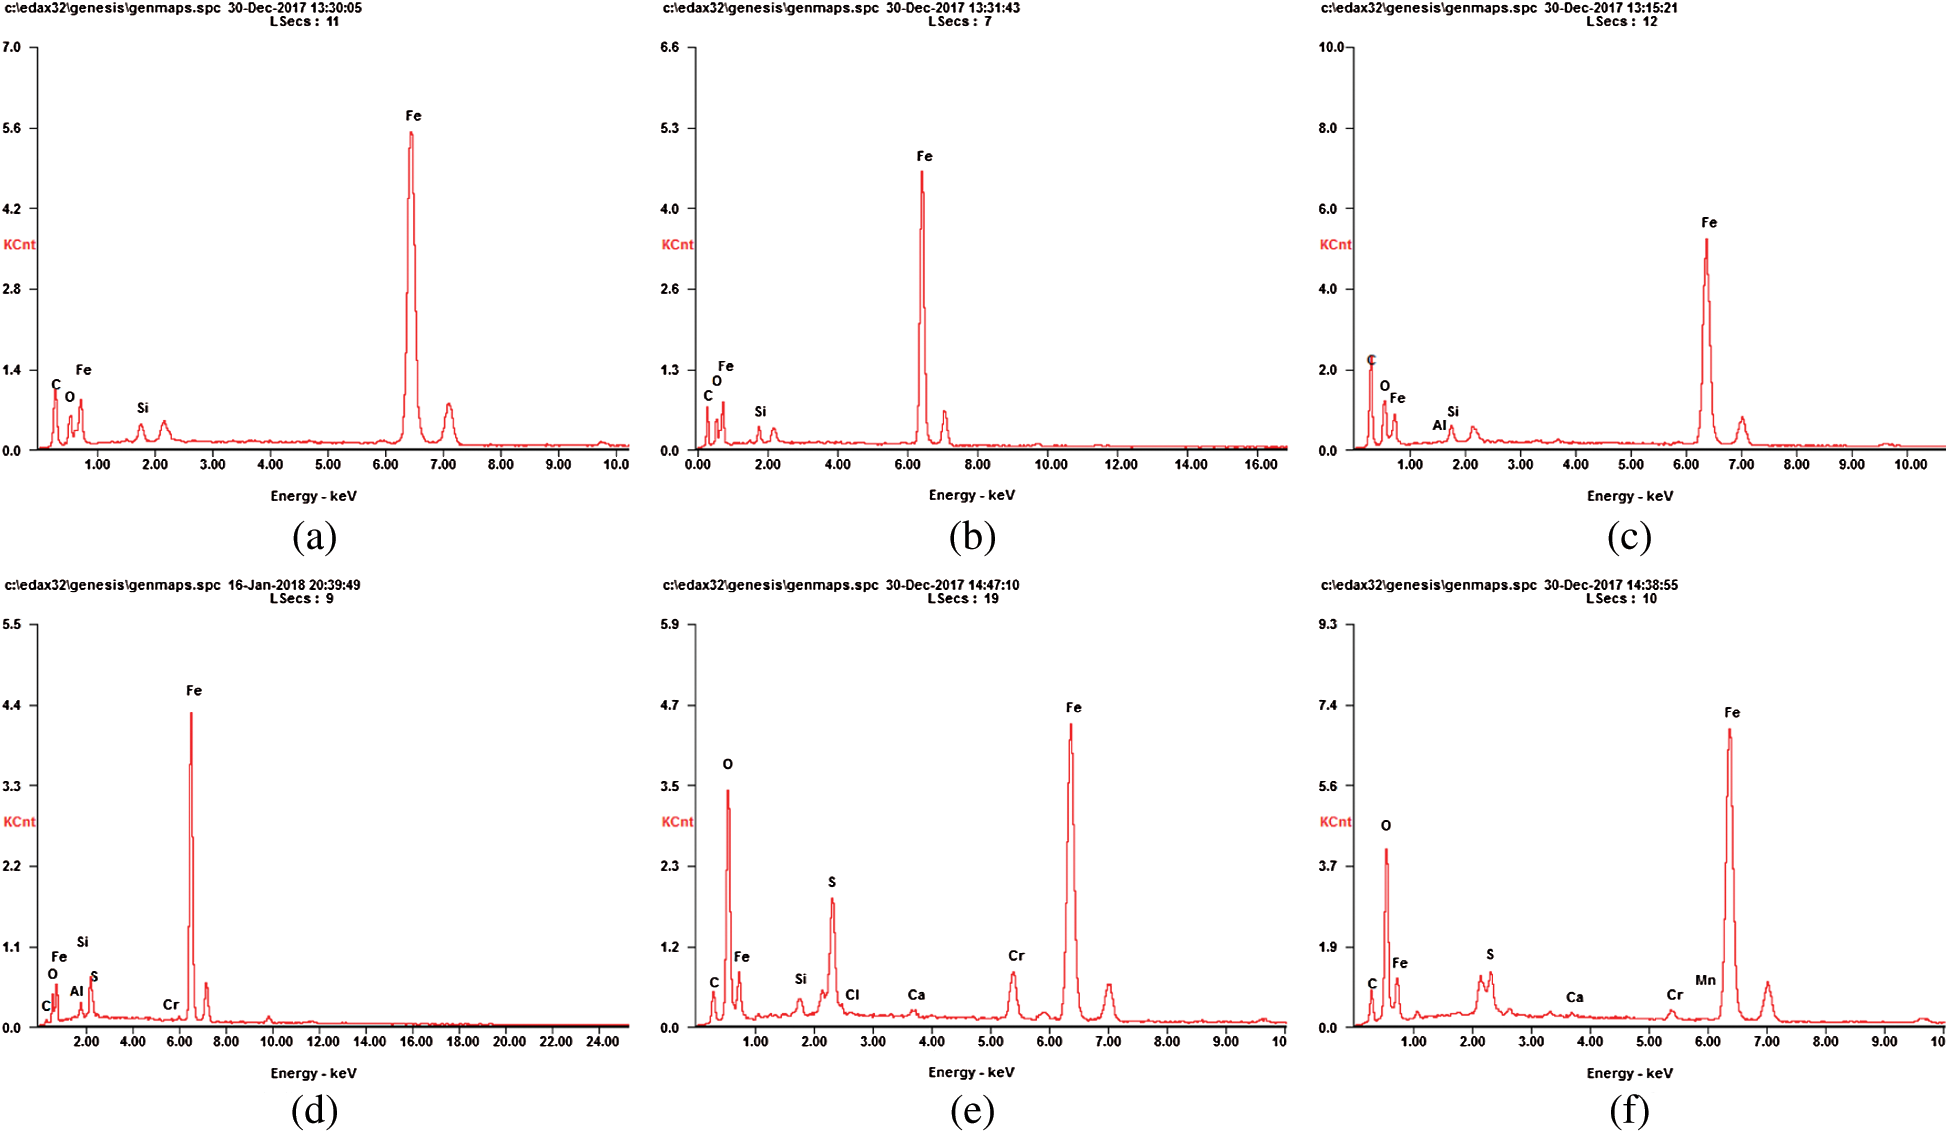
Figure 8: EDS analysis of AMD before and after packing treatment. (a) EDS analysis of dynamic column 1 packing before AMD treatment. (b) EDS analysis of dynamic column 2 packing before AMD treatment. (c) EDS analysis of dynamic column 3 packing before AMD treatment. (d) EDS analysis of dynamic column 1 packing after AMD treatment. (e) EDS analysis of dynamic column 2 packing after AMD treatment. (f) EDS analysis of dynamic column 3 packing after AMD treatment
Fig. 8 showed that the fillings of the dynamic column 1 mainly contained elements C, O, Al, Si and Fe before the reaction, and their weight percentage was 39.26%, 11.51%, 0.30%, 1.69% and 47.23%, respectively. After reaction, the fillings mainly contained elements C, O, S, Ca, Cr, Mn and Fe, and their weight percentages were 13.67%, 23.93%, 3.04%, 0.32%, 1.18%, 0.12% and 57.74%, respectively. The fillings of the dynamic column 2 mainly contained elements C, O, Si and Fe before the reaction, and their weight percentages were 24.42%, 6.17%, 1.98% and 67.44% respectively. After reaction, the fillings mainly contained elements C, O, Si, S, Cl, Ca, Cr and Fe, and their weight percentages were 12.83%, 27.39%, 1.29%, 6.24%, 0.30%, 0.44%, 5.00% and 46.51% respectively. The fillings of the dynamic column 3 mainly contained elements C, O, Si and Fe before the reaction, and their weight percentages were 26.92%, 6.06%, 2.02% and 65.00% respectively. After reaction, the fillings mainly contained elements C, O, Al, Si, S, Cr and Fe, and their weight percentages were 3.03%, 5.11%, 0.48%, 2.68%, 1.03%, 0.58% and 87.09% respectively.
The fillings of dynamic columns 1, 2 and 3 were dried and grinded to be analyzed by XRD. The results were shown in Fig. 9.
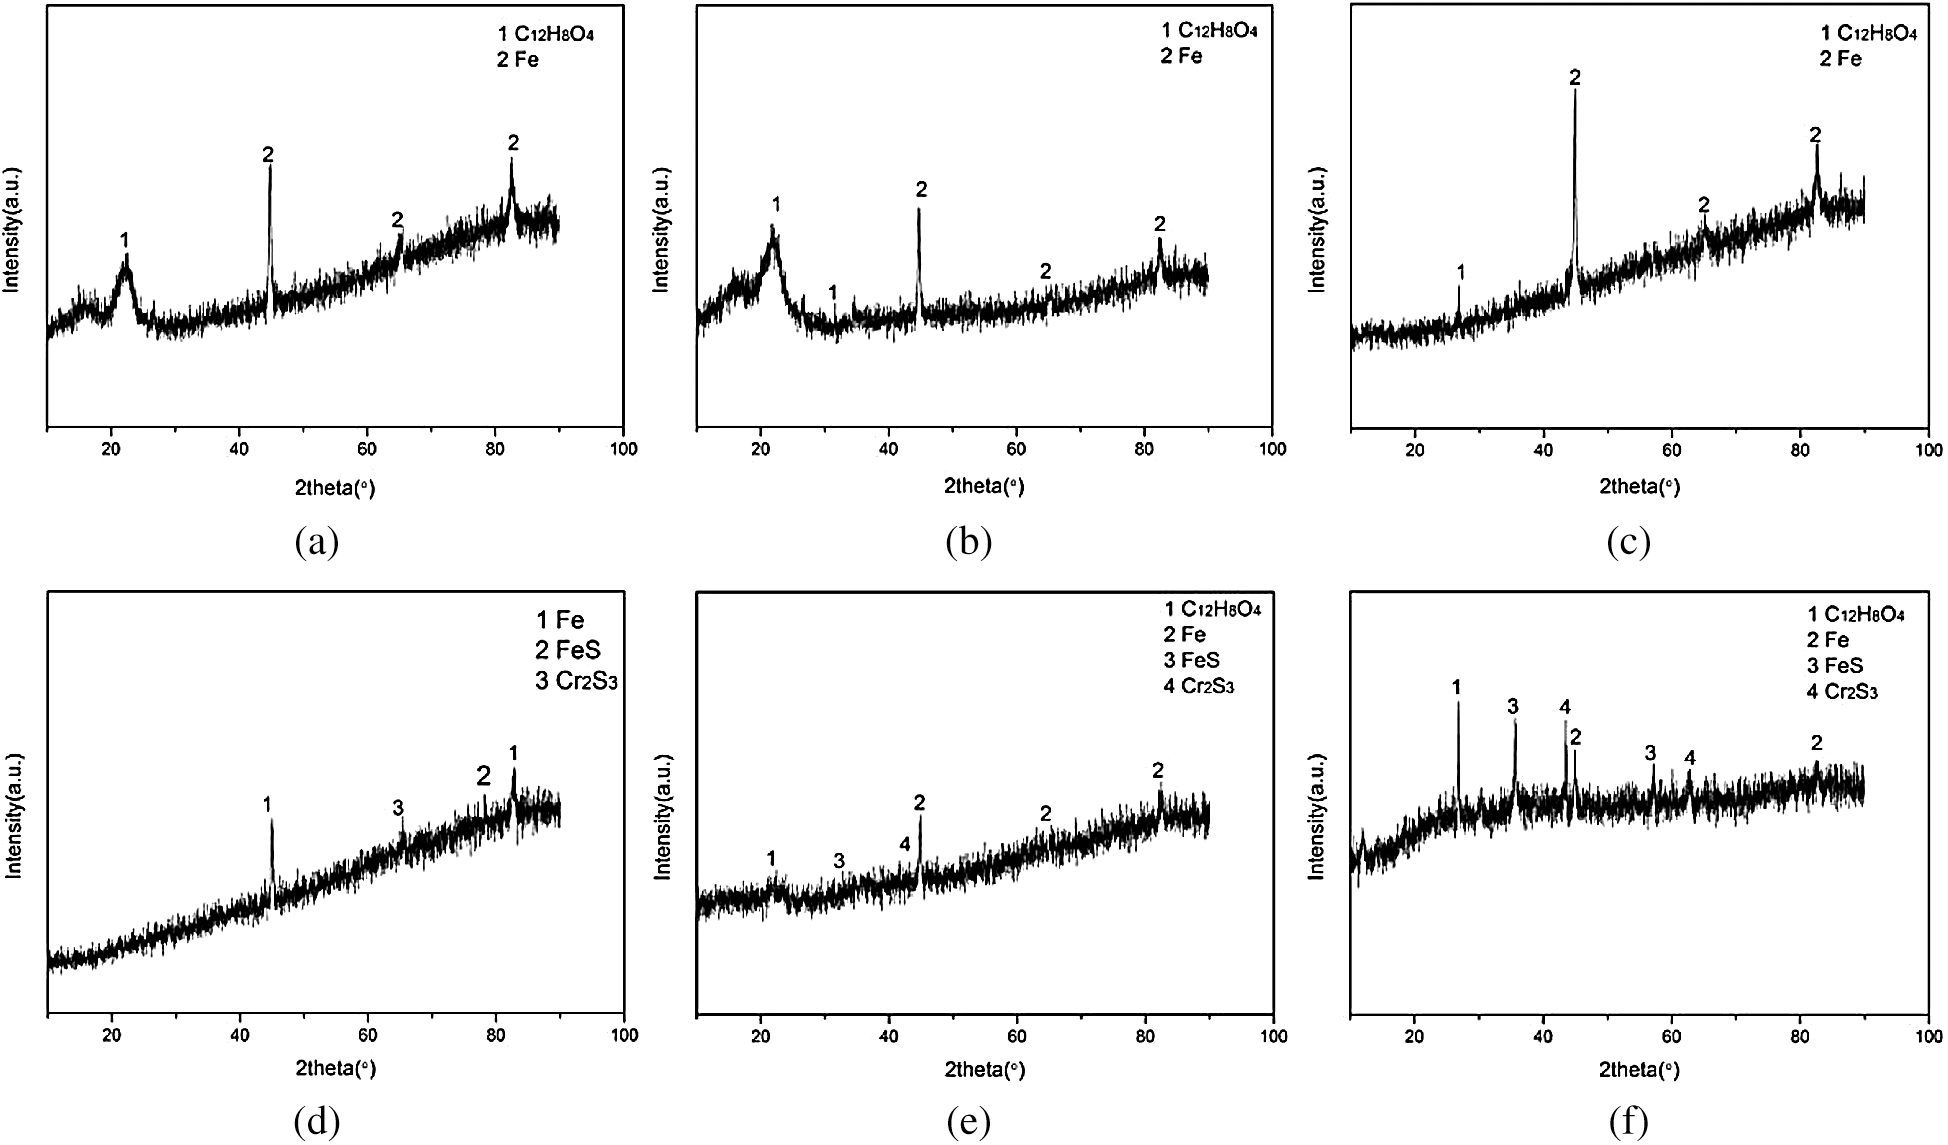
Figure 9: XRD analysis of AMD before and after packing treatment. (a) XRD analysis of dynamic column 1 packing before AMD treatment. (b) XRD analysis of dynamic column 2 packing before AMD treatment. (c) XRD analysis of dynamic column 3 packing before AMD treatment. (d) XRD analysis of dynamic column 1 packing after AMD treatment. (e) XRD analysis of dynamic column 2 packing after AMD treatment. (f) XRD analysis of dynamic column 3 packing after AMD treatment
Fig. 9 showed that the fillings of dynamic columns 1, 2 and 3 mainly contained elements iron and organic matter before the reaction. After reaction, FeS and Cr2S3 appeared in the fillings.
The fillings of dynamic columns 1, 2 and 3 were dried and analyzed by SEM. The results were shown in Fig. 10.
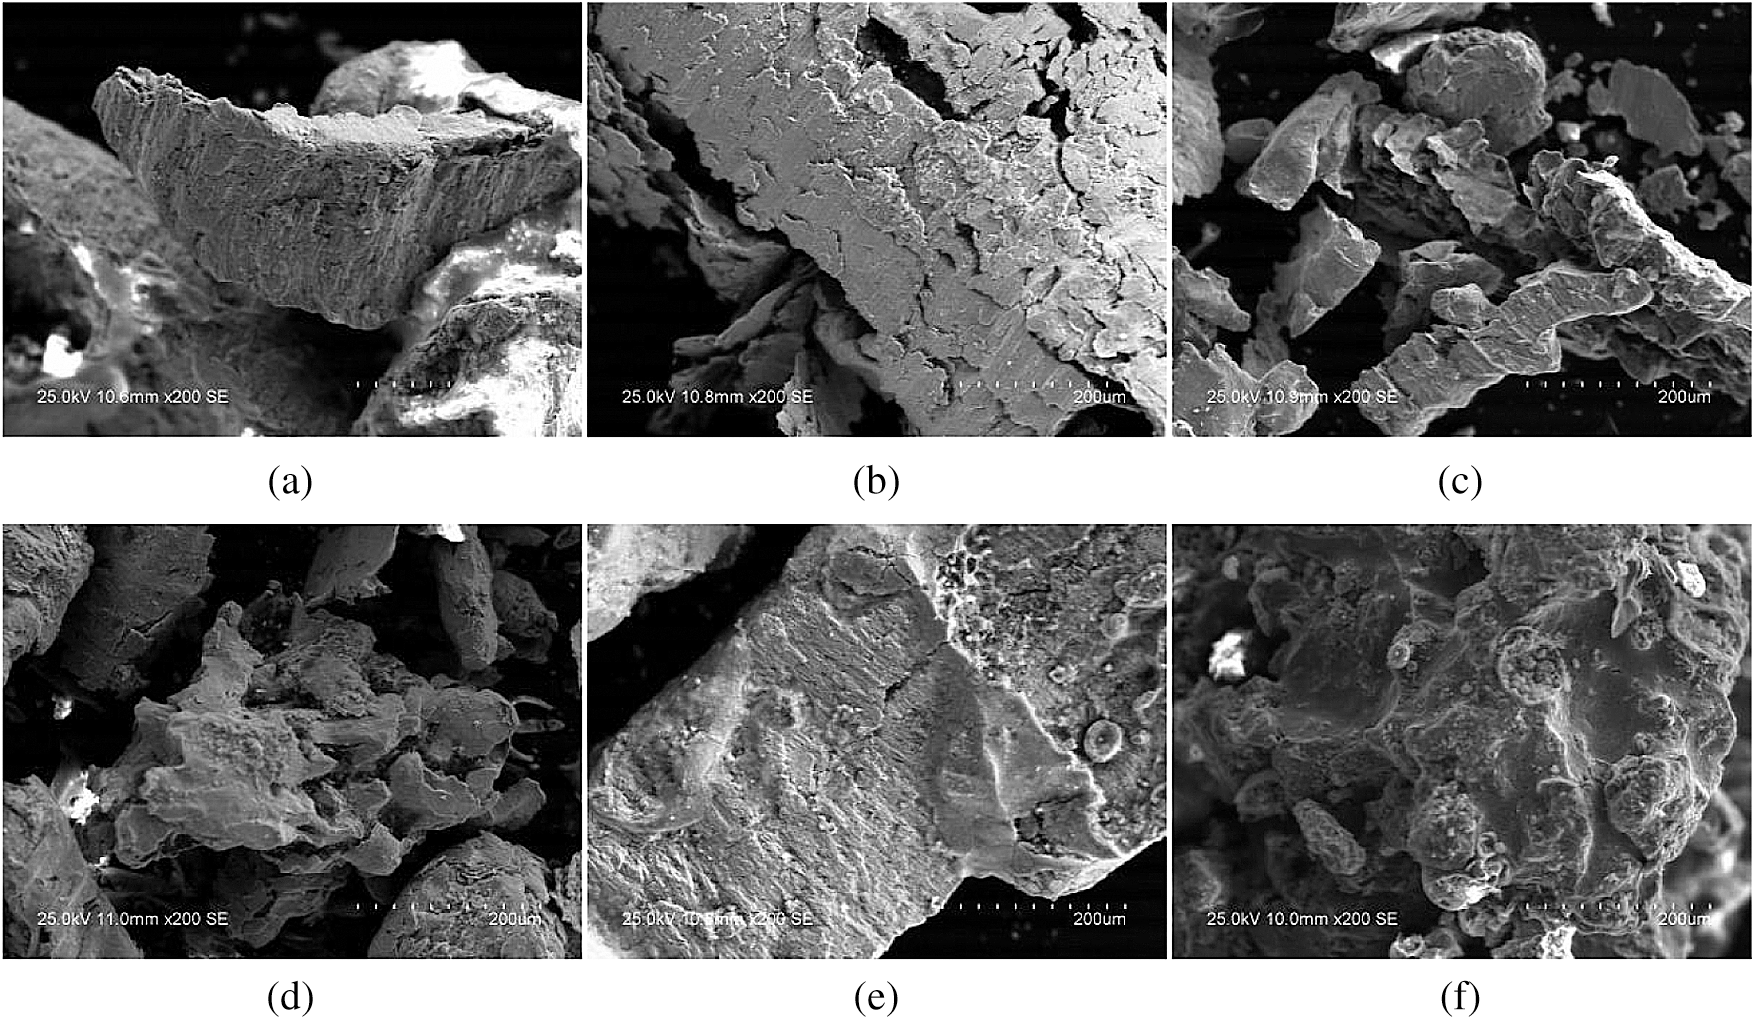
Figure 10: SEM analysis of AMD before and after packing treatment. (a) SEM analysis of dynamic column 1 packing before AMD treatment. (b) SEM analysis of dynamic column 2 packing before AMD treatment. (c) SEM analysis of dynamic column 3 packing before AMD treatment. (d) SEM analysis of dynamic column 1 packing after AMD treatment. (e) SEM analysis of dynamic column 2 packing after AMD treatment. (f) SEM analysis of dynamic column 3 packing after AMD treatment
Fig. 10 showed that the surface texture of the filling was smooth and regular, and their pores were clear and smooth before the reaction. After reaction, the surface of the filling appeared obvious folds, the pores became smaller, and there was obvious granular sediment on the surface.
1. In dynamic column 1, the sugarcane slag was used as SRB carbon source to treat AMD cooperating with iron scrap. The average removal rates of Cr6+, Cr3+ and SO42– were 96.9%, 67.1% and 54.3% respectively. The average release amounts of TFe and COD were 4.4 and 287.3 mg/L respectively. The average pH value was 6.98. The dynamic column had a relatively good effect on Cr6+ removal and it had ability to adjust the pH value of the solution.
2. In dynamic column 2, the corn cob was used as SRB carbon source to treat AMD cooperating with iron scrap. The average removal rates of Cr6+, Cr3+ and SO42– were 96.1%, 85.6% and 74.9% respectively. The average release amounts of TFe and COD were 15.8 and 636.5 mg/L respectively. The average pH value was 6.23. The dynamic column had a relatively good effect on Cr3+ and SO42– removal. But the average release of TFe and COD in the effluent was higher, and the capacity of acid adjusting was not good enough.
3. In dynamic column 3, the sunflower straw was used as SRB carbon source to treat AMD cooperating with iron scrap. The average removal rates of Cr6+, Cr3+ and SO42– were 95.2%, 57.8% and 32.5% respectively. The average release amounts of TFe and COD were 1.1 and 158.1 mg/L respectively. The average pH value was 7.96. The average release of TFe and COD in this dynamic column was low, while the ability to adjusting acid was the strongest. However, the removal of Cr6+, Cr3+ and SO42– is poor, and the effluent was weakly alkaline.
4. Comparing the ability to remove Cr6+, Cr3+ and SO42– and their ability to release TFe, COD and adjust acid in AMD of the dynamic columns 1, 2 and 3, the comprehensive effect of the dynamic column 1 was better.
5. The fillings of the dynamic columns 1, 2 and 3 were analyzed before and after reaction with EDS, XRD and SEM. The results showed that the elements S and Cr in the fillings increased obviously after the reaction, and they both existed in the forms of FeS and Cr2S3. The surface of the fillings was wrinkled, and the pores were smaller.
Acknowledgement: The authors would like to thank all editors and anonymous reviewers for their comments and suggestions.
Funding Statement: This work was supported by the National Natural Science Foundation of China (41672247, 41102157), Liaoning Province’s “Program for Promoting Liaoning Talents” (XLYC1807159), 2019 Nature Fund Project Guidance Plan of Liaoning Province (2019-zd-0044), 2017 Youth Project of Education Department of Liaoning Province (LJ2017QL035).
Conflicts of Interest: The authors declare that they have no conflicts of interest to report regarding the present study.
1. Qureshi, A., Jia, Y., Maurice, C., Öhlander, B. (2016). Potential of fly ash for neutralisation of acid mine drainage. Environmental Science and Pollution Research, 23(17), 17083–17094. DOI 10.1007/s11356-016-6862-3. [Google Scholar] [CrossRef]
2. Abdel-Shafy, H. I., El-Khateeb, M. A. (2013). Integration of septic tank and constructed wetland for the treatment of wastewater in Egypt. Desalination and Water Treatment, 51(16–18), 3539–3546. DOI 10.1080/19443994.2012.749585. [Google Scholar] [CrossRef]
3. Nam, G., Kim, M., Lee, N., Choi, Y., Ahn, J. (2017). An environmentally benign approach for as (V) absorption from wastewater using untreated coffee grounds-preliminary results. Water, 9(11), 867. DOI 10.3390/w9110867. [Google Scholar] [CrossRef]
4. Nordstrom, D. K., Blowes, D. W., Ptacek, C. J. (2015). Hydrogeochemistry and microbiology of mine drainage: an update. Applied Geochemistry, 57, 3–16. DOI 10.1016/j.apgeochem.2015.02.008. [Google Scholar] [CrossRef]
5. Zeng, Y., Wang, B., Li, Y., Huang, R. (2014). Oxidation-neutralization precipitation method in treatment of electroplating copper wastewater. Journal of Applied Science and Engineering Innovation, 2, 174–178. http://jasei.org/pdf/1-2/1-174-178.pdf. [Google Scholar]
6. Chukwunonye, E., Carlos, A., Jairo, F. (2015). Constructed wetland systems as a methodology for the treatment of wastewater in Bucara-Manga industrial park. Journal of Geoscience & Environment Protection, 14, 1–14. [Google Scholar]
7. Fei, P., Wang, Q., Zhong, M., Su, B. (2016). Preparation and adsorption properties of enhanced magnetic zinc ferrite-reduced graphene oxide nanocomposites via a facile one-pot solvothermal method. Journal of Alloys and Compounds, 685, 411–417. DOI 10.1016/j.jallcom.2016.05.279. [Google Scholar] [CrossRef]
8. Di, J., Wang, M. (2017). Experimental study on treating dyeing wastewater with sulfate-reducing bacteria strengthening peanut shells and iron scrap. Water Science and Technology, 76(4), 938–952. DOI 10.2166/wst.2017.259. [Google Scholar] [CrossRef]
9. Kaufman, E. N., Little, M. H., Selvaraj, P. T. (1996). Recycling of FGD gypsum to calcium carbonate and elemental sulfur using mixed sulfate-reducing bacteria with sewage digest as a carbon source. Journal of Chemical Technology & Biotechnology, 66(4), 365–374. DOI 10.1002/(SICI)1097-4660(199608)66:4<365::AID-JCTB520>3.0.CO;2-1. [Google Scholar] [CrossRef]
10. Chen, Y., Wen, Y., Zhou, J., Tang, Z., Li, L. et al. (2014). Effects of cattail biomass on sulfate removal and carbon sources competition in subsurface-flow constructed wetlands treating secondary effluent. Water Research, 59, 1–10. DOI 10.1016/j.watres.2014.03.077. [Google Scholar] [CrossRef]
11. Cocos, I. A., Zagury, G. J., Clément, B., Samson, R. (2002). Multiple factor design for reactive mixture selection for use in reactive walls in mine drainage treatment. Water Research, 36(1), 167–177. DOI 10.1016/S0043-1354(01)00238-X. [Google Scholar] [CrossRef]
12. Chang, I. (2000). Biological treatment of acid mine drainage under sulphate-reducing conditions with solid waste materials as substrate. Water Research, 34(4), 1269–1277. DOI 10.1016/S0043-1354(99)00268-7. [Google Scholar] [CrossRef]
13. Shao, L., Xu, Z., Jin, W., Yin, H. (2011). Optimization of denitrification solid carbon source for agricultural wastes. China Environmental Science, 31(5), 748–754. [Google Scholar]
14. Di, J., Li, T., Zhao, W. (2018). Treatment acid mine drainage by sulfate reducing bacteria using different biomass carbon sources. Journal of China Coal Society, 44(6), 1915–1922. [Google Scholar]
15. Zhang, Y., Hu, X., Xia, L., Jin, S., Wang, Y. et al. (2016). Sugarcane bagasse for slow release carbon source loading SRB treatment to simulate mine leaching water. Journal of Environmental Engineering, 10(5), 2355–2359. DOI 10.12030/j.cjee.201412120. [Google Scholar] [CrossRef]
16. Sneath, H. E., Hutchings, T. R., de Leij, F. A. A. M. (2013). Assessment of biochar and iron filing amendments for the remediation of a metal, arsenic and phenanthrene co-contaminated spoil. Environmental Pollution, 178, 361–366. DOI 10.1016/j.envpol.2013.03.009. [Google Scholar] [CrossRef]
17. Caule, E. J., Cohen, M. (1953). An electron-micrograph study of oxide films on electropolished surfaces of iron. Canadian Journal of Chemistry, 31(3), 237–241. DOI 10.1139/v53-034. [Google Scholar] [CrossRef]
18. Dong, Y., Di, J., Wang, X., Xue, L., Yang, Z. et al. (2020). Dynamic experimental study on treatment of acid mine drainage by bacteria supported in natural minerals. Energies, 13(2), 439. DOI 10.3390/en13020439. [Google Scholar] [CrossRef]
19. The State Environmental Protection Administration. (2002). Water and wastewater monitoring and analysis method. 4th ed. Beijing: China Environmental Science Press. [Google Scholar]
20. Serrano, J., Leiva, E. (2017). Removal of arsenic using acid/metal-tolerant sulfate reducing bacteria: a new approach for bioremediation of high-arsenic acid mine waters. Water, 9(12), 994. DOI 10.3390/w9120994. [Google Scholar] [CrossRef]
21. Torres, I. F., Bastida, F., Hernández, T., Bombach, P., Richnow, H. H. et al. (2014). The role of lignin and cellulose in the carbon-cycling of degraded soils under semiarid climate and their relation to microbial biomass. Soil Biology and Biochemistry, 75, 152–160. DOI 10.1016/j.soilbio.2014.04.007. [Google Scholar] [CrossRef]
22. Rasoul Hoseini, S., Alidokht, L., Oustan, S., Aliasgharzad, N., Najafi, N. (2015). Kinetics of Cr(VI) removal by iron filings in some soils. Soil and Sediment Contamination: An International Journal, 24(5), 554–572. DOI 10.1080/15320383.2015.994056. [Google Scholar] [CrossRef]
23. Xin, J., Tang, F., Zheng, X., Shao, H., Kolditz, O. et al. (2016). Distinct kinetics and mechanisms of mZVI particles aging in saline and fresh groundwater: H2 evolution and surface passivation. Water Research, 100, 80–87. DOI 10.1016/j.watres.2016.04.074. [Google Scholar] [CrossRef]
24. Zhong, Q., Yue, Q., Gao, B., Li, Q., Xu, X. (2013). A novel amphoteric adsorbent derived from biomass materials: synthesis and adsorption for Cu(II)/Cr(VI) in single and binary systems. Chemical Engineering Journal, 229, 90–98. DOI 10.1016/j.cej.2013.05.083. [Google Scholar] [CrossRef]
25. Wu, J., Wang, X., Zeng, R. (2017). Reactivity enhancement of iron sulfide nanoparticles stabilized by sodium alginate: taking Cr(VI) removal as an example. Journal of Hazardous Materials, 333, 275–284. DOI 10.1016/j.jhazmat.2017.03.023. [Google Scholar] [CrossRef]
26. Lu, X., Zhen, G., Ni, J., Hojo, T., Kubota, K. et al. (2016). Effect of influent COD/SO42– ratios on biodegradation behaviors of starch wastewater in an upflow anaerobic sludge blanket (UASB) reactor. Bioresource Technology, 214, 175–183. DOI 10.1016/j.biortech.2016.04.100. [Google Scholar] [CrossRef]
27. Dong, Y., Di, J., Yang, Z., Zhang, Y., Wang, X. et al. (2020). Study on the effectiveness of sulfate-reducing bacteria combined with coal gangue in repairing acid mine drainage containing Fe and Mn. Energies, 13(4), 995. DOI 10.3390/en13040995. [Google Scholar] [CrossRef]
28. Tseng, R., Tseng, S. (2005). Pore structure and adsorption performance of the KOH-activated carbons prepared from corncob. Journal of Colloid and Interface Science, 287(2), 428–437. DOI 10.1016/j.jcis.2005.02.033. [Google Scholar] [CrossRef]
29. Signorella, S., Lafarga, R., Daier, V., Sala, L. (2000). The reduction of Cr-VI to Cr-III by the alpha and beta anomers of d-glucose in dimethyl sulfoxide: a comparative kinetic and mechanistic study. Carbohydrate Research, 324(2), 127–135. DOI 10.1016/S0008-6215(99)00282-7. [Google Scholar] [CrossRef]
30. Halim, Z., Cut, A., Said, A. (2019). Removal and kinetics adsorption Fe(II) ions in ground water using sugarcane bagasse of various treatments adsorbent with column method. IOP Conference Series: Materials Science and Engineering, 536(1), 012007. DOI 10.1088/1757-899X/536/1/012007. [Google Scholar] [CrossRef]
31. Cantero, D., Vaquerizo, L., Martinez, C., Bermejo, M., José Cocero, M. (2014). Selective transformation of fructose and high fructose content biomass into lactic acid in supercritical water. Catalysis Today, 255, 80–86. DOI 10.1016/j.cattod.2014.11.013. [Google Scholar] [CrossRef]
32. Qian, A., Liao, P., Yuan, S., Luo, M. (2014). Efficient reduction of Cr(VI) in groundwater by a hybrid electro-Pd process. Water Research, 48, 326–334. DOI 10.1016/j.watres.2013.09.043. [Google Scholar] [CrossRef]
33. Jain, M., Garg, V. K., Kadirvelu, K. (2013). Removal of Ni(II) from aqueous system by chemically modified sunflower biomass. Desalination and Water Treatment, 52(28–30), 5681–5695. DOI 10.1080/19443994.2013.811112. [Google Scholar] [CrossRef]
34. Ai, L., Luo, X., Lin., X., Mei, Q. (2014). Extended study of sunflower straw in the selective adsorption behaviors and mechanisms for U(VI) and Pb(II). Chemistry and Industry of Forest Products, 34(2), 9–16. [Google Scholar]
35. Kunlanit, B., Vityakon, P., Puttaso, A., Cadisch, G., Rasche, F. (2014). Mechanisms controlling soil organic carbon composition pertaining to microbial decomposition of biochemically contrasting organic residues: evidence from midriffs peak area analysis. Soil Biology and Biochemistry, 76, 100–108. DOI 10.1016/j.soilbio.2014.05.006. [Google Scholar] [CrossRef]
36. Demirbas, A. (2009). Biorefineries: current activities and future developments. Energy Conversion & Management, 50(11), 2782–2801. DOI 10.1016/j.enconman.2009.06.035. [Google Scholar] [CrossRef]
37. Zhang, L., Wang, Q., Wang, B., Yang, G., Lucia, L. A. et al. (2015). Hydrothermal carbonization of corncob residues for hydrochar production. Energy & Fuels, 29(2), 872–876. DOI 10.1021/ef502462p. [Google Scholar] [CrossRef]
38. Batalha, L. A. R., Han, Q., Jameel, H., Chang, H., Colodette, J. L. et al. (2015). Production of fermentable sugars from sugarcane bagasse by enzymatic hydrolysis after autohydrolysis and mechanical refining. Bioresource Technology, 180, 97–105. DOI 10.1016/j.biortech.2014.12.060. [Google Scholar] [CrossRef]
39. He, X., Yang, L., Wu, H., Liu, N., Zhang, Y. et al. (2016). Characterization and pyrolysis behaviors of sunflower stalk and its hydrolysis residue. Asia-Pacific Journal of Chemical Engineering, 11(5), 803–811. DOI 10.1002/apj.2015. [Google Scholar] [CrossRef]