DOI:10.32604/jrm.2021.011646
| Journal of Renewable Materials DOI:10.32604/jrm.2021.011646 | |
| Article |
Preliminary Optimization and Kinetics of SnCl2-HCl Catalyzed Hydrothermal Conversion of Microcrystalline Cellulose to Levulinic Acid
Fuels, Energy and Thermal Systems Laboratory, Department of Chemical Engineering, University of the Philippines, Quezon City, 1101, Philippines
*Corresponding Author: Rizalinda de Leon. Email: rldeleon@up.edu.ph
Received: 21 May 2020; Accepted: 06 July 2020
Abstract: Levulinic acid (LA) is a platform biorefinery chemical from biomass which can be converted to green solvents, plasticizers, polymer precursors, bio-based cleaning agents, fuels and fuel additives. This study assessed the potential of SnCl2-based mixed acid systems as catalyst in the hydrothermal conversion of microcrystalline cellulose to levulinic acid. Maximum LA yield of 36.2 mol% was achieved using 0.2 M SnCl2 concentration at test conditions of 3 h, 180°C and 1% w/v cellulose loading. To reduce precipitate formation and further improve LA yield, the strategy employed was to combine SnCl2 (a Lewis acid) with conventional mineral acids (Bronsted acids). Evaluation of the catalytic performance of SnCl2-HCl, SnCl2-H2SO4, SnCl2-HNO3, and SnCl2-H3PO4 (1:1 molar ratio, 0.2 M total acid concentration) were done with highest LA yield of 47.0 mol% obtained using the SnCl2-HCl system at same test conditions. Response surface methodology optimization employing Box-Behnken design generated a quadratic model with a high coefficient of determination (r2) of 0.964. A maximum LA yield of 63.5 mol% can be achieved at 0.17 M catalyst concentration, 198°C, and 5.15 h reaction time. Rate constants were estimated using nonlinear regression, while activation energies were determined using Arrhenius equation. Cellulose hydrolysis was determined to be the rate-limiting step in the overall process. Low activation energy of 63.3 kJ/mol for glucose dehydration to hydroxymethylfurfural supports the action of SnCl2 as Lewis acid in the mixed-acid system. LA yield simulations for plug flow reactor (PFR) and continuous stirred tank reactor (CSTR) were done suggesting a similar PFR-CSTR configuration with the established Biofine process. Lastly, a reaction scheme was presented to explain the synergy between SnCl2 and HCl in LA production from cellulose.
Keywords: Levulinic acid; tin (II) chloride; cellulose; optimization; kinetics
 | This work is licensed under a Creative Commons Attribution 4.0 International License, which permits unrestricted use, distribution, and reproduction in any medium, provided the original work is properly cited. |
Low-cost lignocellulosic feedstock ranging from rice straw, corn stover, sugarcane bagasse, cotton straw, and water hyacinth have been tested in the production of levulinic acid (4-oxopentanoic acid) [1–5]. Levulinic acid (LA) is considered a platform chemical since it is an important intermediate chemical for the production of high value-added products such as LA esters, LA ketals, succinic acid, methyltetrahydrofuran, and gamma-valerolactone, etc. [6]. Current and future applications of these LA derivatives include green solvents, plasticizers, polymer precursors, biobased detergents, fuels and fuel additives [7]. For instance, gamma-valerolactone (obtained from the hydrogenation of LA) and its further upgrading to valerate esters have good potential as biobased transportation fuels [8].
At a current LA price point of 5–8 US$/kg and the growing demand for LA derivatives [9], further improvements in the hydrothermal conversion process to produce LA deserves attention. Pilot and commercial-scale plants in the USA, Spain, Italy, India and China have demonstrated the technical feasibility of the LA production process from biomass in recent years [10–13]. The baseline Biofine process of producing LA involves hydrothermal conversion via a dual-reactor configuration. It uses dilute aqueous solution of sulfuric acid as catalyst and employs process temperatures of 190–220°C [10].
At the onset, the main component of lignocellulosic biomass, cellulose is broken down to smaller C6 sugar oligomers. The oligomers are then converted to glucose which is the starting material for levulinic acid synthesis. Glucose isomerizes to fructose. Fructose then undergoes dehydration to form 5-hydroxymethylfurfural (HMF). Lastly, HMF undergoes rehydration to produce levulinic acid (LA) and formic acid (FA) [14]. The default choice for catalyst is Bronsted mineral acids such as sulfuric acid and hydrochloric acid with high LA yields of ~60 mol% based on cellulose as feed [14,15]. However, recent studies note the positive effect of metal chlorides as Lewis acid catalyst particularly to the glucose isomerization step [16]. AlCl3 and FeCl3 have also been explored further with LA yields of 36.3 and 48.9 mol% respectively [17,18].
Lewis acids are generally electron acceptors in reactions due to their empty orbitals which attract electron pairs from other reactants. On the other hand Bronsted acids are proton (hydrogen ion) donor in acid-base reactions. Combining both types of acid catalysts results in better selectivity towards LA production due to their synergistic effects. Lewis acids participate in the glucose isomerization to fructose which is slower compared to the subsequent Bronsted-acid catalyzed dehydration and rehydration step [19]. Furthermore, Bronsted acid is still necessary even in the cellulose hydrolysis to glucose monomers.
Tin (II) chloride or SnCl2 is a stable, water-tolerant and commercially-available Lewis acid [20]. As catalyst, it has already been tested on glucose [21] and corncob residue [22]. This establishes SnCl2 as the choice for Lewis acid. Four types of Bronsted acids were chosen to pair with SnCl2: hydrochloric acid (HCl), sulfuric acid (H2SO4), nitric acid (HNO3) and phosphoric acid (H3PO4). Currently, no research yet has been done on assessing the performance of the proposed SnCl2 mixed-acid systems (SnCl2-HCl, SnCl2-H2SO4, SnCl2-HNO3, and SnCl2-H3PO4) applied to microcrystalline cellulose as model feed for biomass. Another research gap is on determining the process parameters that will yield the highest LA yield, and performing related kinetic studies to give insights into the overall process.
Microcrystalline cellulose powder (50 μm particle size) was purchased from Sigma-Aldrich. The chemicals used for creating HPLC calibration plots were: anhydrous D-glucose (AR, Thermo Fisher Scientific), 5-hydroxymethylfurfural (99%, Sigma-Aldrich), and levulinic acid (98%, Sigma-Aldrich). The acid catalyst used are tin (II) chloride dihydrate (AR, Thermo Fisher Scientific), hydrochloric acid (37 wt%, RCI Labscan), sulfuric acid (98 wt%, RCI Labscan), ortho-phosphoric acid (85 wt%, Thermo Fisher Scientific), and nitric acid (88 wt%, Thermo Fisher Scientific).
Product concentrations were analyzed through high performance liquid chromatography (HPLC) using a Rezex RFQ column (100 mm length × 7.8 mm inside diameter) attached to a guard column for protection against column contaminants [23]. The HPLC system used is composed of a Shimadzu LC-20AT pump system, a DGU-14A degasser unit, and an RID-10A refractive index detector. The conditions for the analysis were: 0.005 M H2SO4 (aq) eluent at 0.6 mL/min. Flow rate at 60°C column temperature at 20 min run time.
Five-point calibration plots were generated by running standard aqueous solutions of D-glucose, 5-hydroxymethylfurfural (HMF), and levulinic acid (LA). The peak areas at designated retention times (±2.5%) are measured via the built-in Shimadzu LCSolutions software. Linear equations, with coefficients of determination (r2 values) greater than 0.99, relate the peak area to product concentration (Appendix Figs. A1–A3). Sample chromatograms are shown in Appendix Fig. A4. Product yields were computed as the ratio of moles product to the initial moles of cellulose in the reaction mixture.
Batch experiments were done using closed 50 mL stainless steel autoclaves with PTFE liner for corrosion resistance. Typically, 0.40 g cellulose and 40 mL of aqueous solution containing the catalyst were added to the reactor. Then, the reactors were placed in the preheated furnace at set temperature. The batch reaction time is noted as the sum of the startup heating time and apparent reaction time. After the batch reaction time, the reactors are then quenched in iced water for 10 minutes. The autoclave reactor was opened, and the reaction mixture was filtered. The supernatant was collected for HPLC analysis. Before HPLC analysis, the samples were filtered using 0.22 μm nylon syringe filters.
3.1 Effect of Tin (II) Chloride Concentration on Levulinic Acid Yield
Tin (II) chloride concentration was varied from 0.05 M to 0.5 M to achieve the highest levulinic acid yield at test conditions of 3 h batch reaction time and 180°C. Blank runs were also made to test the uncatalyzed system. As shown in Fig. 1, LA yield increased with increasing SnCl2 concentration to a certain extent and then becomes constant. The highest LA yield achieved was 38.0 mol% (based on the original cellulose content of the solution) at 0.3 M SnCl2. However, this does not differ significantly from the 36.2 mol% LA yield (0.05 level of significance, pooled t-test) obtained at 0.2 M SnCl2. The lower 0.2 M catalyst concentration is used in subsequent experiments. Furthermore, a general trend of decreasing glucose and HMF yields are observed as SnCl2 concentration is increased.

Figure 1: Effect of tin (II) chloride concentration on levulinic acid yield (180°C, 3 h, 1 w/v% cellulose loading, and error bars represent standard errors)
Clearly, SnCl2 has potential as catalyst in levulinic acid production. One problem has to be solved though. SnCl2 is soluble in water, but it undergoes hydrolysis to form an insoluble salt, Sn(OH)Cl or tin hydroxychloride. Eq. (1) explains the cloudy appearance of SnCl2 solution.

Since hydrochloric acid is also formed, SnCl2 in solution is both a Lewis and Bronsted acid. The precipitate, tin hydroxychloride [Sn(OH)Cl] still has significant catalytic activity due to the hydrogen bonding of OH- and Cl- functional groups [11]. This has implications on catalyst recyclability since the precipitate will mix with the insoluble humins and unreacted cellulose during downstream processing. One strategy adopted in this study to eliminate precipitate formation is to combine SnCl2 with a suitable Bronsted acid.
3.2 Evaluation of SnCl2 Mixed-Acid System
Four equimolar mixed-acid systems were evaluated in terms of product yields: SnCl2-HCl, SnCl2-H2SO4, SnCl2-HNO3, and SnCl2-H3PO4. Same test conditions of: 180°C, and 3 h batch reaction time, 1 w/v% cellulose loading and 0.2 M total catalyst concentration were applied. Corresponding runs for the pure Bronsted acids (HCl, H2SO4, HNO3, H3PO4) were also included to compute the synergy factor in Eq. (2) [25]. Selectivity in Eq. (2) is the quotient of LA yield and cellulose conversion (sum of product yields).

where A= LA selectivity using mixed acid system; B= Bronsted acid ratio x LA selectivity using pure Bronsted acid; + Lewis acid ratio x LA selectivity using pure Lewis acid
Based on Fig. 2, highest LA yields were obtained from SnCl2-HCl (47.0 mol%) and SnCl2-H2SO4 (45.8 mol%). This is followed by SnCl2-HNO3 (39.4 mol%) and SnCl2-H3PO4 (37.7 mol%).Three mixed-acid systems have computed synergy factors greater than 1 (1.18 for SnCl2-HCl, 1.10 for SnCl2-H2SO4, and 1.88 for SnCl2-HNO3. A synergy factor greater than 1 indicates that the LA selectivity of the dual catalyst system is higher than the additive LA selectivity using pure Bronsted acid and pure Lewis acid. This means that there are synergistic effects between SnCl2 and the paired Bronsted mineral acid in the conversion of cellulose to levulinic acid [25]. In addition, the synergy factor for SnCl2-H3PO4 is very close to 1 at 0.995.

Figure 2: LA yield and synergy factor of evaluated mixed-acid systems (180°C, 3 h, 1 w/v% cellulose loading, 0.2 M total acid concentration)
SnCl2-HCl will be used in the optimization and kinetic studies since it has the highest LA yield among the mixed-acid pairs. For the SnCl2-HCl system, a unique type of dynamics is observed instead of the double replacement happening in other mixed-acids. Eq. (1) shows that the precipitate formation is reversible. According to Le Chatelier’s principle, adding more HCl to the system shifts the reaction to the left, thereby decreasing the formation of Sn(OH)Cl.
3.3 Optimization of LA Yield Using Response Surface Methodology
Response surface methodology (RSM) based on Box-Behnken design for three factors and three levels was employed. Catalyst concentration was varied (0.1 M, 0.2 M, and 0.3 M) using SnCl2-HCl ratio of 1:1. Then, the batch reactors were placed in the oven at designated reaction temperature (180°C, 200°C, and 220°C). The batch reaction time was varied at 3, 5 and 7 hours. The open-source RStudio version 3.4.4 with RSM library was used to analyze the data and generate the quadratic model, surface plots, and statistical analyses (shown in Appendix B1). Eq. (3) relates the three coded variables: catalyst concentration (x1), temperature (x2), and time (x3) to levulinic acid yield (y).

Fig. 3 shows that predicted LA yield are very close to actual values (Appendix Tab. B1). Validation runs from data points in the kinetic studies are also shown indicating agreement between quadratic model and experimental values. The model has a high coefficient of determination (r2) of 0.964. Thus, 96.4 percent of the variability in the data can be explained by the model. An adjusted r2 taking into account the number of observations and number of coefficients was also high at 0.899 indicating good predictability by the model. Checking the residuals, there is no trend observed suggesting random scatter of data (Fig. B1).
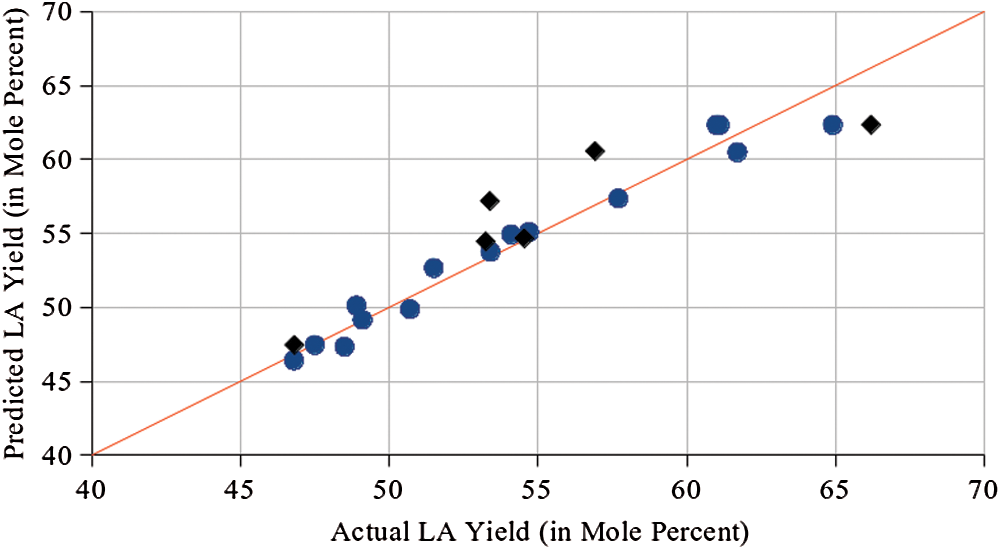
Figure 3: Parity plot of predicted versus actual levulinic acid yield (blue circles represent RSM runs while black diamonds represent validation points from kinetic studies)
Table 1: Comparison of LA yield with values from literature

Analysis of variance (ANOVA) was implemented to test the goodness-of-fit of the model. ANOVA results show that the p-value of the model is 0.0042. This suggests that the model is significant and that there is only 0.42% probability that the computed F-value of 14.86 is attributed to noise. At the 0.05 level of significance, the relationship assumed in the model is reasonable. Lack-of-fit test was also done indicating a p-value of 0.715 which is greater than 0.05. Lack-of-fit is not significant and with this, no model reduction by dropping insignificant terms were attempted. Thus, within the experimental range of 0.1 to 0.3 M catalyst concentration, 180 to 220°C temperature, and batch time of 3 to 7 hours, the model shows good fit between the experimental and predicted values.
Three-dimensional (3D) surface plots were also generated. Two variables (among the three) are varied with the remaining variable maintained at zero level to assess the response in terms of LA yield. Fig. 4 shows the effect of catalyst concentration and temperature on LA yield at constant batch time of 5 hours. LA yield increased with catalyst concentration and temperature until reaching a maximum. After which, there is decreasing trend in LA yield. Further increase in catalyst concentration and temperature can accelerate cellulose hydrolysis, but at the same time promote formation of undesired humins. This resulted in the decline of LA yield after reaching the maximum value. Appendix Figs. C1 and C2 displays the surface plots for LA yield versus catalyst concentration and time and LA yield versus temperature and time, respectively.

Figure 4: 3D response surface plot of LA yield versus catalyst concentration and temperature sliced at batch time = 5 h
The stationary point of the response surface can be interpreted as a maximum, minimum, or saddle point. The computed eigenvalues are negative which means that the stationary point in the response surface is a maximum [26]. The optimum values of the process conditions are 0.17 M catalyst concentration, 198°C, and 6.02 h (5.15 h after correction for heating delay). Substituting these values into the model, the predicted maximum LA yield is 63.5 mol%.
With respect to cellulose as feedstock, the LA yield in this study is higher compared to the 60 mol% achieved using H2SO4 and HCl (pure Bronsted acids), respectively [14,15]. The obtained LA yield from the model is also higher compared to that of Lewis salts such as AlCl3 (36.3 mol%) and FeCl3 (48.9 mol%) [17,18]. However, the LA yield is lower compared to the 76.0 mol% LA yield of its related salt, SnCl4 [27]. Still, one disadvantage in using SnCl4 as catalyst is handling issues. It is a hygroscopic liquid which fumes in contact with air. As shown in Tab. 1, despite the high LA yield obtained in this study, the reaction conditions are more severe in terms of temperature and time compared to previous studies.
A simplified reaction scheme shown in Fig. 5 used in previous studies was followed for comparison [28,18]. Assumptions for this scheme include: (1) Each elementary step is pseudo-first order, (2) The reactions are homogeneous, and (3) The reactions are irreversible. Cellulose undergoes hydrolysis to form glucose (reaction C). Glucose is then dehydrated to form the desired intermediate, HMF (reaction G1). Portion of glucose is converted to soluble and insoluble humins (reaction G2). In the last reaction step, HMF undergoes hydration to form levulinic acid and formic acid (reaction H). The rate models are expressed in Eqs. (4)–(7) as differential equations.

Figure 5: Reaction scheme for the hydrothermal conversion of cellulose to levulinic acid and the rate equations used for kinetic studies


Solving the differential equations, Eqs. (9)–(11) expresses glucose (CG), HMF (CH), and levulinic acid (CL) concentrations in terms of rate constants and apparent reaction time.


Rate constants were determined by nonlinear least squares regression method. The sum of the squares of the errors between experimental and calculated data (for CG, CH and CL) was the objective function to be minimized using a spreadsheet solver. The concentration profiles in Appendix Figs. D1–D3 show the calculated (assumed from the model) and experimental values for concentration with respect to time.
Tab. 2 summarizes the estimated rate constants (from nonlinear regression) and the activation energies (from the Arrhenius equation). The relative values of the rate constants for the reaction steps in the proposed mechanism gives insight into the overall process. kH > kG1 > kG2 > kC implies that cellulose hydrolysis is the rate determining step in the series of reactions for the hydrothermal conversion of cellulose to LA. For all three temperatures, the ratio kC/(kG1 + kG2) is less than 1. This indicates that glucose degradation is faster compared to cellulose degradation [16]. Moreover, kH > kG1 explains the low HMF concentration in the batch experiments since HMF is consumed faster compared to its formation. There is significant humin formation since kG2 values are comparable to kG1 values.
Table 2: Rate Constants (k) and Activation Energies (EA)

Appendix Fig. D4 shows the Arrhenius plots used to determine the activation energy. Comparison with previous studies on cellulose conversion to LA are presented in Tab. 3. Low values for EA,C (56.2 kJ/mol), EA,G1 (63.3 kJ/mol), and EA,G2 (75.2 kJ/mol) coincide with values for Lewis acids such as FeCl3 and SnCl4 [18,27]. The low activation energy for glucose dehydration to HMF (EA,G1) supports the action of SnCl2 in facilitating the isomerization of glucose to fructose which is more easily converted to 5-HMF [27]. However EA,G2 is also low. The catalyst system being studied not only lowers the energy barrier of glucose dehydration to HMF but also the glucose degradation to humins. The high EA,H value of 112.0 kJ/mol coincides with that of Bronsted acids [15,28]. This also justifies the optimum temperature of 198°C determined through RSM. Thus, the SnCl2-HCl catalyst system has activation energies falling between that of Bronsted acids and Lewis acids in the literature owing to its dual acidic nature
Table 3: Activation energies of reaction steps in the cellulose conversion to levulinic acid

LA yields were then simulated for idealized continuous reactors (assuming constant density, isothermal and steady-state operation) [28]. Fig. 6 shows the predicted LA yields with respect to residence time for a plug flow reactor (PFR) and continuous stirred tank reactor (CSTR).

Figure 6: Simulation of levulinic acid yield for plug flow reactor (PFR) and continuous stirred tank reactor (CSTR)
At an assumed residence time, the LA yields for a PFR are generally higher compared to that for a CSTR. At 220°C, high LA yields at low residence times can be obtained for a PFR. However, it is at 200°C where the maximum LA yield can be achieved at longer residence times. This is in agreement with the dual reactor configuration of the established Biofine process where the first PFR has a shorter residence time and temperature of 210–220°C while the second CSTR operates at longer residence time and lower temperature of 190–200°C [17].
Optimum LA yield of 36.2 mol% was achieved at 0.2 M SnCl2 concentration. The precipitate Sn(OH)Cl formed through the hydrolysis of SnCl2 may cause problems in catalyst recyclability and in downstream processing. One strategy to address this issue is the use of mixed-acid systems. SnCl2-HCl, SnCl2-H2SO4, SnCl2-HNO3, and SnCl2-H3PO4 were evaluated for their catalytic activity towards LA. SnCl2-HCl system exhibited highest LA yield of 47.0 mol% and synergy factor of 1.18 indicating synergistic effect between SnCl2 and HCl.
A quadratic model that relates LA yield to three independent variables (catalyst concentration, temperature and time) was generated. The generated model (with r2 value of 0.962) was reasonable at the 0.05 level of significance based on F-test. The predicted maximum LA yield was 63.5 mol% at 0.18 M catalyst concentration, 198°C, and 5.15 h reaction time. This value is slightly higher compared to reported LA yields for Bronsted acids.
From the kinetic studies, cellulose hydrolysis is the rate determining step of the whole process. HMF consumption is faster than its formation. There is also significant humins formation. Generally, the SnCl2-HCl catalyst system has activation energies falling between that of Bronsted acids and Lewis acids. In particular, the relatively low activation energy for the glucose dehydration to HMF supports the action of SnCl2 in the isomerisation of glucose fructose which is more easily converted to 5-HMF. For its industrial implications, LA yields were simulated with respect to residence time for continuous flow reactors (PFR and CSTR).
Acknowledgement: The authors would like to thank the Chemical Engineering Analytical Laboratory (CEAL) of the Department of Chemical Engineering, University of the Philippines Diliman for the use of the HPLC equipment.
Funding Statement: The research work and the publication of this paper were funded by the Engineering Research and Development for Technology (ERDT) program of the Department of Science and Technology (DOST), Republic of the Philippines.
Conflicts of Interest: The authors declare that they have no conflicts of interest to report regarding the present study.
1. Yan, L., Yang, N., Pang, H., Liao, B. (2008). Production of levulinic acid from bagasse and paddy straw by liquefaction in the presence of hydrochloride acid. CLEAN—Soil, Air, Water, 36(2), 158–163. DOI 10.1002/clen.200700100. [Google Scholar] [CrossRef]
2. Alipour, S., Omidvarborna, H. (2016). High concentration levulinic acid production from corn stover. RSC Advances, 6(112), 111616–111621. DOI 10.1039/C6RA23768A.
3. Victor, A., Pulidindi, I. N., Gedanken, A. (2014). Levulinic acid production from Cicer arietinum, cotton, Pinus radiata and sugarcane bagasse. RSC Advances, 4(84), 44706–44711. DOI 10.1039/C4RA06246A.
4. Yang, Z., Kang, H., Guo, Y., Zhuang, G., Bai, Z. et al. (2013). Dilute-acid conversion of cotton straw to sugars and levulinic acid via 2-stage hydrolysis. Industrial Crops and Products, 46, 205–209. DOI 10.1016/j.indcrop.2013.01.031.
5. Girisuta, B., Danon, B., Manurung, R., Janssen, L. P. B. M., Heeres, H. J. (2008). Experimental and kinetic modelling studies on the acid-catalysed hydrolysis of the water hyacinth plant to levulinic acid. Bioresource Technology, 99(17), 8367–8375. DOI 10.1016/j.biortech.2008.02.045. [Google Scholar] [CrossRef]
6. Rackemann, D. W., Doherty, W. O. (2011). The conversion of lignocellulosics to levulinic acid. Biofuels, Bioproducts and Biorefining, 5(2), 198–214. DOI 10.1002/bbb.267. [Google Scholar] [CrossRef]
7. Yan, K., Jarvis, C., Gu, J., Yan, Y. (2015). Production and catalytic transformation of levulinic acid: a platform for speciality chemicals and fuels. Renewable and Sustainable Energy Reviews, 51, 986–997. DOI 10.1016/j.rser.2015.07.021. [Google Scholar] [CrossRef]
8. Yu, Z., Lu, X., Xiong, J., Ji, N. (2019). Transformation of levulinic acid to valeric biofuels: A review on heterogeneous bifunctional catalytic systems. ChemSusChem, 12(17), 3915–3930. DOI 10.1002/cssc.201901522. [Google Scholar] [CrossRef]
9. Schmidt, L. M., Mthembu, L. D., Reddy, P., Deenadayalu, N., Kaltschmitt, M. et al. (2017). Levulinic acid production integrated into a sugarcane bagasse based biorefinery using thermal-enzymatic pretreatment. Industrial Crops and Products, 99, 172–178. DOI 10.1016/j.indcrop.2017.02.010. [Google Scholar] [CrossRef]
10. Hayes, D. J., Fitzpatrick, S., Hayes, M. H. B., Ross, J. R. H. (2005). The Biofine process—production of levulinic acid, furfural, and formic acid from lignocellulosic feedstocks. In: Kamm, B., Gruber, P. R., Kamm, M. (eds.Biorefineries-Industrial processes and products, pp. 139–164. [Google Scholar]
11. Fernandez, V. L. (2017). LIFE13 ENV/ES/001165 Final Technical Report (LIFE WALEVA). Tecnicas Reunidas, S.A. http://waleva.eu/wp-content/uploads/2018/04/Final-technical-Report.pdf. [Google Scholar]
12. Handbook of Commercial Bio-based Chemicals: 2013-2016 (2016). London: Tecnon Orbichem, Ltd.
13. Isoni, V., Kumbang, D., Sharratt, P. N., Khoo, H. H. (2018). Biomass to levulinic acid: a techno-economic analysis and sustainability of biorefinery processes in Southeast Asia. Journal of Environmental Management, 214, 267–275. DOI 10.1016/j.jenvman.2018.03.012. [Google Scholar] [CrossRef]
14. Girisuta, B., Janssen, L. P. B. M., Heeres, H. J. (2007). Kinetic study on the acid-catalyzed hydrolysis of cellulose to levulinic acid. Industrial & Engineering Chemistry Research, 46(6), 1696–1708. DOI 10.1021/ie061186z. [Google Scholar] [CrossRef]
15. Shen, J., Wyman, C. E. (2012). Hydrochloric acidcatalyzed levulinic acid formation from cellulose: data and kinetic model to maximize yields. AIChE Journal, 58(1), 236–246. DOI 10.1002/aic.12556. [Google Scholar] [CrossRef]
16. Peng, L., Lin, L., Zhang, J., Zhuang, J., Zhang, B. et al. (2010). Catalytic conversion of cellulose to levulinic acid by metal chlorides. Molecules, 15(8), 5258–5272. DOI 10.3390/molecules15085258. [Google Scholar] [CrossRef]
17. Khan, A. S., Man, Z., Khalil, M. A. B., Kait, C. F., Maulud, A. S. (2014). Effect of ball milling on the catalytic conversion of cellulose to levulinic acid. Applied Mechanics and Materials, 625, 353–356. DOI 10.4028/www.scientific.net/AMM.625.353. [Google Scholar] [CrossRef]
18. Zheng, X., Zhi, Z., Gu, X., Li, X., Zhang, R. et al. (2017). Kinetic study of levulinic acid production from corn stalk at mild temperature using FeCl3 as catalyst. Fuel, 187, 261–267. DOI 10.1016/j.fuel.2016.09.019. [Google Scholar] [CrossRef]
19. Choudhary, V., Mushrif, S. H., Ho, C., Anderko, A., Nikolakis, V. et al. (2013). Insights into the interplay of Lewis and Brønsted acid catalysts in glucose and fructose conversion to 5-(hydroxymethyl)furfural and levulinic acid in aqueous media. Journal of the American Chemical Society, 135(10), 3997–4006. DOI 10.1021/ja3122763. [Google Scholar] [CrossRef]
20. da Silva, M. J., Julio, A. A., dos Santos, K. T. (2015). Sn(II)-catalyzed β-citronellol esterification: A Brønsted acid-free process for synthesis of fragrances at room temperature. Catalysis Science & Technology, 5(2), 1261–1266. DOI 10.1039/C4CY01069H. [Google Scholar] [CrossRef]
21. Bayu, A., Yoshida, A., Karnjanakom, S., Kusakabe, K., Hao, X. et al. (2018). Catalytic conversion of biomass derivatives to lactic acid with increased selectivity in aqueous tin(ii) chloride/choline chloride system. Green Chemistry, 20(17), 4112–4119. DOI 10.1039/C8GC01022F. [Google Scholar] [CrossRef]
22. Zhao, W., Li, Y., Song, C., Liu, S., Li, X. et al. (2017). Intensified levulinic acid/ester production from cassava by one-pot cascade prehydrolysis and delignification. Applied Energy, 204, 1094–1100. DOI 10.1016/j.apenergy.2017.03.116. [Google Scholar] [CrossRef]
23. Scarlata, C. J., Hyman, D. A. (2010). Development and validation of a fast high pressure liquid chromatography method for the analysis of lignocellulosic biomass hydrolysis and fermentation products. Journal of Chromatography A, 1217(14), 2082–2087. DOI 10.1016/j.chroma.2010.01.061. [Google Scholar] [CrossRef]
24. Marakatti, V. S., Shanbhag, G. V., Halgeri, A. B. (2013). Condensation reactions assisted by acidic hydrogen bonded hydroxyl groups in solid tin(ii)hydroxychloride. RSC Advances, 3(27), 10795. DOI 10.1039/c3ra41152d.
25. Yang, F., Fu, J., Mo, J., Lu, X. (2013). Synergy of Lewis and Brønsted Acids on catalytic hydrothermal decomposition of hexose to levulinic acid. Energy & Fuels, 27(11), 6973–6978. DOI 10.1021/ef401560v. [Google Scholar] [CrossRef]
26. Dean, A., Voss, D., Draguljic, D. (2017). Design and analysis of experiments. New York, NY: Springer. [Google Scholar]
27. Qing, Q., Guo, Q., Wang, P., Qian, H., Gao, X. et al. (2018). Kinetics study of levulinic acid production from corncobs by tin tetrachloride as catalyst. Bioresource Technology, 260, 150–156. DOI 10.1016/j.biortech.2018.03.073. [Google Scholar] [CrossRef]
28. Dussan, K., Girisuta, B., Haverty, D., Leahy, J. J., Hayes, M. H. B. (2013). Kinetics of levulinic acid and furfural production from Miscanthus giganteus. Bioresource Technology, 149, 216–224. DOI 10.1016/j.biortech.2013.09.006. [Google Scholar] [CrossRef]
Appendix A. Additional data from HPLC analysis

Figure A1: Glucose calibration plot

Figure A2: Hydroxymethylfurfural (HMF) calibration plot

Figure A3: Levulinic acid (LA) calibration plot

Figure A4: Sample HPLC chromatograms of product mixture (0.2 M SnCl2 , 180°C, 3 h) and corresponding standard solutions
Appendix B. Results of response surface methodology
B1 Statistical Output of Rstudio
Call:


Figure B1: Residual plot of RSM model
Appendix C. 3D surface plots

Figure C1: 3D response surface plot of levulinic acid yield versus temperature and time sliced at catalyst concentration = 0.2 M

Figure C2: 3D response surface plot of levulinic acid yield versus catalyst concentration and time sliced at temperature = 200°C
Appendix D. Concentration profiles and Arrhenius plots

Figure D1: Concentration profile of glucose, HMF and levulinic acid at 180°C

Figure D2: Concentration profile of glucose, HMF and levulinic acid at 200°C

Figure D3: Concentration profile of glucose, HMF and levulinic acid at 220°C

Figure D4: Arrhenius plots for activation energy estimation