
 Submit a Paper
 Propose a Special lssue
 Open Access
ARTICLE
Environmentally Friendly Tannic Acid-Furfuryl Alcohol-Soybean Isolate/Casein Composite Foams Reinforced with Wood Fibers
1 Department of Wood and Forest Sciences, Laval University, Québec, G1V 0A6, Canada
2 Department of Nanotechnology, Zonguldak Bülent Ecevit University, Zonguldak, 67900, Turkey
3 Yunnan Provincial Key Laboratory of Wood Adhesives and Glued Products, Southwest Forestry University, Kunming, 650224, China
4 Department of Chemical Engineering, Laval University, Québec, G1V 0A6, Canada
* Corresponding Author: Xiaodong (Alice) Wang. Email:
Journal of Renewable Materials 2025, 13(2), 329-347. https://doi.org/10.32604/jrm.2024.056795
Received 31 July 2024; Accepted 16 October 2024; Issue published 20 February 2025
 View Full Text
 Download PDF
Abstract
In this study, two series of foams based on tannic acid (TA), furfuryl alcohol (FA), soybean protein isolate (SPI), and casein (CA), namely TA–FA–SPI (TS series) and TA–FA–CA (TC series) were developed, and their properties were enhanced by adding poplar fibers (WF). From the samples produced, a complete set of characterization was performed including possible crosslinking reactions, morphology, mechanical properties, flame retardancy, thermal insulation and thermal stability. Fourier-transform infrared spectroscopy (FTIR) revealed possible covalent crosslinking among the components and hydrogen bonding between WF and the matrix. Viscosity results indicated that lower prepolymer viscosity led to lower apparent density, while WF addition reduced even more the density. Mechanical tests showed that the maximum compressive strengths were good, while WF improved the compressive strength by up to 56%. Scanning electron microscopy (SEM) showed uniform cell structures, but small open pores were observed. Two-dimensional (2D) CT scan images confirmed the good compatibility between WF and the matrix, with low anisotropy in the material. Friability tests indicated that WF decreased the pulverization ratio of the materials by up to 42%. Thermogravimetric analysis (TGA) showed good thermal stability of the materials up to 328°C. Vertical burning tests showed that the materials were self-extinguishing without residue (dripping). The lowest thermal conductivity was 0.04 W/m·K. These results suggest that these novel formaldehyde-free, high biomass content (95%–96%) foams and composite foams have high potential to replace traditional phenolic foams (PF) in applications such as construction, transportation, packaging, and thermal insulation.Keywords
The preparation of phenolic (PF) foams requires higher processing temperatures, higher processing conditions and higher raw material costs than other types of foams (e.g., polystyrene foam and polyurethane foam). Phenolic foam lacks flexible chain segments in its molecular structure and is prone to brittle fracture. Harmful gases such as formaldehyde are released during production and processing [1]. These drawbacks limit its further marketable applications. Biomass phenols are extracted from agricultural waste, wood processing by-products, etc., and the use of biomass phenols instead of petroleum-based phenols helps to reduce the production cost of phenolic (PF) foams. Some biomass phenols are rich in functional groups and can be easily chemically modified to reduce the brittleness of PF foams. It can also reduce the release of harmful gases and increase the environmental friendliness of the product [2].
Tannins are considered one of the biomass phenolic compounds with multiple -OH groups that can replace petroleum phenols in the development of phenolic foams [3]. Secondly, tannins can be modified by hydrolysis, polymerization, copolymerization or grafting to produce more functional materials. In recent years, tannins have been used in the manufacture of a variety of new products, including flame-retardant materials, wood adhesives, preservatives, and three-dimensional (3D) printed materials [4]. The main advantages are that they are highly abundant raw materials, renewable, degradable, and non-polluting, with potential for industrial applications as substitutes for non-renewable materials.
Researchers have developed tannin-based foams using glyoxal, glutaraldehyde and hexamine to replace formaldehyde crosslinkers [5,6], non-isocyanate polyurethanes, polyfurfuryl humates and other completely aldehyde-free formulations under alkaline or acid catalysis conditions through physical, chemical and mechanical stirring methods [7,8]. These methods generated a wide range of foams suitable for different applications. For example, rigid, semi-rigid and flexible foams which exhibit excellent fire resistance, chemical resistance, biodegradability, and excellent thermal insulation [6,9]. However, the fragility of tannin foam remains high. Researchers have improved the friability and mechanical properties of tannin foams by introducing organic or inorganic additives such as multi-walled carbon nanotubes, graphite fillers, cellulose nanofibers, lignocellulosic fibers and cellular/nonporous foam structures [9,10]. However, they need to be further improved.
Wood fiber is a natural material from a wide range of sources, including renewable sources. Compared with inorganic reinforcing materials, wood fibers are easy to process, have a lower density, and are compatible with matrix materials such as resins and plastics [11]. Wood fibers are used as reinforcement in many types of foams to improve the properties of foam composites such as polylactic acid (PLA), starch, polyhydroxy fatty acid esters (PHA), polyvinyl alcohol (PVA), and proteins [12]. There are no previous studies on the effect of wood fibers with high aspect ratios on the enhancement of tannin-based foams. Therefore, this study attempts to use wood fiber-reinforced tannin-based foams with the expectation that the friability and mechanical properties would be significantly improved.
Secondly, the formulations studied so far without petroleum-based crosslinkers have poor foam performance. Soybean isolate protein (SPI) and casein (CA) are natural proteins mainly extracted from soybeans and milk. They have good biodegradability, biocompatibility, and renewability, because their structures contain a variety of functional groups, such as amino (-NH2), carboxyl (-COOH), and hydroxyl (-OH), which can facilitate interactions with various compounds [13,14]. These proteins have been transformed into films, foams, fibers, plastics, and biomedical materials [15,16]. Therefore, this study attempts to use SPI and CA as crosslinking agents for TA to develop tannin foams with better performance and environmental friendliness.
In this study, we will develop two series of novel aldehyde-free tannic acid (TA)—furfuryl alcohol (FA)—soybean isolate protein (SPI) (TS series) and TA–FA—casein (CA) (TC series) biomass tannin-based foams were developed, and their properties were improved by adding poplar fibers (WF). These foams are proposed as potential alternatives to PF for different industrial applications. Possible covalent bond crosslinking reactions between these materials are investigated, and the effect of different SPI and CA ratios on the general properties of the foams is evaluated. The relationship between the viscosity of the prepolymer and the cell anisotropy and the apparent density of the foam material is also studied, as well as the effect of WF addition. Finally, the properties of the tannin-based foams are compared with those of conventional PF to confirm their potential application markets.
Tannic acid (TA, C76H52O46, 1701.2 g/mol), furfuryl alcohol (FA, C5H6O2, 98%), casein (from bovine milk), sodium hydroxide (NaOH, 97%, 40.0 g/mol), nitric acid (63%), sorbitol (SO, C6H14O6, 182.1 g/mol) and Tween-80 (TW) were purchased from MilliporeSigma Canada Ltd., with the brand name of Sigma Aldrich (Oaklille, Ontatio, Canada). Soybean protein isolate (SPI, average protein content ≥90%) was purchased from Myprotein, a nutritional brand of The Hut Group (Manchester, UK). Deionized water (WA) and Poplar wood fibers (WF) were provided by the Department of Wood and Forest Science (Laval University, Canada). The average length of WF was 1.65 mm (between 1.0 and 4.5 mm), while the average width was 16 μm (between 10 and 50 μm). The hand mixer (KitchenAid, KHM512AQ) with a maximum speed of 1100 rpm was purchased from Whirlpool Corporation (Benton Charter Township, Benton Harbor, MI, USA).
2.2 Preparation of Foams and Composite Foams
The foams and composite foams of the TS and TC series were prepared according to the formulations reported in Table 1. First, the poplar fibers were treated in a 2% aqueous NaOH solution at 25°C for 2 h. The fibers were then washed to neutrality with deionized water and dried in an oven at 60°C for 8 h, labeled WF. Nitric acid was diluted to 4 mol/L and labeled as HN. Next, SPI or CA, FA, WA, SO and TA were added into a 250 ml plastic beaker and stirred vigorously with a kitchen blender for 1 min. Then, the catalyst (NA) and surfactant (TW) were added and stirring was continued for 4 min. WF was added together with the main raw materials to prepare composite foams. The stirred prepolymer was placed in an oven at 95°C for curing. After curing for 1 h, the temperature of the oven was adjusted to 80°C. After drying for 23 h, the samples (foams and composite foams) were prepared following the steps in Fig. 1.
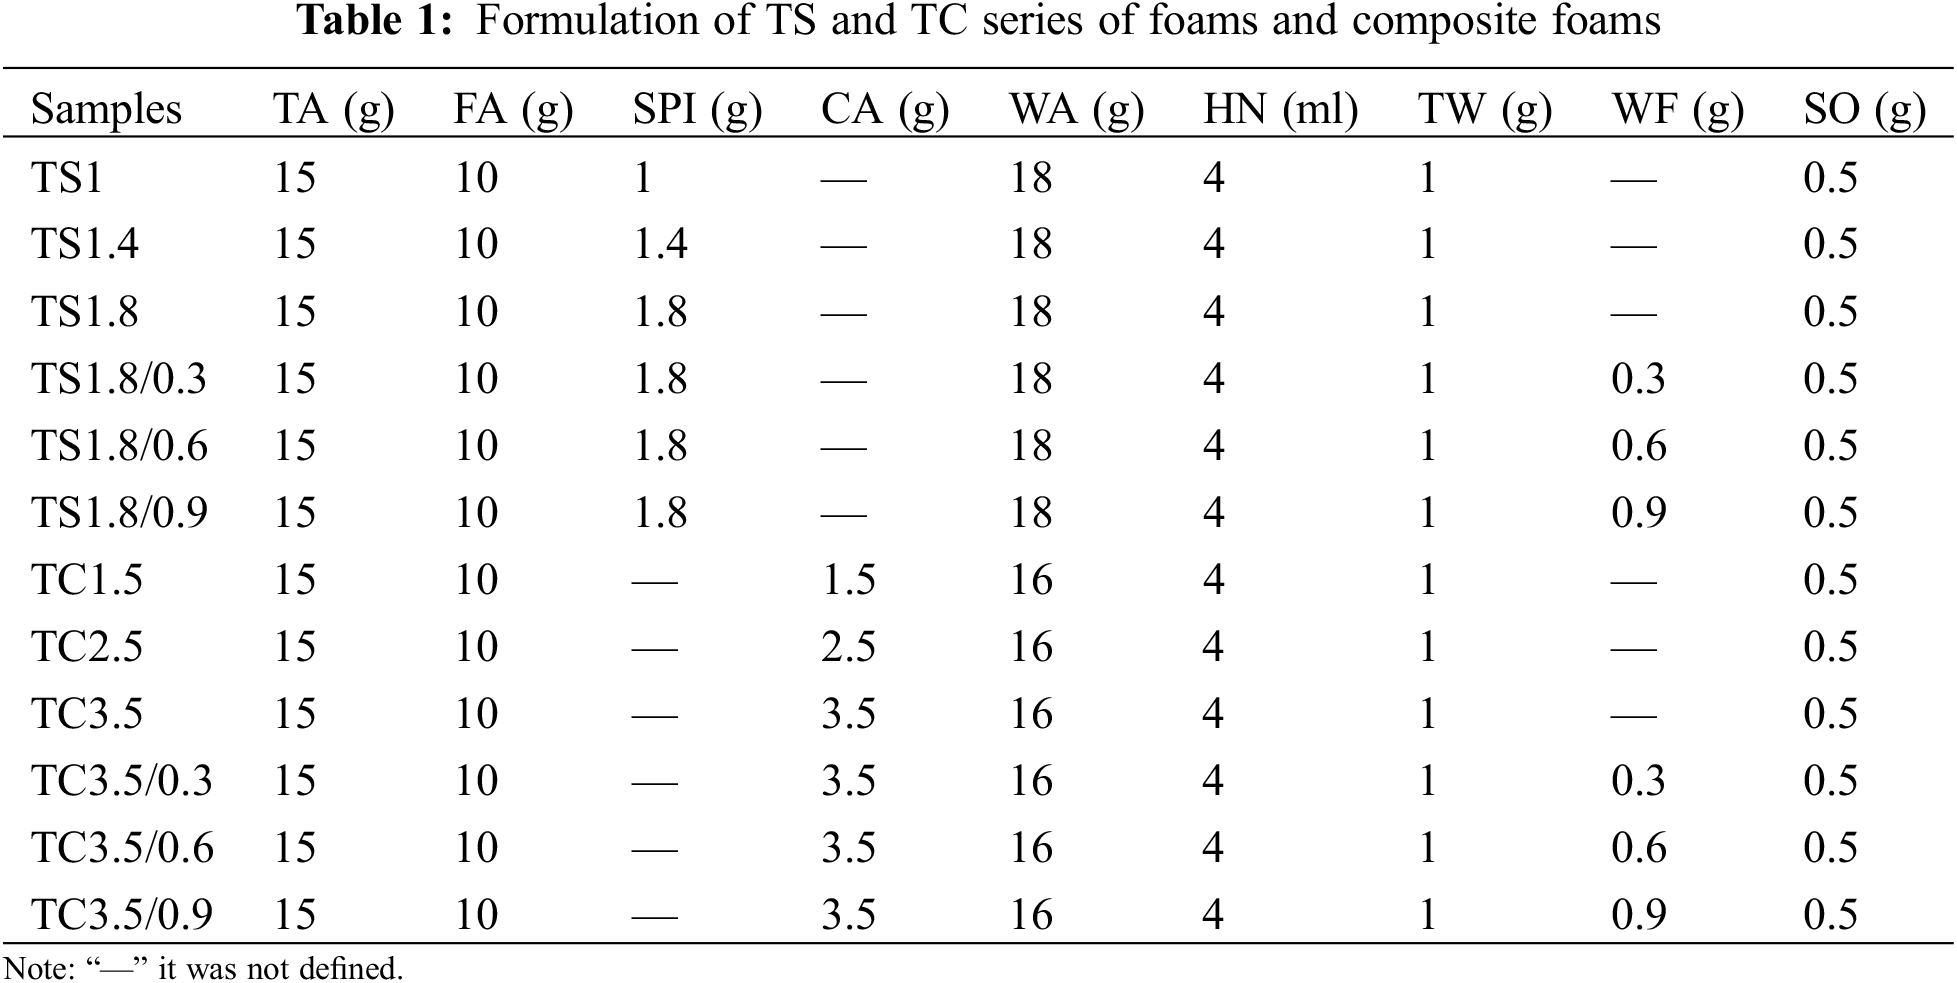

Figure 1: Preparation steps for the TS and TC series of foams and composite foams
The weight and geometric volume of the resulting foams were used to calculate the apparent density (kg/m3) following ASTM D1622-03 under ambient conditions. The weight of the foams was measured by an electronic scale (1910T47, 0.001 g, McMaster-Carr), while the dimensions of cubic specimens (30 mm × 30 mm × 30 mm) were determined with a digital caliper. Five repetitions were carried out to obtain an average with a standard deviation.
The viscosity of the prepolymers was determined at room temperature using a Byko-visc (BYK-Gardner, Geretsried, Germany) viscometer with the optional LVA low viscosity system. The number 4 spindle was selected and run at 30 rpm for single-point testing and time-stop mode.
Fourier transform infrared (FTIR) spectroscopy was undertaken on a Spectrum 400 spectrometer (Perkin Elmer, USA). One gram of KBr was mixed with 0.01 g powder of each sample to prepare the test samples. Each sample was recorded over 32 scans between 400 and 4000 cm−1 with a resolution of 4 cm−1.
The samples were cut into cubes of 10 mm × 10 mm × 10 mm and the foam morphology (cell structure) were observed using a scanning electron microscope (SEM) Inspect F50 (FEI, Hillsboro, TX, USA) at 15 kV under different magnifications. To increase the electric conductivity of the samples, a thin gold coating was applied before measuring.
Compression strength (ASTM D412) was conducted at room temperature (23°C) on an Instron universal testing machine (USA) model 5565 with a 500 N load cell. The crosshead speed was 10 mm/min and the parameters (modulus, strength, etc.) were obtained from the average of a minimum of five samples.
Friability was measured by weighing the mass loss of the foam after friction as reported elsewhere [17]. The foams were cut into cubes of 50 mm × 50 mm × 5 mm and put on a 400-grit sandpaper with a length of 250 mm. Then, a 200 g iron probe was placed on the foam, which was pulled from the beginning of the sandpaper to its end. This travel was carried out 30 times and the amount of remaining foam was recorded. The degree of pulverization (
where
A thermogravimetric analyzer (TGA/DSC3, Mettler Toledo, Greifensee, Switzerland) operated under a nitrogen atmosphere was used to test the thermal behavior of the various foams at a heating rate of 10°C/min from room temperature to 800°C. From the curves obtained, the temperature of heat resistance index (THRI) was calculated as [18]:
where T5 is the temperature at which the sample exhibited 5% mass loss and T30 is the temperature at which the sample had 30% mass loss.
A homemade thermal conductivity analyzer based on ASTM E1225 was used to measure the heat flux (Q) and determine the thermal conductivity (k). The specimens were cut (50 mm × 50 mm) and a digital caliper was used to measure the final thickness (L = 3.47–3.72 mm). Each sample was placed between two thin aluminum sheets and two plates with controlled temperatures of 33°C (top plate) and 13°C (bottom plate) giving an average room temperature of 23°C and a temperature difference ∆T = 20°C. Water-cooled Peltier plates (Model K20, Haake, Germany) kept the temperatures constant, while the equilibrium heat flux was measured via a PHFS-01 heat flux sensor (Flux Teq LLC, Blacksburg, VA, USA). The thermal conductivity was calculated as (Fourier law):
The k values reported represent the average of three repetitions with their standard deviations.
A cone calorimeter (Cone Calorimeter, FTT, East Grinstead, UK) was used to estimate the combustion behavior of the foams according to ISO 5660. The dimensions of the samples were 100 mm × 100 mm × 50 mm. The tests were carried out under a heat flux of 100 kW/m2 and each sample was measured three times to obtain the average value.
Foam samples were cut to 10 mm × 10 mm × 50 mm and a butane spray gun (around 1000°C) was used to burn them. The spray gun was fixed in such a way that the distance between the muzzle and the foam was 50 mm, to burn the foam at the same temperature of the flame.
Structural and morphological information of the foams was obtained by computed tomography using a CT-Analyzer system (SkyScan 1272, Bruker, Billerica, MA, USA). The projections at each angular position were recorded by rotating the sample over 360°. The 3D images were reconstructed using a filtered back-projection algorithm. The images were then binarized to separate objects from the background using a global thresholding procedure. A component labeling algorithm was then used to remove all non-connected parts usually caused by image noise. A volume of interest (VOI) was digitally extracted from the measurement data and the final image of the VOI was analyzed using standard morphometric algorithms.
Representative data were collected from published articles on phenolic foams (typical phenolic foams or foams prepared using the same methodology as in this study) and compared with the data from this study (thermal conductivity, flame retardancy, crush ratio, and specific compression strength).
Tannin-furfuryl alcohol-formaldehyde is the basic formulation of tannin-based foams, and biomass tannin-based foams with excellent thermal insulation properties were prepared under room temperature conditions using ether as a foaming agent and by using the self-condensation of furfuryl alcohol exotherm under acidic conditions [19]. The formulation had a biomass content of 83.78%. However, the formulation used formaldehyde as a crosslinking agent, resulting in products with a free formaldehyde content of 0.08 mg/m3. Ether, as a foaming agent, poses a threat to human health and safety during the production process. Szczurek et al. prepared tannin-based foams for the first time by curing and drying tannic acid solutions containing surfactants and crosslinking agents (hexamers) through mechanical stirring, similar to lightweight pastries made from the stirring of proteins. This new method is not only simple, fast and cost-effective, but also allows the production of foams with a wide range of apparent densities and cell sizes by controlling the concentration of tannic acid in the initial solution (viscosity of the prepolymer) [20]. However, this solution may result in a low degree of curing due to the short reaction time and low curing temperature, which ultimately leads to poor mechanical properties of the foam. The present experiment was designed based on the advantages and disadvantages of these two experiments and the characteristics of the raw materials. The details are as follows: hydrolyzed tannin (tannic acid) was chosen as the main raw material because hydrolyzed tannin has better solubility, especially in aqueous media, and it has a looser molecular structure, which makes it easier to undergo chemical reactions [21]. SPI and CA were selected to replace petroleum-based crosslinkers to improve the biomass content of the formulation and the environmental friendliness of the product. Secondly, they are nitrogen-containing compounds that can improve the flame retardancy of the foams. Mechanical mixing of the foaming method was used to avoid the use of volatile blowing agents and to further increase the biomass content of the foams, resulting in foams with a biomass content of 95%–96%. The use of WF with a high aspect ratio and good biocompatibility can further improve the properties of the foams, especially mechanical ones. The water absorption of SPI, CA and WF was used to control the viscosity of the prepolymer to obtain foams with different densities.
3.2 Viscosity Analysis of Prepolymers
Fig. 2 reports the viscosity of the prepolymers based on the TS and TC series of foams and composite foams after vigorous mechanical agitation. The results show that when the amount of SPI and CA increases, the viscosity of the TS series prepolymers increases by 29% from 587 mPa·s (TS1) to 760 mPa·s (TS1.8). Similar increases (27%) are observed for the TC series prepolymers from 1040 mPa·s (TC1.5) to 1325 mPa·s (TC3.5). Because SPI and CA are solid at room temperature, their addition leads to higher prepolymer viscosity [22]. The viscosity of the TS1.8 prepolymer increased by 10%, from 887 mPa·s (TS1.8/0.3) to 971 mPa·s (TS1.8/0.9), when the amount of WF increased from 0.3 g (about 6 ‰) to 0.9 g (about 18 ‰), while the viscosity of the TC3.5 prepolymer increased by 6%, from 1792 mPa·s (TC3.5/0.3) to 1905 mPa·s (TC3.5/0.9). These differences are related to the fact that WF absorbs water from the prepolymer, resulting in higher prepolymer viscosity. Nevertheless, the presence of solid particles also limits the motion of the liquid phase leading to higher viscosity (suspension effect). This effect is important as the prepolymer viscosity is the main parameter controlling the anisotropy, density, and porosity (cell size) of the foams prepared using mechanical mixing [19].

Figure 2: Prepolymers viscosity of the TS and TC series
3.3 Fourier Transform Infrared Spectroscopy (FTIR)
Fig. 3a presents the FTIR spectra of the foams and composite foams based on CA, SPI, TS series and TC series. The wide absorption band at 3400 cm−1 is associated with the characteristic peaks of -OH or -NH and -OH bound groups. The sharp peak at 2931 cm−1 and the small shoulder at 2851 cm−1 are associated with symmetric and asymmetric C-H stretching vibrations of -CH2 and -CH3 groups [23]. The SPI and CA bands at 1639 cm−1 are C=O stretching vibrations (amide I) and 1521 cm−1 are N-H bending (amide II). The band at 1397 cm−1 represents C-O-O stretching vibrations, while C-N stretching vibration and N-H bending vibration (amide III) are also observed at 1243 cm−1. Finally, the band at 1051 cm−1 represents -C-NH2 bending frequency [19,24].

Figure 3: FTIR spectra of (a) SPI, CA, TS and TC series of foams and (b) WF-reinforced TS1.8 and TC3.5 series of composite foams
The reactions between the components are complex as described in previous MALDI-ToF-MS and FTIR analyses [19]. TA or FA can react with arginine (SPI) or proline (CA) in proteins. First, the -COOH group of TA reacts with the amino group of the amino acid on the side chain, while TA or FA can also react with the functional group of the amino acid in the peptide chain through the -OH group on the phenolic ring. Chalton et al. proposed a three-stage model for the interaction of tannins with proteins [24]. Firstly, hydrophobic binding occurs between the planes of the aromatic ring of the tannin and the hydrophobic site of the protein (pyrrolidine ring of the proline residue). At the same time, hydrogen bonding between the hydroxyl group of the tannins and the hydrogen acceptor sites of the protein (carbonyl and -NH2 groups) contributes to the stabilization of the complex. Next, the protein-tannin complexes self-conjugate through further hydrogen bonding to produce more soluble protein-tannin complexes, which then aggregate together. Compared with the spectra of the products, the peaks at 1693 cm−1 (C=O), 1397 cm−1 (C-O-O), 1243 cm−1 (C-N) (amide III), and 1051 cm−1 (C-O) disappeared for SPI and CA, which was attributed to the interaction of SPI or CA with TA and the reaction with FA. In addition, the weak characteristic peak at 1522 cm−1 in Fig. 3a suggests that the reaction proceeds through the formation of secondary amines from primary amines in SPI or CA. The peak at 1708 cm−1 seems to indicate that the tannin hydroxyl group is esterified by the protein side chain acids. In other words, the reaction of proteins with TA can occur either through the amino group of the protein side chain or through the esterification of the side chain acid group [19].
Fig. 3b presents the FTIR spectra of WF-reinforced TS1.8 series and TC3.5 series composite foams. The results show that the -OH telescopic vibration frequencies of TS1.8 and TC3.5 are at 3360 and 3334 cm−1, respectively. After WF addition, the -OH telescopic vibration frequencies of TS1.8/0.3, TS1.8/0.6, and TS1.8/0.9 are at 3350, 3352, and 3355 cm−1, respectively. The -OH stretching vibrational frequency is red-shifted, which indicates the formation of strong hydrogen bonds between -OH, a phenomenon known as the “hydrogen bonding effect”. This indicates that a good bonding force between WF and the matrix occurs [25]. The hydrogen bonding effect resulted in a denser foam structure, which can be interpreted as WF enhancing the composite mechanical properties. After WF addition, the -OH stretching vibration frequencies of the TC3.5 series composite foams were still at 3357, 3366 and 3378 cm−1, respectively, i.e., no red shift was observed.
3.4 Morphological Characteristics
For the morphological characteristics of the TS-series and TC-series of foams and composite foams are shown in Fig. 4a. The images show that these materials form a homogeneous gas-phase structure similar to that previously reported for tannin-based foams prepared using mechanical stirring [20]. The anisotropy of TS1, TS1.4 and TS1.8 in Fig. 4b increased by 67% from 1.12 to 2.02, while the anisotropy of TC1.5, TC2.5 and TC3.5 increased by only 34% from 1.19 to 1.60. The reason for the anisotropy increase (TS and TC series of foams) is that SPI and CA are added to the prepolymer, and their dissolution leads to a viscosity increase in the prepolymer (Fig. 2). During the foaming process, the anisotropy of the foam becomes more significant due to the coupled effect of gravity and viscosity. In general, the higher the viscosity of the prepolymer, the more inhomogeneous the size of the stirred cells is and the thicker the cell walls are. The effect of gravity makes the cells tend to expand more vertically, a phenomenon that is common in PF cured using an oven [26]. The TS series showed a substantial increase in viscosity even though only 0.4 g was added at a time. The reason is that when soybean isolate proteins are dissolved in water, the solution viscosity substantially increases due to factors such as unfolding and stretching of molecular chains, enhanced intermolecular interactions, protein aggregation and gelation.
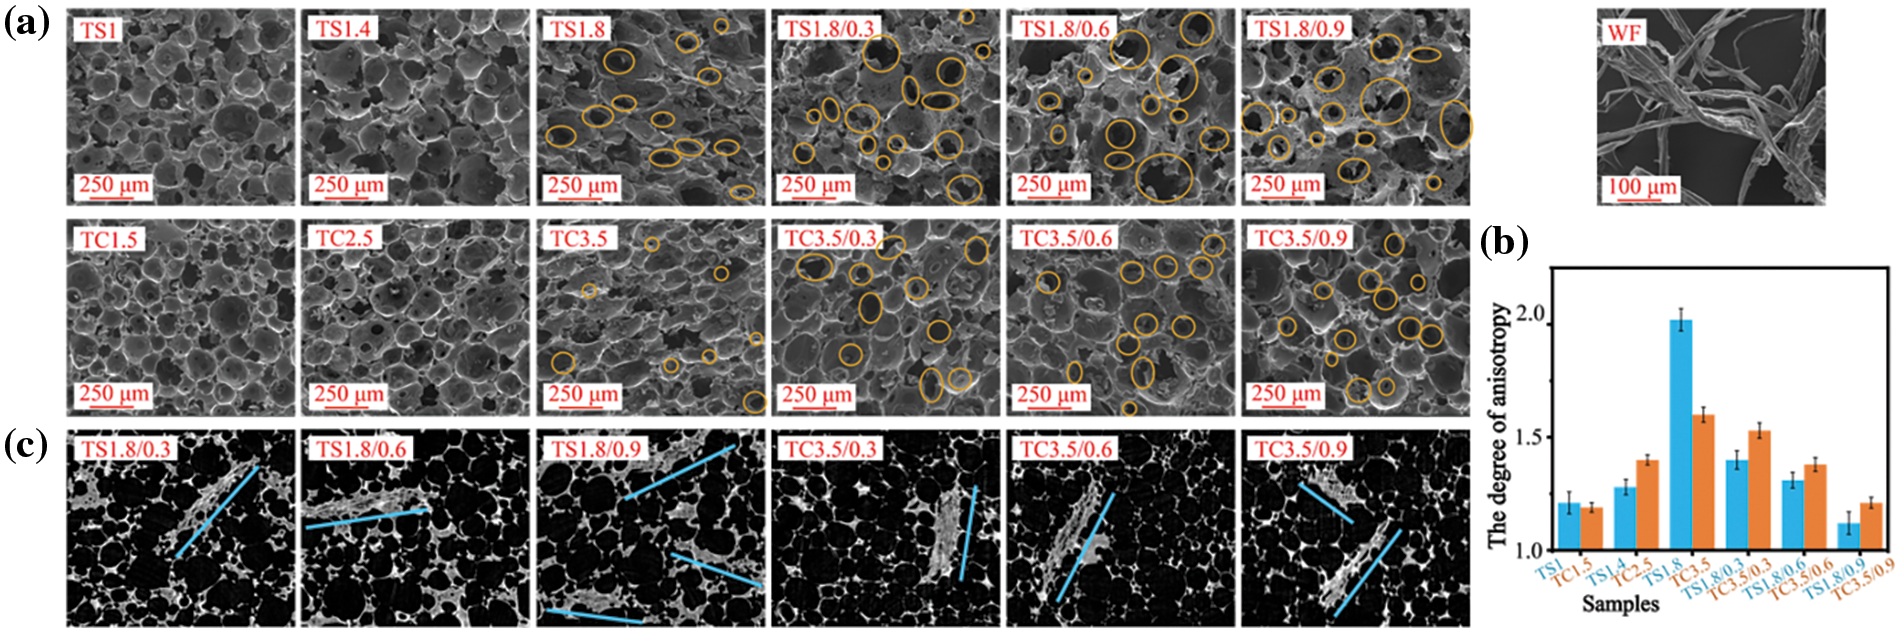
Figure 4: (a) SEM images of TS and TC series of foams and composite foams with WF. (b) Anisotropy histograms of the TS and TC series of foams and composite foams from a 3D analysis of CT scan. (c) 2D images of CT scans for WF in TS and TC series of composite foams
Fig. 4b clearly shows that the anisotropy of the foams of the TS and TC series becomes more severe due to the addition of more SPI and CA. For TC3.5 and TS1.8 foams, increasing the WF content from 0.3 to 0.9 g, the anisotropy of TS1.8/0.3, TS1.8/0.6 and TS1.8/0.9 composite foams gradually decrease to 1.40, 1.31 and 1.12, respectively. Compared with TS1.8, the highest decrease is 44% (TS1.8/0.9). The anisotropy of TC3.5/0.3, TC3.5/0.6 and TC3.5/0.9 composite foams decrease to 1.53, 1.38 and 1.21, respectively, with the largest decrease being 20% (TC3.5/0.9). These results show that WF addition can improve the cell anisotropy, i.e., increasing the WF content leads to lower cell anisotropy. Fig. 4c shows that the wood fibers are well dispersed in the prepolymer because WF and prepolymer have good biocompatibility and the selection of better processing conditions.
3.5 Physical and Mechanical Properties
The apparent densities and pulverization ratios of the foams and composite foams of the TS and TC series are summarized in Table 2. The lowest apparent density was 226 kg/m3 (TS1) in the TS series and 158 kg/m3 (TC3.5/0.3) in the TC series, which is similar to the apparent densities of tannin-based foams reported in the literature [10,27]. The lower apparent density of the TS and TC series foams with increasing SPI and CA content is associated with high prepolymer viscosity (Fig. 2). Higher viscosity is detrimental to achieving a homogeneous mixing of raw materials, as well as cell formation and expansion, leading to higher apparent density which is also common in PF [28]. After WF addition to TS1.8 and TC3.5 foams, the apparent densities of the TS1.8 series and TC3.5 series composite foams first decreased before increasing, but they are still lower than the original apparent densities of TS1.8 and TC3.5. The reason is that FA is prone to self-condensation undergoing exothermic reactions at pH ≤ 2 [29]. The actual curing temperature of the prepolymer is usually higher than the oven-set curing temperature because of the exothermic reaction, but the prepolymer temperature decreases to the oven-set temperature after reaching equilibrium (complete reaction). The higher the difference between the maximum curing temperature and the oven-set curing temperature, the more severe the shrinking of the prepolymer will be [26]. The addition of WF resulted in water absorption and higher viscosity of the prepolymer, both leading to more shrinkage of the prepolymer. However, WF fills in between the cell walls and acts as a support enhancing the rigidity and strength of the foam matrix [30]. The 2D image of the CT scan in Fig. 4c shows that WF is well mixed with the prepolymer. In addition, the reduction in the anisotropy of each of the composite foams in Fig. 4b confirms that WF addition improves the foam microstructure resulting in more homogeneous and stabilized cells. These mechanisms worked together to reduce the volume shrinkage due to the decreasing temperature during the last part of the curing stage, thus reducing the density of composite foams. Higher WF content increases the prepolymer viscosity, leading to an increase in the apparent density of the composite foams. Changes in the shrinkage force due to temperature difference and the reinforcing effect of WF resulted in a decrease and then a gradual increase in the composite foams’ apparent density. The maximum decrease in apparent density was 10% (TS1.8/0.3) and 29% (TC3.5/0.3) for the composite foams of TS1.8 and TC3.5 series, respectively.
It was observed that low-density tannin-furan-formaldehyde foams exhibit substantial mass loss upon light touch or friction, which seriously affects their commercial applications [26]. When more SPI and CA were added, the pulverization ratio of the TS series foams decreased by 25% from 5.46% (TS1) to 4.09% (TS1.8), while the pulverization ratio of the TC series foams decreased by 20% from 6.24% (TC1.5) to 4.95% (TC3.5). This decrease is mainly due to the gradual increase in the apparent density of the foams. For example, the pulverization ratio increases by 15% for TS1.8/0.3 and 3% for TC3.5/0.3. The increase in pulverization ratio compared to TS1.8 and TC3.5 is due to WF addition, which reduced their apparent densities by 10% (234 kg/m3) and 29% (158 kg/m3), respectively. The addition of 0.6 and 0.9 g of WF resulted in a continuous decrease in the pulverization ratio, with a maximum decrease of 20% (TS1.8/0.9) for the TS series and 10% (TC3.5/0.9) for the TC series. The results also show that WF addition decreases the apparent density and the pulverization ratio of the composite foams. The bonding force between WF and the foam matrix makes the material less likely to separate or slide during friction, thus improving the wear resistance. The pulverization ratios reported in Table 2 (3.25%–6.24%) are similar to that of PF (9%–12%) [31,32].
Fig. 5a reports the stress-strain curves of the foams and composite foams of the TS series, while Fig. 5b presents the data for the foams and composite foams of the TC series. The multistage deformations are consistent with the findings for polymer foams [26]. Fig. 5c,d shows the compressive strength vs. density for the TC and TS series of foams and composite foams. With increasing SPI and CA addition, the compressive strength of the foams of the TS series decreases by 50% from 0.91 MPa (TS1) to 0.44 MPa (TS1.8), while the compressive strength of the foams of the TC series decreases by only 11% from 0.7 MPa (TC1.5) to 0.62 MPa (TC3.5). The reason is that the addition of more SPI and CA gradually increases the anisotropy of the foam (Fig. 4) and decreases the structural stability of the foam, leading to lower compressive strength. After adding 0.3 g WF to TS1.8 foam, the compressive strength of TS1.8/0.3 composite foam is 0.62 MPa. After adding 0.6 g WF, the compressive strength of TS1.8/0.6 is 0.59 MPa. After adding 0.9 g WF, the compressive strength of TS1.8/0.9 is 0.51 MPa. The results show that adding WF can increase the compressive strength of the foam, with a maximum increase of 40.9% (TS1.8/0.3). Secondly, adding more WF does not further improve the mechanical properties of the foam.
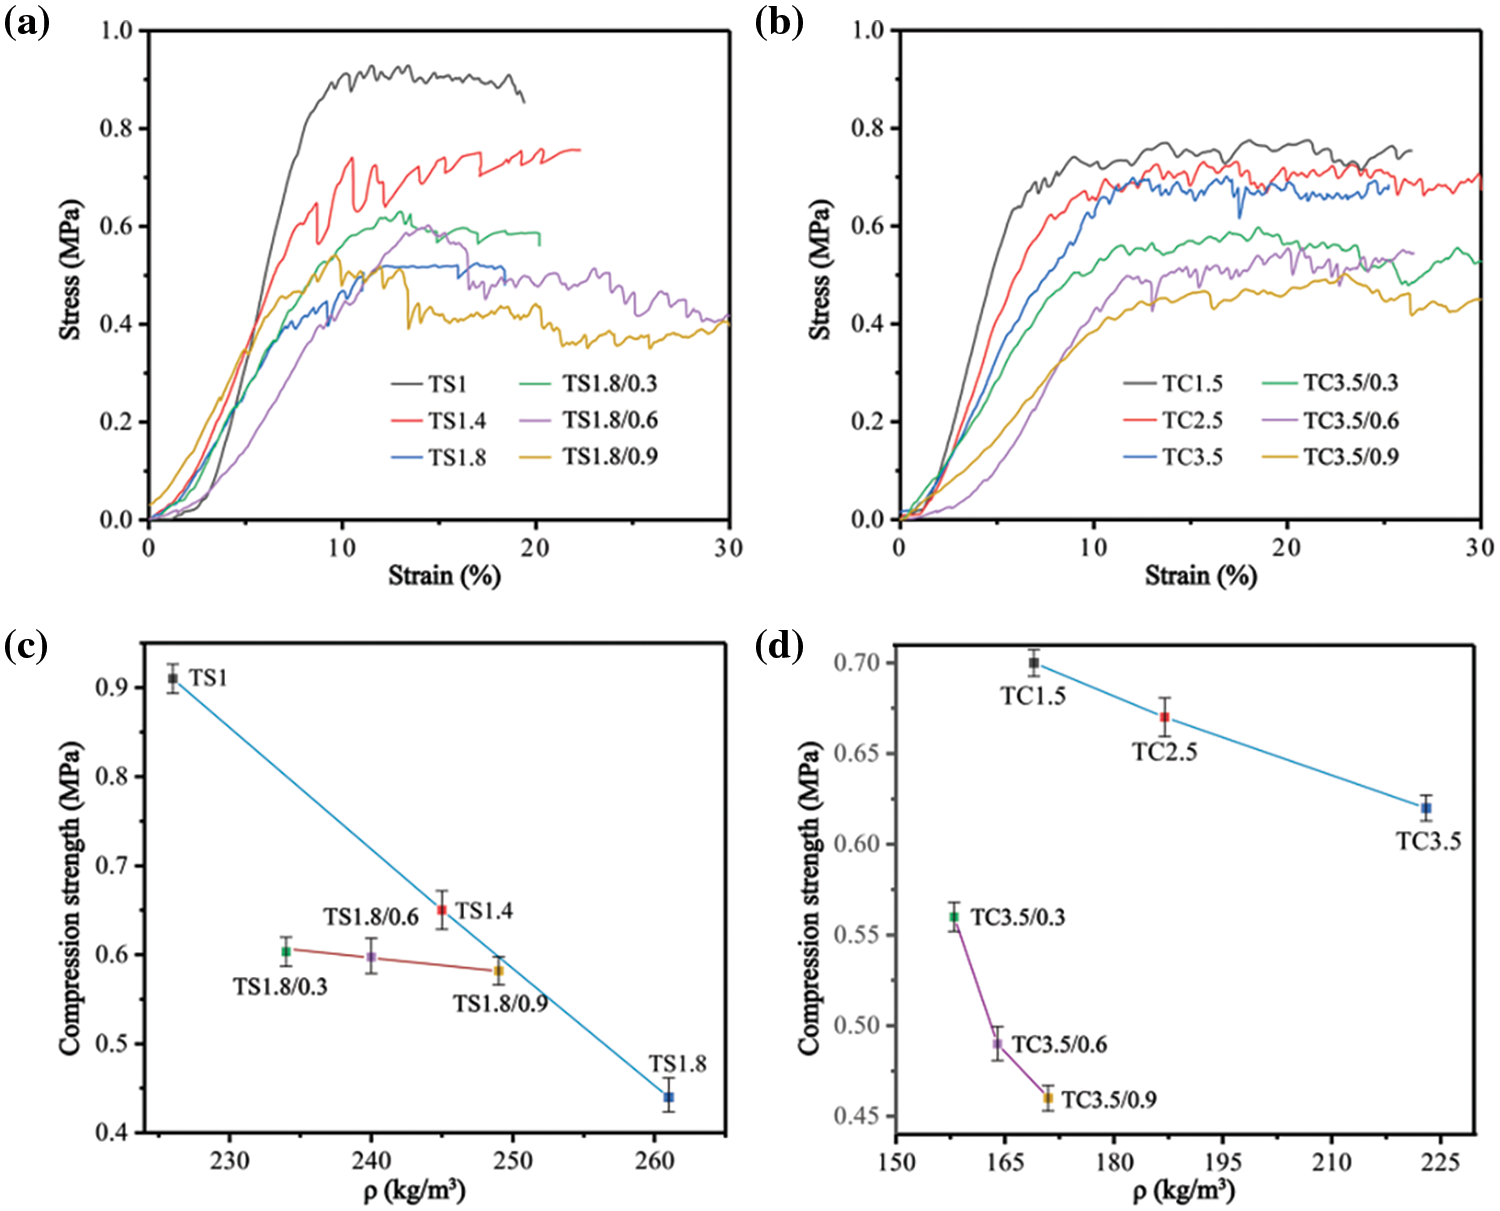
Figure 5: Stress-strain curves of the foams and composite foams for (a) TS series and (b) TC series. Plots of the compressive strength of the foams and composite foams as a function of their density for (c) TS series and (d) TC series
WF shows high resistance to friability under compression conditions as they absorb energy, reduce crack initiation and propagation, delay cell collapse and improve mechanical strength [33]. In other composites, WF is often used as reinforcement to improve the mechanical properties of the matrix. Secondly, hydrogen bonding between WF and the matrix is improved as observed by the redshift in Fig. 3b. The compressive strength of TC3.5/0.3 composite foams decreased to 0.56 MPa after the addition of 0.3 g WF to TC3.5 foam, with a decrease of 20%. After adding 0.3, 0.6 and 0.9 g of WF to TC3.5 foam, the compressive strength of the composite foam was 0.62, 0.59 and 0.51 MPa, respectively. WF gradually decreased the compressive strength of the composite foams, with a maximum decrease of 25% (TC3.5/0.9). The reason is that the addition of WF decreased the apparent density of the foam composite. Secondly, this may be due to the weak interfacial bond between WF and the matrix.
The highest specific compressive strength was 4.03 kPa/kg·m−3 for the TS series foams (TS1) and 4.14 kPa/kg·m−3 for the TC series foams (TS1.5) (Table 2). The maximum increase in specific compressive strength of the TS series composite foams with WF addition was 56% (2.65 kPa/kg·m−3) compared to TS1.8. The maximum increase in specific compressive strength of the TC series composite foams was 27% (3.54 kPa/kg·m−3) with WF addition compared to TC3.5. The results also show that WF addition increases the specific compressive strength of both TS and TC series composite foams. The reason is that WF improves the anisotropy of the cells and increases the structural stability of the foams, while decreasing the apparent density of the composites (Table 2). The specific compressive strengths of our foams and composite foams are like those of PF (1.17–4.11 kPa/kg·m−3) for different PF reported in the literature [34–36].
3.6 Thermal Conductivity, Thermal Stability, and Flame Retardancy
Fig. 6a presents the thermal conductivity of the TS and TC series of foams and composite foams. For porous plastic foams, the thermal conductivity is mainly related to their gas conductivity due to the presence of voids and solid polymers. Thus, the thermal conductivity of the foam depends on the foam density, pore size distribution and the thermal conductivity of the polymer itself [37]. The lowest thermal conductivity achieved is 0.05 W/m·K in the foams of the TS series (TS1) and 0.04 W/m·K for the foams of the TC series (TC1.5). The gradual increase in thermal conductivity for the foams of the TS and TC series is due to increasing apparent density by adding more SPI and CA (Table 2). In general, higher foam density and higher open cell content lead to higher thermal conductivity [19].
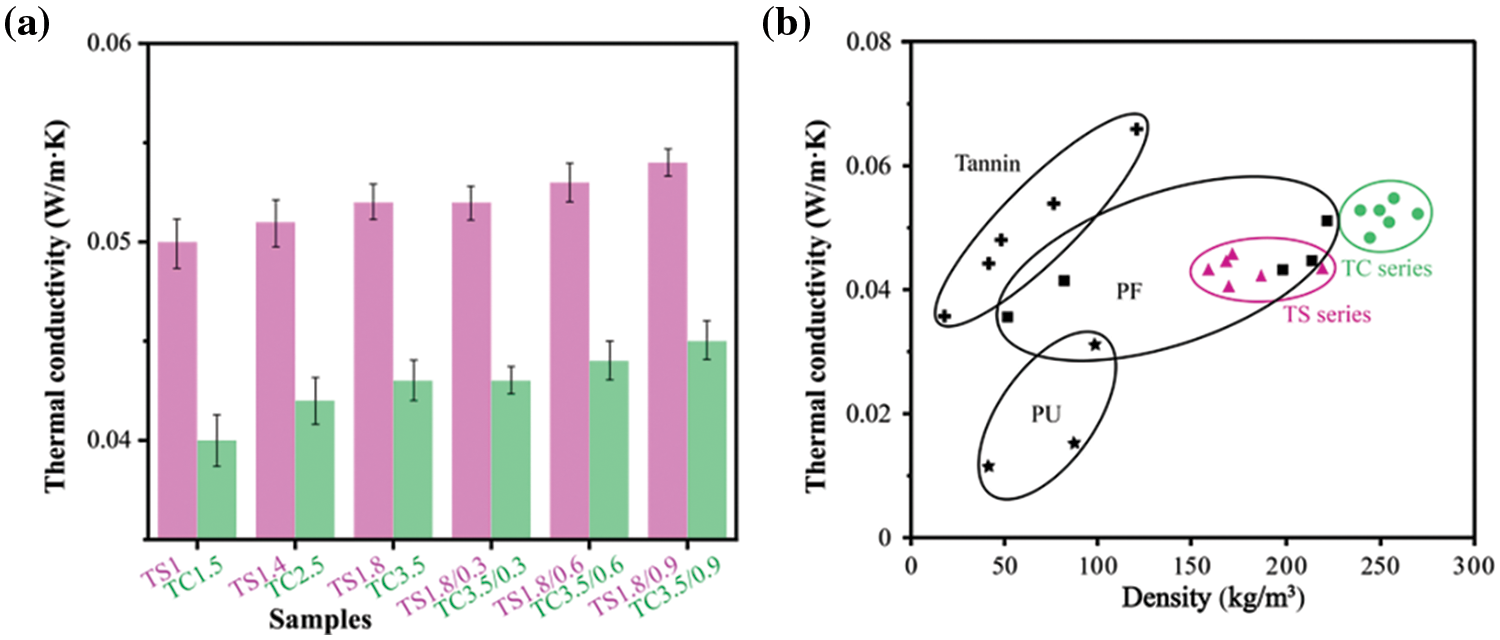
Figure 6: (a) Thermal conductivity of the TS and TC series of foams and composite foams. (b) Thermal conductivity as a function of apparent density for different insulating cellular materials [9,19,38,39] (Adapted with permission from Reference [9], Copyright © 2021. Elsevier B.V.)
The thermal conductivity of the composite foams of the TS and TC series gradually increased with increasing WF addition, with a maximum increase of 3% (TS1.8/0.9) and 4% (TC3.5/0.9), respectively. The reason for this is that WF addition increases cell opening (yellow circles in Fig. 4), increasing the rate of heat transfer between the cells. However, the addition of WF decreased the apparent density of the composite foams. So both effects are counterbalanced and the thermal conductivity changes are not significant.
Fig. 6b presents the relationship between thermal conductivity and apparent density of the TS and TC series of foams and composite foams, as well as a comparison with conventional commercially available foams. The apparent densities and thermal conductivities of conventional PF foams range from approximately 50–220 kg/m3 and 0.03–0.058 W/m·K. The apparent densities and thermal conductivities of TS series foams and composite foams range from 158–223 kg/m3 and 0.05–0.053 W/m·K, respectively. The TS series of foams and composite foams have areas of overlap with the thermal conductivity of conventional PF, indicating that they have the potential to replace conventional PF. The apparent densities and thermal conductivities of the TC series foams, and composite foams range from 226–249 kg/m3 and 0.042–0.045 W/m·K, respectively. The TS series of foams and composite foams do not have areas of overlap in their thermal conductivity, which means that they can be used to expand the application market of traditional PF. The TS and TC series of foams and composite foams exhibit thermal conductivity comparable to that of conventional PF of similar density, suggesting that they have potential applications in the construction and building industry. Compared to the densities and thermal conductivities of PU and developed tannin foams, the regions do not overlap and are far apart, again demonstrating their potential for application.
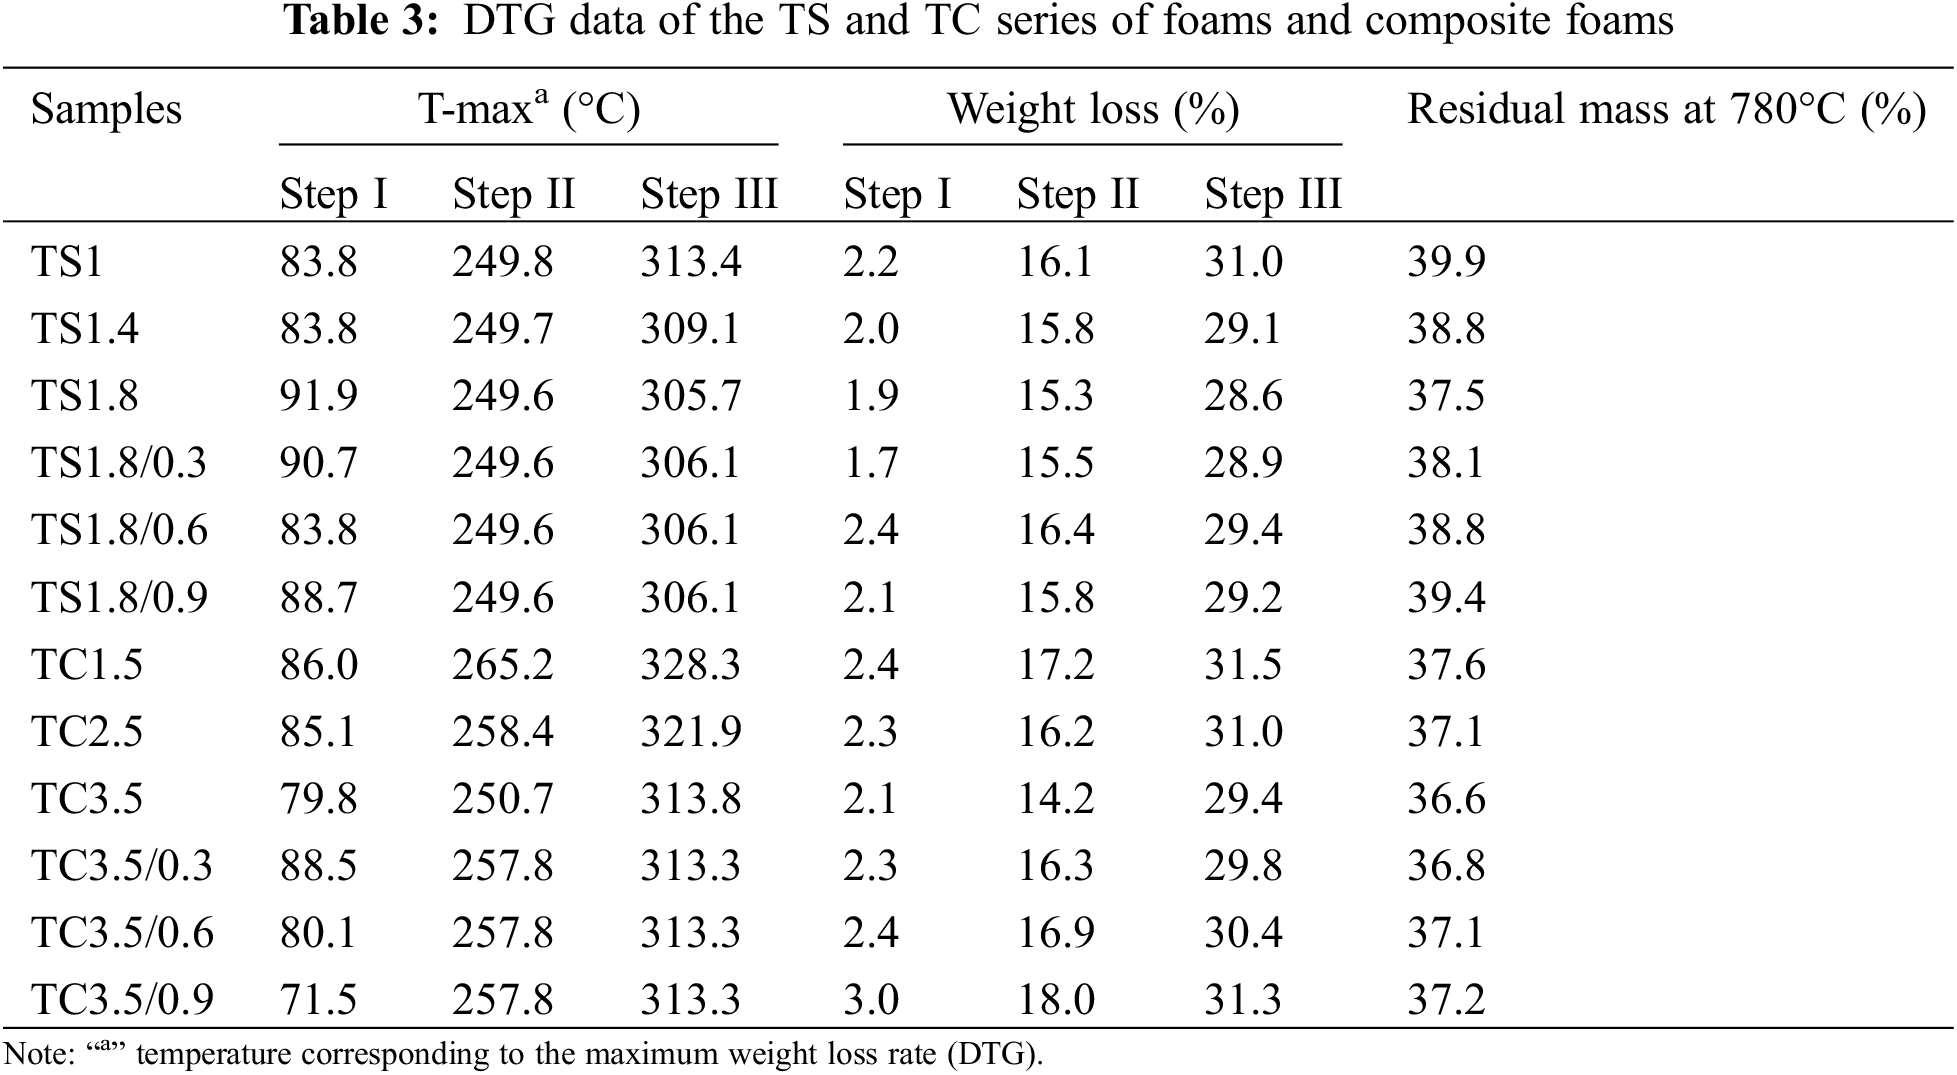
Fig. 7 shows the TGA a and DTG b curves for the TS and TC series of foams and composite foams. The first weight loss step occurs between 25°C and 150°C due to residual moisture evaporation (mass loss of 1.7%–3%, Table 3). The second major weight loss step occurs between 150°C and 280°C due to polymer chain decomposition to form small molecules and surfactant decomposition (mass loss is 14.2%–18%, Table 3). For example, the basic structures of SPI and CA break and decompose around 250°C. The aromatic backbones of TA and WF have better thermal stability and thermal decomposition occurs above 310°C [19]. The final weight loss step (mass loss is 28.6%–31.5%, Table 3) effectively occurs above 310°C due to the pyrolysis of residual compounds. When the temperature is increased to 780°C, the materials completely decompose to produce thermally stable carbon residues (36.6%–39.9%, Table 3). These carbon-based molecules (residual compounds) form and cover the surface of the polymer, thus insulating it from the air and improving the thermal stability of the materials. The peak thermal decomposition temperatures of the second and third stages of the TS and TC series of foams increased with decreasing SPI and CA addition because their reduction seemed to better crosslink the polymers with each other, improving the thermal stability of the materials.
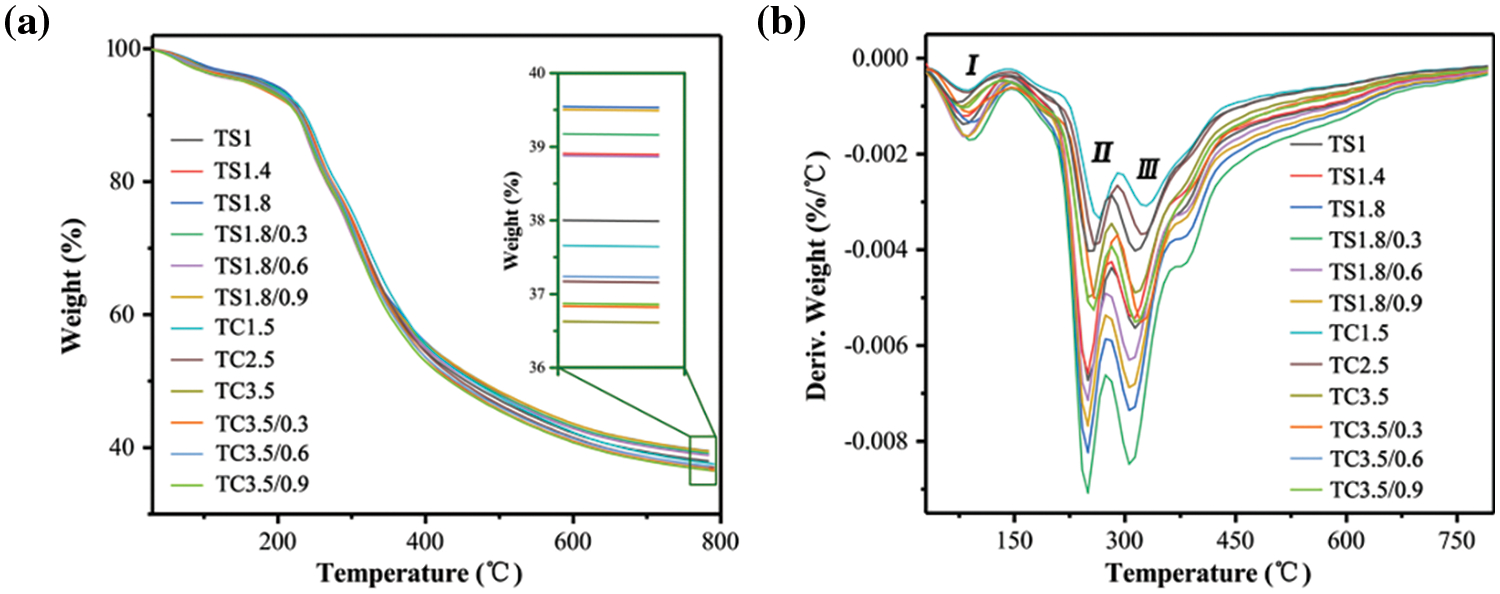
Figure 7: (a) TGA and (b) DTG curves for the TS and TC series of foams and composite foams
After the addition of 0.3 g WF in TC3.5, the peak thermal degradation temperature of TC3.5/0.3 composite foams increased by about 7°C in the second stage. This may be attributed to the interaction between WF and the matrix, which improves the integrity of the pore structure at this temperature and hinders the heat exchange rate, thereby increasing the thermal degradation temperature of this stage [26]. The addition of WF in TS1.8 increased the peak thermal degradation temperature in the third stage, which may be due to more stable bonding between the hydroxyl groups on the WF surface and the polymer. The hydrogen bonding effect occurring in the TS1.8 composite foams in Fig. 3b confirms this explanation. The decrease in the peak temperature of thermal degradation in the third stage of TC3.5 after WF addition may be due to poor bonding between the hydroxyl groups on the WF surface and the polymer. Using raw materials with high carbon content and cyclic structure facilitates the formation of thermally stabilized carbon, which can improve the material’s thermal stability and flame retardancy [40]. Therefore, the addition of WF with higher carbon content led to an increase in the final mass residue (Table 3) and a decrease in the anisotropy of each of the composite foams improving the stability of the structure (Fig. 3c), which contributes to improved thermal stability of the foams.
Fig. 8 shows the heat release rate (HRR) of selected TS series and TC series of foams and composite foams. The variation of the HRR curve indicates that the foam’s burning ability gradually decreases after ignition, which implies that the char layer generated plays a protective role in the burning process. Table 4 reports the peak heat release rate (pHRR) of selected TS and TC series of foams and composite foams. This peak (pHRR) is attributed to the oxidation reaction of volatile pyrolytic substances at high temperatures, and lower pHRR values usually imply that the material releases less heat during burning and has better flame retardancy properties [41]. The lowest pHRR for the TS and TC series is 29.5 kW/m2 (TS1.8) and 32.9 kW/m2 (TC3.5), respectively. With increasing SPI and CA addition, the pHRR of TS1.8 and TC3.5 decreased by 4% and 5%, respectively, indicating that the addition of more SPI and CA can improve the flame retardancy of the foams. The reason is that SPI and CA decompose at high temperatures to produce inert gases, such as ammonia (NH3) and nitrogen (N2), acting as dilution and cooling agents during the combustion process, slowing down the burning rate.
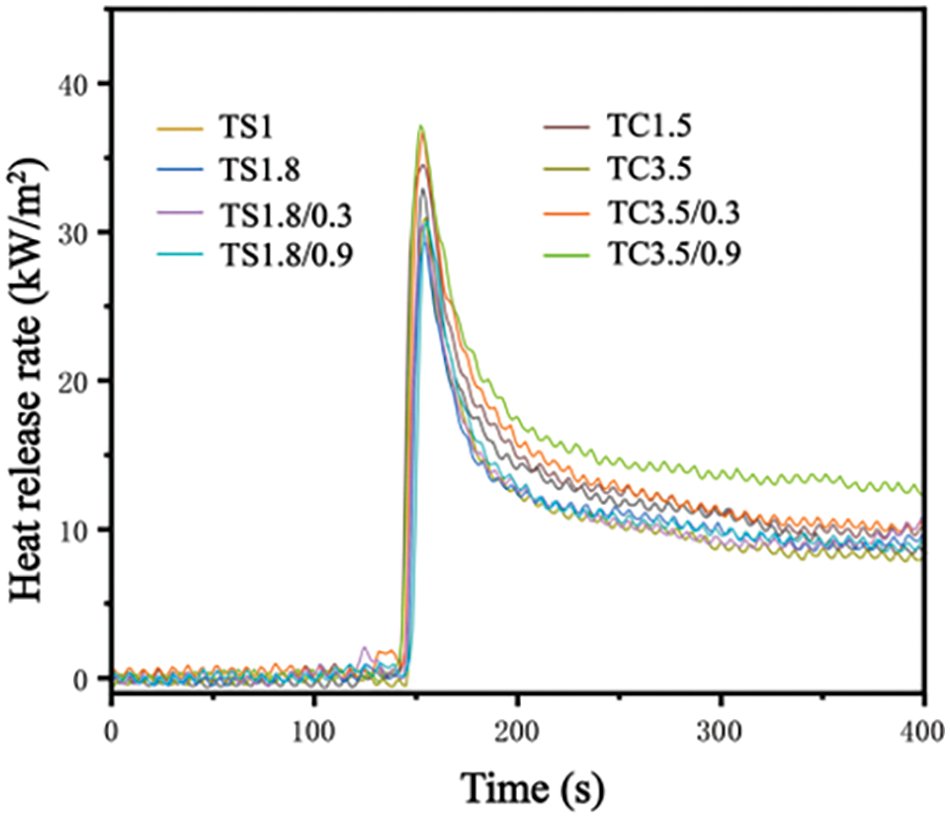
Figure 8: Heat release rate of selected TS and TC series of foams and composite foams
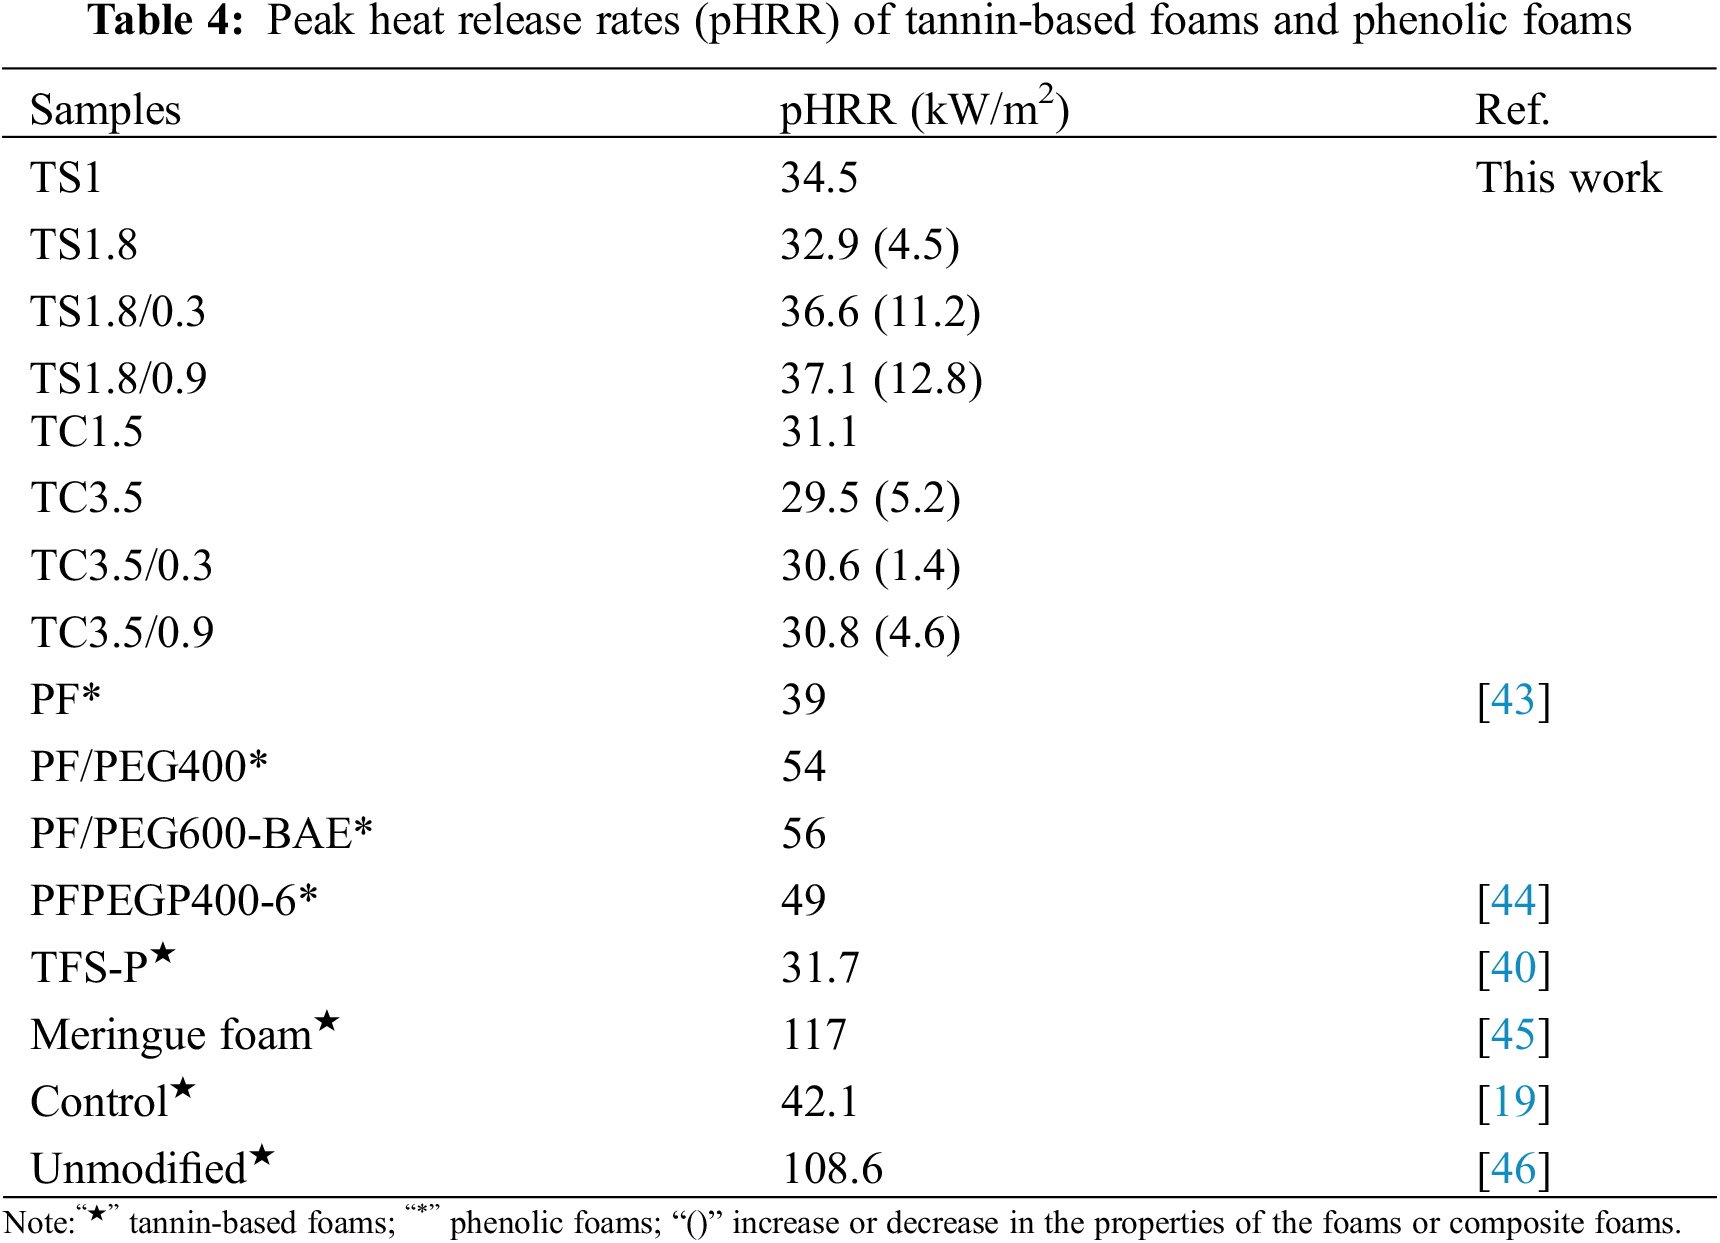
The maximum increase in pHRR of the composite foams was 12% and 4% when 0.3 and 0.9 g WF were added, respectively. This indicates that WF addition decreases the flame retardancy properties of the composite foams because WF decreases their apparent density (Table 2). For the same type of foam, lower density usually results in lower mechanical strength and easier cell break-up/collapse, making it easier for the flames and heat to spread, thus decreasing the flame retardancy [42]. Table 4 shows the pHRR of some tannin-based foams and conventional PF. The pHRR of standard PF foams is 39 kW/m2 and increases to a maximum of 56 kW/m2 with the addition of some materials. All the pHRR of TS and TC series foams and composite foams (29.5–36.6 kW/m2) are lower than the pHRR of standard PF. The developed tannin-based foams had a wide range of pHRR (31.7–117 kW/m2), with the lowest pHRR comparable to that of TS and TC series foams and composite foams. This indicates that the TS and TC series foams and composite foams have excellent flame retardancy and are expected to replace conventional PF in the construction, furniture, and transportation sectors.
Fig. 9a shows digital images of the vertical burning tests for the TS series and TC series of foams and composite foams. All the foams did not burn intensely during continuous exposure to a butane torch. The butane torch was extinguished after continuous burning for 10 s, but the foams and composite foams of the TS and TC series self-extinguished immediately after 2 s, and the foams shrank to varying degrees, but no burning residue fell off. These samples achieved an HBF rating according to UL 94, showing excellent flame retardancy for applications having high safety requirements [47]. These results further confirm the excellent flame retardancy of the TS and TC series of foams and composite foams.
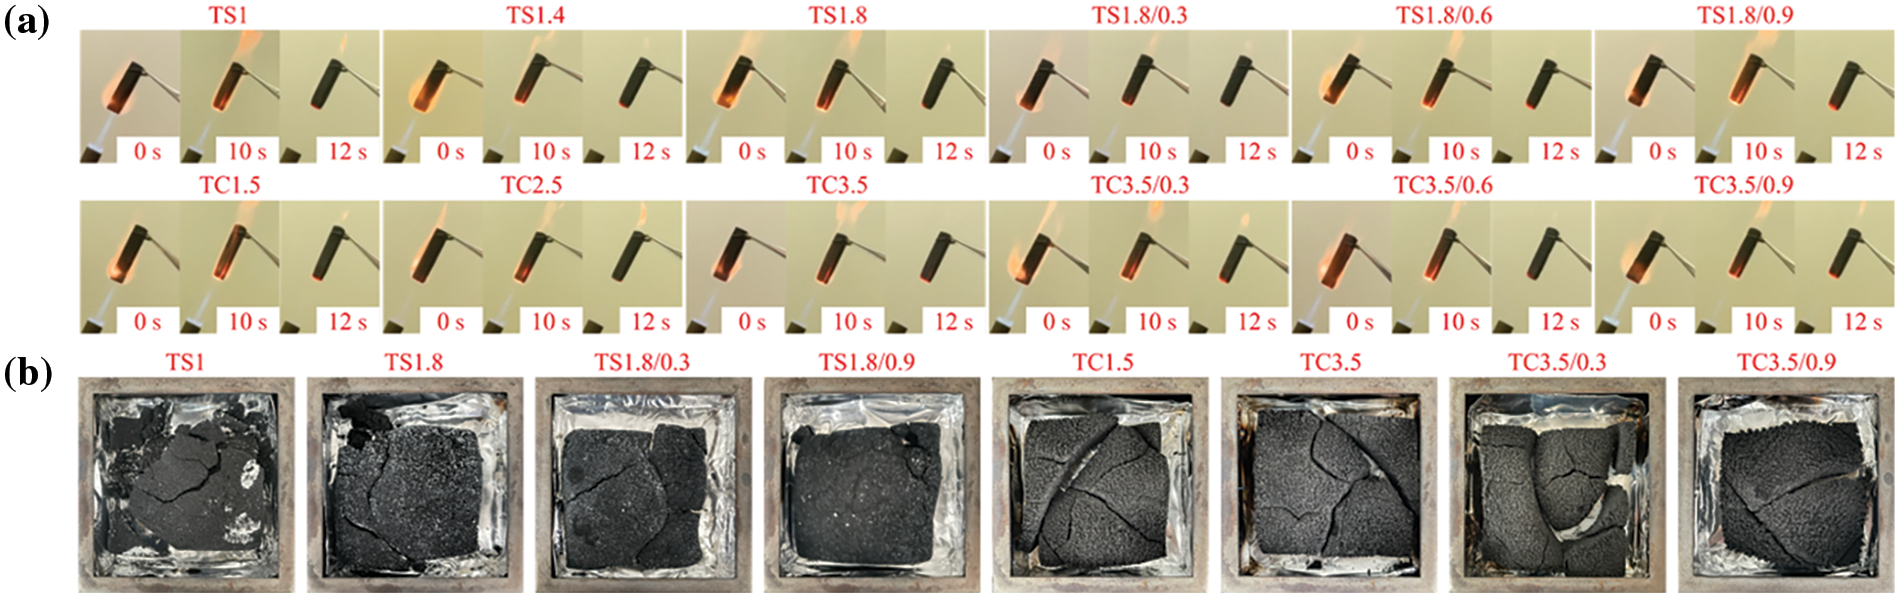
Figure 9: (a) Digital image of the horizontal combustion tests for the TS and TC series of foams and composite foams. (b) Digital images of the residues after cone calorimeter testing of selected TS and TC series of foams and composite foams
Fig. 9b shows digital images of residues after cone calorimetric testing for selected TS and TC series of foams and composite foams. The residues were obtained after 800 s of continuous burning at 800°C. After burning, the residues appeared to break up, but remained essentially lumpy, a characteristic that is of high importance for materials under fire [40].
In this study, two series of formaldehyde-free phenolic foams (PF) were prepared from biomass materials using tannic acid (TA), furfuryl alcohol (FA), soybean isolate protein (SPI) and casein (CA). The foams were also reinforced with poplar wood fiber (WF). These formulations avoided the use of formaldehyde and reduced the amount of petroleum-based raw materials. They also avoided the use of volatile foaming agents by using mechanical stirring for foaming and surfactants for cell stabilization.
First, the foams and composite foams of the TS and TC series exhibited excellent mechanical properties (maximum compressive strengths of 0.91 and 0.70 MPa, respectively), very low pulverization ratios (lowest values of 3.25% and 4.43%, respectively), good thermal stability via TGA (313°C and 328°C, respectively), excellent flame retardancy via pHRR (32.9 and 29.5 kW/m2, respectively), and low thermal conductivity (0.05 and 0.04 W/m·K, respectively).
Secondly, the addition of WF reduced the apparent density (maximum decreases of 10% and 29%, respectively), decreased the cell anisotropy (maximum decreases of 44% and 20%, respectively), improved the specific compressive strength (maximum increases of 56% and 27%, respectively), and reduced the pulverization ratio (maximum decreases of 42% and 10%, respectively) of the composite foams based on the TS and TC series, respectively.
Finally, the foams and composite foams produced have a high biomass content (95%−96%), are environmentally friendly, have high compressive strength, excellent flame retardancy and good thermal insulation properties. Their peak heat release rate, thermal conductivity, compression strength and pulverization ratio are comparable to those of traditional phenolic foams (PF) and are expected to be potential alternatives to replace them in construction, packaging, and industrial applications.
Based on our experience with phenolic foams, in future research, we recommend replacing FA with alcohol that has a low rate of self-condensation under strong acid conditions, because the addition of FA is generally an exothermic reaction, and the oven curing temperature is generally higher than the actual curing temperature, which tends to result in higher temperatures on the inside of the foam than on the outside, and a non-uniform foams structure, and also reduces the degree of foam shrinkage. Secondly, we recommend trying to use biomass phenols with different functional groups as crosslinking agents. Different crosslinking agents with different reactivity and different degrees of crosslinking with TA can develop new foam materials with different properties.
Acknowledgement: This study was supported by the Center for Renewable Research, Laval University, Canada.
Funding Statement: This study was funded by the Natural Sciences and Engineering Research Council of Canada (NSERC) for financial support, Grant Nos. CG125664 and GF136078.
Author Contributions: Conceptualization, Methodology, Investigation, Formal Analysis, Data Curation, Writing—Original Draft, Jinxing Li; Experiments, Data processing, Mustafa Zor; Conceptualization, Writing—Review & Editing, Methodology, Xiaojian Zhou; Methodology, Writing—Review & Editing, Guanben Du; Conceptualization, Methodology, Writing—Review & Editing, Supervision, Denis Rodrigue; Conceptualization, Methodology, Resources, Writing—Review & Editing, Supervision, Project administration, Funding acquisition, Xiaodong (Alice) Wang. All authors reviewed the results and approved the final version of the manuscript.
Availability of Data and Materials: Data available on request from the authors.
Ethics Approval: Not applicable.
Conflicts of Interest: The authors declare no conflicts of interest to report regarding the present study.
References
1. Geng F, Wu H, Wang B, Yuan Y, Zhang K, Xu X, et al. Characterization and analysis of toughened bio-oil-based phenolic foam prepared from poplar. J Appl Polym Sci. 2023;140(9):e53564. doi:10.1002/app.v140.9. [Google Scholar] [CrossRef]
2. Wang X, Yang G, Guo H. Tannic acid as biobased flame retardants: a review. J Anal Appl Pyrolysis. 2023;171:106111. [Google Scholar]
3. Ghasemian M, Kazeminava F, Naseri A, Mohebzadeh S, Abbaszadeh M, Kafil HS, et al. Recent progress in tannic acid based approaches as a natural polyphenolic biomaterial for cancer therapy: a review. Biomed Pharmacother. 2023;166:115328. doi:10.1016/j.biopha.2023.115328. [Google Scholar] [PubMed] [CrossRef]
4. Vera M, Urbano BF. Tannin polymerization: an overview. Polym Chem. 2021;12(30):4272–90. doi:10.1039/D1PY00542A. [Google Scholar] [CrossRef]
5. Chen X, Guigo N, Pizzi A, Sbirrazzuoli N, Li B, Fredon E, et al. Ambient temperature self-blowing tannin-humins biofoams. Polymers. 2020;12(11):2732. doi:10.3390/polym12112732. [Google Scholar] [PubMed] [CrossRef]
6. Pizzi A. Tannin-based biofoams-a review. J Renew Mater. 2019;7(5):477–92. doi:10.32604/jrm.2019.06511. [Google Scholar] [CrossRef]
7. Sepperer T, Sket P, Petutschnigg A, Husing N. Tannin-furanic foams formed by mechanical agitation: influence of surfactant and ingredient ratios. Polymers. 2021;13(18):3058. doi:10.3390/polym13183058. [Google Scholar] [PubMed] [CrossRef]
8. Basso MC, Giovando S, Pizzi A, Pasch H, Pretorius N, Delmotte L, et al. Flexible-elastic copolymerized polyurethane-tannin foams. J Appl Polym Sci. 2014;131(13):40499. doi:10.1002/app.v131.13. [Google Scholar] [CrossRef]
9. Li J, Liao J, Essawy H, Zhang J, Li T, Wu Z, et al. Preparation and characterization of novel cellular/nonporous foam structures derived from tannin furanic resin. Ind Crops Prod. 2021;162:113264. doi:10.1016/j.indcrop.2021.113264. [Google Scholar] [CrossRef]
10. Wu X, Yan W, Zhou Y, Luo L, Yu X, Luo L, et al. Thermal, morphological, and mechanical characteristics of sustainable tannin bio-based foams reinforced with wood cellulosic fibers. Ind Crops Prod. 2020;158:113029. doi:10.1016/j.indcrop.2020.113029. [Google Scholar] [CrossRef]
11. Wang YY, Wang Y, Zhu W, Lan D, Song YM. Flexible poly (butylene adipate-co-butylene terephthalate) enabled high-performance polylactide/wood fiber biocomposite foam. Ind Crops Prod. 2023;204:117381. doi:10.1016/j.indcrop.2023.117381. [Google Scholar] [CrossRef]
12. Zhan J, Li J, Wang G, Guan Y, Zhao G, Lin J, et al. Review on the performances, foaming and injection molding simulation of natural fiber composites. Polym Compos. 2021;42(3):1305–24. doi:10.1002/pc.v42.3. [Google Scholar] [CrossRef]
13. Xu Y, Han Y, Chen M, Li J, Li J, Luo J, et al. A soy protein-based film by mixed covalent crosslinking and flexibilizing networks. Ind Crops Prod. 2022;183:114952. doi:10.1016/j.indcrop.2022.114952. [Google Scholar] [CrossRef]
14. Zheng L, Regenstein JM, Zhou L, Wang Z. Soy protein isolates: a review of their composition, aggregation, and gelation. Compr Rev Food Sci Food Saf. 2022;21(2):1940–57. doi:10.1111/crf3.v21.2. [Google Scholar] [CrossRef]
15. Gautam S, Sharma B, Jain P. Green Natural Protein Isolate based composites and nanocomposites: a review. Polym Test. 2021;99:106626. doi:10.1016/j.polymertesting.2020.106626. [Google Scholar] [CrossRef]
16. Hammam AR, Martínez-Monteagudo SI, Metzger LE. Progress in micellar casein concentrate: production and applications. Compr Rev Food Sci Food Saf. 2021;20(5):4426–49. doi:10.1111/crf3.v20.5. [Google Scholar] [CrossRef]
17. Li JJ, Zhang AB, Zhang SF, Gao Q, Zhang W, Li JZ. Larch tannin-based rigid phenolic foam with high compressive strength, low friability, and low thermal conductivity reinforced by cork powder. Compos B Eng. 2019;156:368–77. doi:10.1016/j.compositesb.2018.09.005. [Google Scholar] [CrossRef]
18. Satdive A, Mestry S, Borse P, Mhaske S. Phosphorus- and silicon-containing amino curing agent for epoxy resin. Iran Polym J. 2020;29(5):433–43. doi:10.1007/s13726-020-00808-6. [Google Scholar] [CrossRef]
19. Chen XY, Li JX, Pizzi A, Fredon E, Gerardin C, Zhou XJ, et al. Tannin-furanic foams modified by soybean protein isolate (SPI) and industrial lignin substituting formaldehyde addition. Ind Crops Prod. 2021;168:113607. doi:10.1016/j.indcrop.2021.113607. [Google Scholar] [CrossRef]
20. Szczurek A, Fierro V, Pizzi A, Stauber MCelzard A. A new method for preparing tannin-based foams. Ind Crops Prod. 2014;54:40–53. doi:10.1016/j.indcrop.2014.01.012. [Google Scholar] [CrossRef]
21. Dhawale P, Vineeth S, Gadhave R. Tannin as a renewable raw material for adhesive applications: a review. Mater Adv. 2022;3:3365–88. doi:10.1039/D1MA00841B. [Google Scholar] [CrossRef]
22. Pang Z, Tong F, Jiang S, Chen C, Liu X. Particle characteristics and tribo-rheological properties of soy protein isolate (SPI) dispersions: effect of heating and incorporation of flaxseed gum. Int J Biol Macromol. 2023;232:123455. doi:10.1016/j.ijbiomac.2023.123455. [Google Scholar] [PubMed] [CrossRef]
23. Chen X, Xi X, Pizzi A, Fredon E, Zhou X, Li J, et al. Preparation and characterization of condensed tannin non-isocyanate polyurethane (NIPU) rigid foams by ambient temperature blowing. Polymers. 2020;12(4):750. doi:10.3390/polym12040750. [Google Scholar] [PubMed] [CrossRef]
24. Ghahri S, Mohebby B, Pizzi A, Mirshokraie A, Mansouri HR. Improving water resistance of soy-based adhesive by vegetable tannin. J Polym Environ. 2018;26(5):1881–90. doi:10.1007/s10924-017-1090-6. [Google Scholar] [CrossRef]
25. Furtos G, Molnar L, Silaghi-Dumitrescu L, Pascuta P, Korniejenko K. Mechanical and thermal properties of wood fiber reinforced geopolymer composites. J Nat Fibers. 2022;19(13):6676–91. doi:10.1080/15440478.2021.1929655. [Google Scholar] [CrossRef]
26. Li JX, Liao JJ, Zhang J, Zhou XJ, Essawy H, Du GB. Effect of post-added water amount on pre-concentrated bark foaming materials by mechanical stirring. J Renew Mater. 2020;8(12):1607–16. doi:10.32604/jrm.2020.013976. [Google Scholar] [CrossRef]
27. Eckardt J, Sepperer T, Cesprini E, Šket P, Tondi G. Comparing condensed and hydrolysable tannins for mechanical foaming of furanic foams: synthesis and characterization. Molecules. 2023;28(6):2799. doi:10.3390/molecules28062799. [Google Scholar] [PubMed] [CrossRef]
28. Jing SL, Li T, Li XJ, Xu Q, Hu J, Li RH. Phenolic foams modified by cardanol through bisphenol modification. J Appl Polym Sci. 2014;131(4):39942. doi:10.1002/app.v131.4. [Google Scholar] [CrossRef]
29. Basso MC, Giovando S, Pizzi A, Celzard A, Fierro V. Tannin/furanic foams without blowing agents and formaldehyde. Ind Crops Prod. 2013;49:17–22. doi:10.1016/j.indcrop.2013.04.043. [Google Scholar] [CrossRef]
30. Del SB, Alonso MV, Oliet M, Domínguez JC, Rodriguez F. Effects of formulation variables on density, compressive mechanical properties and morphology of wood flour-reinforced phenolic foams. Compos B Eng. 2014;56:546–52. doi:10.1016/j.compositesb.2013.08.078. [Google Scholar] [CrossRef]
31. Liu J, Wang L, Zhang W, Han Y. Phenolic resin foam composites reinforced by acetylated poplar fiber with high mechanical properties, low pulverization ratio, and good thermal insulation and flame retardant performance. Materials. 2020;13:148. [Google Scholar]
32. Mougel C, Garnier T, Sintes-Zydowicz N, Cassagnau P. Density effect on morphological, mechanical and friability properties of phenolic foams. J Mater Sci Eng Adv Technol. 2019;19(2):43–78. [Google Scholar]
33. Billings C, Siddique R, Sherwood B, Hall J, Liu Y. Additive manufacturing and characterization of sustainable wood fiber-reinforced green composites. J Compos Sci. 2023;7(12):489. doi:10.3390/jcs7120489. [Google Scholar] [CrossRef]
34. Desai A. Fiber reinforced hybrid phenolic foam. USA: University of Southern California; 2008. [Google Scholar]
35. Riahi F, Doufnoune R, Bouremel C. Subtitution of pentane by a mineral clay as a blowing agent for phenolic foam. Int J Polym Mater. 2007;56(9):929–38. doi:10.1080/00914030601139076. [Google Scholar] [CrossRef]
36. Song SA, Chung YS, Kim SS. The mechanical and thermal characteristics of phenolic foams reinforced with carbon nanoparticles. Compos Sci Technol. 2014;103:85–93. doi:10.1016/j.compscitech.2014.08.013. [Google Scholar] [CrossRef]
37. Song SA, Oh HJ, Kim BG, Kim SS. Novel foaming methods to fabricate activated carbon reinforced microcellular phenolic foams. Compos Sci Technol. 2013;76:45–51. doi:10.1016/j.compscitech.2012.12.018. [Google Scholar] [CrossRef]
38. de Carvalho G, Pimenta JA, dos Santos WN, Frollini E. Phenolic and lignophenolic closed cells foams: thermal conductivity and other properties. Polym Plast Technol Eng. 2003;42(4):605–26. doi:10.1081/PPT-120023098. [Google Scholar] [CrossRef]
39. Sayadi AA, Tapia JV, Neitzert TR, Clifton GC. Effects of expanded polystyrene (EPS) particles on fire resistance, thermal conductivity and compressive strength of foamed concrete. Constr Build Mater. 2016;112:716–24. doi:10.1016/j.conbuildmat.2016.02.218. [Google Scholar] [CrossRef]
40. Chen X, Li J, Essawy H, Pizzi A, Fredon E, Gerardin C, et al. Flame-retardant and thermally-insulating tannin and soybean protein isolate (SPI) based foams for potential applications in building materials. Constr Build Mater. 2022;315:125711. doi:10.1016/j.conbuildmat.2021.125711. [Google Scholar] [CrossRef]
41. Lukács N, Ronkay F, Molnár B, Marosfői B, Bocz K. Characterisation of flame retarded recycled PET foams produced by batch foaming. Polym Test. 2023;124:108104. doi:10.1016/j.polymertesting.2023.108104. [Google Scholar] [CrossRef]
42. Bian XC, Tang JH, Li ZM, Lu ZY, Lu A. Dependence of flame-retardant properties on density of expandable graphite filled rigid polyurethane foam. J Appl Polym Sci. 2007;104(5):3347–55. doi:10.1002/app.25933. [Google Scholar] [CrossRef]
43. Liu L, Fu MT, Wang ZZ. Synthesis of boron-containing toughening agents and their application in phenolic foams. Ind Eng Chem Res. 2015;54(7):1962–70. doi:10.1021/ie504851y. [Google Scholar] [CrossRef]
44. Sui X, Wang Z. Flame-retardant and mechanical properties of phenolic foams toughened with polyethylene glycol phosphates. Polym Adv Technol. 2013;24(6):593–9. doi:10.1002/pat.3121. [Google Scholar] [CrossRef]
45. Delgado-Sánchez C, Sarazin J, Santiago-Medina F, Fierro V, Pizzi A, Bourbigot S, et al. Impact of the formulation of biosourced phenolic foams on their fire properties. Polym Degrad Stab. 2018;153:1–14. doi:10.1016/j.polymdegradstab.2018.04.006. [Google Scholar] [CrossRef]
46. Marques JF, Baldissera AF, Silveira MR, Dornelles AC, Ferreira CA. Performance of phosphorylated tannin-based intumescent coatings in passive fire protection. J Coat Technol Res. 2021;18(3):899–910. doi:10.1007/s11998-020-00440-2. [Google Scholar] [CrossRef]
47. Chan YY, Ma C, Zhou F, Hu Y, Schartel B. A liquid phosphorous flame retardant combined with expandable graphite or melamine in flexible polyurethane foam. Polym Adv Technol. 2022;33(1):326–39. doi:10.1002/pat.5519. [Google Scholar] [CrossRef]
Cite This Article
 Copyright © 2025 The Author(s). Published by Tech Science Press.
This work is licensed under a Creative Commons Attribution 4.0 International License , which permits unrestricted use, distribution, and reproduction in any medium, provided the original work is properly cited.
 Downloads
 Citation Tools