
 Submit a Paper
 Propose a Special lssue
 Open Access
ARTICLE

Removal of Dye Using Lignin-Based Biochar/Poly(ester amide urethane) Nanocomposites from Contaminated Wastewater
1 Advanced Polymer and Nanomaterial Laboratory (APNL), Department of Chemical Sciences, Tezpur University, Napaam, Tezpur, 784028, India
2 Research and Development, Rymbal, RTC, Sahibabad Industrial Area Site 4, Sahibabad, Ghaziabad, 201010, India
* Corresponding Author: Niranjan Karak. Email:
Journal of Renewable Materials 2024, 12(9), 1507-1540. https://doi.org/10.32604/jrm.2024.052220
Received 27 March 2024; Accepted 17 July 2024; Issue published 25 September 2024
 View Full Text
 Download PDF
Abstract
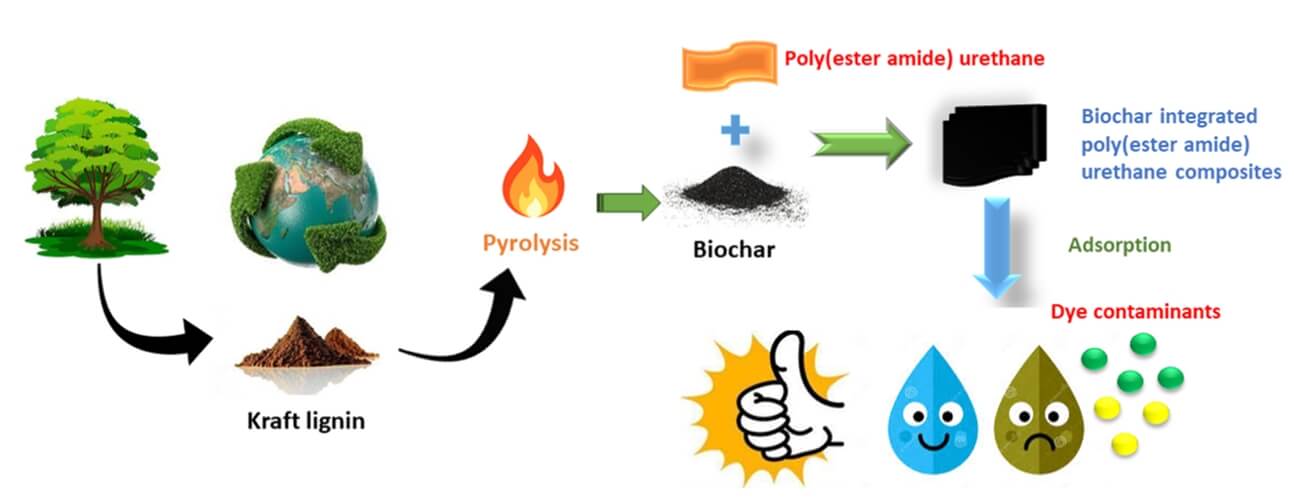
The pursuit of incorporating eco-friendly reinforcing agents in polymer composites has accentuated the exploration of various natural biomass-derived materials. The burgeoning environmental crisis spurred by the discharge of synthetic dyes into wastewater has catalyzed the search for effective and sustainable treatment technologies. Among the various sorbent materials explored, biochar, being renewable, has gained prominence due to its excellent adsorption properties and environmental sustainability. It has also emerged as a focal point for its potential to replace other conventional reinforcing agents, viz., fumed silica, aluminum oxide, treated clays, etc. This study introduces a novel class of polymer nanocomposites comprising of lignin-based biochar particles and poly(ester amide urethane) matrix via a feasible method. The structural evaluation of these nanocomposites was accomplished using Fourier-transform infrared spectroscopy, X-ray photoelectron spectroscopy, and powder X-ray diffraction. The polymer nanocomposites exhibited superior mechanical properties with an increment in tensile strength factor by 45% in comparison to its pristine matrix, along with an excellent toughness value of 90.22 MJm−3 at a low loading amount of only 1 wt%. The composites showed excellent improvement in thermal properties with a sharp rise in the glass transition temperature (Tg) value from −28.15°C to 84°C, while also championing sustainability through inherent biodegradability attributes. Beyond their structural prowess, these polymer nanocomposites demonstrated excellent potential as adsorbents, displaying efficient removal of malachite green and tartrazine dyes from aqueous systems with a removal efficiency of 87.25% and 73.98%, respectively. The kinetics study revealed the pseudo second order model to be the precision tool to assess the dye removal study. Complementing this, the Langmuir adsorption isotherm provided a framework to assess the sorption features of the polymer nanocomposites. Overall, these renewable biochar integrated polymer matrices boast remarkable recovery capabilities up to seven cycles of usage with an excellent dye recovery percentage of 95.21% for the last cycle, thereby defining sustainability as well as economic feasibility.Graphic Abstract
Keywords
Over the past couple of years, the rapid rate of depletion of fossil fuel reserves and alarming environmental safety have become the focal point of concern for researchers across the globe. In this milieu, there has been unprecedented growth in the pursuit of sustainable manufacturing processes [1]. The exploration of various biocomposites, along with the fabrication of new environmentally sustainable materials extracted from various waste and renewable substances have captured a lot of attention among the scientific community worldwide. Under this pretext, biochar proved to be a great alternative to other conventional carbon fillers, such as graphene, carbon nanotubes, etc., owing to its low cost, sustainability, and a range of other desirable features [2,3]. This surge in interest in biochar stems from its potential to address pressing environmental as well as economic challenges. Biochar offers a dual solution to pressing global challenges by both enhancing environmental quality and boosting economic viability. Environmentally, it sequesters carbon, thus mitigating climate change, improves soil health to increase agricultural yields, reduces reliance on chemical fertilizers, and aids in waste management and water purification. Economically, biochar can stimulate agricultural productivity, particularly in degraded soils, generate renewable energy through by-products of its production process, and create jobs in rural and developing regions. Moreover, it turns waste management into a productive venture by transforming agricultural and forestry residues into valuable commodities [3–5].
In recent years, global biochar production is burgeoning, propelled by its roles in carbon sequestration, soil improvement, and waste management, predominantly in North America, Europe, and Asia-Pacific. The market is currently valued at around $1.3 billion and is anticipated to grow at a Compound Annual Growth Rate (CAGR) of about 13% over the next decade. This expansion is driven by growing demands for agricultural soil amendments, carbon capture initiatives, and water filtration technologies. Enhanced by supportive government policies and increased commercial investments in biochar production, the market is poised for further growth. As recognition of its environmental and agricultural advantages broadens, biochar is poised to significantly influence future sustainability efforts, with a market poised to widen in both scale and utility [6,7].
Synthetic pigments as well as dyes act as a formidable source for carrying out environmental degradation, with their continuous pervasive utility expanding across various genres, inclusive of plastics manufacturing, textiles, leather processing, paper production, etc. The effluents discharged by these industrial sectors carry extensive loads of intractable toxic by-products and suspended organic materials, thus posing a substantial threat to our environment. It is further estimated that out of the huge array of commercially available pigments and dyes, more than ten thousand are currently in active deployment, therefore collectively culminating in the production of approximately 0.7 million metric tons of effluents and by-products, emanating from dye production [7]. Malachite green is a well-known synthetic dye, and it boasts extensive utility in the textile, cosmetics, plastic, and paper industries. On the other hand, tartrazine, also known as Yellow 5, finds widespread applications in the textiles as well as in the food and beverage industries. Malachite green garners widespread speculation on the grounds of its various detrimental attributes, viz., acute toxicity, genotoxicity, cytotoxicity, neurotoxic potential, dermal irritations, etc., on exposure to various living organisms, especially aquatic species. In turn, certain by-products of malachite green also bear the mantle of xenobiotic and carcinogenic nature. This has subsequently raised significant health and environmental implications [8]. On the other hand, tartrazine has been found to inflict a gamut of adverse health implications on human beings on direct exposure which are inclusive of carcinogenicity and allergenicity in higher concentrations. In response to these critical environmental challenges, the scientific community has been strictly galvanized to explore various efficient remedies [8]. Several conventional technologies, viz., reverse osmosis, chromatography, chemical oxidation, etc., have been enlisted in carrying out the decolorization of dye-containing wastewater. However, these approaches are marred by significant limitations, encompassing prohibitive costs, incomplete dye removal, and exorbitant energy demands, thereby hampering their viability. Currently, adsorption, with the deployment of biochar or modified activated biomass, reigns supreme as the most efficacious methodology for purging pollutants from aqueous phases, driven by their cost-effective and eco-friendly nature [9].
The utilization of this material has seen a notable increase over the last few years owing to its cost-effectiveness and other beneficial properties viz., the presence of a greater number of oxygen-containing functional moieties, large surface area, high cation exchange capacity, etc. [9]. Due to the presence of these aforementioned traits, biochar has found its application in diverse domains viz., as adsorbents in wastewater treatment for the removal of organic dyes, trace metals, volatile organic compounds (VOCs), pesticides, polycyclic aromatic hydrocarbons, etc. [10].
Many studies have reported the usage of biochar for dye removal and wastewater purification, e.g., Zhao et al. [11] investigated the performance of biochar obtained from bamboo residues modified with magnetic nanoparticles for the removal of methylene blue from aqueous solutions. The magnetic biochar showed enhanced removal efficiencies due to the synergistic effects of increased surface area and magnetic properties, which facilitated the easy separation of the biochar from treated water. Nguyen et al. [12] explored the efficacy of rice husk-derived biochar as an adsorbent for removing reactive dyes from industrial wastewater. The biochar was produced through pyrolysis at various temperatures, and its properties were optimized for maximum dye adsorption. Kumar et al. [13] highlighted the use of biochar derived from agricultural waste materials (corn stalks and rice husks) doped with nano-zero-valent iron for the treatment of textile wastewater. The study emphasized the dual functionality of the biochar composite in adsorbing dyes and degrading organic contaminants through advanced oxidation processes. Similarly, Lee et al. [14] focused on the application of biochar produced from forestry waste, specifically pine needles, for the removal of azo dyes from synthetic wastewater. Martins et al. [15] explored the lifecycle assessment of biochar production from municipal solid waste and its application in urban wastewater systems for the removal of complex dye mixtures. The biochar demonstrated high efficiency in removing a broad spectrum of dye molecules, and the study highlighted the environmental benefits of diverting waste from landfills into productive use in pollution control, thus supporting circular economy principles.
Polymer composites have occupied a foremost position owing to their easy processing technique, low-cost, and lightweight nature. Biochar, being a sustainable, low-cost, and environmentally benign material, has been used as a reinforcing agent to improve the properties of the pristine polymers over other conventional carbon additives. Studies revealed that biochar-reinforced polymer composites are known to exhibit better thermal, mechanical, and electrical conductivity properties [16]. These composites are widely used nowadays in manifold genres viz., packaging, automobiles, aerospace industries, etc. Unlike other carbon fillers, the properties of biochar can be easily tuned by altering the pyrolysis temperature conditions to improve the hydrophobicity feature which in turn facilitates better compatibility with polymer matrices [17].
Despite considerable advancements in wastewater treatment technologies, the persistent challenge of effectively removing synthetic dyes from industrial wastewater remains inadequately addressed. Synthetic dyes are difficult to break down on the ground because of their complex and stable chemical structures, posing significant environmental and health risks when discharged into aquatic ecosystems [7]. Traditional wastewater treatment methods often fall short in terms of efficiency, selectivity, and cost-effectiveness, especially when dealing with varied and chemically diverse dye pollutants. Current biochar-based adsorption technologies, while sustainable, typically exhibit limited adsorption capacities, selectivity, and stability under operational conditions, reducing their practical applicability in large-scale and continuous systems. Moreover, most biochar adsorbents struggle with issues of regeneration and reuse, which are crucial for economic feasibility in real-world applications [11–13].
There is a substantial gap in the development of advanced biochar-based materials that can address these limitations. Specifically, there is a lack of studies focused on the synergistic integration of biochar with different functional polymers to create novel polymer nanocomposite materials that can enhance adsorption capacity, selectivity, and stability [16,17]. While lignin-derived biochar provides a renewable and cost-effective sorbent base, its enhancement through incorporation with synthetic polymers, viz., poly(ester amide urethane) has not been extensively explored. Such nanocomposites could potentially offer enhanced mechanical and chemical stability, improved adsorption dynamics, selective adsorption capabilities, as well as cost-effective regeneration and reuse [16].
Therefore, in this context, biochar was prepared from commercial Kraft lignin via a pyrolysis process. Lignin is considered an appealing feedstock for carbonization purposes owing to its facile availability, low-cost, and renewability. Herein, an attempt has been made to convert lignin into a high-grade adsorbent material by carrying out pyrolysis at a high temperature. In turn, the synthesized biochar was employed as a reinforcing agent for carrying out incorporation in the polymer matrix. The latter was prepared by invoking a melt polycondensation technique via an environmentally benign route [18]. The biochar-poly(ester amide urethane) nanocomposites were fabricated by altering the weight percentages of biochar material inside the polymer matrix. All the synthesized polymer composites along with the biochar material underwent comprehensive evaluation and different tests were carried out. These assessments aimed to instill specific properties deemed advantageous for applications across diverse domains.
Kraft lignin (Sigma Aldrich, St. Louis, MO, USA) of low sulfonate content was used as obtained without modification. Citric acid (Merck, India) and glycerol (Merck, India), both in anhydrous states were used after carrying out overnight drying in vacuum condition at 60°C. Dimethyl sulfoxide (DMSO, Merck, India), hydrochloric acid (HCl, Rankem, India), isophorone diisocyanate (IPDI) (Sigma Aldrich, USA), ortho-phosphoric acid (Rankem, India), sodium hydroxide (NaOH, Merck, India) and hexamethylenediamine (Sigma Aldrich, USA) were used as received. Poly(vinyl alcohol), (PVA) (CDH Pvt. Ltd., Ahmedabad, India) was used to incorporate further modifications in the prepared parent polymeric substance, having a molecular weight of around 85,000–100,000. Malachite green oxalate (MG, SRL, India) and tartrazine (TZ, SRL, India) were used as obtained for performing the dye adsorption studies. p-Toluenesulphonic acid monohydrate (p-TSA, SRL Pvt. Ltd., Mumbai, India) was kept in a desiccator, owing to its hygroscopic behavior before its utility. The bacterial strain, viz., Bacillus subtilis was gathered from the Department of Molecular Biology and Biotechnology, Tezpur University, India for conducting the biodegradation studies.
Biochar material was synthesized from kraft lignin (State: Dark brown amorphous powder, Solubility: alkaline solution, good chemical and thermal stability), and the preparation involved multiple steps as discussed below. Initially, the kraft lignin powder was thoroughly rinsed with deionized water to get rid of any sort of contaminants or undue residues. Subsequently, the kraft lignin powder was dried at room temperature for 24 h followed by drying in a convection oven at 100°C for 5 h. This was further followed by suspending the kraft lignin powder in 30 mL of 30 wt/wt% of ortho phosphoric acid. The entire contents of the prepared solution were subjected to uniform suspension for 24 h followed by drying at 100°C which resulted in the formation of an imbued mixture. The impregnated mixture was allowed to undergo carbonization at 450°C in a muffle furnace for a time duration of 1.5 h. Then the sample was ground uniformly to a fine mixture, washed, and eventually filtered. The solid contents were then washed off with 200 mL of 0.1 M HCl solution to get rid of any unwanted residues or chemicals. The solid sample was washed again with distilled water until the pH of the filtrate dropped down to 7. The washed product was subjected to drying for a time regime of 24 h at 100°C [19]. The obtained product was then utilized as filler for carrying out the fabrication of polymer composites.
2.2.2 In-Situ Preparation of Biochar/Poly(ester amide urethane) Nanocomposite
The polymeric material, i.e., poly(ester amide) resin was synthesized by carrying out melt polycondensation between the primary substrates, viz. hexamethylene diamine, citric acid, and glycerol via a one-pot reaction as mentioned in our previous report [18]. The contents of the reaction mixture were heated continuously at 140°C for a time of 3 h under vacuum conditions. This was followed by a collection of the end product as a thick viscous matter before attaining the gelation point by carrying out close monitoring of the course of the reaction till its completion. In turn, an attempt was made to upgrade the strength as well as the texture of the polymeric material by incorporating PVA into the matrix in DMSO solvent. The reaction mixture was further subjected to constant heating at 80°C for 1 h until the accomplishment of a consistent mixture. This was followed up by the addition of biochar particles dispersed in 1 mL of DMSO solvent. Subsequently, the reaction was conducted for another 45 min followed by the addition of IPDI in a dropwise pattern [20]. Moreover, the entire process was continued for another 30 min at 60°C until absolute consumption of isocyanate was attained under the stated preceding reaction parameters. The entire process of synthesis of biochar along with fabrication of the polymer nanocomposites is illustrated in Fig. 1.
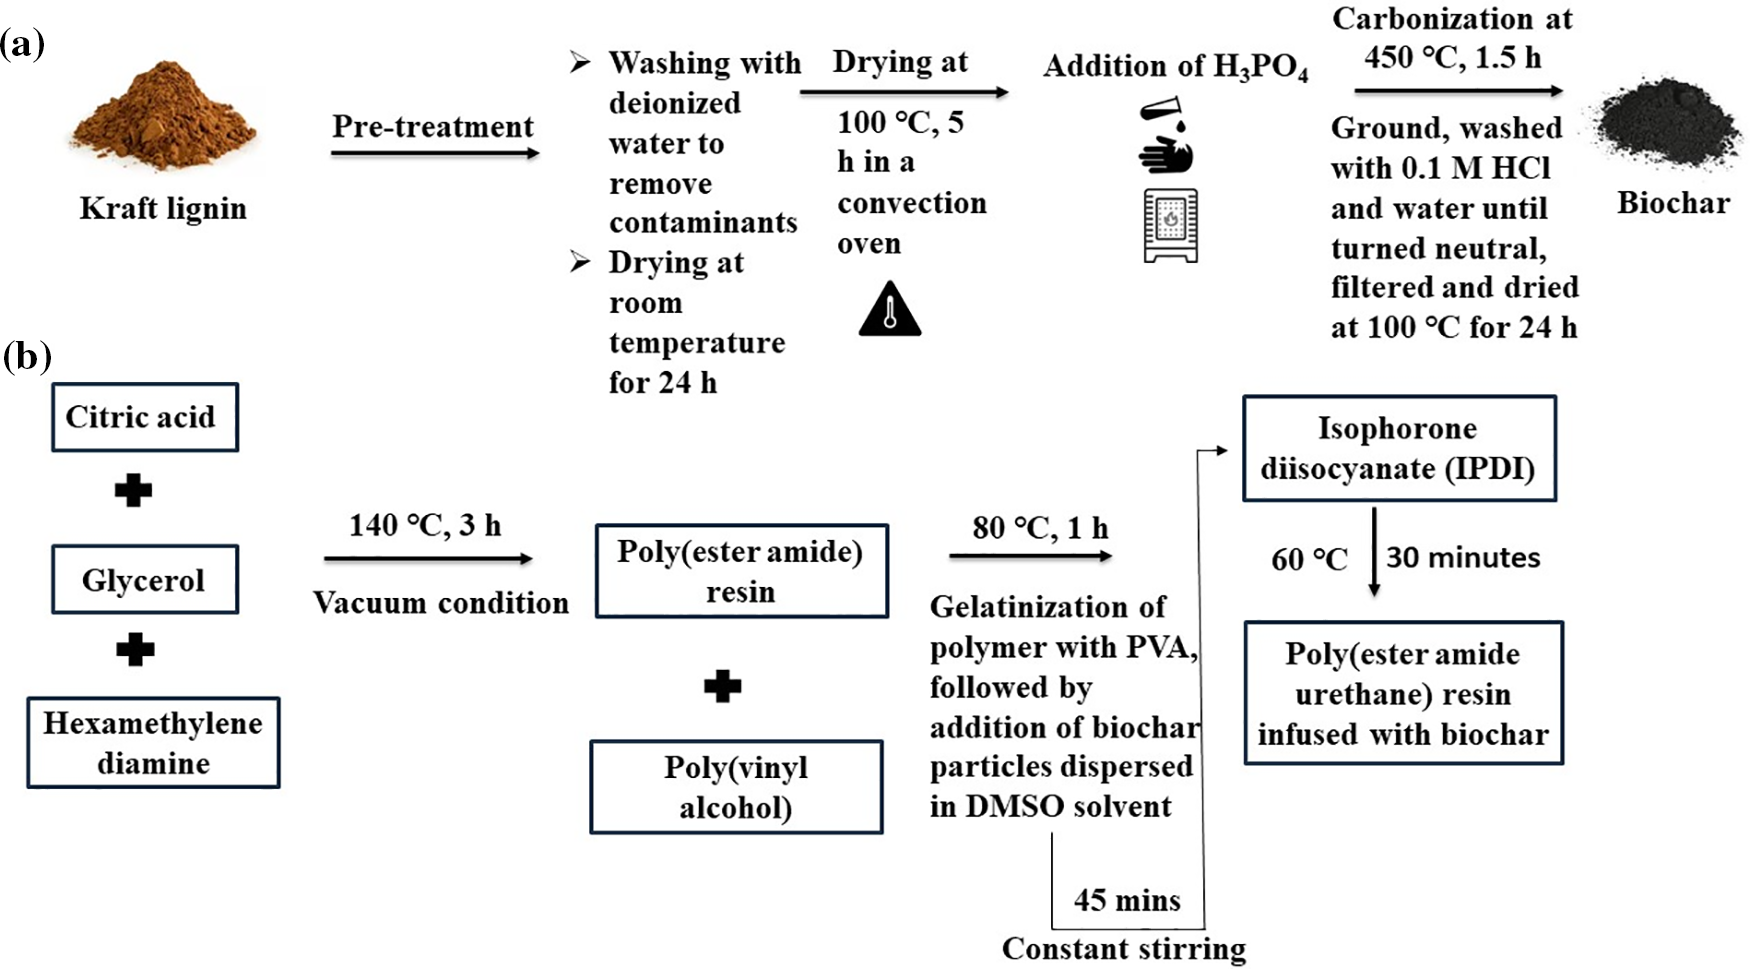
Figure 1: Scheme for (a) synthesis of biochar, and (b) synthesis of biochar integrated poly(ester amide urethane) nanocomposites
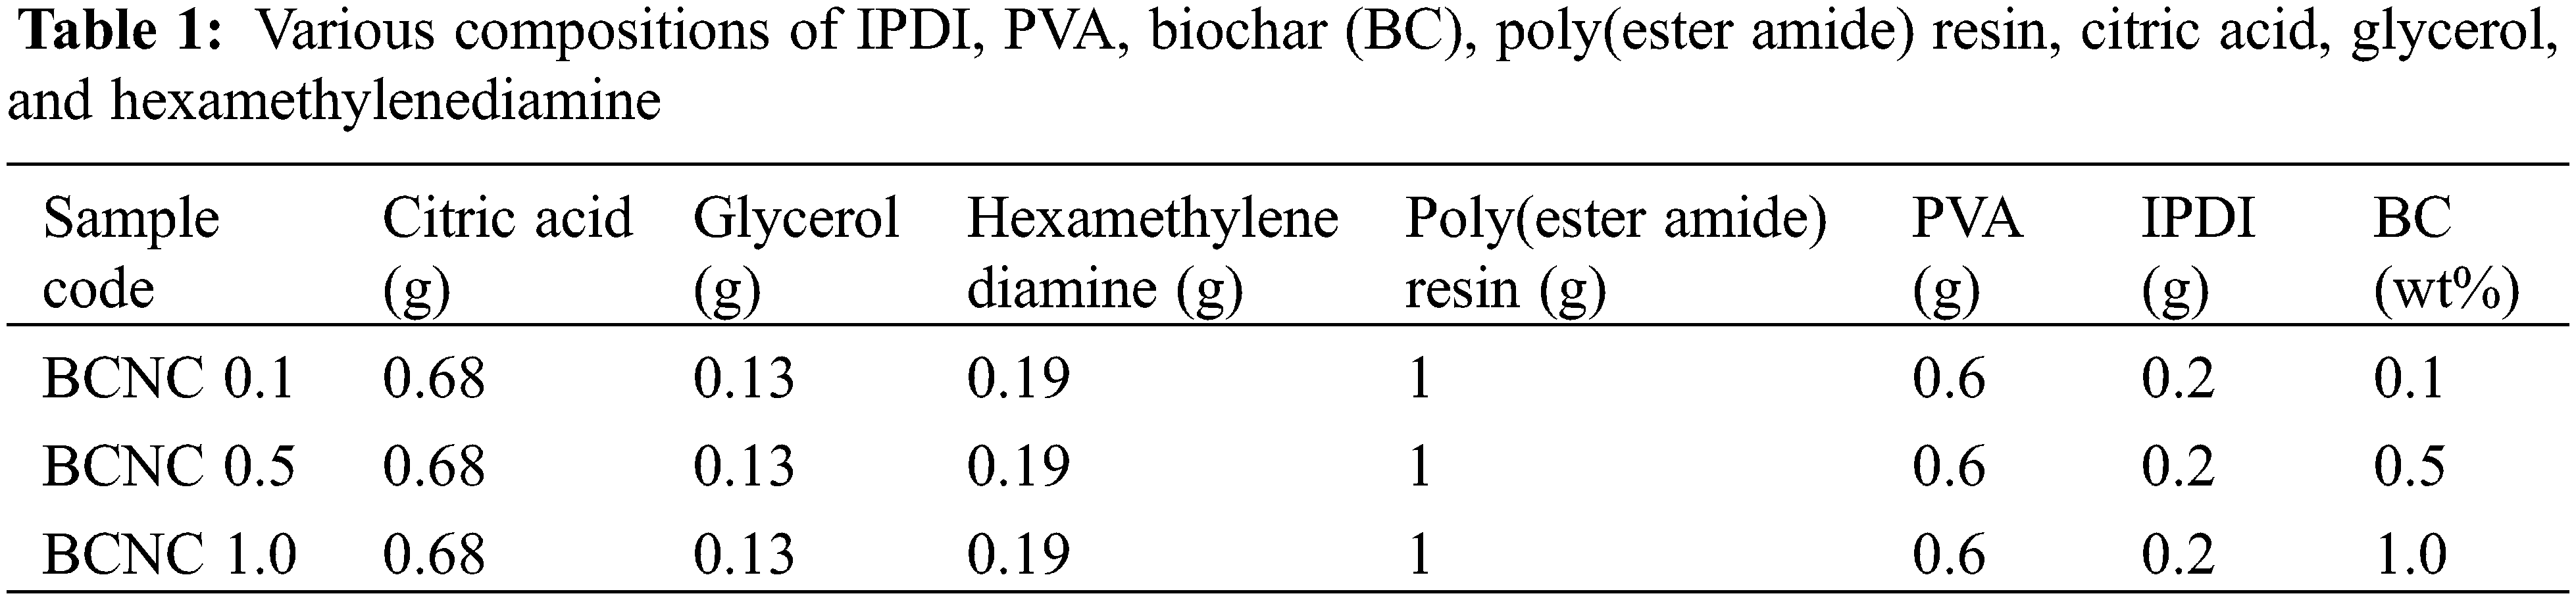
After completion of the reaction, the polymeric contents were sonicated in an ultra-bath sonicator for 20 min to agitate the biochar particles as well as to achieve uniform dispersion in the overall reaction mixture. The contents of the reaction mixture were poured down into Teflon sheets and were subjected to drying at 50°C in a conventional drying oven for two to three days followed by drying at 70°C for another four to five days until they attain their touch-free condition. The polymeric films were taken out from the oven and kept for further analysis. Following this, the three biochar/poly(ester amide urethane) nanocomposites were fabricated at different weight percentages of biochar. Under this context, they were assigned correspondingly as BCNC 0.1, BCNC 0.5, and BCNC 1.0 as depicted in Table 1.
To conduct the dye adsorption study of biochar and biochar-reinforced poly(ester amide urethane) nanocomposite, adsorption capacities were evaluated for two different dyes, viz., malachite green (cationic dye) and tartrazine (anionic dye). The concentration of 1000 mg/L stock solutions was prepared followed by the preparation of solutions of other lower concentrations by carrying out necessary dilutions. To invoke the effect of adsorption capacity, 30 mg of biochar as well as biochar-reinforced polymer nanocomposites were added to 50 mL of 50 ppm dye solutions. Subsequently, batch adsorption studies were carried forward by choosing the optimal composition of the nanocomposite material as the representative sample material.
Different tests were performed by taking adsorbent dosages of 5–40 mg of biochar as well as nanocomposite materials in 50 mL of dye solutions with concentrations varying from 10–60 ppm along with pH values ranging from 2–12. Meanwhile, the pH parameters were adjusted using 0.1 N NaOH and HCl solutions. All the solutions were stirred consistently using a magnetic bead stirrer at 540 rpm. After execution of the tests, the adsorbent materials were separated by conducting filtration, and the dye concentration before and after uptake of the dye materials was measured by using a UV-visible spectrophotometer. The removal efficiency (%) and adsorption capacity (qe, mg/g) were estimated by invoking Eqs. (1) and (2), respectively [21–23].
where C0 refers to the initial concentrations of dye solution (in ppm), Ce denotes the concentration of dye solution after attaining adsorption equilibrium (in ppm), V signifies the volume of the dye solution (in mL) and m refers to the adsorbent mass (biochar and its nanocomposite material) used in running the experiment (in g), respectively.
The Fourier transform infrared (FTIR) spectra of prepared biochar material as well as biochar/poly(ester amide urethane) nanocomposites were recorded in a Nicolet FTIR spectrophotometer (Impact-410, Alexandria, VA, USA), functioning in the scan limit of 4000–500 cm−1 employing KBr pellets. Elemental analyses were conducted in a CHNS analyzer (Flash 2000, Thermo-scientific, Waltham, MA, USA). X-ray Photoelectron Spectroscopy (XPS) analysis was carried off in an XP spectrometer (ESCALAB 220 XL, Thermo-scientific, Waltham, MA, USA) utilizing 100 and 40 eV as constant analyzer energies for conducting compositional analyses. The Raman spectrum of biochar material was acquired in a Raman spectrometer (514 Lasers, Renishaw, Pliezhausen, Germany). The evaluation of the diffraction patterns as well as crystallinity indices were recorded in a Powder X-ray Diffractometer (PXRD, Bruker AXS, D8 focus, Karlsruhe, Germany) along with a scanning rate of 1°/min. The surface area and pore analysis of biochar material was conducted in a Brunauer-Emmett-Teller (BET) pore and surface area analyzer (Quantachrome, NOVA 1000E, FL, USA). Proximate analysis of biochar was carried out in a muffle furnace (LabTech, STM, 1200 series, Dongguan, China) as per ASTM standards D5142.
The transmission electron microscopy (TEM, FEI manufacturer, USA, G220, TECHNAI, USA) analysis was conducted to characterize the biochar particles and assess the particle size distribution in the biochar/polymer dispersion. The topographical information of biochar material as well as the nanocomposite was recorded in a field emission scanning electron microscopy instrument (FESEM) holding model number JSM-7200F, Japan. Scanning electron microscopy coupled with energy dispersive X-ray spectroscopy (SEM-EDX, JEO, JSM-6390 LV, Tokyo, Japan) technique was utilized to assess the surface morphology along with the elemental composition of biochar material and its nanocomposite.
Evaluation of mechanical parameters viz., elongation at break, toughness, tensile strength, etc., was carried out in a Universal testing machine (UTM, Jinan, China, WDW10). Additionally, thermal properties were analyzed by using thermogravimetric analysis (TGA, Perkin Elmer, 4000 system, Waltham, MA, USA) and differential scanning calorimetry (DSC, Perkin Elmer, 6000 unit, Waltham, MA, USA) assessment.
To assess the biodegradability of the synthesized polymeric samples, Bacillus subtilis, a gram-positive bacterium, was utilized. The study employed the McFarland turbidity standard to measure bacterial growth. A custom culture medium was formulated by mixing various salts, including 4.75 g of KH2PO4, 2 g of (NH4)2SO4, 1.2 g of MgSO4.7H6O, 2 g of Na2HPO4, 1 g of MnSO4.5H2O, 10 mg of H3BO3.5H2O, 1 mg of FeSO4.7H2O, 70 mg of ZnSO4.7H2O, 0.1 g of CuSO4.7H2O, 0.5 mg of CaCl2.7H2O, and 10 mg of MoO3, all dissolved in 1 L of demineralized water. This solution was sterilized in an autoclave at 120°C with 15 lbs of pressure for 30 min and used to culture bacteria at 37°C for 48 h. A 100 µL aliquot of this culture, containing approximately 108 microbes/mL, was transferred into a flask with 10 mL of a sterilized solution.
Subsequent steps included sterilizing the prepared polymeric films using UV light radiation at 254 nm before their introduction into a conical flask. The samples were then incubated at 37°C, and absorbance was measured at 600 nm over 4 weeks to monitor bacterial growth rates. Additionally, weight loss measurements were taken for all specimens, and their surface morphology was analyzed using a JOEL JSM-6390 LV Scanning Electron Microscope (SEM, Japan).
For the adsorption mechanism, 30 mg of biochar and biochar-reinforced poly(ester amide urethane) material were added to 50 mL of dye solutions (both malachite green and tartrazine solutions) taken into consideration. The dye solutions were stirred uniformly using magnetic bead stirrers for various intervals of time (10–120 min). After the elapse of pre-determined time, the amount of dye solutions remaining in the containers was taken out, collected in separate vials, and eventually measured using a UV-visible spectrophotometer. Under this context, pseudo-first-order (PFO), pseudo-second-order (PSO), and intra-particle diffusion (IPD) models were explored to perceive the adsorption kinetics of dye solutions on biochar/biochar-reinforced nanocomposite materials.
This model is significant in addressing the adsorption kinetics on the pretext that the availability of vacant sites on the surface of the adsorbent material is directly proportional or linked to the occupancy of the available binding regions. The linear form of the PSO model is delineated as:
where Qe and Qt denote the adsorption capacities or amount of dye material removed after attaining equilibrium state and variable time interval, t, respectively. The term k1 denotes the rate constant in min−1 for this kinetic model. In turn, a linear plot of log (Qe – Qt) vs. time provides the values for k1 and Qe from the slope and intercept terms, respectively [24].
This model is pertinent in explaining the adsorption mechanism on the ground that the rate of occupancy of vacant adsorption sites is directly proportional or linked to the square of the number of unoccupied binding zones of the adsorbent molecules. The model is generally denoted as:
where Qe and Qt refer to the adsorption capacities or amount of dye material removed after attaining an equilibrium state and variable time interval, t, respectively. The term k2 signifies the rate constant in gmg−1min−1 for this kinetic model. Moreover, the plot of t/Qt vs. time produces the values for k2 and Qe from the intercept and slope terms, respectively [25].
This model highlights an overall external transfer of mass as well as rate-determining or controlling mechanistic steps. The model is generally depicted as:
where Qt refers to the adsorption capacity of dye material at time t and kip depicts the rate constant in mg g−1 min−1/2 for this kinetic model. In turn, the plot of Qt vs. t0.5 produces a linear correlation between the two parameters. In turn, c (mg g−1) refers to the intercept and the value of the rate constant can be assessed easily from the slope of the line of regression [26].
Batch experiments were performed to evaluate the adsorption isotherms of the dye solutions on biochar/biochar-reinforced nanocomposite materials. Herein, 30 mg of adsorbent materials were added to 50 mL of dye solutions. Meanwhile, the dye solutions along with their respective were varied from 10 to 60 ppm. Subsequently, the reaction was allowed to run for a time duration of 40 min. The concentrations of the residual dye solutions were measured using a UV-visible spectrophotometer. Additionally, the acquisition equilibrium data procured from adsorption assessments were applied to fit into the Freundlich, Langmuir, and Temkin isotherm models which are denoted in Eqs. (6)–(8), respectively.
2.6.1 Freundlich Isotherm Model
This model accounts for multilayer adsorption on different heterogeneous surfaces or sites. The mathematical expression of this empirical model is depicted below:
where
This model demonstrates monolayer adsorption on various homogeneous sites or surfaces with no lateral or edgewise interactions with the adsorbed moieties followed by the involvement of a persistent amount of adsorption energies. The mathematical expression of this empirical model is depicted below:
where Qe stands for adsorption capacity or quantity of dye removed per g of biochar/biochar-reinforced nanocomposite material after attaining an equilibrium state. The term Qm signifies the maximum amount of dye molecules undergoing the adsorption phenomenon per g of adsorbent species. Ce denotes the concentration of dye solutions after achieving an equilibrium position, whereas
This model manifests the interaction of adsorbate as well as adsorbent interactions especially taking into consideration the bonding energy. However, this model negates very large and very small values of concentration. This empirical model takes into presumption the multi-layer adsorption process along with a linear reduction in the amount of heat or energy of adsorption. The mathematical form of this model is expressed as:
where R stands for universal gas constant in Jmol−1K−1 and Qe stands for adsorption capacity or quantity of dye removed per g of biochar/biochar-reinforced nanocomposite material after attaining equilibrium state. Ce denotes the concentration of dye solutions after achieving an equilibrium position, whereas
2.7 Desorption and Reusability Tests
Initially, 30 mg of biochar was subjected to 50 mL of dye solution bearing a concentration of 50 ppm. The experiment was allowed to run for a time of 40 min with a uniform stirring speed maintained at 200 rpm. The amount of dye adsorbed by the adsorbent material was recorded and studied explicitly with the help of a UV-visible spectrophotometer. The desorption test was conducted by extracting the solution with the help of a syringe and was restored with 20 mL of absolute ethanol. The reaction was run for another 30 min followed by drying the adsorbent at 100°C for an 1 h along with the removal of absolute ethanol. Subsequently, the weight of the regenerated adsorbent material was recorded to assess the amount of weight loss. Additionally, the regenerated adsorbent was further utilized to carry out a dye adsorption study as described above. The adsorption/desorption test was conducted successively for seven cycles [30,31].
The preparation of biochar involves carbonization of the Kraft lignin powder at an elevated temperature for a finite time. From a chemical perspective, the entire process of decomposition of Kraft lignin commences with the breakdown of different weaker bonds which are inclusive of C-OH as well as hydrogen bonds. With the further increment in temperature, different robust bonds, viz., β-O-4 linkages are eventually broken down. Under this context, in the initial low-temperature phase of the pyrolysis process, there is the formation of different compounds, viz., styrene, toluene, aldehydes, guaicyl hydroxyl entities, etc. Subsequently, in the higher temperature phase of the pyrolysis procedure, catechols, p-hydroxy phenols as well as cresols are produced. The rupture of β-O-4 linkages generates free radicals which facilitate the depolymerization of the lignin process. These free radicals can further combine to generate different substances such as 2-methoxy-4 methylphenol, etc. [32,33]. It was observed that above 300°C, random repolymerization of these free radicals results in the formation of the biochar material. Moreover, the fabrication procedure of biochar invoked the usage of H3PO4 as an activating agent. From a complete carbon balance perspective, the usage of H3PO4 in the pre-treatment process presents an avenue to enhance the carbon retention value of the biochar material during the pyrolysis process. In turn, the reactions invoking carbon as well as phosphorus along with the formation of crosslinking bonds (P-O-P), serve to fortify the overall stability of the carbon framework of the biochar material [34]. Consequently, biochar material subjected to H3PO4 treatment bears the potential to sustain a greater amount of carbon within the framework, thereby augmenting the carbon sequestration capability.
3.2 Characterization of Biochar Obtained from Kraft Lignin
The FTIR spectra of biochar as well as kraft lignin vary a bit. Kraft lignin, being an organic polymer derived from wood pulp, exhibited various characteristic peaks associated with different functional groups which are inclusive of -OH stretching vibrations at 3396 cm−1, -CH stretching vibrations at 2919 cm−1, -C=O stretching vibrations at around 1715 cm−1 and -C-O stretching vibrations at around 1114 cm−1. The existence of these functional groups indicated the organic nature of kraft lignin material. On the other hand, biochar being a carbonaceous material, exhibited a broad as well as a strong IR absorption peak at 3336 and 2910 cm−1 which attributed to -OH as well as -CH stretching vibrations, respectively. In turn, the presence of very weak peaks in the 1700–1650 cm−1 range is attributed to reducing the presence of carbonyl functional groups in the biochar material in comparison to Kraft lignin. Under the same context, the absence of strong FTIR peaks in the 1225–1015 cm−1 range corresponded to fewer -C-O functional groups in the biochar material. Moreover, the existence of a significant, broad FTIR absorption peak at 1630 cm−1 corresponded to the characteristic aromatic -C-C stretching vibrations, thereby reaffirming the formation of carbon-rich material, viz., biochar as illustrated clearly in Fig. 2a [35]. Therefore, the core difference in the FTIR spectra of biochar as well as kraft lignin is the greater content of organic functional groups in lignin material, whereas biochar material is primarily composed of carbon with the existence of few organic functional groups.
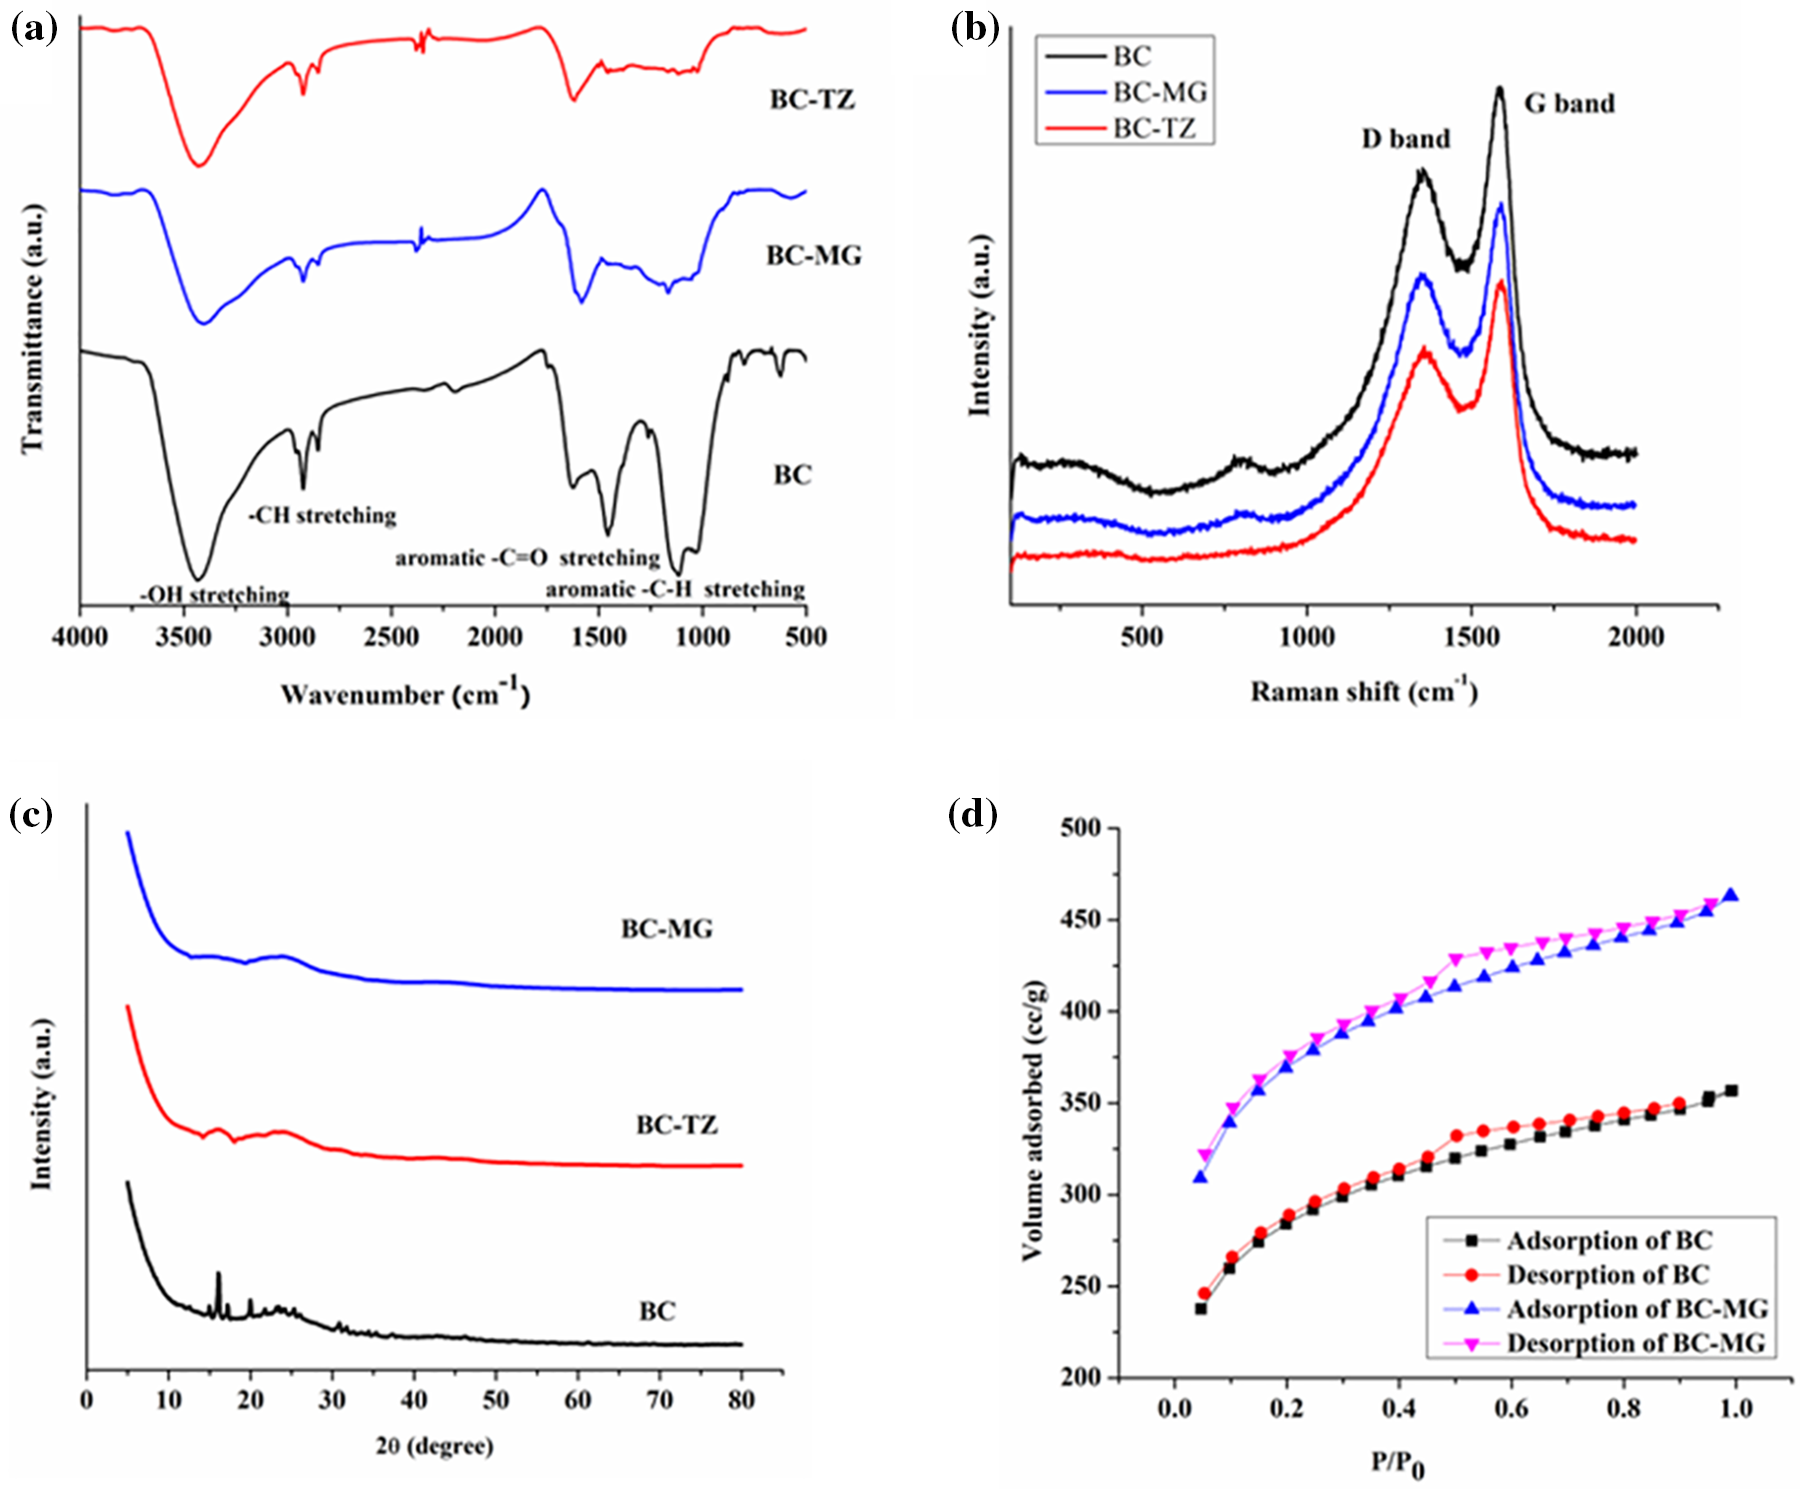
Figure 2: (a) FTIR spectra, (b) Raman spectra, (c) PXRD spectra, and (d) BET adsorption-desorption curves of biochar material before and after adsorption of dyes
Furthermore, after adsorption with dye molecules (MG and TZ), biochar demonstrated (BC-MG and BC-TZ) a shift in the absorption bands along with the disappearance of some bands. The -OH absorption bands shifted from 3396 to 3408 cm−1 (BC-MG) and 3436 cm−1 (BC-TZ). In turn, the -C=O stretching vibrations for BC-MG and BC-TZ shifted from 1715 cm−1 to 1605 and 1632 cm−1, respectively. Moreover, the intensity of the -CH stretching vibrations for BC-MG and BC-TZ decreased on the ground coverage of the biochar surface by dye molecules. Therefore, analysis of the FTIR spectra of biochar material before and after the adsorption of dyes provided insights into the nature of interactions between the dyes and biochar surface. The changes in the position, intensity, and disappearance of specific absorption bands as shown in Fig. 2a provided evidence of physical adsorption between the biochar and the dye molecules.
The Raman spectroscopy of biochar typically highlighted two main peaks in the spectrum, viz., the D band and the G band. The G band situated at 1590 cm−1 corresponded to the graphitic carbon content of the biochar material whereas the D band at 1349 cm−1 referred to the presence of disorders or defects in the structure of biochar material. The ID/IG ratio provided a clear depiction of the degree of graphitization as well as structural disorder. In this context, it was found to be 0.84 which indicates a high degree of graphitization along with a more orderly graphite structure of the biochar material as displayed in Fig. 2b [36]. Moreover, after adsorption with MG and TZ dyes, the Raman spectrum prominently highlighted two main peaks only, viz., D and G bands. However, slight shifts in the G and D bands, viz., 1611 and 1345 cm−1 for BC-MG, as well as 1602 and 1340 cm−1, respectively, were observed which indicated structural modifications due to adsorption of dyes (Fig. 2b).
The XRD patterns of biochar as shown in Fig. 2c typically illustrated the broad diffraction peaks on the ground of the amorphous nature of biochar material, occurring from charring as well as incomplete combustion of organic materials during the pyrolysis procedure. The peak at 2θ = 23.34° referred to the disordered graphitic carbon structure, whereas other peaks at 2θ = 30.88°, 31.53°, 32.18°, 34.63°, 35.46° and 37.42° depicted the existence of crystalline phase of calcite. Moreover, other peaks at 2θ = 21.69° and 17.43° indicated the lines of diffraction of quartz material (SiO2) and unreacted lignin particles, respectively [36]. In turn, after adsorption with MG and TZ dyes, the broadening of XRD peaks was observed for the biochar material. This broadening is the result of the interaction of the biochar material with the dye molecules; thereby reflecting changes in the biochar’s crystalline domains or overall structure as shown in Fig. 2c. Additionally, the peaks corresponding to biochar reduced in intensity after adsorption due to the coverage of the biochar surface by the dye molecules, which affected the diffraction pattern.
The BET method is used to assess the specific surface area of various porous materials, including biochar. This technique provides useful information about various surface properties of biochar, which can be useful for conducting different applications. The specific surface area is found to be 1038.35 m2/g along with a pore volume of 0.118 cc/g and pore size of 3.85 nm as obtained from the BJH (Barrett-Joyner-Halenda) desorption results [37]. A higher specific surface area value depicts potentially more reactive as well as more porous biochar materials. In turn, the pore size distribution studies revealed that the synthesized biochar material possessed pores that are mesoporous as their pore size falls within the ambit of 2–50 nm. Furthermore, the N2 adsorption-desorption isotherm as shown in Fig. 2d also indicated greater N2 adsorption at lower partial pressure which further enumerated filling up of the mesopores, and the existence of hysteresis between 0.54 and 0.75 relative pressure further substantiated the fact that the biochar material possessed mesopores as reported in various studies [33]. After the adsorption of dyes, there was a decrement in the specific surface area of the biochar material from 1038.35 to 855.71 m2/g. This change in specific surface area reflected the occupation of surface sites and pores by dye molecules. Moreover, the pore volume also showed a decrease from 0.118 to 0.114 cc/g which is indicative of blocked or filled pores due to dye adsorption.
This XPS technique provides useful information about the elemental surface composition, functional groups, and chemical bonding of the biochar material. A meticulous study of the XPS spectra demonstrated the existence of O and C as the core elements along with P, S, and Al in trace amounts as illustrated in Fig. 3a. The atomic fractions of these elements were found to be 78.48%, 20.02%, 1.02%, 0.35% and 0.13%, respectively. In turn, a comprehensive assessment was conducted by invoking the high-resolution spectra of C 1s, O 1s, P 2p, and S 2p. Under this context, the C 1s spectrum was deconvoluted into three major peaks centered at 284.1 eV, which is assigned to C-C (sp2); at 286.3 eV, which is conferred to C-O; and at 287.2 eV, which is attributed to C=O, respectively (Fig. 3b). The existence of these peaks substantiated the presence of carbon double bonded with oxygen in carbonyl and quinone-like structural entities. Furthermore, the O1s spectrum was deconvoluted into two major peaks which were further designated categorically to C-O at 531.8 eV and C=O at 532.9 eV, respectively (Fig. 3c) [15]. Similarly, the S 2p spectrum was deconvoluted into two core peaks which are assigned particularly to oxides of sulfur at 169.2 eV and sulfur (0) peak at 164.5 eV, respectively. Phosphorus and aluminum also displayed their corresponding XPS peaks at 134.21 and 72.8 eV, respectively (Fig. 3d) [32]. After adsorption of MG dye by biochar material, Cl was found in trace amounts along with the core elements, viz., C and N. Similarly, after adsorption of TZ, Na was detected along with C, N, O, and S. The presence of these peaks confirms successful adsorption of these dyes on the surface of biochar material.
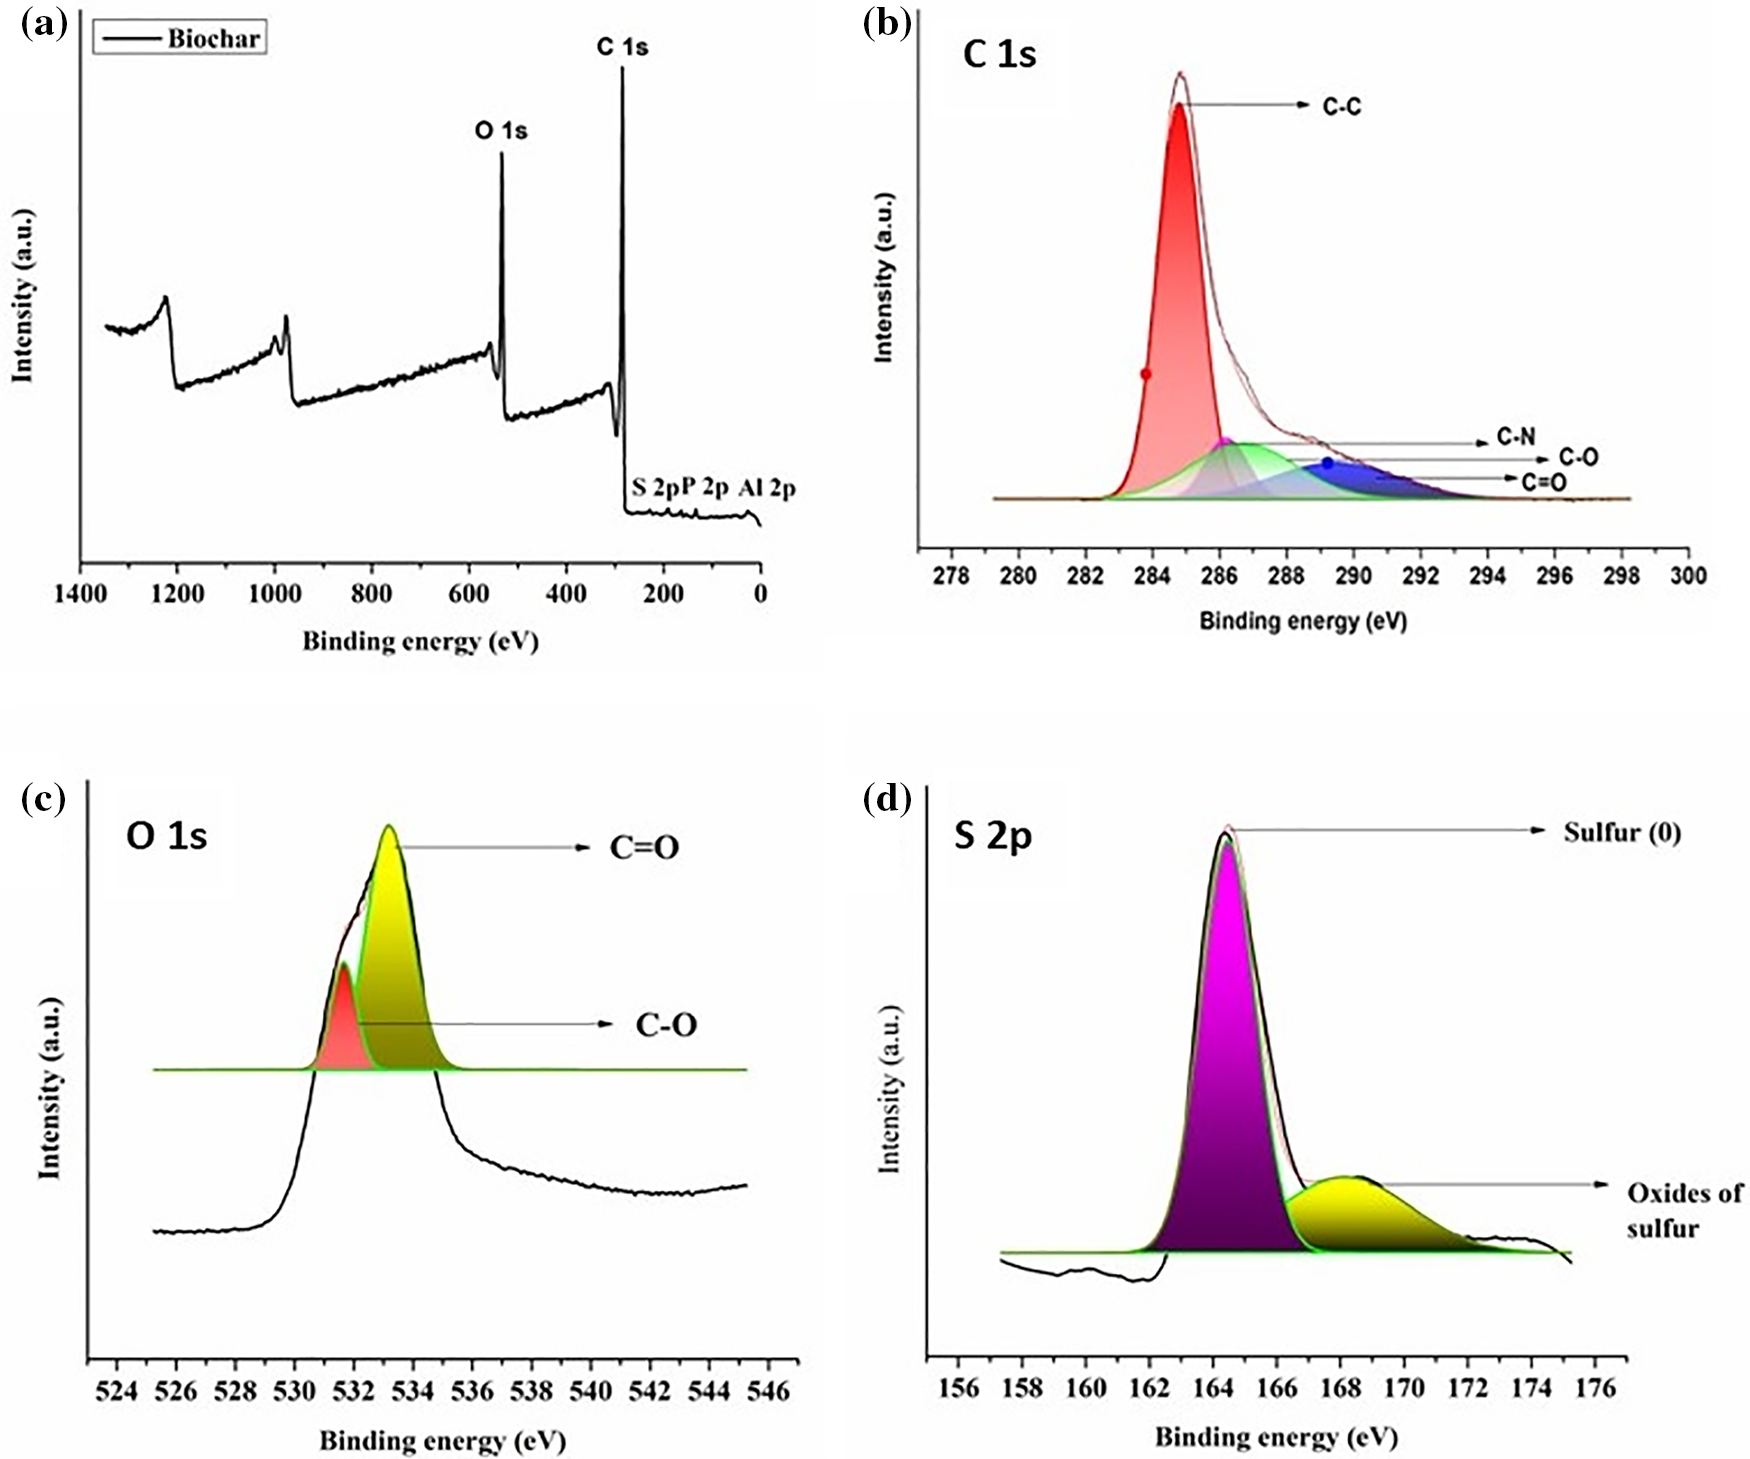
Figure 3: (a) XPS survey spectra, (b) C 1s, (c) O 1s, and (d) S 2p high-resolution spectra for biochar material
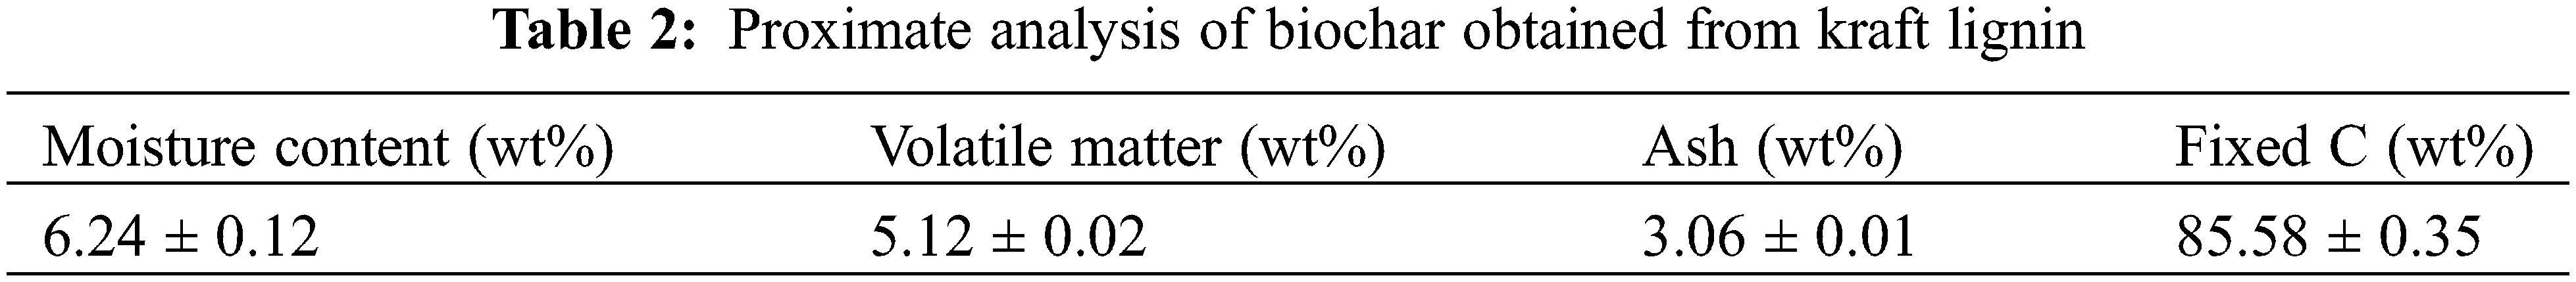
3.2.6 Proximate and Ultimate Analysis
The proximate analysis of biochar was conducted to evaluate the core chemical composition of the material. It involved determining various parameters, viz., fixed carbon proportion, moisture content, volatile matter, ash amount, etc. Table 2 provides comprehensive detailed information on all the aforementioned variables. As previous reports suggest, an increment in pyrolysis temperature results in a lowering of the volatile matter content on the ground of the complete carbonization process. In turn, an increase in carbonization temperature culminates in an overall increment of the ash content with a subsequent decrease in the fixed carbon amount. Other studies further reveal that enhancement in pyrolysis temperature within the ambit of 400°C to 800°C yields notable decrement in the content of volatile matter which can be attributed to the aromatization method, enrichment of different inorganic minerals as well as degradation of different lignocellulosic components. These findings perfectly align with the results reported by Domingues et al. [30,31]. In our work, the biochar prepared from kraft lignin exhibited a high fixed carbon content, i.e., 85.58 wt% along with low ash and volatile matter amount and the results were found to be comparable with the reports of Nair et al. as well as Lee et al. [37–39].
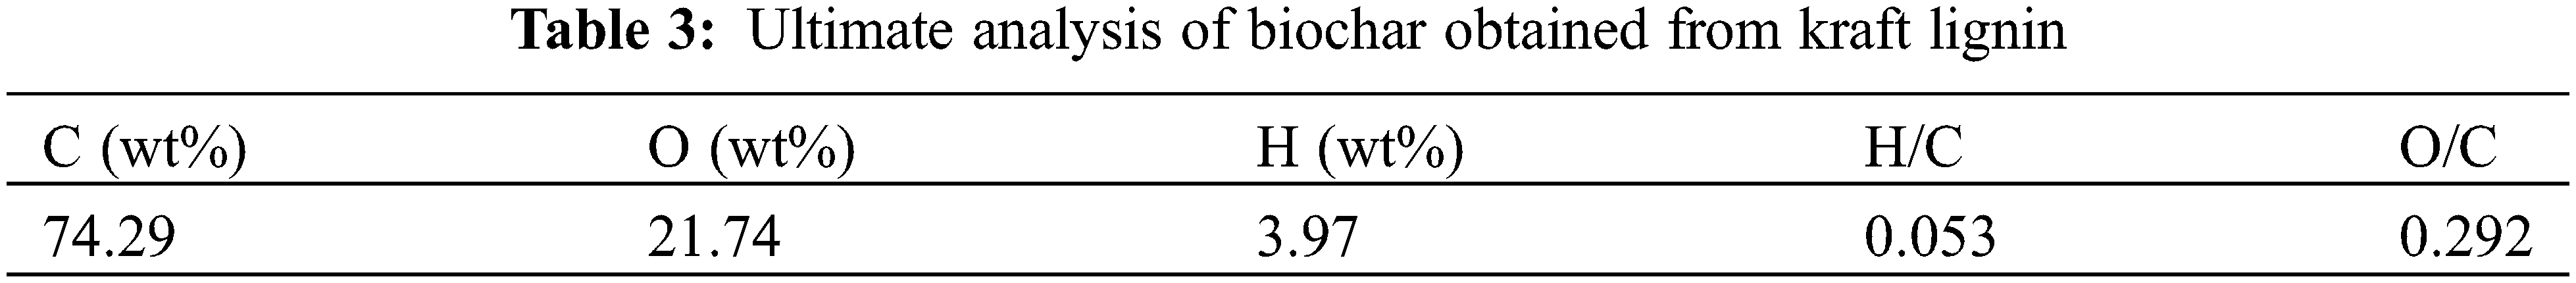
The ultimate analysis of biochar invokes assessing the elemental composition, inclusive of different percentages of carbon, oxygen, sulfur, etc. The obtained results provide insights into the chemical composition of the biochar material. Table 3 demonstrates the outcomes of the ultimate analysis carried out on biochar material prepared from kraft lignin. It was noted that the biochar possessed a higher mass fraction of carbon content of 74.29% along with 21.74% of oxygen content. The reason behind the increment in the carbon mass fraction can be attributed to the development of a condensed carbon entity resulting from polymerization reactions as well as the reduction of hydroxyl functional groups present on the periphery of biochar material during the dehydration procedure. In turn, the H/C ratio was found to be very low, i.e., 0.053 which is demonstrative of the fact that the synthesized biochar had a high degree of aromatization and carbonization. Additionally, the O/C ratio was observed to be notably low on the ground of the elimination of the oxygen-bearing functional moieties from the biomass matrix during the pyrolysis as well as the dehydration processes [39].
The FESEM study was conducted to assess the morphology of the biochar material. According to the FESEM images as shown in Fig. 4a, the biochar material demonstrated particle-like nature at the nanometer scale which is consistent with literature studies reported earlier [30–32]. In addition, the biochar particles exhibited spherical morphology and the fineness of the particles on the ground of its high surface area has led to the formation of some agglomerations, as evident from the FESEM images.
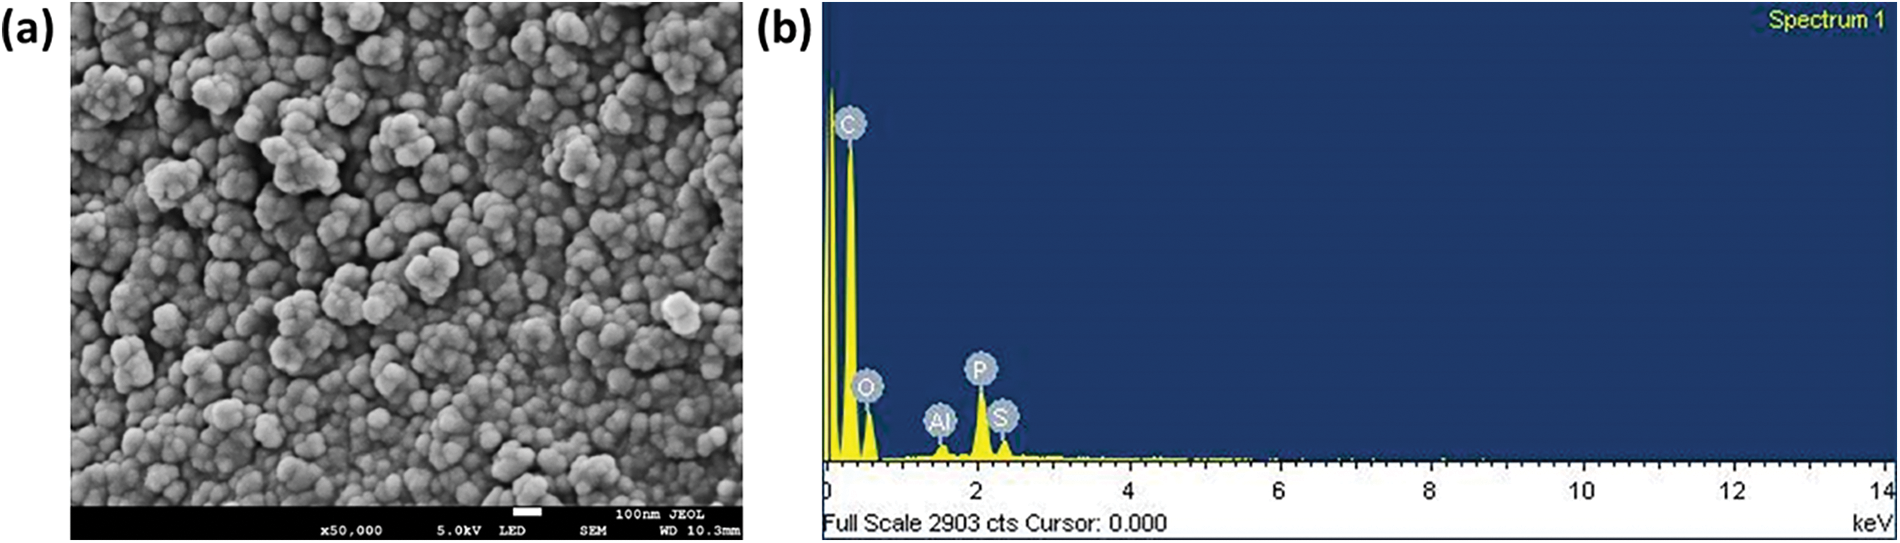
Figure 4: (a) FESEM images and, (b) EDX study of biochar material
In turn, the EDX technique was employed to conduct elemental analysis on the biochar material. It allowed for identification as well as quantification of different elements present in the biochar. Fig. 4b illustrated the elemental distribution of the biochar and the weight percentages of the elements detected in the analysis were found to be: C-70.19%, O-24.86%, Al-0.48%, P-3.55%, and S-0.92%. Moreover, the presence of C, O, Al, P, and S was corroborated by XPS analysis as well as ultimate analysis, thereby supporting the EDX results. Fig. 5 further depicted the elemental mapping of biochar which indicated well-dispersed C, O, P, S, and Al on the surface of the sample, with carbon being the predominant element [34].
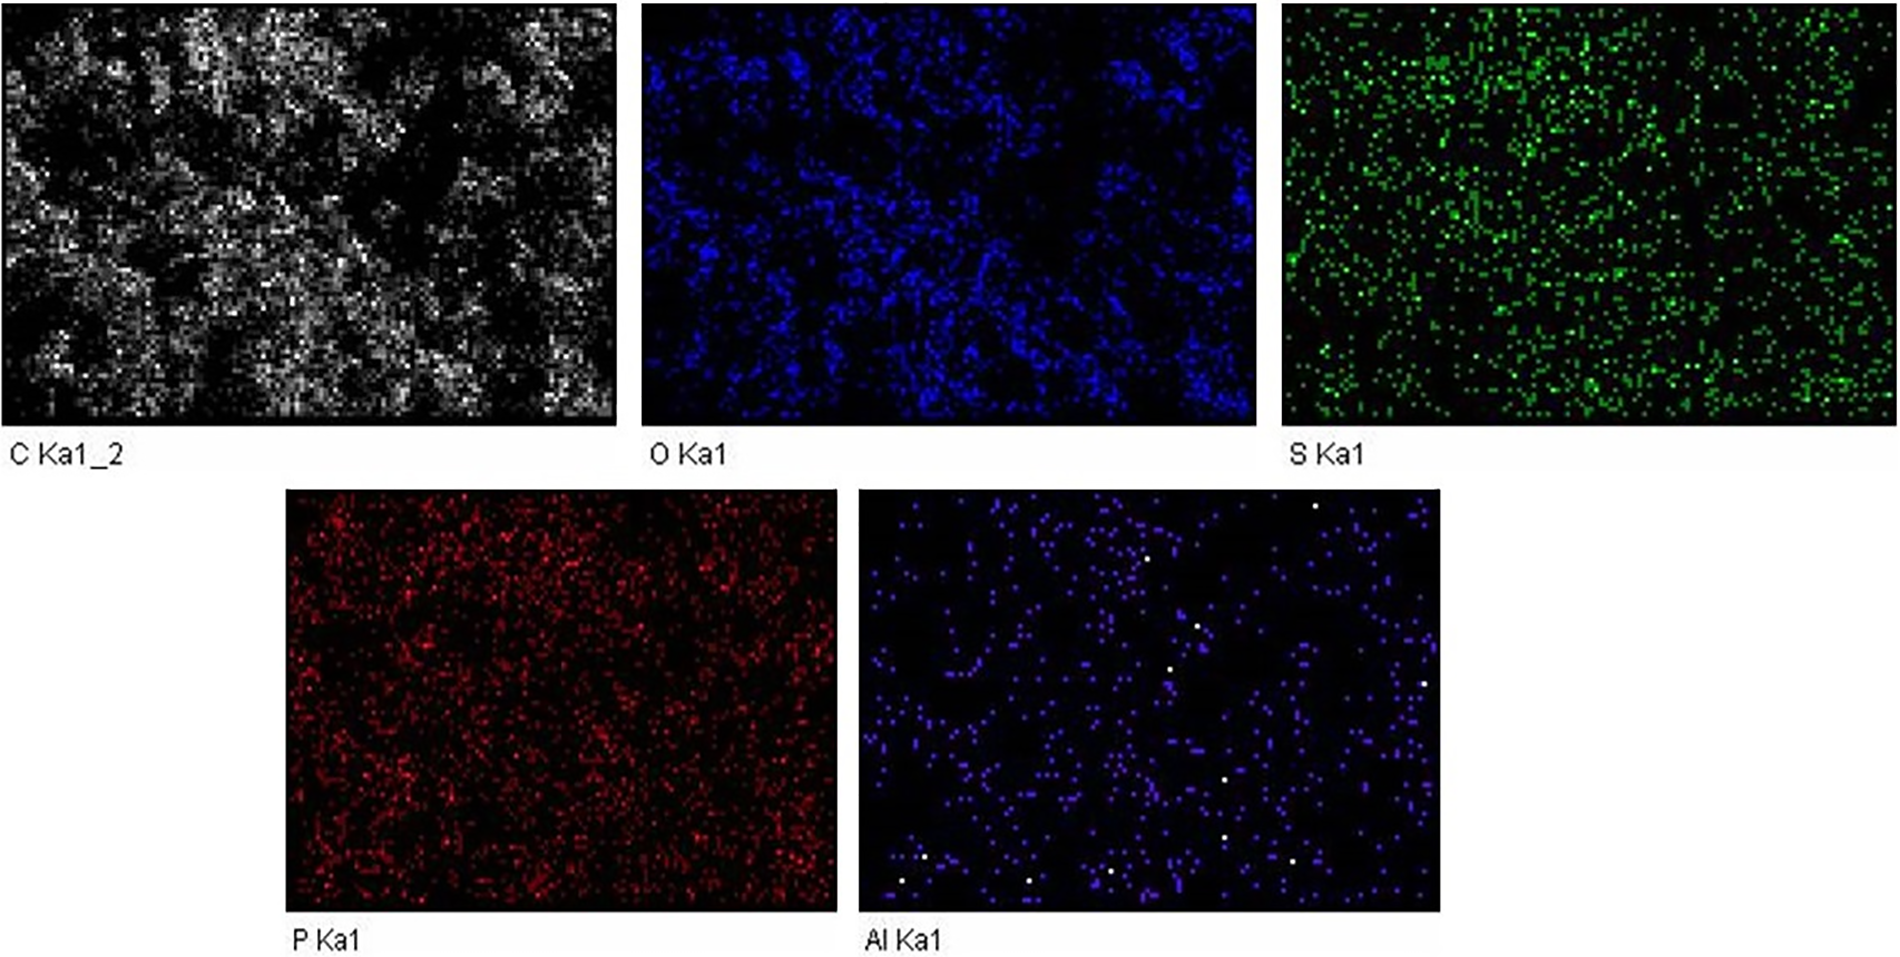
Figure 5: Elemental mapping of biochar material
This technique was employed to investigate the morphology of the biochar material derived from kraft lignin. The TEM analysis confirmed the spherical morphologies of the biochar particles as shown in Fig. 6. In addition, the existence of these particles within the nanometer range is confirmed by the TEM images. Consistent with the FESEM results, the TEM images also indicated huge agglomerations on the ground of high surface area [28–30].
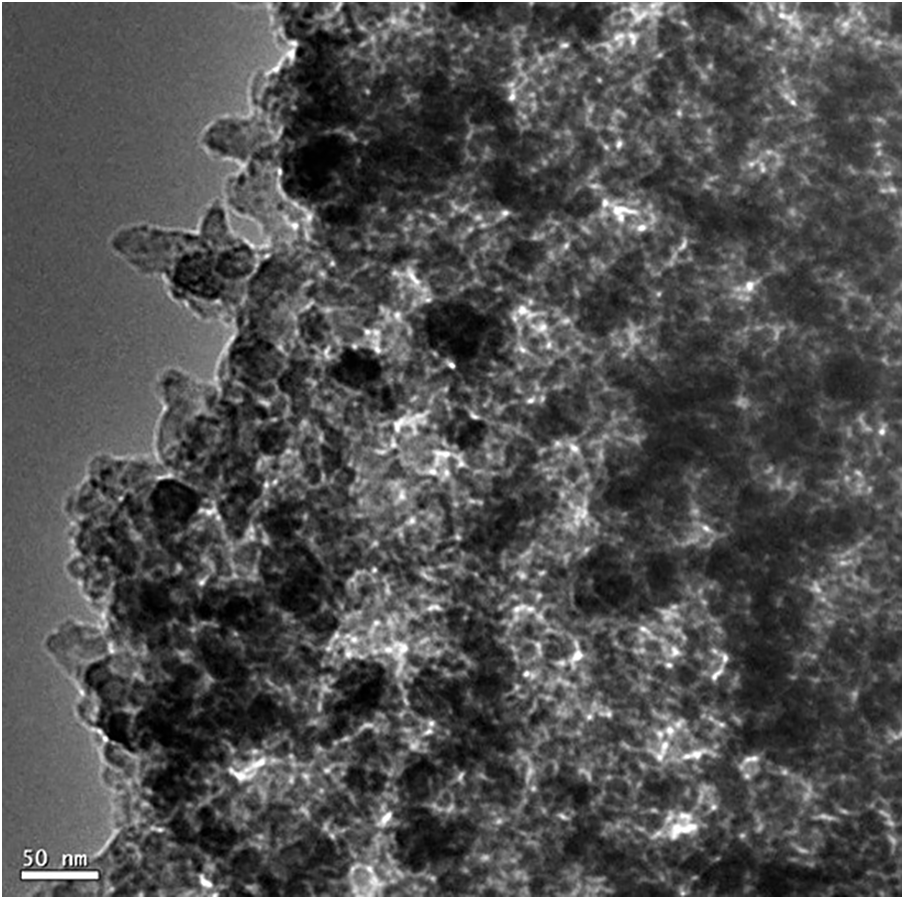
Figure 6: TEM analysis of biochar material
3.3 Fabrication of Biochar/Poly(ester amide urethane) Nanocomposite
The biochar/poly(ester amide urethane) nanocomposites were fabricated invoking a one-pot in-situ method, employing biochar as the reinforcing material. The primary synthesis of the base poly(ester amide) resin involved a polycondensation process between the prime substrates, viz., glycerol, citric acid, and hexamethylenediamine [18]. Employing a one-pot synthesis technique emphasized efficient time management, minimal chemical usage and simplified procedures for scalable industrial production. Since the resin exhibited a somewhat brittle consistency, PVA and IPDI were introduced to strengthen the overall polymeric matrix via extensive hydrogen bonding interactions as well as polyaddition reactions between the isocyanate and hydroxyl functional groups. The introduction of urethane linkages into the base polymeric resin led to the formation of poly(ester amide urethane) resin. This was followed by the addition of biochar particles into the polymer matrix dispersed in a minimal amount of DMSO solvent. The entire reaction, encompassing all the steps, occurred through uninterrupted mechanical stirring, ensuring the uniform blending of reactants and the biochar particles [20]. Consequently, the polar moieties existing in the poly(ester amide urethane) resin interacted with the polar functional moieties of biochar particles, thus stabilizing the overall composite unit. This uniform distribution of the biochar particles within the poly(ester amide urethane) matrix contributed to the enhancement of various performance characteristics. Both hydrogen bonding and dipole-dipole interactions played crucial roles in facilitating interactions between biochar particles and polymer matrix. The oxygen from the hydroxyl or carbonyl group in biochar’s functional moieties interacted with the hydrogen from the hydroxyl or urethane groups in the polymer matrix, forming extensive hydrogen bonds. This resulted in the enhancement of the adhesion trait between the polymeric matrix and the biochar particles, thereby improving the overall compatibility of the composite unit. Additionally, the biochar possessed polar functional moieties which can further interact with the polar regions of the polymer matrix via dipole-dipole interactions [5]. The negative and positive ends of the polar groups present in the polymer and the biochar aligned perfectly which resulted in the generation of attractive forces of attraction between them. In turn, these interactions contributed to the overall intermolecular interactive forces between the polymer and biochar, thereby influencing the properties of the polymer nanocomposite.
3.4 Characterization of Biochar/Poly(ester amide urethane) Nanocomposite
The nanocomposites produced underwent characterization invoking different spectroscopic as well as microscopic methods which are inclusive of FTIR, PXRD, XPS, and FESEM analyses.
FTIR spectroscopy was assigned to identify the functional groups existing within the resinous polymer nanocomposites, and the findings were subsequently compared with the base polymer matrix. The analysis revealed that all the polymer nanocomposites demonstrated characteristic absorption peaks akin to those observed in poly(ester amide urethane) resin. This observation implied a similar chemical structure between the polymer nanocomposites and the polymer matrix [22]. Overall, the chemical compositions of the polymer nanocomposites deviated from the base polymer matrix solely on the ground of the inclusion of biochar particles into the poly(ester amide urethane) resin.
Although the FTIR spectra of the polymer nanocomposites and their various compositions were found to be similar, some notable changes were observed in the absorption bands corresponding to the hydroxyl groups. Specifically, the absorption bands for hydroxyl groups shifted to lower wavenumbers from 3456 to 3402 cm−1, following the formation of the polymer nanocomposites which could be attributed to the increased number of polar-polar interactions, viz., hydrogen bonding, etc., between the polar functional moieties of biochar and poly(ester amide urethane) resin. Furthermore, peaks observed in the frequency range of 1600–1800 cm−1 and 1200–1300 cm−1 were identified as aromatic carbonyl stretching and C-O stretching of biochar material, respectively. In turn, the study observed that as the loading of the biochar material in the polymer nanocomposites increased, the intensity of the C=O as well as C-O peaks became slightly more pronounced which confirmed the successful incorporation of the reinforcing agent into the polymer nanocomposites. Lastly, IR absorption peaks in the frequency range of 2863–2941 cm−1 were identified as the symmetric as well as asymmetric sp3 C-H stretching of the fabricated polymer nanocomposites [20–22]. The FTIR spectra as illustrated in Fig. 7a displayed all the aforementioned absorption peaks for all the compositions of biochar-integrated poly(ester amide urethane) nanocomposites.
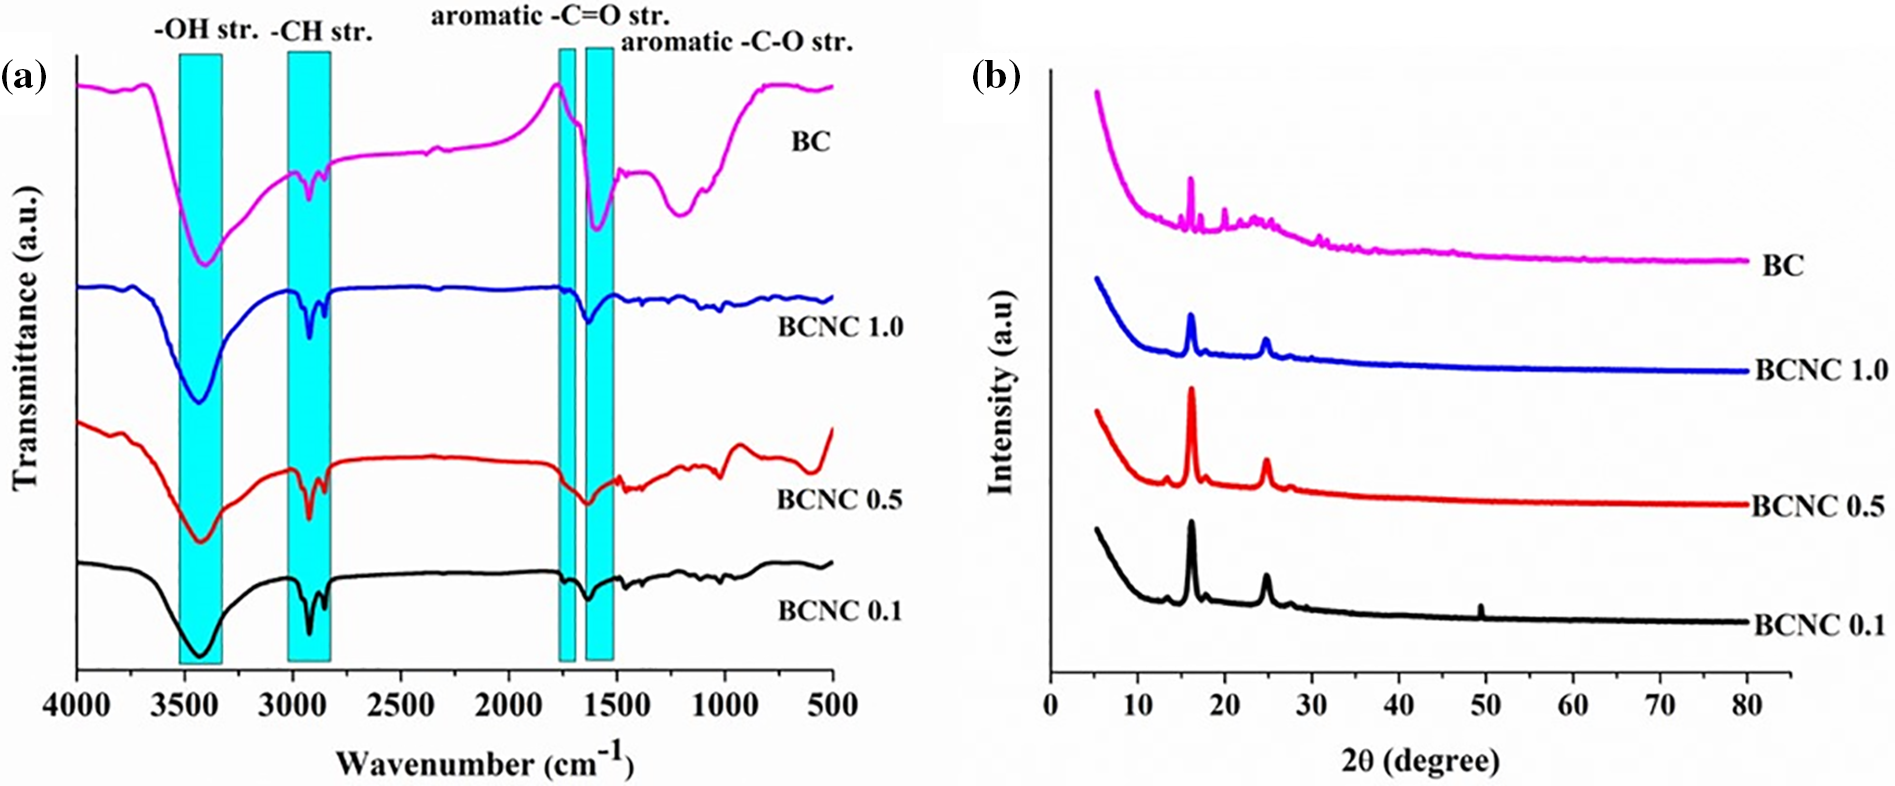
Figure 7: (a) FTIR spectra, and (b) PXRD spectra of biochar integrated poly(ester amide urethane) nanocomposites with different compositions
The PXRD analysis of the synthesized polymer nanocomposites was conducted to assess the various interactions occurring between the poly(ester amide urethane) resin and the biochar particles as shown in Fig. 7b. It was observed that all the studied nanocomposites exhibited XRD peaks within the ambit of 16.34–16.70° and 24.41–25.15°. Moreover, it was closely investigated that the peaks within the range of 24.41–25.15° were absent in the poly(ester amide urethane) resin devoid of any biochar This confirmed the successful incorporation of biochar material into the polymeric matrix as these XRD peaks referred to the disordered graphitic structure of carbon. In turn, the peaks observed within the range of 16.34–16.70° are attributed to the presence of PVA in the polymer matrix. Additionally, the shifts observed in the values of XRD peaks of PVA elucidated the denser crosslinked architecture of the polymer nanocomposites and is indicative of the evolving structural features within the polymer nanocomposites as the content of the biochar material increased in the polymer matrix [40].
This technique aids in furnishing valuable insights into the chemical bonding, elemental surface composition as well as functional groups of the polymer nanocomposites. A detailed examination of the XPS spectra revealed the predominant presence of O, C, and N as the core elements, accompanied by trace amounts of S, P, and Al as shown in Fig. 8a. The atomic fractions of these elements were determined to be 41.62%, 55.88%, 1.07%, 0.61%, 0.19% and 0.64%, respectively. The presence of these trace elements highlighted the successful incorporation of biochar particles into the polymer matrix. To further enhance the understanding, a comprehensive assessment was carried out by examining the high-resolution spectra of C 1s, O 1s, N 1s, S 2p, and P 2p. In this context, the C 1s spectrum underwent deconvolution, which resulted in three prominent peaks situated at 284.78 eV (attributed to C-H, C-C groups), 285.30 eV (associated with C-N, C-O groups), and 287.10 eV (assigned to C=O groups) as depicted in Fig. 8b. All these spectral peaks were evaluated as representative peaks of carbon-containing moieties, viz., glycerol, citric acid, hexamethylenediamine, biochar, etc. Additionally, the O 1s spectrum was deconvoluted into two major peaks categorically assigned to C=O at 532.22 eV and C-O at 531.65 eV. This deconvolution further elucidated the specific oxygen-containing functional groups present in the polymer nanocomposites as highlighted in Fig. 8c. Moreover, the N 1s spectrum underwent deconvolution into two peaks at 397.53 and 400.11 eV which were accredited to N-C and N-H moieties, respectively as illustrated in Fig. 8d. These peaks aid in establishing the existence of IPDI and hexamethylenediamine entities in the composites. Furthermore, S, Al, and P exhibited their corresponding XPS peaks at 168.42, 73.21, and 135.23 eV, respectively. These peaks substantiate the successful fabrication of the polymer nanocomposites integrated with the reinforcing agent, viz., the biochar particles [24].
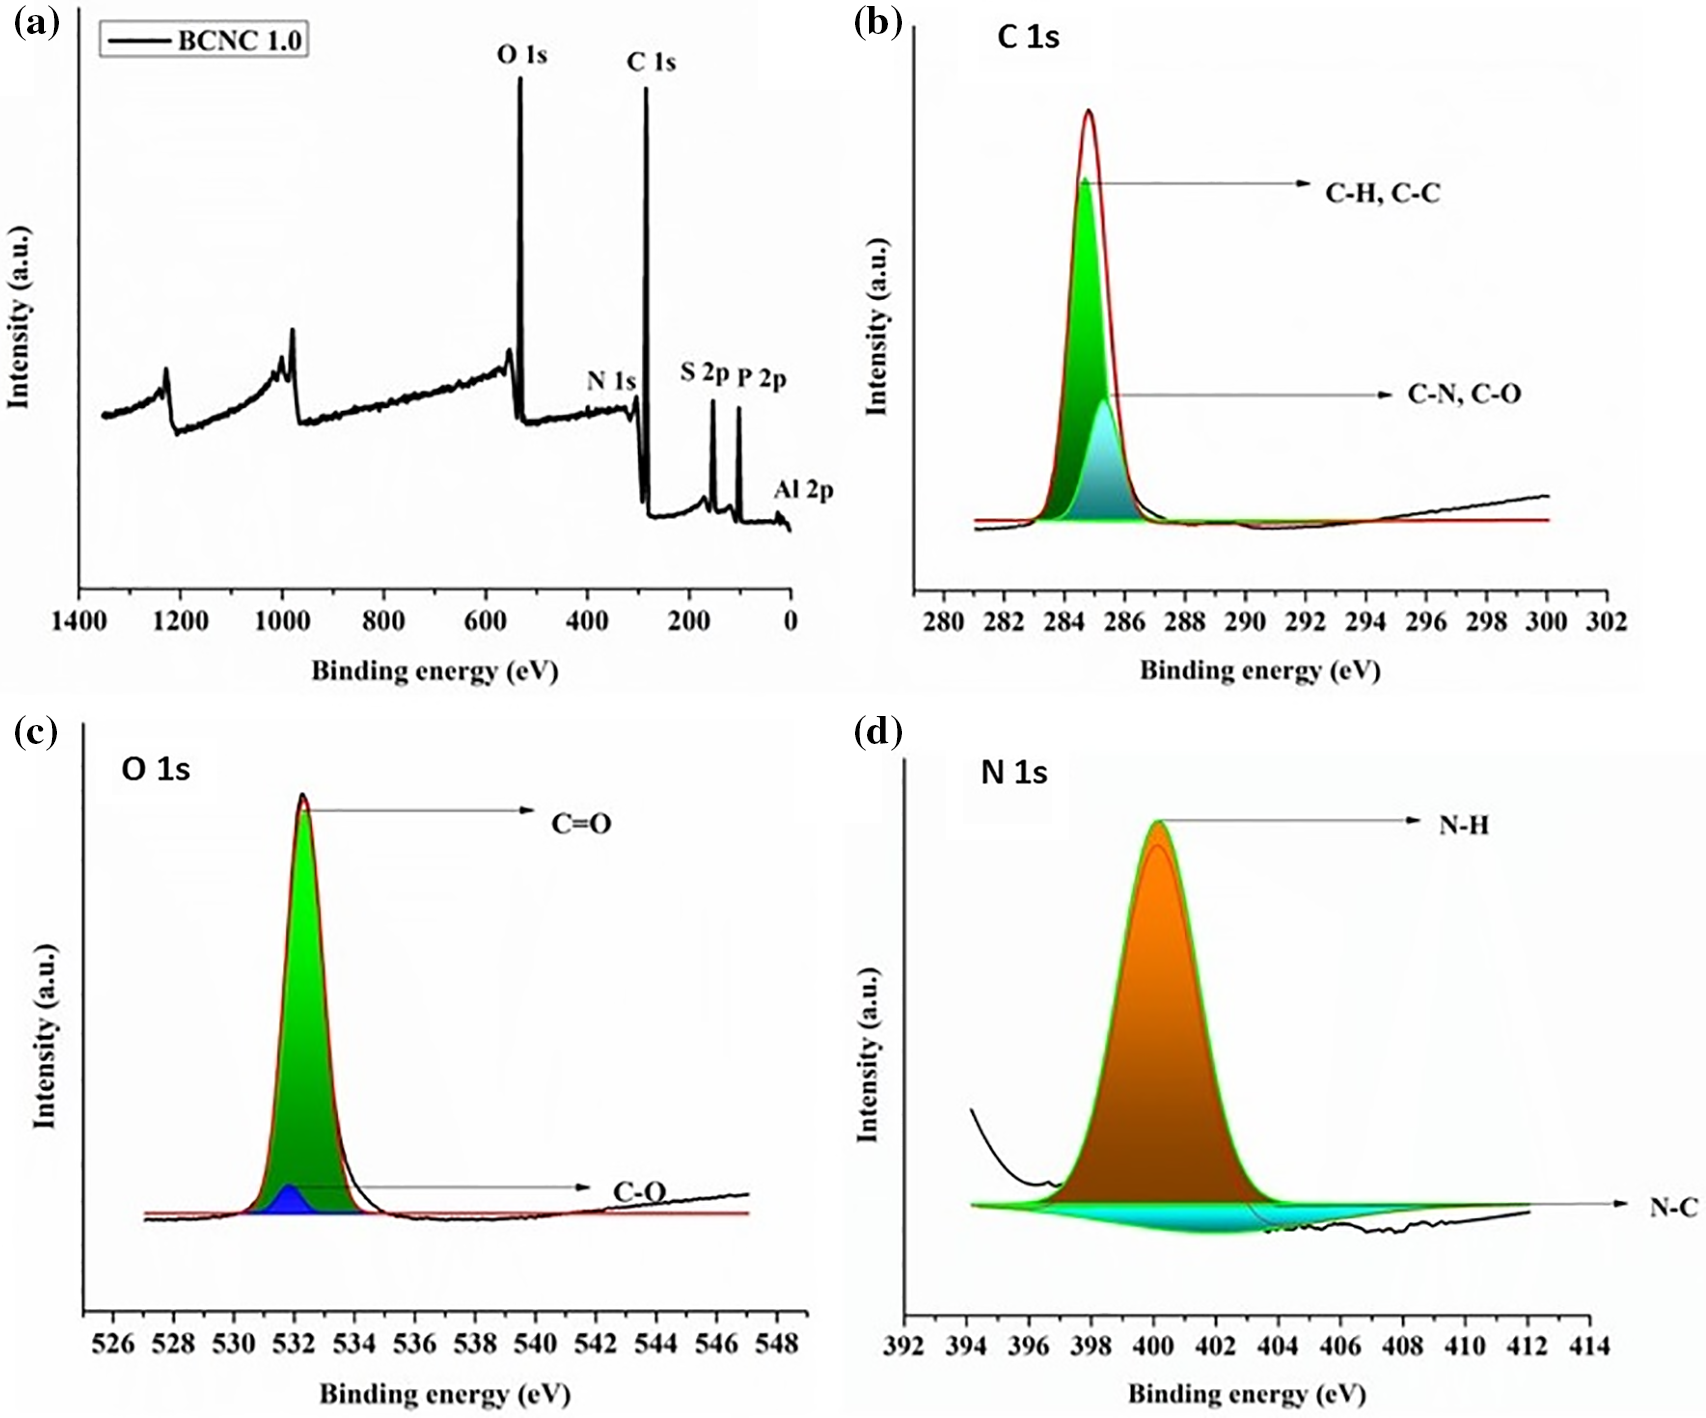
Figure 8: (a) XPS survey spectra, (b) C 1s, (c) O 1s, and (d) N 1s high-resolution spectra for biochar integrated with poly(ester amide urethane) nanocomposites
The microscopic analysis of the synthesized polymer nanocomposites was conducted using the FESEM technique. The FESEM images as depicted in Fig. 9 revealed a comprehensive view of the biochar particles uniformly integrated as well as distributed within the poly(ester amide urethane) matrix. The polymeric surface exhibited a textured appearance due to the presence of the embedded biochar particles (spherical dots), thereby demonstrating an interconnected and well-dispersed network throughout the polymeric material [23]. Thus, the interplay between the polymer matrix and the biochar material is evident; showcasing a cohesive integration which is essential for achieving enhanced properties of the material. Thus, these micrographs enumerated the successful incorporation of these biochar particles within the poly(ester amide urethane) matrix.
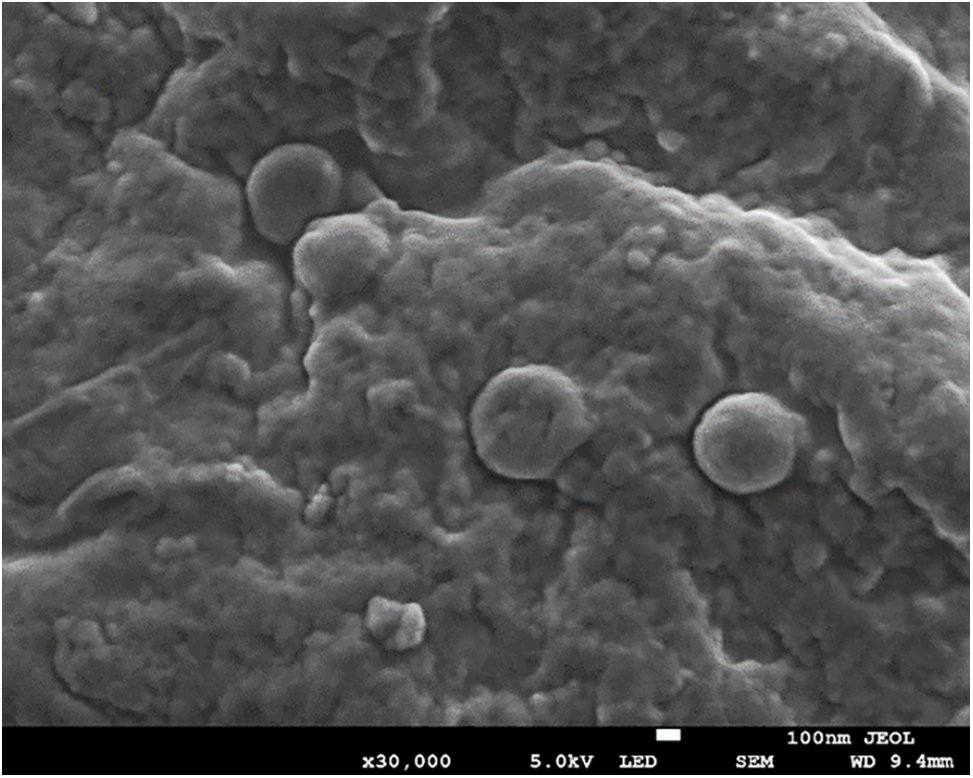
Figure 9: FESEM images of biochar integrated poly(ester amide urethane) nanocomposites
The superior performance of any polymeric material is certainly contingent upon its mechanical properties, as these features not only proclaim durability but also aid in ascertaining their viability for diverse applications. Different polymer nanocomposites enriched with various nano-sized reinforcing agents demonstrate enhanced mechanical scientists for their potential utility as reinforcing agents in polymer matrices. Consequently, this rationale underscores the incorporation of biochar particles derived from kraft lignin into the poly(ester amide urethane) resin. The fabricated poly(ester amide urethane)/biochar nanocomposites exhibited significantly improved mechanical properties as compared to the poly(ester amide urethane) resin, as detailed in Table 4, along with their stress-strain profiles presented in Fig. 10.
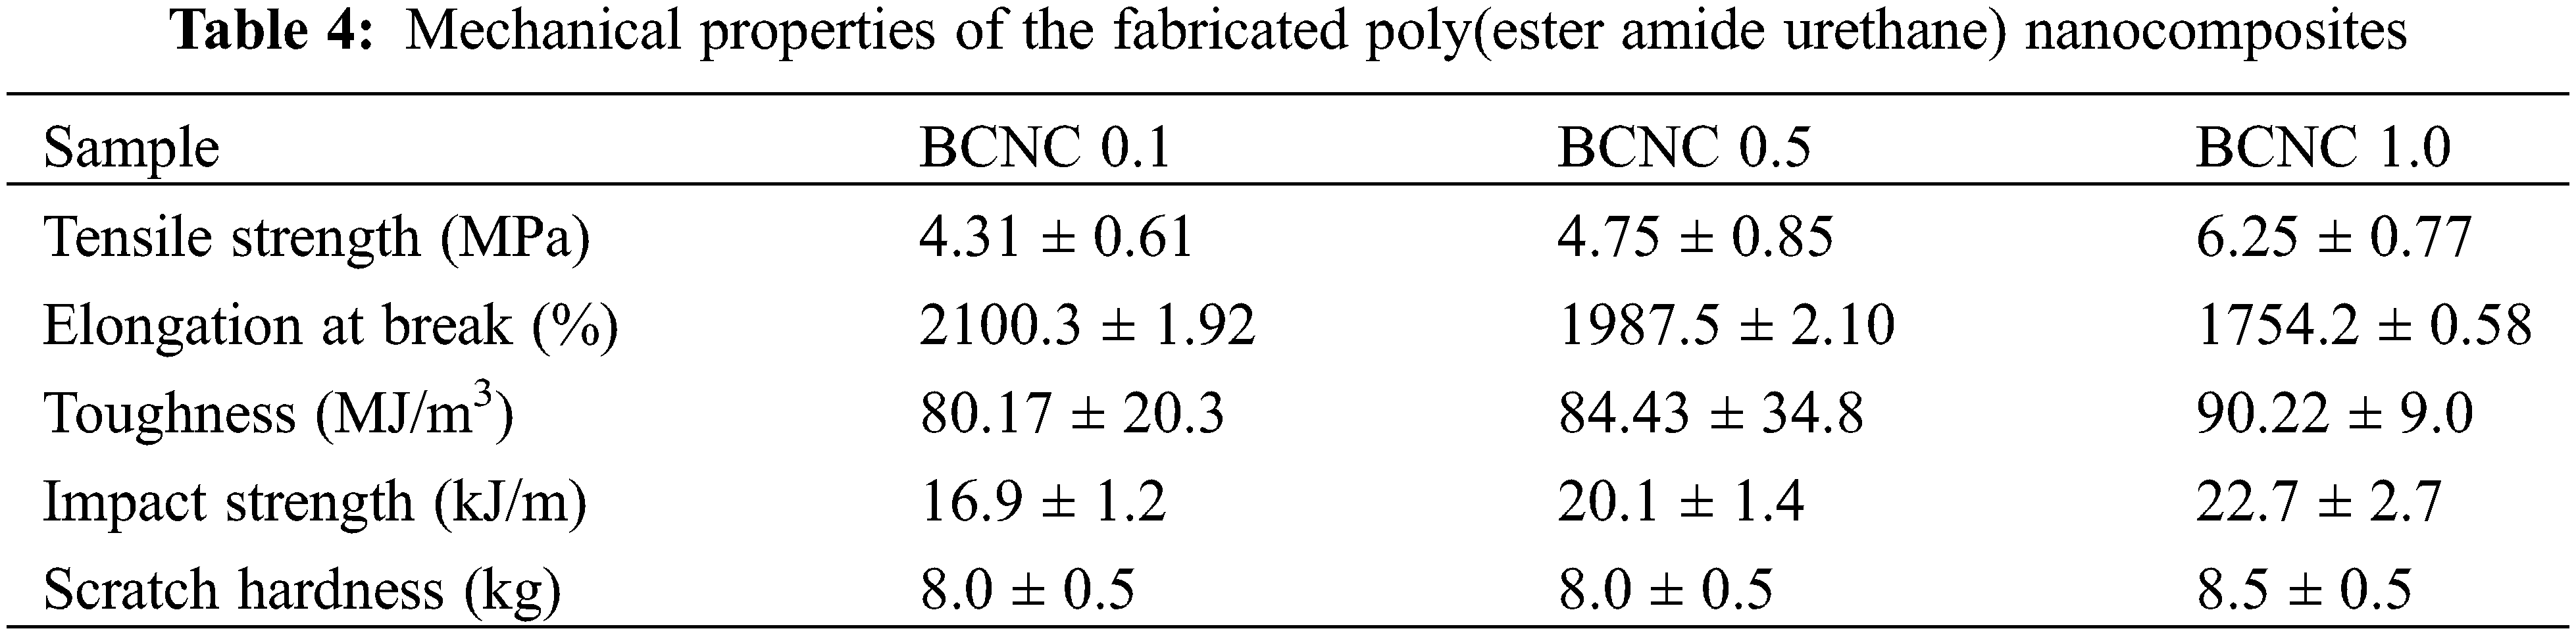
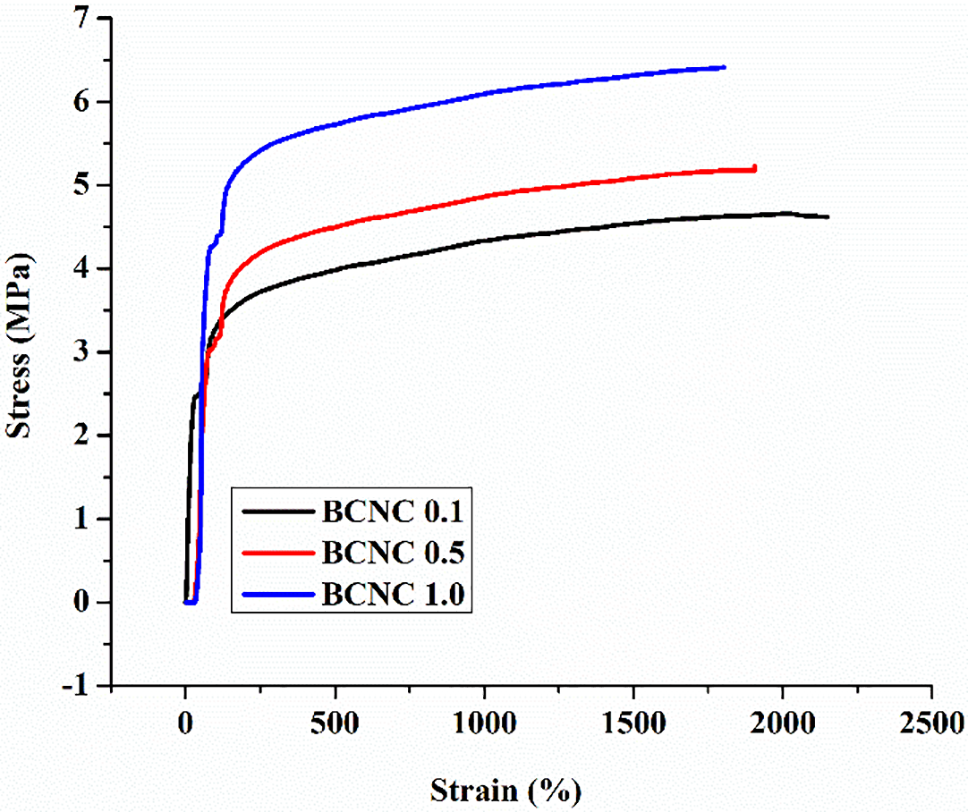
Figure 10: Stress-strain profiles for all compositions of biochar integrated poly(ester amide urethane) nanocomposites
Notably, a noteworthy enhancement in mechanical properties is evident even at low loadings of biochar particles, ranging from 0.5 to 1.0 wt% in the poly(ester amide urethane) resin. Subsequently, a loading-dependent trend was observed, wherein the mechanical properties of the polymer nanocomposites consistently rose with an increased quantity of biochar particles in the polymer matrix [30–33]. The tensile strength and elongation at break values were observed to fall within the range of 4.31–6.25 MPa and 1754.2%–2100.3%, respectively, following the incorporation of the biochar particles. This increment in mechanical variables contributed to an overall toughness enhancement, ranging from 80.17–90.22 MJ/m3, obtained from the area under the respective stress-strain curves. Similarly, the impact resistance of the polymer nanocomposites was found to improve with an increment in the loading amounts of biochar particles. In turn, the scratch hardness parameter for all the compositions of the polymer nanocomposites also increased in its value compared to the core polymer resin; however, all of them exhibited similar values without any stark difference, thereby attaining the maximum limit of the instrument. Consequently, these results lead to the ultimate conclusion that BCNC 1.0 exhibited superior mechanical toughness as compared to BCNC 0.1 and BCNC 0.5.
The increased tensile strength values observed in the polymer nanocomposites can be attributed to the fine surface area of biochar particles as well as their distinctive chemical structure, along with their uniform dispersion within the poly(ester amide urethane) matrix. The substantial surface area of biochar material coupled with the presence of various functional groups on its surface established its efficacy as a potent reinforcing agent. Furthermore, these polar functional moieties within the polymer nanocomposite engage in diverse interactions, viz., hydrogen bonding, dipole-dipole interactions, etc., with the hydroxyl, urethane, and carboxyl entities present in the poly(ester amide urethane) matrix during the in-situ fabrication method. These interactions help enhance the physico-mechanical interlocking mechanism through chain entanglement within the polymer matrix, resulting in the enhancement of rigidity along with a reduction in free volume. Consequently, when any particular force gets applied to the polymer nanocomposites, it gets uniformly distributed across the entire poly(ester amide urethane) matrix and its composite, thereby demonstrating high tensile strength values on the ground of synergistic effect. For instance, Idrees et al. 2018 carried out a study using PET incorporated with 5 wt% biochar particles. The composite material exhibited superior tensile strength in comparison to pure PET material on the ground of effective interfacial bonding between the additive and the polymer matrix [41]. Nevertheless, it was also noted that lower loadings, viz., 1 wt% resulted in higher tensile strength values on account of efficient homogeneous dispersions and reduced agglomeration levels. Similarly, Li et al. in 2018 used biochar as an additive (60 wt%) in conducting the fabrication of a high molecular weight as well as low-density polyethylene composite with manifold increment in tensile strength values [42]. On a similar ground, Nan et al. observed a reduction in the ductility of PVA with the introduction of biochar material [43]. Despite this decrease in the flexibility values, there was a concurrent elevation in the tensile modulus parameter which is indicative of the polymer’s toughness parameter. This enhancement was attributed to the inherent rigidity provided by biochar itself, surpassing that of PVA material.
The assessment of thermal durability holds considerable significance in conducting the evaluation of the degradation characteristics as well as the thermal stability of different polymer nanocomposites for manifold applications in diverse genres. In this context, the thermal stability and the degradation behavior of all formulated polymer nanocomposites were ascertained through TG analysis. In turn, the corresponding TG thermograms, complemented by their derivative curves, viz., dTG for all the compositions of polymer nanocomposites are depicted in Fig. 11a,b, respectively. Additionally, all the pertinent information, viz., char residues, onset temperature, and peak degradation temperatures at 600°C has been systematically compiled in Table 5. The examination revealed that the polymer nanocomposites exhibited stability within the temperature range of 203°C–205°C; thereby surpassing the stability of the poly(ester amide urethane) resin devoid of any biochar particles, which remained stable only up to 170.41°C, denoted as TON temperature [22]. In turn, all the TG thermograms of all compositions of the nanocomposites along with the pristine polymeric resin manifested a two-step degradation pattern akin to that observed in the bare poly(ester amide urethane) resin. This is suggestive of the fact that the incorporation of biochar particles into the poly(ester amide urethane) resin did not exert any discernible influence on the overall structural characteristics of the polymer composites. Nevertheless, there existed some prime variations in the peak degradation temperatures within each degradation step of the polymer nanocomposites.
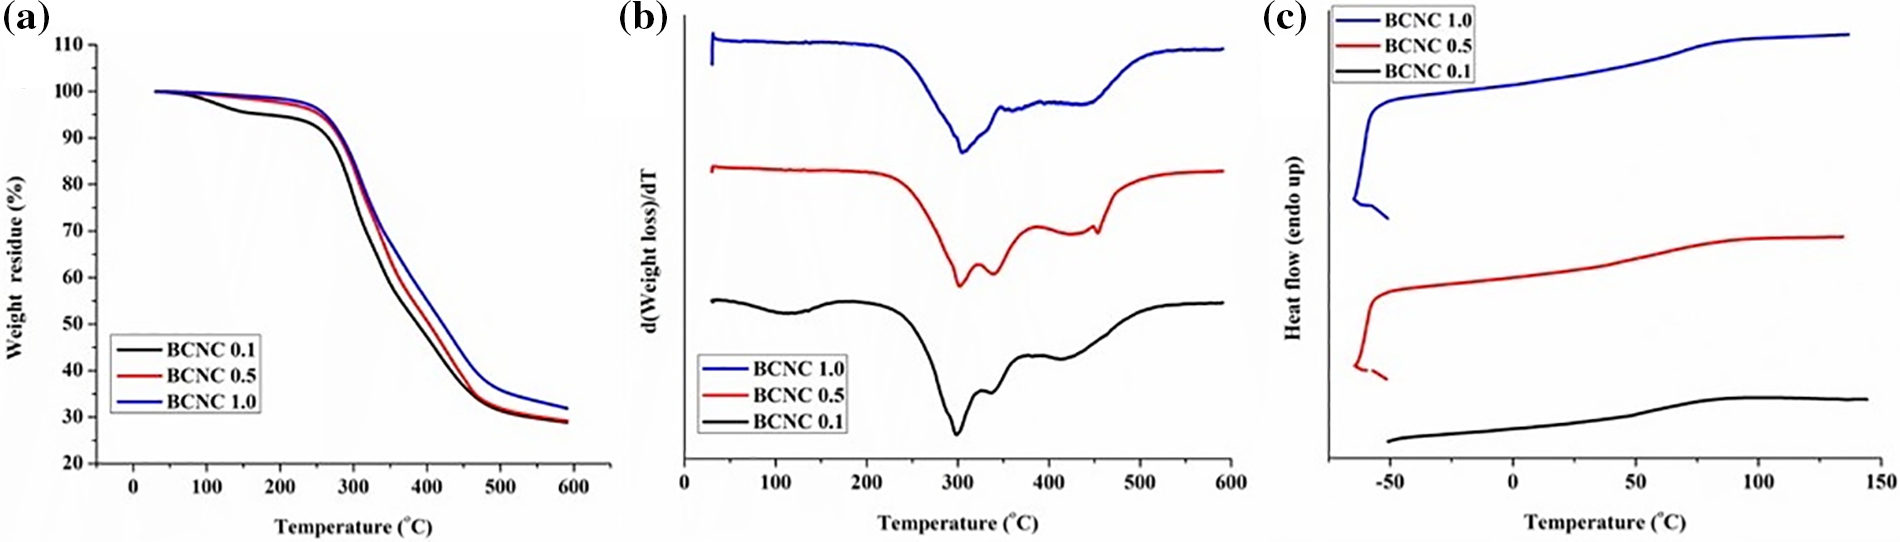
Figure 11: (a) TGA, (b) DTG, and (c) DSC profiles of the nanocomposites with their various compositions
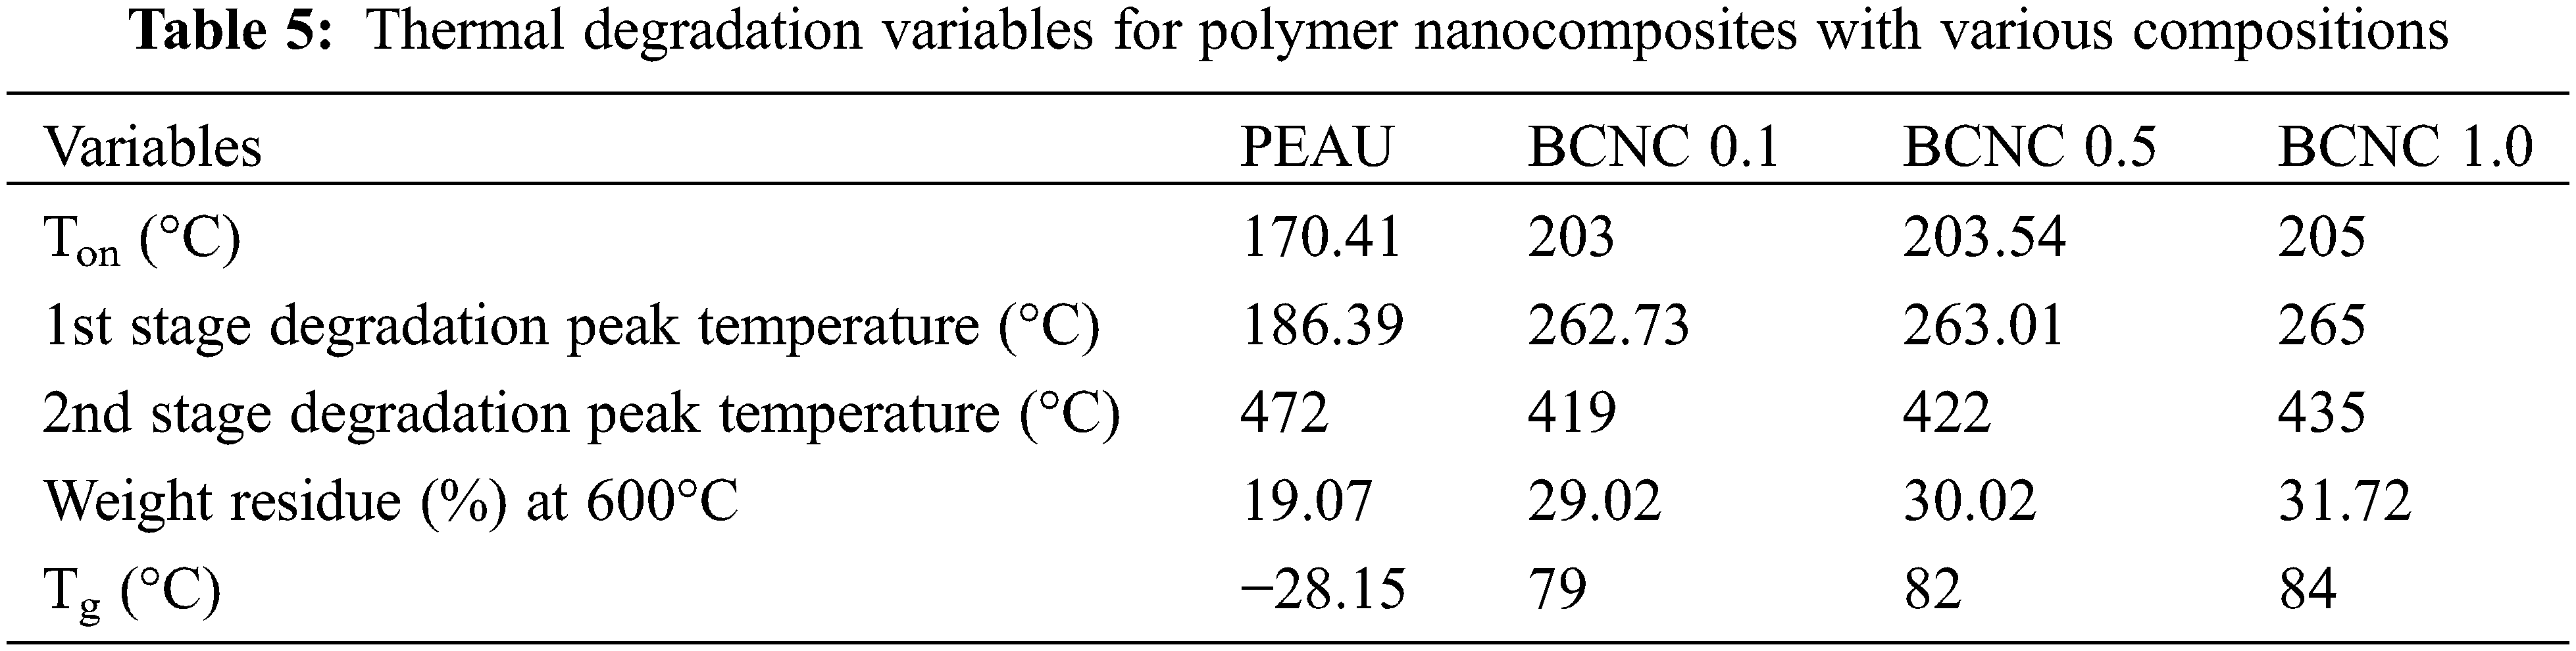
The peak temperature associated with the first step degradation, attributed to the presence of different labile linkages, viz., aliphatic segments, ester moieties, etc., demonstrated a gradual increment from 186.39°C for poly(ester amide urethane) resin to 313°C for BCNC 1.0. This rise in degradation temperature, following the incorporation of the biochar particles into the polymer matrix, was linked to the presence of different polar functional groups on the periphery of the biochar material. These groups contributed to the formation of a greater number of labile linkages during the fabrication procedure. Biochar, inherently endowed with exceptional thermal stability, stands as a testament to its robustness, a fact substantiated by various reports. For instance, Nan et al. in 2016 observed a noteworthy delay in the weight loss as well as thermal degradation temperature of PVA upon incorporation of biochar into the polymer matrix. This delay was attributed significantly to the superior thermal stability existing inherently in the biochar particles [43,44]. In a similar context, the peak temperatures of the second step degradation, associated with the presence of amide, urethane, and aromatic moieties in the polymer matrix, experienced a significant increment from 419°C for BCNC 0.1 to 435°C for BCNC 1.0 on the ground of incorporation of the biochar particles. Furthermore, an increase in the loading amounts of the polymer nanocomposites resulted in higher peak temperatures for both the first and second degradation steps. This observation can be explained on the ground of an increment in the number of polar functional groups. Consequently, it can be affirmed from these observations that the polymer nanocomposites exhibited enhanced thermal stability compared to the bare material, and their thermostability was augmented with the increasing amount of incorporation of biochar into the polymer matrix. This conclusion finds support in the percentage of weight residues of the polymer nanocomposites at 600°C, which measured for poly(ester amide urethane) resin and 29.02%, 30.02%, and 31.72% for BCNC 0.1, BCNC 0.5, and BCNC 1.0, respectively.
The DSC studies were undertaken to determine the Tg value of the polymer nanocomposites, as demonstrated in Fig. 11c, which revealed a temperature range of 79°C–84°C. Notably, the introduction of the biochar particles into the polymer matrix resulted in causing increment of Tg values from 79°C for BCNC 0.1 to 84°C for BCNC 1.0 compared to the pristine poly(ester amide urethane) resin (Tg: −28.15°C). This can be attributed to the rampant increase in cross-linking values on the ground of enhanced intermolecular forces of attraction between the biochar particles and the polymer matrix. Subsequently, it resulted in a decrease in the free volume along with restricted mobility, causing an increase in Tg values [22,23].
An accelerated biodegradation investigation was conducted on the polymer nanocomposites to evaluate their potency as a biodegradable material. The study invoked targeting one bacterial strain, viz., Bacillus subtilis, and this was followed by monitoring the optical values in the presence of these composites over time as explained explicitly in the experimental section of the biodegradation study. Notably, all the compositions of the polymer nanocomposites exhibited higher absorbance values as enumerated in Fig. 12a. Furthermore, a discernible trend was noted down wherein the optical values gradually escalated with an augmentation in the biochar loadings, thereby indicating increased biodegradability levels linked to an increase in the abundance of biochar particles. The inclusion of biochar particles, endowed with various polar functional groups, facilitated interactions with different polar moieties of the polymer matrix, resulting in the formation of labile linkages, viz., hydrogen bonding as well as ester linkages. Consequently, these supplementary linkages in the nanocomposites underwent hydrolysis by the bacterial strain, inducing extensive surface erosion and thereby enhancing the rate of biodegradation compared to the bare polymer resin. Moreover, the introduction of different compositions of biochar/poly(ester amide urethane) nanocomposites into the culture media triggered significant bacterial proliferation, causing the breakdown of urethane and ester bonds into smaller fragments. Subsequently, these fragmented molecules dispersed into the surrounding basal media, promoting solubilization and the formation of smaller units such as water, carbon dioxide, and others [18]. The weight loss profiles as depicted in Fig. 12b illustrated the fact that the augmentation in biochar loadings corresponded to an increment in the number of hydrolyzable linkages within the polymer nanocomposites, leading to a proportional acceleration in the degradation rate as well as extensive weight loss. The SEM images as shown in Fig. 12c,d further highlighted the extent of bacterial growth (Bacillus subtilis) on the various compositions of polymer nanocomposites and were subsequently compared with the control sample (devoid of any bacterial strain).
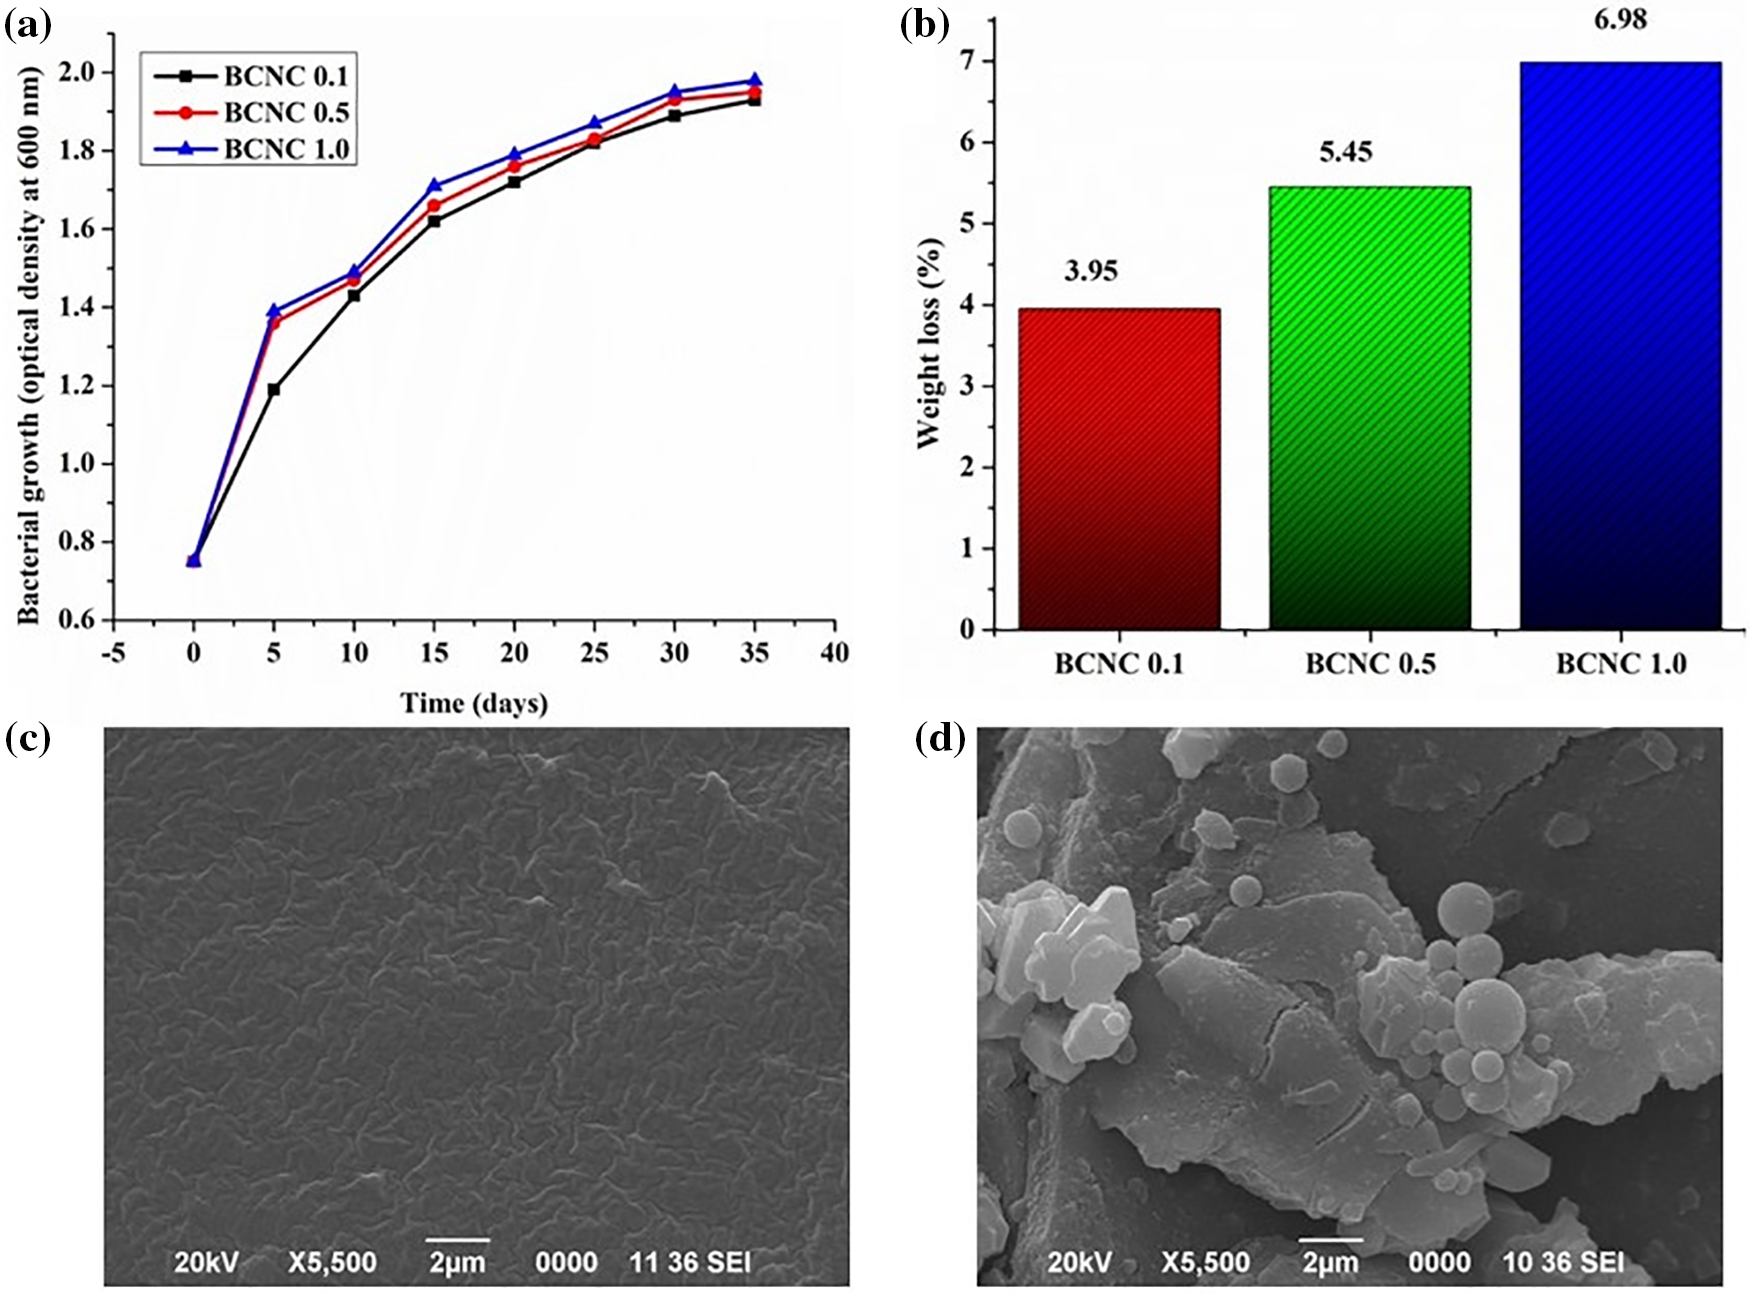
Figure 12: (a) Bacterial growth curves presented in terms of optical density as a function of time, (b) weight loss (%) of polymer nanocomposites after exposure to bacterial degradation, SEM images of BCNC 1.0, (c) control specimen, and (d) biodegraded by bacterial strain, Bacillus subtilis
To assess the efficacy of the fabricated polymer nanocomposites as adsorbents, dye adsorption evaluation was conducted. The biochar material obtained from kraft lignin exhibited the capability to interact with both the cationic as well as anionic groups of dye entities via electrostatic forces of interaction. Specifically, the anionic dye, tartrazine (TZ), and the cationic dye, malachite green (MG) were selected for undergoing this investigation. Among all the compositions of poly(ester amide urethane) nanocomposites, BCNC 1.0 was employed as the representative polymer nanocomposite for all the adsorption assessments. It is well-acknowledged that the removal efficiency is contingent upon various factors for all soluble dyes which are inclusive of pH, initial concentration of dye molecules, adsorption time, etc. A comprehensive exploration of the impact of these factors on the adsorption of dyes was conducted to derive the optimal adsorption outcomes.
3.8.1 Effect of Adsorbent Dose
The impact of adsorbent dosages on the removal efficiency (%) as well as on the adsorption amount of MG and TZ is depicted clearly in Fig. 12a,b. As observed, the adsorption (%) or removal efficiency increased proportionally with the elevated adsorbent dose, thereby reaching a peak of 99.26% and 87.25%, with a 40 mg dosage for MG and 88.73% and 73.98%, with a 40 mg adsorbent dosage for TZ, for biochar and polymer nanocomposites, respectively. This enhancement in adsorption (%) is ascribed to the amplified presence of polar functional groups on the biochar material, thereby augmenting the availability of active adsorbent sites with an increment in the adsorbent dosages. Fig. 13a,b also illustrates the influence of adsorbent dosages on the adsorbent amount or adsorption capacity (qe). It was noted that despite an increase in the adsorption (%) from 95.32% to 99.26% and 72.27% to 87.25% for MG, as well as 74.76% to 88.73% and 58.45% to 73.98% for TZ (for both biochar and polymer nanocomposites), the qe parameter showed a declining trend.
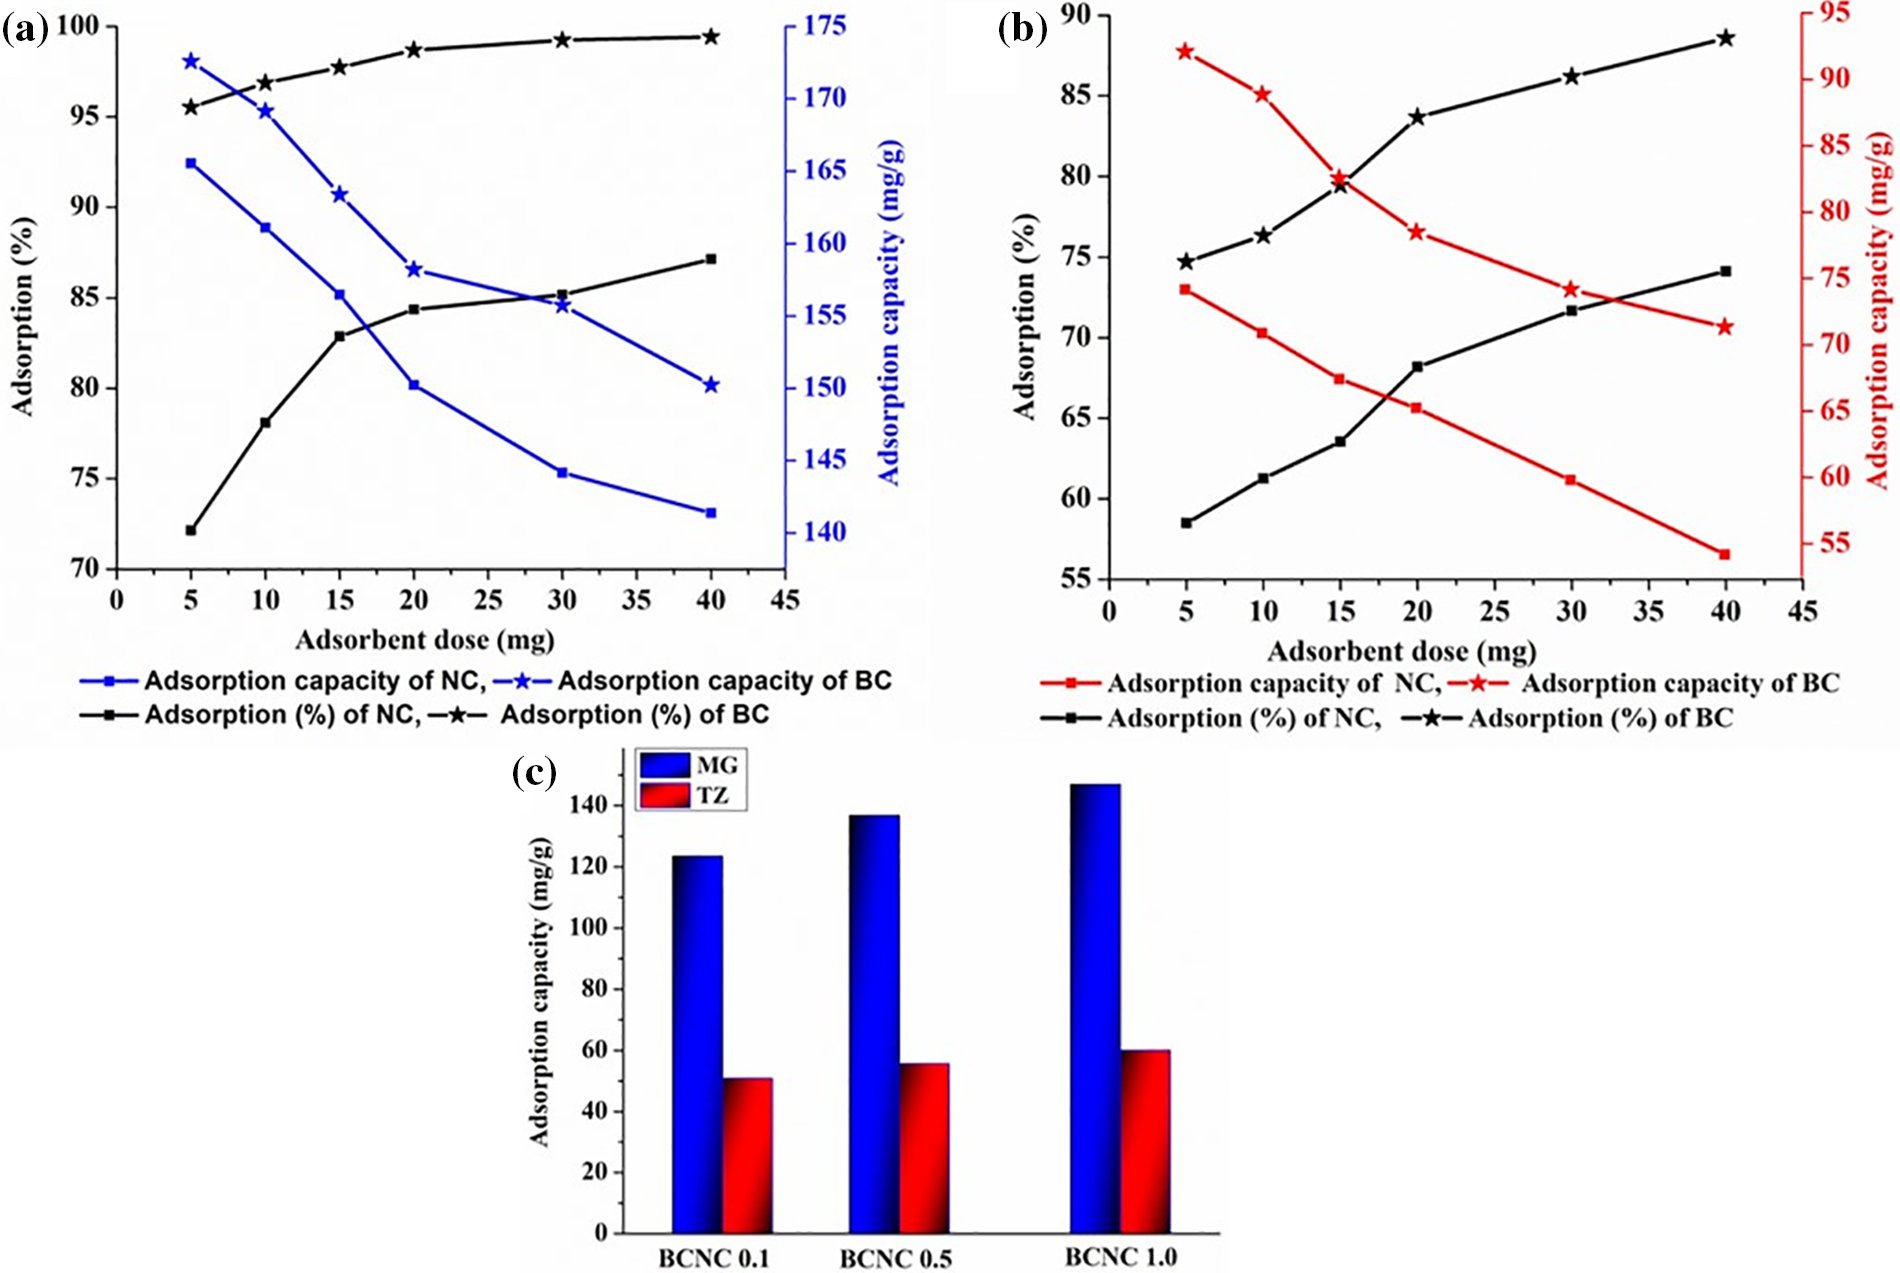
Figure 13: Effect of adsorbent dose on adsorption capacity (mg/g) and adsorption (%) of (a) MG dye, (b) TZ dye, and (c) adsorption capacity of various compositions of polymer nanocomposites for both MG and TZ dyes
Consequently, considering both the parameters, viz., qe variable and removal efficiency, the optimized dosages for both MG and TZ dyes were ascertained to be 40 mg, respectively. Furthermore, with these optimized adsorbent dosages, the adsorption capacity of the poly(ester amide urethane) nanocomposites for all three compositions, for both the dyes were assessed as enumerated in Fig. 13c. As anticipated, the dye adsorption capacity for MG increased with an elevated proportion of biochar particles in the polymer matrix, owing to the augmented negative charge in the polymer matrix. Consequently, BCNC 1.0 exhibited the highest adsorption capability for MG, i.e., 142.12 mg/g, wherein adsorption declined gradually for BCNC 0.1 as well as BCNC 0.5. Likewise, BCNC 1.0 demonstrated the highest adsorption capacity for TZ, i.e., 56.51 mg/g; however, the values are lower on the ground of TZ being an anionic dye. These results strongly corroborated the findings reported earlier [44,45].
3.8.2 Effect of Preliminary Dye Concentration
The impact of varying initial concentrations of dye, ranging from 10 to 80 ppm, on the polymer nanocomposite’s adsorption performance was thoroughly examined while maintaining the optimized adsorbent amount. As illustrated in Fig. 14a,b, it is quite evident that an escalation in dye concentration led to an increment in the adsorption amount. However, a corresponding reduction in adsorption efficiency was noted down, decreasing from 88.62% to 85.04% for MG and from 73.58% to 72.30% for TZ as illustrated in Fig. 14a,b. This phenomenon can be rationalized by acknowledging the fact that at a lower concentration of dye of 10 ppm, an abundance of active adsorption sites contributed to the overall greater percentage of adsorption [46]. Conversely, as the dye concentration increased, the availability of active adsorption sites on the surface of the polymer nanocomposites diminished. Consequently, a lower percentage of adsorption was noted at higher concentrations of dye.
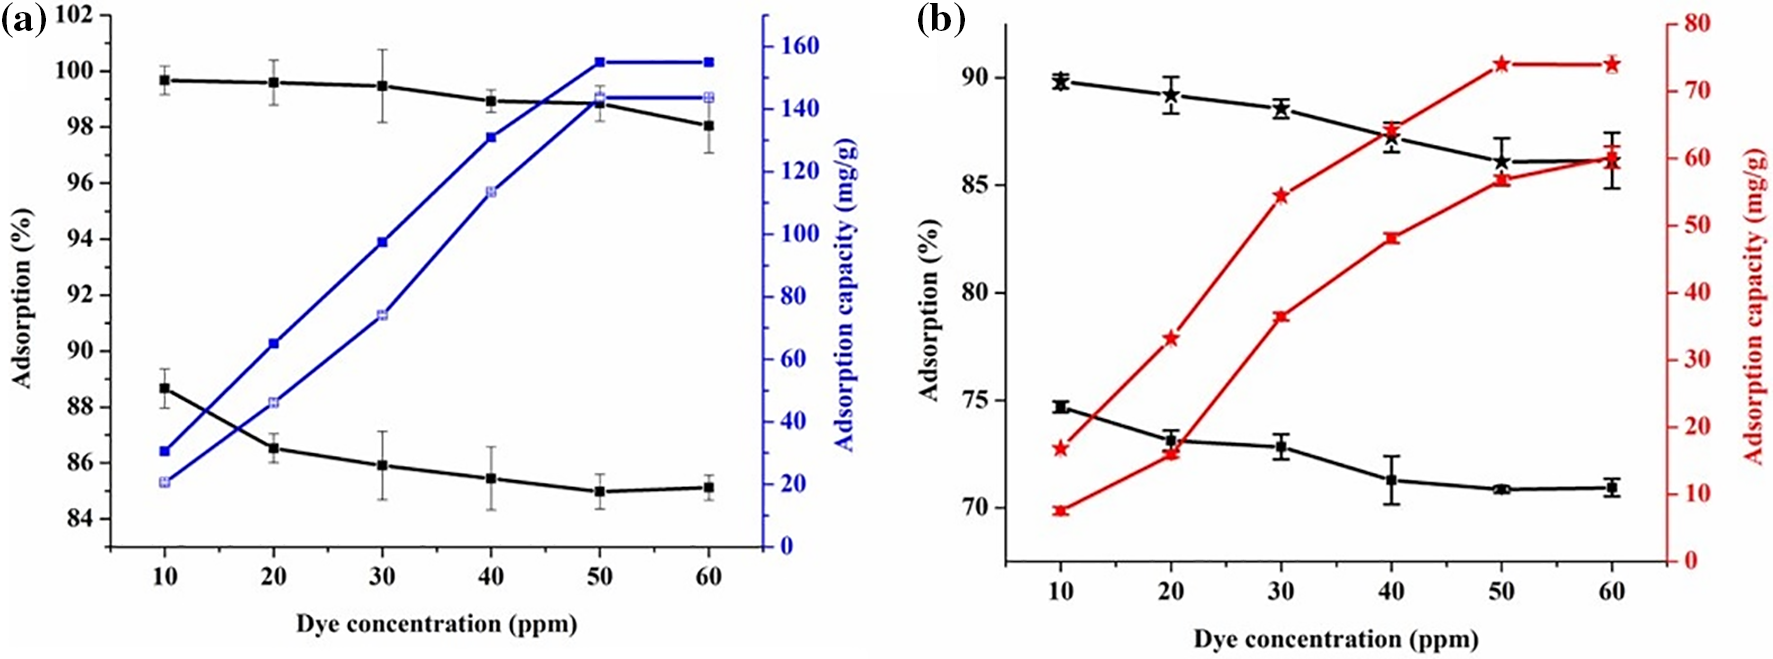
Figure 14: Effect of dye concentration on adsorption capacity (mg/g) and adsorption (%) for (a) MG dye, and (b) TZ dye
Fig. 15a,b illustrates the temporal influence on the removal efficiency of dye for polymer nanocomposites. The equilibrium time for adsorption was ascertained to be minutes for both MG and TZ. Beyond these specific durations, dye adsorption reached a plateau, indicating the attainment of equilibrium. Notably, the rate of adsorption is more pronounced in the preliminary stages compared to the period leading up to the equilibrium. This observation suggested that at an initial time, there might be electrostatic forces of interactions between the charged active sites of the polymer nanocomposites as well as the biochar particles. Following these interactions, mass transfer of dye molecules was observed involving both hydrogen bonding as well as other dipole-dipole interactions. All these results conformed with other studies reported earlier [45,46].
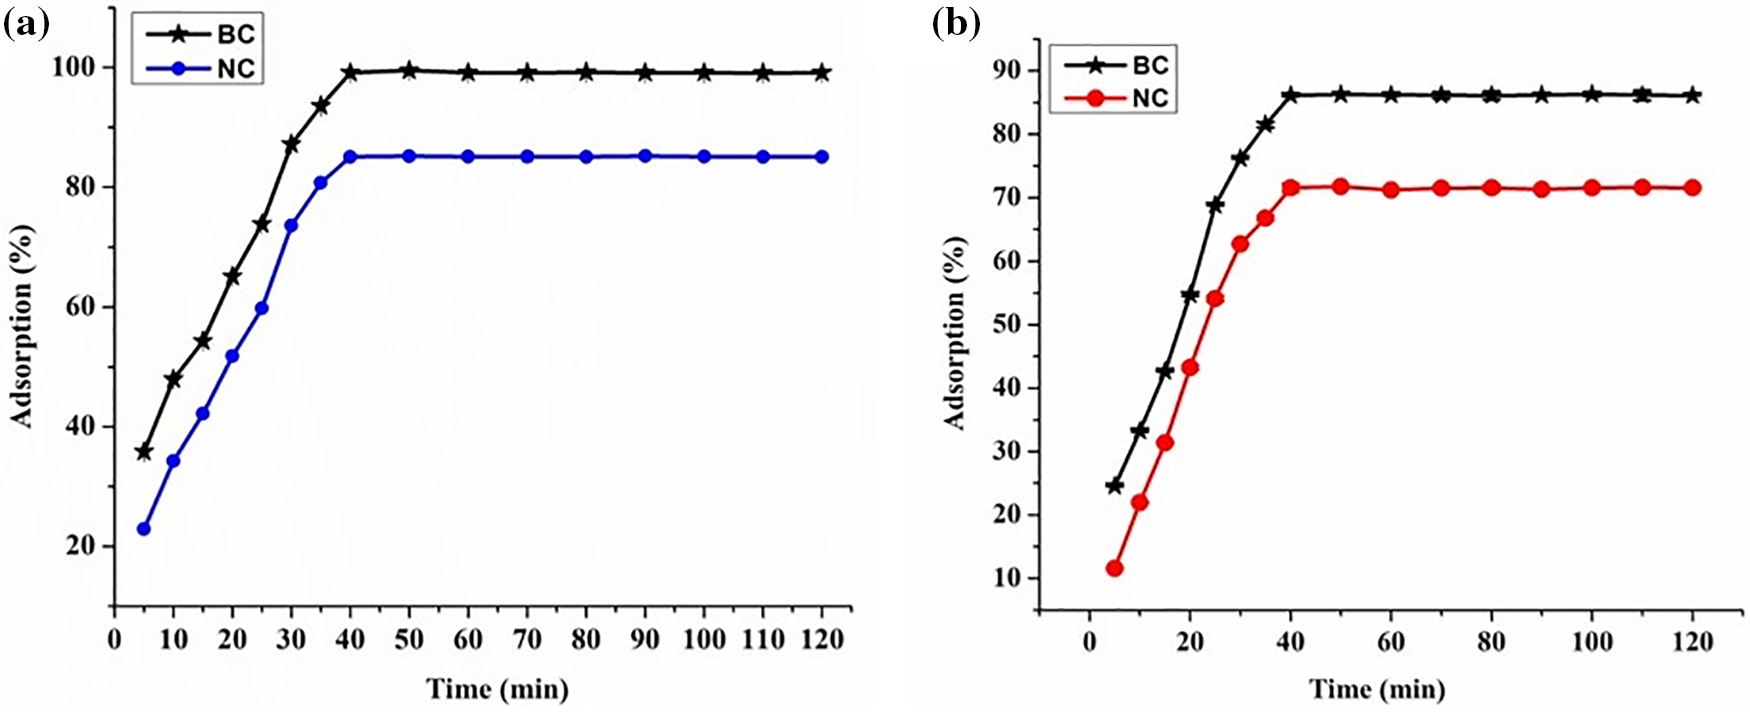
Figure 15: Effect of contact time on adsorption (%) for (a) MG dye, and (b) TZ dye
To investigate the pH sensitivity of poly(ester amide urethane) nanocomposites, the study was carried out under various pH conditions varying from 2 to 12 in the dye mixture. Fig. 16a illustrates the dye removal capacity of the polymer nanocomposites at various pH levels for MG dye. The graph enumerated that the optimal removal capacity of dyes occurred within the pH range of 4 to 8. Specifically, at pH 2, the adsorption (%) was found to be 68.41%, which gradually escalated to 84.72% at pH 6. However, under basic pH conditions, viz., pH 10 and 12, the dye removal efficiency dropped significantly to 59% and 51.09%, respectively. This phenomenon can be explained by the fact that under acidic conditions (lower pH), the biochar develops a positive charge on its periphery on the ground of the presence of some H3O+ ions, which significantly causes a drop in the removal efficiency of dye moieties. Since MG is a cationic dye, there exists a strong repulsive force between the dye molecules and the adsorbent surface. In turn, a strong competition arises between the H3O+ ions and the dye molecules. Furthermore, with the increment in the pH values, the hydroxyl as well as carboxyl functional groups present on the adsorbent surface create a negative atmosphere, thereby facilitating the attraction of cationic dye entities. In turn, it was noted that at higher alkaline pH conditions, the removal efficiency of dyes was found to be low, which aligned with similar studies reported by other researchers. The increment in pH conditions resulted in the reduction of the ionization potential of the functional groups, subsequently causing a reduction in the removal efficiency of dyes [47].
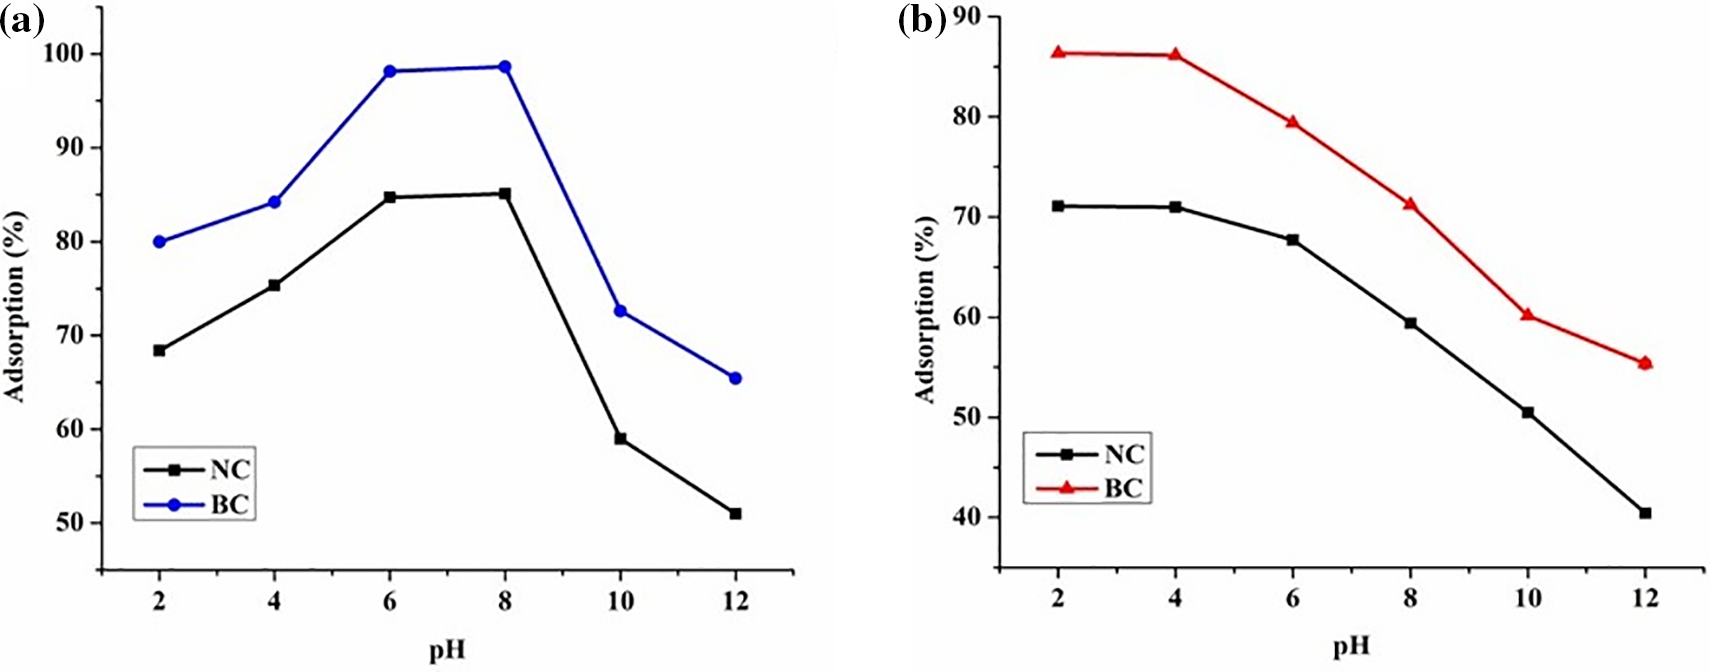
Figure 16: Effect of pH on adsorption (%) for (a) MG dye, and (b) TZ dye
On the contrary, for TZ dye, the trend for dye removal efficiency vs. pH was observed to be the opposite. As depicted in Fig. 16b, it was evident that with the increment in pH values, there was a reduction in the adsorption (%) of TZ dyes from 71.09% at pH 2% to 39.62% at pH 12. The reason behind this can be explained on the ground that, at low pH values, the amine groups of the polymer nanocomposites get protonated to NH2+, which facilitates the attraction of TZ dye molecules, which are anionic [48]. Additionally, the increment in pH values results in the deprotonation of these amino groups, resulting in the generation of intense repulsive forces, thereby causing a reduction in the dye removal efficiency.
The effect of pH on dye adsorption can also be illustrated in terms of the pzc (Point of Zero Charge) values. The pzc values represent the pH at which biochar material’s surface charge is neutral. The pzc value was found to be 6 for the biochar material. It was observed that at pH values below the pzc, i.e., 6, the biochar surface tends to be positively charged, favoring the adsorption of TZ dyes (anionic dye) through electrostatic interactions. Conversely, at pH values above the pzc, i.e., 6, the biochar surface becomes negatively charged, facilitating the adsorption of MG dyes (cationic dye) [47].
It was observed that throughout the adsorption process, molecules of the adsorbate migrate from the solution to the outer surface of the adsorbent molecules, followed by diffusion into the outline of the boundary, and ultimately, complete mass transfer occurs by internal pore diffusion process [45]. Furthermore, to elucidate the adsorption mechanism, exploration of the PFO model, PSO model, and IPD model were carried out extensively. The linear versions of these models are highlighted by Eqs. (3)–(5), respectively.
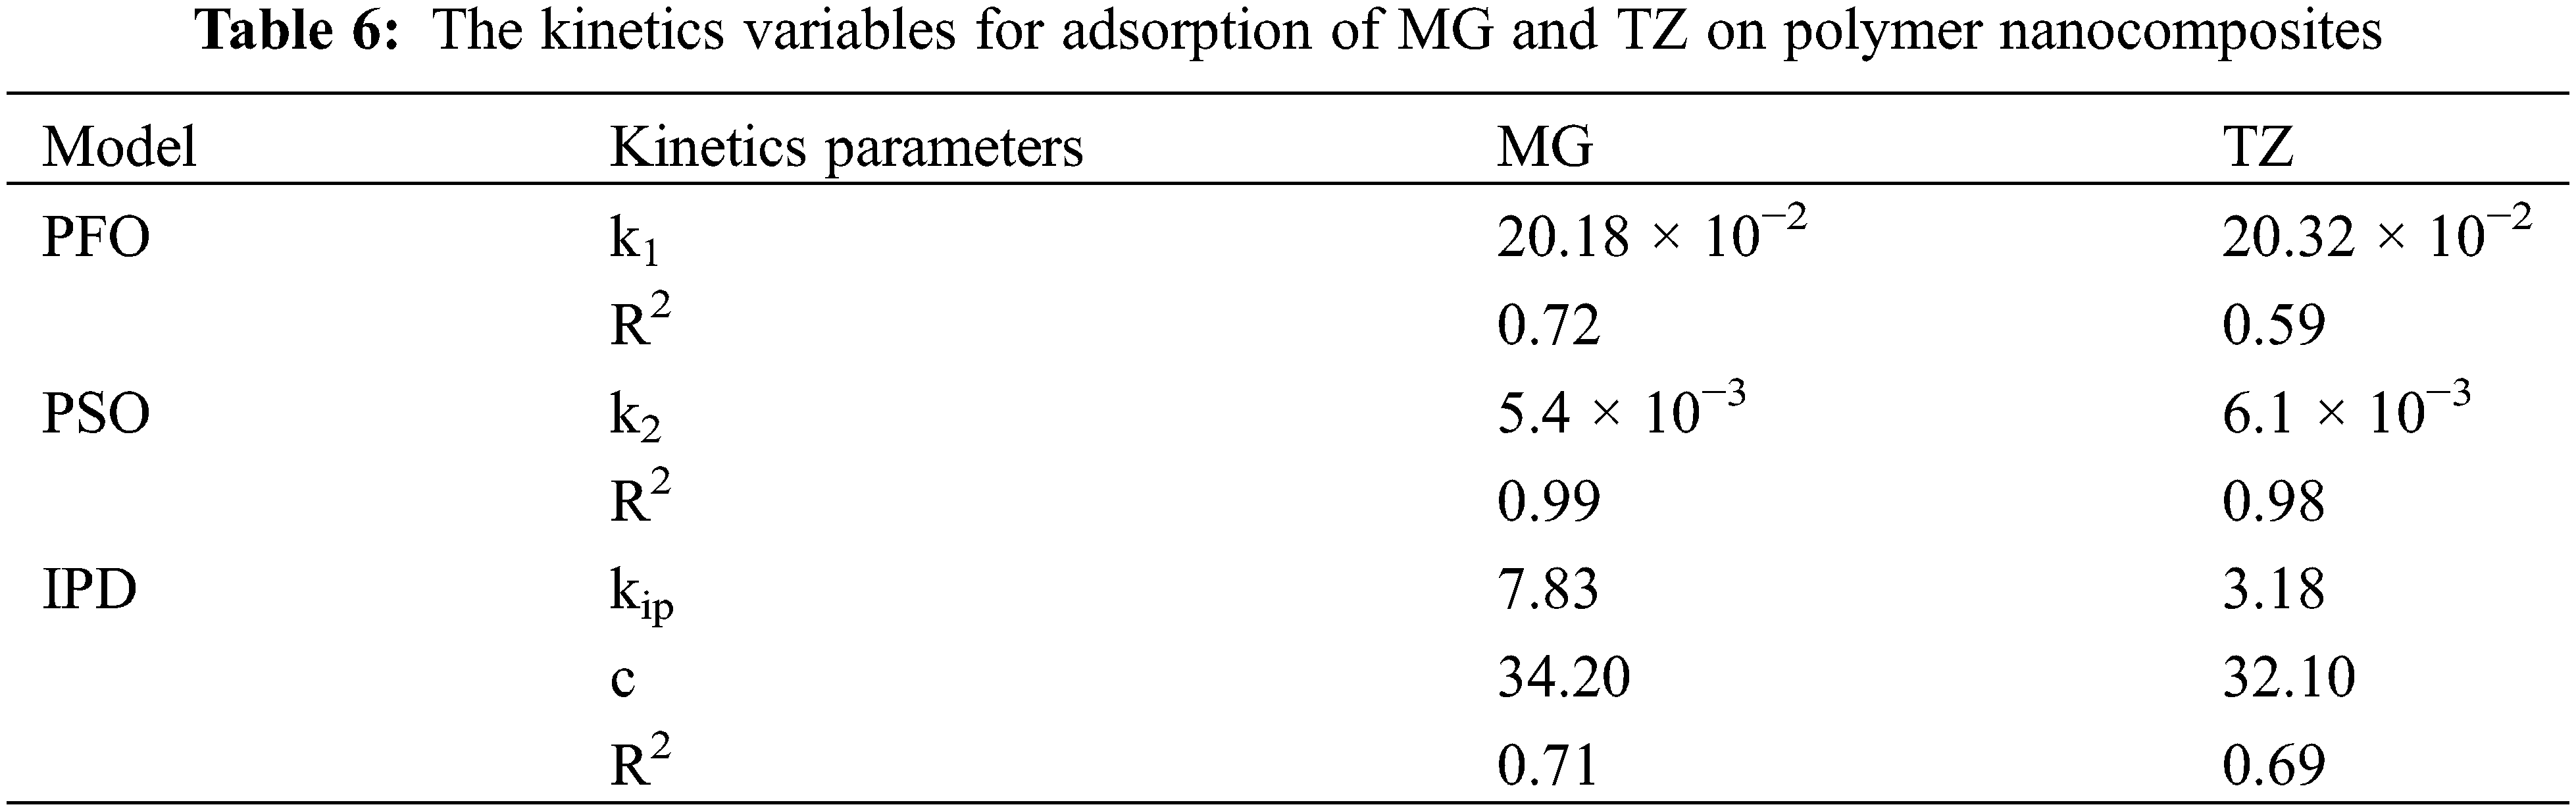
Under this context, Fig. 17 depicts the linear plots illustrating log(qe–qt) against t, (t/qt) against t for the PFO and PSO models, respectively, and qt against t1/2 for the IPD model. The proximity of the linear correlation coefficient, viz., R2 to unity strongly aligns with the goodness of the fit. In this milieu, PSO models corresponded to 0.9916 and 0.9849 for MG and TZ dyes, respectively. Contrastingly, in the case of PFO, the linear correlation coefficients for MG and TZ were found to be 0.7270 and 0.5918, respectively. The correlation coefficient values indicated that the PSO is more reliable, suggestive of the fact that the chemisorption process occurs via ionic interactions between the adsorbent and adsorbate, with this step being the rate-determining step. The outcomes derived from various kinetic models are summarized in Table 6. In addition, the kinetics data were subjected to various analyses using the IPD model. As per the criteria of this model, a larger intercept, i.e., c signifies a greater boundary layer or thickness. Additionally, in the case where this process is involved in the adsorption mechanism, the plot of qt against t1/2 should exhibit a linear relationship. If this adsorption process plays a significant role in the rate ascertaining step, then the plot should pass through the origin. However, the presence of the multilinear plots indicates that more than one process operates simultaneously during the adsorption process [45–47].
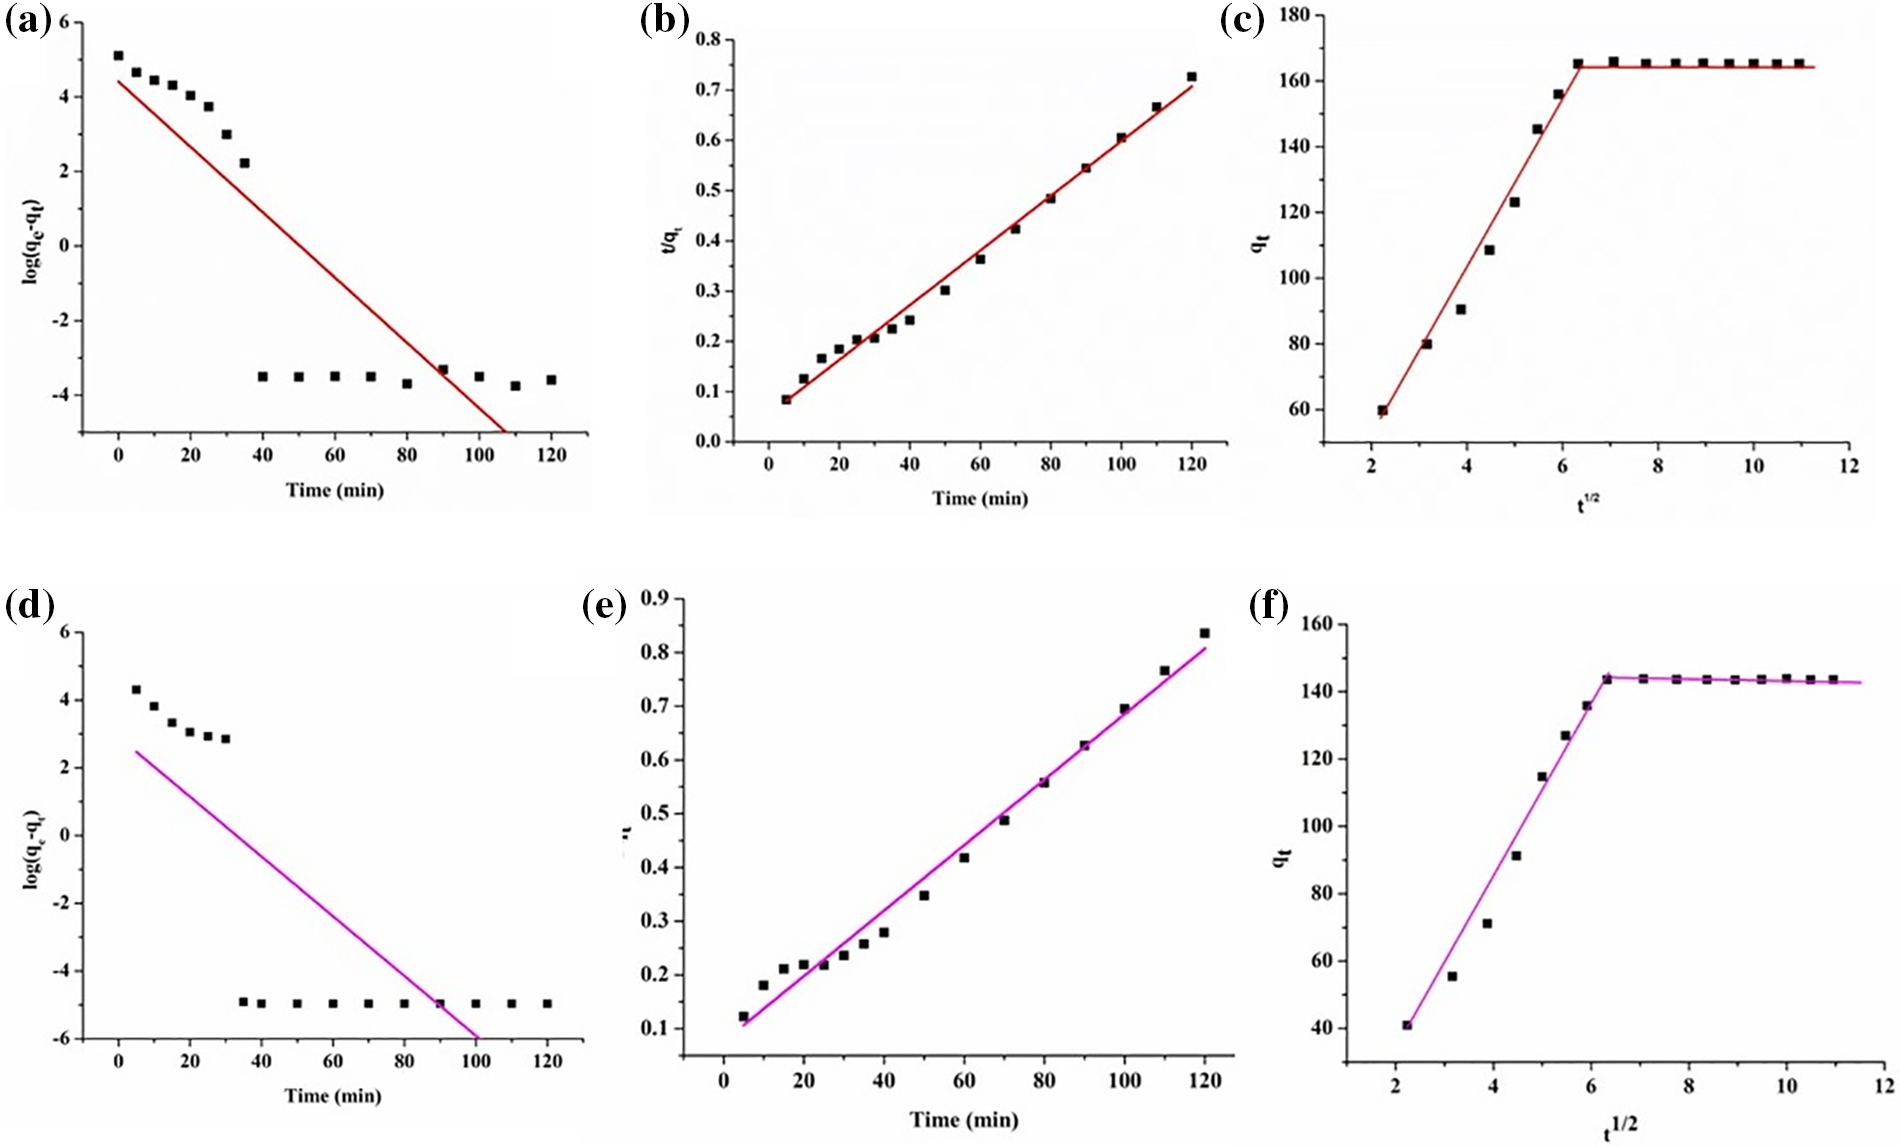
Figure 17: (a) PFO kinetics model, (b) PSO kinetics model, (c) IPD model for MG dye, (d) PFO kinetics model, (e) PSO kinetics model, and (f) IPD model for TZ dye
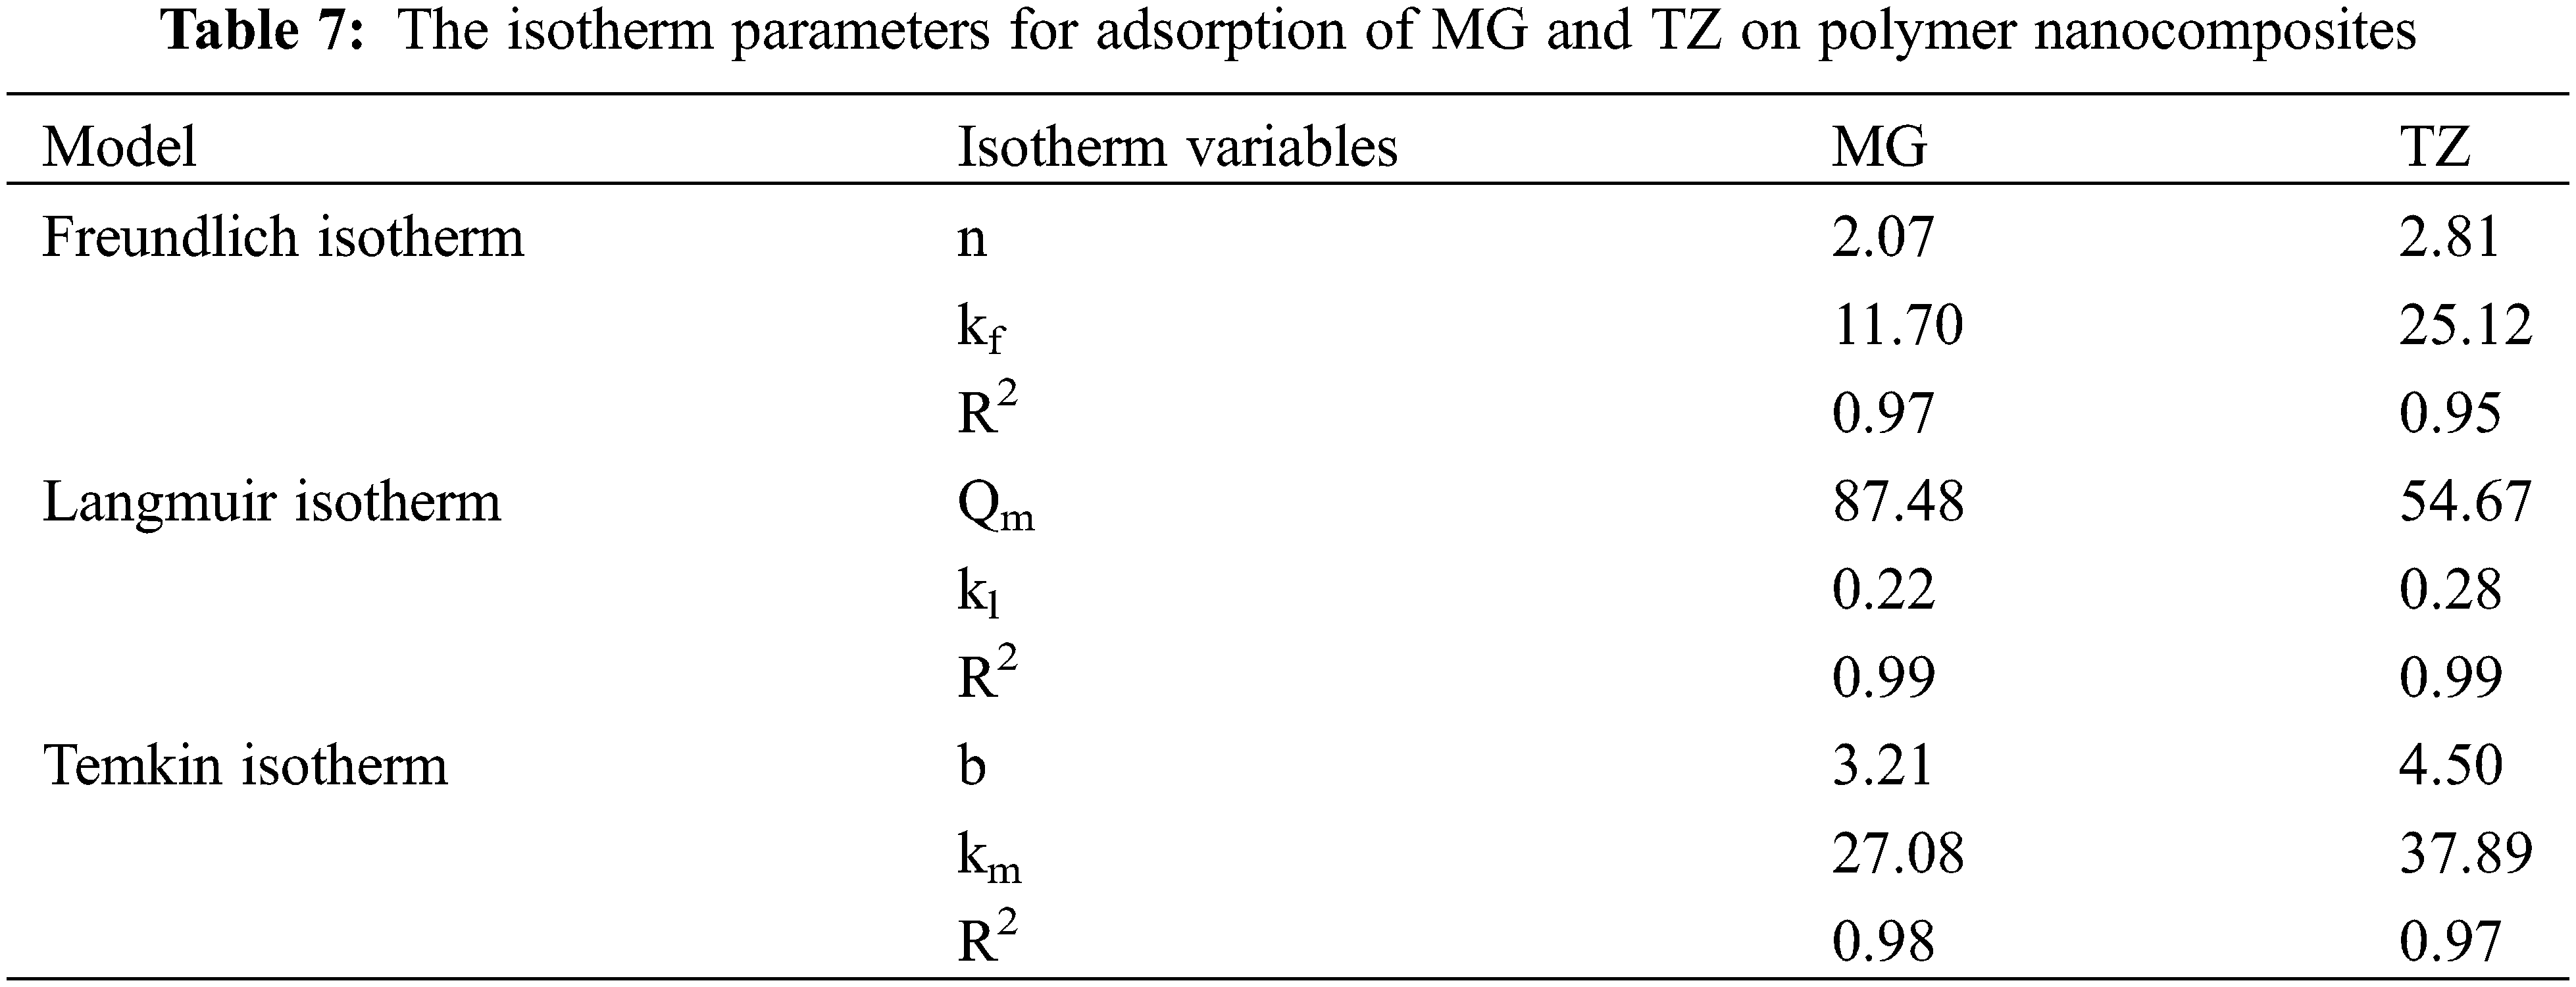
The adsorption isotherm elucidates the interactions existing between the adsorbate as well as the adsorbent molecules. The adsorption mechanism of dyes is assessed using the Langmuir, Freundlich, and Temkin adsorption isotherms, as depicted in Fig. 18. The mathematical forms for Langmuir, Freundlich, and Temkin adsorption isotherms are represented by Eqs. (6)–(8), respectively. The results obtained from the slopes and intercepts of the linear plots for Freundlich (ln qe against ln Ce), Langmuir (Ce/qe against Ce), and Temkin (qe against ln Ce) are tabulated in Table 7. The data exhibited a poor fit with the Freundlich as well as the Temkin model, thereby suggesting monolayer adsorption during the dye uptake process for both MG and TZ dyes. In contrast, the data aligned very well with the Langmuir adsorption isotherm, showcasing a high correlation factor, viz., 0.99 for both the dyes, viz., MG and TZ. This implied that the adsorption of MG and TZ dyes onto the mesoporous structure of the biochar material involved uniform binding energies with active sites distributed evenly across the surface of the adsorbents. Furthermore, this process of adsorption invokes physical adsorption across the layers of the polymer nanocomposites which are monolayer by nature. These findings strongly align with reports stated earlier [49]. Overall, the aforementioned findings concluded that Langmuir isotherm is the best fit for evaluating the dye adsorption study for both MG as well as TZ dyes.
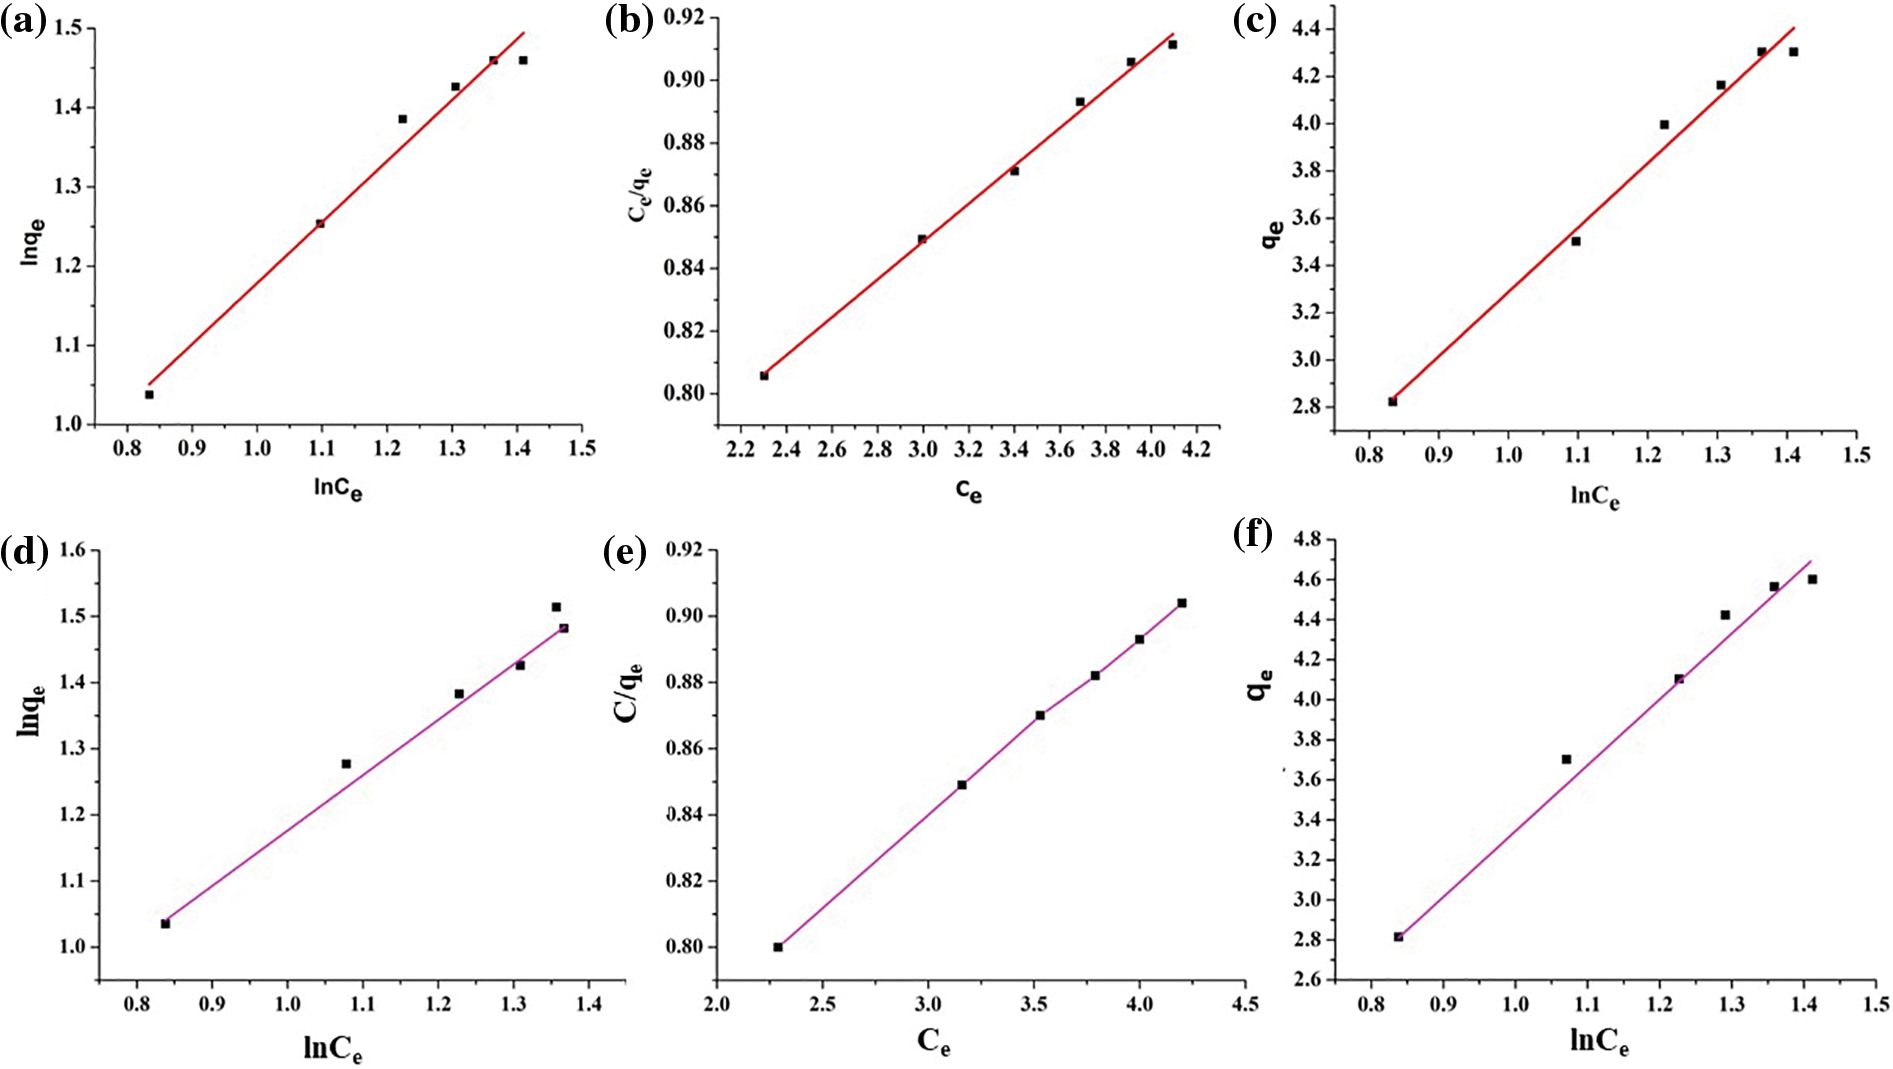
Figure 18: (a) Freundlich isotherm, (b) Langmuir isotherm, (c) Temkin isotherm for MG dye, and (d) Freundlich isotherm, (e) Langmuir isotherm, and (f) Temkin isotherm for TZ dye
To assess the recyclability of the adsorbent material for MG and TZ dye adsorption, the polymer nanocomposites were recovered through a simple procedure that involved filtration, followed by washing the contents thoroughly with deionized water and ethanol [43]. Subsequently, the recovered samples of the polymer nanocomposites were dried at 105°C–110°C. This recovery method was repeated seven times for conducting successive adsorption experiments. The results, as demonstrated in Fig. 19, indicate a promising recovery ability.
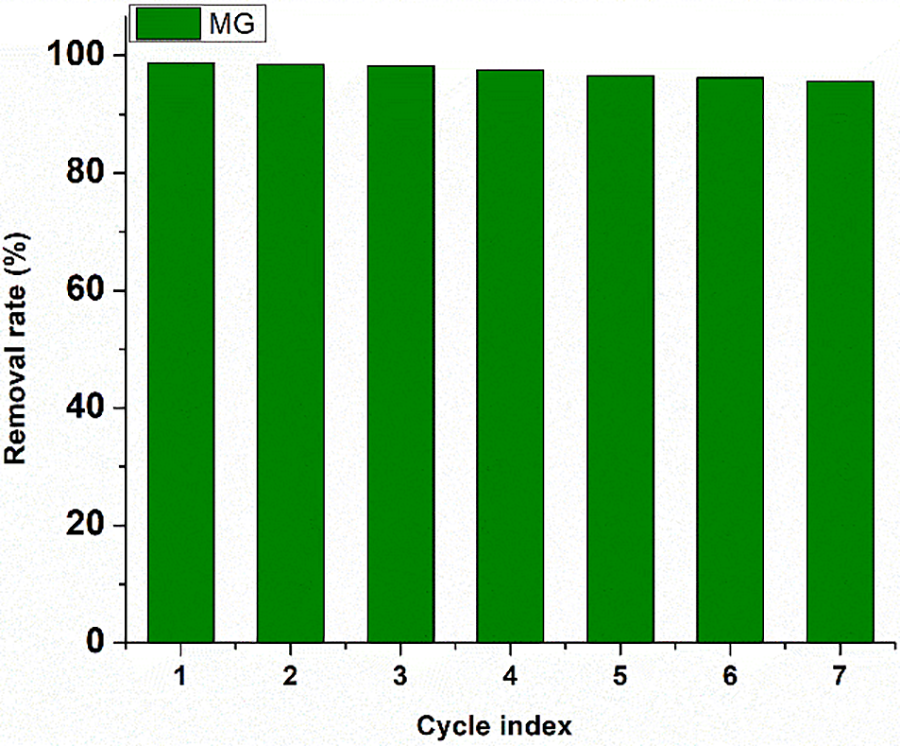
Figure 19: Removal rate for MG dye throughout seven consecutive cycles of reuse
4.2 Environmental, Ethical, and Health Impacts of Biochar in Wastewater Treatment
The use of biochar can contribute to carbon sequestration since it is highly rich in carbon. It also helps mitigate climate change by trapping carbon that would otherwise contribute to atmospheric CO2 levels. Moreover, it is also known for its high adsorption capacity, which makes it effective at removing dyes and other pollutants from wastewater. This leads to significantly lower levels of toxic substances in the environment, reducing harm to aquatic life and improving the quality of water bodies. In turn, lignin, a byproduct of the paper and pulp industry, is typically considered waste. Using lignin to produce biochar promotes waste valorization and supports a circular economy model, reducing the environmental footprint of waste disposal. The textile industry faces significant scrutiny for its environmental impact, particularly concerning water pollution. The industries can take ethical responsibility for reducing their environmental impact by adopting sustainable technologies like lignin-based biochar. It is also necessary to ensure that this technology is accessible to communities in various regions, including low-income areas, which perfectly aligns with the ethical considerations of equity. Many dyes used in industry are toxic, carcinogenic, or disruptive to human health. Biochar aids in removing these from wastewater before it is released into the environment, resulting in a significant reduction in health risks associated with exposure to these chemicals. Moreover, biochar technology directly benefits the health of communities, especially those close to industrial areas by improving the quality of discharged water.
An economically viable, efficient, and environmentally friendly adsorbent material, viz., biochar has been successfully synthesized from kraft lignin. The synthesized biochar was authenticated invoking various methods, viz., XRD, FTIR, Raman, XPS, etc., and was subsequently employed as a reinforcing agent in poly(ester amide urethane) resin in various loadings to carry out the fabrication of polymer nanocomposites. These nanocomposites demonstrated improved mechanical as well as thermal properties compared to the pristine polymer matrices along with rendering biodegradability attributes. In turn, they were successfully deployed as adsorbent material for removing MG and TZ dyes from aqueous systems with excellent removal efficiency. Their synergistic effects, enhanced adsorption capacity, regeneration potential, and environmental compatibility make them promising candidates for sustainable water treatment applications. However, further research and development are necessary to overcome challenges and optimize their performance for practical implementation on a larger scale. Furthermore, an elaborate kinetics analysis proposed the PSO kinetic model as the best fit for TZ and MG dye removal onto the polymer nanocomposites. In turn, the Langmuir adsorption isotherm stood out as the best-fit model for assessing the sorption traits of the polymer nanocomposites. The implications of this study are particularly crucial for the textile industry, which often faces challenges in managing dye pollutants. The adoption of this technology could lead to reduced environmental impact and enhanced compliance with global wastewater treatment standards. Moreover, the cost-effectiveness and renewable attributes of these polymer nanocomposites promote a transition to more sustainable manufacturing processes. While the results are promising, the durability and reusability of the nanocomposites in ongoing industrial applications still require further investigation. Future research should focus on scaling up production for pilot testing, evaluating their effectiveness with real industrial wastewater, and analyzing environmental impacts through lifecycle assessments. Additionally, cost-benefit comparisons with existing technologies and integration with other wastewater treatment methods will be crucial to developing effective and comprehensive treatment systems.
Acknowledgement: The authors extend their heartfelt gratitude to the Sophisticated Analytical Instrumentation Centre (SAIC), Tezpur University, and CSIR NEIST Jorhat for assisting in carrying out all instrumentation analyses.
Funding Statement: The authors received no specific funding for this study.
Author Contributions: Experimental, Methodology, Writing—Original Draft Preparation: Annesha Kar; Supervision, Writing—Reviewing and Editing, Submission: Niranjan Karak. All authors reviewed the results and approved the final version of the manuscript.
Availability of Data and Materials: Data will be made available on request.
Ethics Approval: Not applicable.
Conflicts of Interest: The authors declare that they have no conflicts of interest to report regarding the present study.
References
1. Väisänen T, Haapala A, Lappalainen R, Tomppo L. Utilization of agricultural and forest industry waste and residues in natural fiber-polymer composites: a review. Waste Manag. 2016;54:62–73. [Google Scholar]
2. Lawal AA, Hassan MA, Farid MA, Yasim-Anuar TA, Yusoff MZ, Zakaria MR, et al. One-step steam pyrolysis for the production of mesoporous biochar from oil palm frond to effectively remove phenol in facultatively treated palm oil mill effluent. Environ Technol Innov. 2020;18:100730. [Google Scholar]
3. Achieng GO, Kowenje CO, Lalah JO, Ojwach SO. Preparation, characterization of fish scales biochar and their applications in the removal of anionic indigo carmine dye from aqueous solutions. Water Sci Technol. 2019;80(11):2218–31. [Google Scholar] [PubMed]
4. Alene AN, Abate GY, Habte AT. Bioadsorption of basic blue dye from aqueous solution onto raw and modified waste ash as economical alternative bioadsorbent. J Chem. 2020;2020:1. [Google Scholar]
5. Giorcelli M, Khan A, Pugno NM, Rosso C, Tagliaferro A. Biochar as a cheap and environmental friendly filler able to improve polymer mechanical properties. Biomass Bioenergy. 2019;120:219–23. [Google Scholar]
6. Yasim-Anuar TA, Ariffin H, Norrrahim MN, Hassan MA, Tsukegi T, Nishida H. Sustainable one-pot process for the production of cellulose nanofiber and polyethylene/cellulose nanofiber composites. J Clean Prod. 2019;207:590–9. [Google Scholar]
7. Pushpa TB, Josephraj J, Saravanan P, Ravindran G. Biodecolorization of basic blue 41 using EM based composts: isotherm and kinetics. ChemistrySelect. 2019;4(34):10006–12. [Google Scholar]
8. Côrtes LN, Druzian SP, Streit AF, Godinho M, Perondi D, Collazzo GC, et al. Biochars from animal wastes as alternative materials to treat colored effluents containing basic red 9. J Environ Chem Eng. 2019;7(6):103446. [Google Scholar]
9. Gokulan R, Avinash A, Prabhu GG, Jegan J. Remediation of remazol dyes by biochar derived from Caulerpa scalpelliformis—an eco-friendly approach. J Environ Chem Eng. 2019;7(5):103297. [Google Scholar]
10. Jegan J, Praveen S, Bhagavathi Pushpa T, Gokulan R. Sorption kinetics and isotherm studies of cationic dyes using groundnut (Arachis hypogaea) shell derived biochar a low-cost adsorbent. Appl Ecol Environ Res. 2020;18(1):1925–1939 doi:10.15666/aeer/1801_19251939. [Google Scholar] [CrossRef]
11. Zhao X, Wang Z, Li W, Chen X, Cai X, Liu Y. Enhanced removal of methylene blue from aqueous solutions using magnetic biochar derived from bamboo residues. J Hazard Mater. 2020;384:121123. [Google Scholar]
12. Nguyen TAH, Ngo HH, Guo WS, Zhang J, Liang S, Yue QY, et al. Adsorption of reactive dyes from industrial wastewater using rice husk-derived biochar: effects of pyrolysis temperature and surface properties. Bioresour Technol. 2021;324:124672. [Google Scholar]
13. Kumar P, Bhargava R, Srivastava S, Verma N, Prasad R. Treatment of textile wastewater using biochar derived from agricultural waste materials doped with nano-zero-valent iron: dual functionality of adsorption and advanced oxidation processes. J Environ Manag. 2022;301:113862. [Google Scholar]
14. Lee S, Kim J, Park H, Choi Y, Han J. Application of biochar produced from forestry waste (pine needles) for the removal of azo dyes from synthetic wastewater. J Environ Chem Eng. 2023;11(2):108756. [Google Scholar]
15. Martins J, Silva R, Oliveira P, Costa M, Pereira L. Lifecycle assessment of biochar production from municipal solid waste and its application in urban wastewater systems for the removal of complex dye mixtures. J Clean Prod. 2024;365:131024. [Google Scholar]
16. Karimi S, Yaraki MT, Karri RR. A comprehensive review of the adsorption mechanisms and factors influencing the adsorption process from the perspective of bioethanol dehydration. Renew Sustain Energy Rev. 2019;107:535–53. doi:10.1016/j.rser.2019.03.025. [Google Scholar] [CrossRef]
17. Kumar M, Gokulan R, Sujatha S, Shanmuga Priya SP, Praveen S, Elayaraja S. Biodecolorization of Reactive Red 120 in batch and packed bed column using biochar derived from Ulva reticulata. Biomass Convers Biorefin. 2023;13:1707–1721. doi:10.1007/s13399-020-01268-x. [Google Scholar] [CrossRef]
18. Kar A, Karak N. Bio-based poly(ester amide): mechanical, thermal and biodegradable behaviors. J Polym Res. 2022;29(9):366. doi:10.1007/s10965-022-03214-z. [Google Scholar] [CrossRef]
19. Liu XJ, Li MF, Singh SK. Manganese-modified lignin biochar as adsorbent for removal of methylene blue. J Mater Sci. 2021;12(24):1434–45. doi:10.1016/j.jmrt.2021.03.076. [Google Scholar] [CrossRef]
20. Kar A, Rather MA, Mandal M, Karak N. Elastomeric biodegradable poly(ester amide urethane) as a tough and robust material. Prog Org Coat. 2023;182(4):107684. doi:10.1016/j.porgcoat.2023.107684. [Google Scholar] [CrossRef]
21. Hooi KK, Alimuddin Z, Ong LK. Laboratory-scale pyrolysis of oil palm pressed fruit fibres. J Oil Palm Res. 2009;21(1):577–87. [Google Scholar]
22. Cantrell KB, Hunt PG, Uchimiya M, Novak JM, Ro KS. Impact of pyrolysis temperature and manure source on physicochemical characteristics of biochar. Bioresour Technol. 2012;107:419–28. doi:10.1016/j.biortech.2011.11.084. [Google Scholar] [PubMed] [CrossRef]
23. Idris J, Shirai Y, Andou Y, Ali AA, Othman MR, Ibrahim I, et al. Self-sustained carbonization of oil palm biomass produced an acceptable heating value charcoal with low gaseous emission. J Clean Prod. 2015;89:257–61. doi:10.1016/j.jclepro.2014.11.016. [Google Scholar] [CrossRef]
24. Natarajan R, Manivasagan R. Effect of operating parameters on dye wastewater treatment using Prosopis cineraria and kinetic modeling. Environ Eng Research. 2020;25(5):788–93. doi:10.4491/eer.2019.308. [Google Scholar] [CrossRef]
25. Kapoor RT, Rafatullah M, Siddiqui MR, Khan MA, Sillanpää M. Removal of reactive black 5 dye by banana peel biochar and evaluation of its phytotoxicity on tomato. Sustainability. 2022;14(7):4176. doi:10.3390/su14074176. [Google Scholar] [CrossRef]
26. Wainwright M. Dyes in the development of drugs and pharmaceuticals. Dyes Pigm. 2008;76(3):582–9. [Google Scholar]
27. Uddin F. Environmental hazard in textile dyeing wastewater from local textile industry. Cellulose. 2021;28(17):10715–39. [Google Scholar]
28. Sahu S, Pahi S, Tripathy S, Singh SK, Behera A, Sahu UK, et al. Adsorption of methylene blue on chemically modified lychee seed biochar: dynamic, equilibrium, and thermodynamic study. J Mol Liq. 2020;315:113743. [Google Scholar]
29. Guo W, Luo H, Jiang Z, Fang D, Chi J, Shangguan W, et al. Ge-doped cobalt oxide for electrocatalytic and photocatalytic water splitting. ACS Catal. 2022;12(19):12000–13. [Google Scholar]
30. Domingues RR, Trugilho PF, Silva CA, Melo IC, Melo LC, Magriotis ZM, et al. Properties of biochar derived from wood and high-nutrient biomasses with the aim of agronomic and environmental benefits. PLoS One. 2017;12(5):e0176884. [Google Scholar] [PubMed]
31. Wang W, Wang C, Wang T, Li W, Chen L, Zou R, et al. Enhancing the thermal conductivity of n-eicosane/silica phase change materials by reduced graphene oxide. Mater Chem Phys. 2014;147(3):701–6. [Google Scholar]
32. Zhang Q, Yi W, Li Z, Wang L, Cai H. Mechanical properties of rice husk biochar reinforced high density polyethylene composites. J Polym. 2018;10(3):286. [Google Scholar]
33. Mohammed Z, Jeelani S, Rangari V. Effective reinforcement of engineered sustainable biochar carbon for 3D printed polypropylene biocomposites. Compos C: Open Access. 2022;7:100221. [Google Scholar]
34. Jeon J, Park JH, Wi S, Yang S, Ok YS, Kim S. Characterization of biocomposite using coconut oil impregnated biochar as latent heat storage insulation. Chemosphere. 2019;236:124269. [Google Scholar] [PubMed]
35. Xu J, Liu J, Ling P, Zhang X, Xu K, He L, et al. Raman spectroscopy of biochar from the pyrolysis of three typical Chinese biomasses: a novel method for rapidly evaluating the biochar property. J Energy. 2020;202:117644. [Google Scholar]
36. Zhao SX, Ta N, Wang XD. Effect of temperature on the structural and physicochemical properties of biochar with apple tree branches as feedstock material. J Energy. 2017;10(9):1293. [Google Scholar]
37. Nair RR, Mondal MM, Srinivasan SV, Weichgrebe D. Biochar synthesis from mineral- and ash-rich waste biomass, part 1: investigation of thermal decomposition mechanism during slow pyrolysis. Mater. 2022 Jun 10;15(12):4130. [Google Scholar]
38. Lee T, Nam IH, Jung S, Park YK, Kwon EE. Synthesis of nickel/biochar composite from pyrolysis of Microcystis aeruginosa and its practical use for syngas production. Bioresour Technol. 2020;300:122712. [Google Scholar] [PubMed]
39. Ahmetli G, Kocaman S, Ozaytekin I, Bozkurt P. Epoxy composites based on inexpensive char filler obtained from plastic waste and natural resources. Polym Compos. 2013;34(4):500–9. [Google Scholar]
40. Song XY, Pan GX, Bai YW, Liang F, Xing JJ, Gao J, et al. Preparation and electrochemical properties of biochar from pyrolysis of pomelo peel via different methods. Fuller Nanotub Car N. 2019;27(5):453–8. [Google Scholar]
41. Li S, Huang AN, Chen YJ, Li D, Turng LS. Highly filled biochar/ultra-high molecular weight polyethylene/linear low density polyethylene composites for high-performance electromagnetic interference shielding. Compos B Eng. 2018;153(4):277–84. doi:10.1016/j.compositesb.2018.07.049. [Google Scholar] [CrossRef]
42. Nan N, DeVallance DB, Xie X, Wang J. The effect of bio-carbon addition on the electrical, mechanical, and thermal properties of polyvinyl alcohol/biochar composites. J Compos Mater. 2016;50(9):1161–8. doi:10.1177/0021998315589770. [Google Scholar] [CrossRef]
43. Naghdi M, Taheran M, Brar SK, Rouissi T, Verma M, Surampalli RY, et al. A green method for production of nanobiochar by ball milling-optimization and characterization. J Clean Prod. 2017;164:1394–405. doi:10.1016/j.jclepro.2017.07.084. [Google Scholar] [CrossRef]
44. Chaukura N, Murimba EC, Gwenzi W. Sorptive removal of methylene blue from simulated wastewater using biochars derived from pulp and paper sludge. Environ Technol Innov. 2017;8(2010):132–40. doi:10.1016/j.eti.2017.06.004. [Google Scholar] [CrossRef]
45. Naushad M, Alqadami AA, AlOthman ZA, Alsohaimi IH, Algamdi MS, Aldawsari AM. Adsorption kinetics, isotherm and reusability studies for the removal of cationic dye from aqueous medium using arginine modified activated carbon. J Mol Liq. 2019;293:111442. doi:10.1016/j.molliq.2019.111442. [Google Scholar] [CrossRef]
46. Claoston N, Samsuri AW, Ahmad Husni MH, Mohd Amran MS. Effects of pyrolysis temperature on the physicochemical properties of empty fruit bunch and rice husk biochars. Waste Manag Res. 2014;32(4):331–9. doi:10.1177/0734242X14525822. [Google Scholar] [PubMed] [CrossRef]
47. Das O, Kim NK, Hedenqvist MS, Lin RJ, Sarmah AK, Bhattacharyya D. An attempt to find a suitable biomass for biochar-based polypropylene biocomposites. Environ Manag. 2018;62(2):403–13. doi:10.1007/s00267-018-1033-6. [Google Scholar] [PubMed] [CrossRef]
48. Zhang Y, Fan R, Zhang Q, Chen Y, Sharifi O, Leszczynska D, et al. Synthesis of CaWO4-biochar nanocomposites for organic dye removal. Mater Res Bull. 2019;110:169–73. doi:10.1016/j.materresbull.2018.10.031. [Google Scholar] [CrossRef]
49. Gu Y, Xue Y, Zhang D. Preparation of magnetic biochar with different magnetization sequences for efficient removal of oxytetracycline from aqueous solution. Colloids Surf A: Physicochem Eng. 2021;626(121):126987. doi:10.1016/j.colsurfa.2021.126987. [Google Scholar] [CrossRef]
Cite This Article
 Copyright © 2024 The Author(s). Published by Tech Science Press.
This work is licensed under a Creative Commons Attribution 4.0 International License , which permits unrestricted use, distribution, and reproduction in any medium, provided the original work is properly cited.
 Downloads
 Citation Tools