
 Submit a Paper
 Propose a Special lssue
 Open Access
ARTICLE

Properties of Activated Carbons from Sugarcane Leaves and Rice Straw Derived Charcoals by Activation at Low Temperature via KMnO4 Pre-Oxidation-Hydrolysis
Chemistry Department, Faculty of Science, Naresuan University, Phitsanulok, 65000, Thailand
* Corresponding Author: Sumrit Mopoung. Email:
(This article belongs to the Special Issue: Recent Advances in Biochar and Carbon-Based Materials Characteristics and Environment Applications)
Journal of Renewable Materials 2024, 12(8), 1433-1454. https://doi.org/10.32604/jrm.2024.052925
Received 19 April 2024; Accepted 30 May 2024; Issue published 06 September 2024
 View Full Text
 Download PDF
Abstract
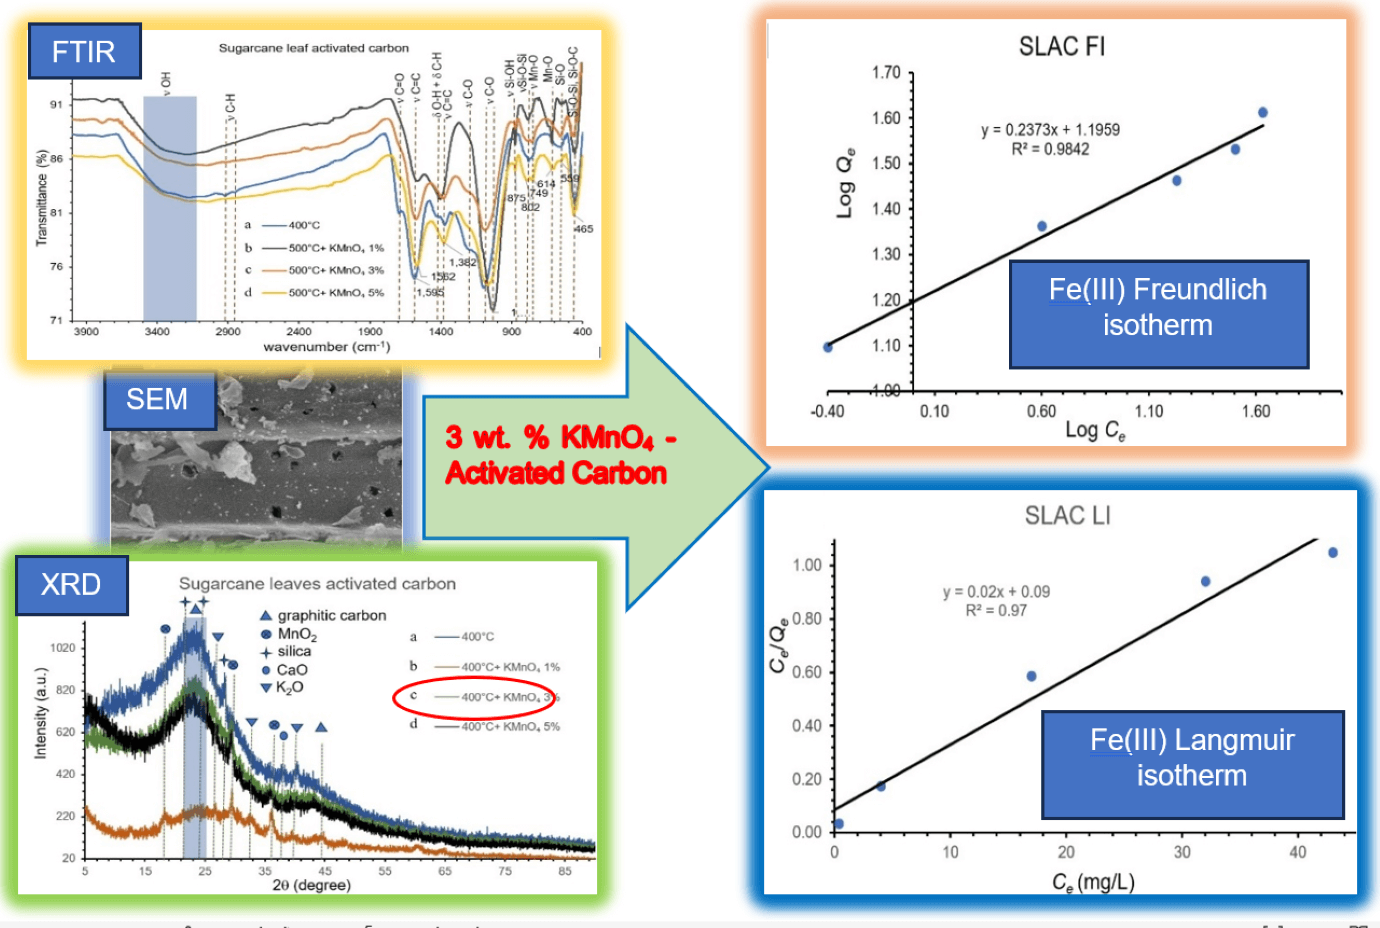
Activated carbon preparation from sugarcane leaves and rice straw by carbonization (250°C–400°C) and activation at 500°C were studied. The effects of pre-oxidation, hydrolysis of derived charcoals by boiled KMnO4 aqueous solution were evaluated. The derived charcoals products were pretreated using oxidation-hydrolysis with 1–5 wt.% KMnO4 at 100°C and then activated at 500°C. The derived charcoal and activated carbon products were characterized by FTIR, XRD, SEM-EDS and BET. Iodine number and methylene blue number of derived products were also used for the analysis of the products. It was found that fabricated charcoal materials made at 350°C–400°C possess good characteristics with low content of surface functional groups and high carbon content. After pre-oxidation-hydrolysis and activation at 500°C, the resulting derived activated carbon materials from charcoals with 400°C carbonization temperature have high content of oxygen containing surface functional groups such as Mn-O, Si-O, Si-O-Si, C-O, or O-H. In addition, MnO2 accumulated on the surface of the derived activated carbon products. The surface area and pore volume of the activated carbon products have also increased with increasing of KMnO4 concentration from 1 to 3 wt.% and then decreased with 5 wt.% used during activation. Therefore, activated carbon products made by pre-oxidation-hydrolysis with 3 wt.% KMnO4 were used for Fe(III) adsorption experiments. It was found that Fe(III) adsorption on the activated carbon materials can be fitted with both the Freundlich and the Langmuir models. The calculated maximum Fe(III) adsorption capacities of sugarcane leaves derived activated carbon and rice straw derived activated carbon products were 50.00 and 39.37 mg/g, respectively. It was shown that the effect of pre-oxidation-hydrolysis by KMnO4 and activation at 500°C are beneficial for activated carbon preparation with environmentally friendly and low-cost simplified operation.Graphic Abstract
Keywords
Nomenclature
| wt.% | percent weight |
| Ø | diameter |
| nm | nanometer |
| ν | stretching vibration |
| δ | bending vibration |
| FI | Freundlich Isotherms |
| LI | Langmuir Isotherms |
The production process of activated carbon normally involves carbonization followed by activation at high temperatures, which requires a high amount of heat energy. This results in high costs for the production of activated carbon. In addition, acid-base oxidants are also used for the activation, which are environmentally polluting and exhibit high costs. Therefore, reducing the carbonization and activation temperatures as well as using low-pollution and affordable oxidants will help to reduce environmental pollution and production costs for the activated carbon products. In this research, researchers have determined and chosen the lowest suitable carbonization temperatures, activation temperatures, simple management, and environmentally friendly non-toxic pre-treatment methods for good quality activated carbon products made from agricultural residues. The pre-treatment methods, such as chemical, physico-chemical, and biological techniques are popular and are used to achieve industrial production requirements in a sustainable way, simple, eco-friendly, cost-effective, and economically feasible [1]. For chemical pretreatment, potassium permanganate has been widely used for raw material pre-treatment such as in the case of spent coffee waste for bioethanol production [2], dairy manure degradation for semi-dry anaerobic digestion [3], sand filter effluent pretreatment [4], and polyvinyl chloride microplastics for adsorption-desorption of malachite green [5]. It is also used as an oxidant for microfluidic direct formate fuel cells [6], hydrochar modification for metal ion adsorption [7], and removal of color-inducing constituents in sugar cane juice/raw sugar [8]. Potassium permanganate is a strong oxidizing agent that can break down large molecules into lower molecular weight fragments in solution [9]. It has many advantages, such as high oxidation ability, high redox potential, and undergoing redox reactions without the need for a catalyst [6]. It converts oxidized metal ions into metal oxide particles, which adsorb on the adsorber surface as MnO2. MnO2 is very small and irregular in its hydrated form, which usually exists as a colloid or a suspended solid in aqueous medium. The suspended hydrated MnO2 has a large surface area with strong adsorptive capacity, which is retained on the absorber surface [4]. Therefore, it has been widely used for wastewater treatment, which is economical and effective [5], such as acidogenic fermentation of waste-activated sludge [9]. Plant biomass or lignocellulosic biomass is a highly abundant renewable resource that can be converted into several types of high-value-added products, including chemicals, biofuels, and advanced materials. It has high availability and low price, and it consists of cellulose, hemicelluloses, lignin, and other minor components. Therefore, it exhibits strong resistance to natural decomposition [10]. Important sources of plant biomass are agricultural residues, which are produced in very large quantities (billions of tons) each year around the world, but most of these residues are either discarded or burned [1]. This is especially the case for cereal residues such as rice straw, wheat straw, corn stover, and sugarcane bagasse, which contain a large fraction of lignocellulose substances [1] and are therefore, difficult to degrade. This work focuses on rice straw and sugarcane leaves. Rice straw is a by-product of rice cultivation, and 650–975 million tons of it are produced per year around the world. Thus, it is an abundant, renewable, and cheap bioresource [11]. It is composed of cellulose, hemicellulose, lignin, and silica in the following weight ranges 37.60%–46.55%, 22.35%–28.25%, 5.60%–11.60%, and 9.05%–13.70%, respectively [11]. Generally, it can be used as fodder for cattle, cover for some crops, and other domestic applications [12]. However, most of the rice straw is either burned or ploughed into the field. Rice straw burning release greenhouse gases and particulate matter (2.5 and 10 μm), which leads to air pollution, soil degradation and health deterioration in animals and humans [11]. Generally, rice straw is mainly used as animal bedding, animal fodder, wrapping of materials during transport, energy and biofuel production, pulp and paper production, and construction materials [13]. It has also been used for bioethanol and organic fertilizer production [11]. Especially biochar production from rice straw has become popular around the world due to greenhouse gas emission reduction, carbon sequestration, absorbing contaminants, soil remediation and composting [14], and charcoal briquettes production [12]. It also has been used for the construction of biodegradable foams, which could be used for reinforcement and fire retardation due to their compressive strength with low density and eco-friendliness [15]. Rice straw can also be extracted to provide polyphenols and cellulose fractions, which can be used as antioxidants in the food sector or as nutritional components in the development of new food or packaging materials [13]. Sugarcane leaves are lignocellulosic agricultural by-products from sugarcane cultivation, which are also often burned in the fields by farmers during the preparation of the area for the next growing season. This causes a lot of smog, dust, and air pollution problems [16]. In terms of utilization, sugarcane leaves were used for the removal of cadmium(II), lead(II), and zinc(II) ions from polluted water [17]; furthermore, this material found use in pulp and paper production by chemical pulping method [18], biogas production with pre-treatment by sodium hydroxide prior to co-digestion with cow manure [16], and activated biochar formation for metal ions removal from wastewater [10]. Therefore, we aim to add value to rice straw and sugarcane leaves by converting them into activated carbon for further use in water treatment. The potassium permanganate pre-treatment is the most effective for enhancing biomass decomposition. This oxidation process can remove some organics adsorbed to the inner pores or surfaces of the adsorber. Meanwhile, this oxidation by potassium permanganate also yields manganese dioxide, which can also adsorb organic substances during water filtration [4].
The aims of this research were to find a method for activated carbon production using an environmentally friendly, low-cost, and simplified operation. The effects of carbonization temperature between 250°C–400°C for derived charcoals preparation and pre-oxidation, hydrolysis by 1–5 wt.% KMnO4 of derived charcoals products with good characteristics were studied. Experiments investigating the changes in percent yield, surface properties, elemental composition, and morphology of charcoal products made from sugarcane leaves and rice straw with low carbonization temperature (250°C–400°C) were conducted to identify charcoal conversion to activated carbon conditions yielding good quality products. In this step, the lowest carbonization temperature for charcoal produced from biomass is determined. After that, the collected charcoals were pre-oxidized and hydrolyzed by 1–5 wt.% KMnO4 at 100°C. Finally, the pre-oxidized and hydrolyzed samples were activated at 500°C to yield activated carbon products. The effects of pre-oxidation, hydrolysis by difference of KMnO4 concentration were evaluated for the most suitable conditions. The charcoals and activated carbons were characterized by FTIR, XRD, SEM-EDS, and BET (Brunauer, Emmett and Teller) to identify qualify charcoal and activated carbon products. The iodine number and methylene blue number of the activated carbon products were also determined. The collected activated carbons were used for Fe(III) adsorption experiments.
2.1 Preparation of Raw Materials
Sugarcane leaves (SL; Suphanburi strain 50) were obtained from Ban Krang subdistrict, Phitsanulok Province, Thailand. Rice straw (RS) was obtained from Nakhon Sawan Province, Thailand. The samples were cut into pieces approximately 2–3 cm long and then washed with distilled water. After that, the cleaned raw materials were dried at 105°C for 24 h in an oven (SL 1375 SHEL LAB 1350 FX) and stored in a desiccator for further characterization and experiments.
2.2 Proximate Analysis of Raw Materials
Dried SL and dried RS were analyzed to determine the content of volatile matter [19], ash [20] and fixed carbon [21] by proximate analysis technique. A sample of 5.00 g (OHAUS; Scout Pro, USA) of the dried precursors (in triplicate of each sample), which was dried at 105°C for 6 h in an oven, was placed in a crucibles with a lid and burned at a constant temperature of 500°C for 7 min in a muffle furnace (Fisher Scientific Isotemp®Muffle Furnace Pittsburgh, PA, USA) and subsequently was allowed to cool down to room temperature. The residue was then weighed to determine the percent of dried weight (dried wt.%) and to calculate the content of volatile matter. After that, all samples that have been burned at 500°C, were burned continuously with intermittent lid opening at a constant temperature of 900°C for 1 h and allowed to cool down to room temperature. The residues were weighed for the calculation of the percent content of ash. The fixed carbon content was calculated from the 100% dried weight of initial raw samples minus of percent dried weight (dried wt.%) of volatile matter and ash.
Dried precursor samples (20.00 g, in triplicate of each sample) were placed in a crucible with a lid and carbonized at a constant final temperature of 250°C, 300°C, 350°C, and 400°C in a muffle furnace by holding the sample at the desired final carbonization temperature for 1 h. After that, the carbonized products (charcoals) were cooled down to room temperature, weighed for percent yield calculation, and stored in a dried desiccator for further characterization and experiments.
2.4 Preparation of Activated Carbon
A sample of each charcoal product (10.00 g, in triplicate of each charcoal), which was collected from carbonization at 400°C, was placed in a beaker and mixed with 0.1000 g (1 wt.%), 0.3000 g (3 wt.%), or 0.5000 g (5 wt.%) of potassium permanganate (Lab grade, Merck, Germany). The mixed samples were dissolved in 50 mL distilled water and boiled at 100°C for 1.50 h with stirring on a magnetic stirrer hotplate (Heidolph; MR Hei-Standard, Germany). This step is called potassium permanganate pre-oxidation-hydrolysis of charcoals. All the experiments were performed at atmospheric pressure. The boiled samples were filtered with a Whatman No. 42-filter paper and then dried at 80°C for 2 h. The dried mixed samples were placed in a crucible with a lid and activated at 500°C in a muffle furnace with holding at the final temperature for 1 h and then cooled down to room temperature. The final products, which are activated carbons, were weighed for percent yield calculation and stored in a desiccator for further characterization and adsorption experiments.
2.5 Characterization of Charcoals and Activated Carbons
The charcoals and activated carbons were grounded and characterized by FTIR (Spectrum GX, Perkin Elmer, USA) to classify the organic, inorganic, and chemical bonds or functional groups. XRD (PW 3040/60, X’ Pert Pro Console, Philips, The Netherlands) was used to analyze and identify the type of compounds and crystal structure. SEM-EDS (Leo1455VP Electron Microscopy, Cambridge, England) was used to study the surface characteristics, size, shape, and elemental composition. BET (Micromeritics TriStar II3020, Bavaria, Germany) was used to analyze surface area, pore volume, and average pore size of charcoals and activated carbons. The iodine number (0.1 N I2; CARLO ERBA Reagent) [22], and methylene blue number values (100 mg/L, AR UNILAB) [23] of all products were also determined. Finally, the collected activated carbon products with the best characteristics were used for Fe(III) (100 mg/L; FeCl3, AR UNILAB) adsorption experiments to determine equilibrium time and adsorption isotherm type.
The surface chemical properties and structural and compositional changes in the charcoals products by the impact of carbonization temperature were characterized by FTIR, SEM-EDS, XRD, BET, iodine number and methylene blue number. Characteristics of charcoal are low surface functional groups, high carbon content, and amorphous allotropic form with high porous. In another part, the effect of boiled KMnO4 aqueous solution at difference concentrations to changing of chemical and physical properties of derived activated carbons were also measured in the same way of charcoals preparation experiments for study to development of surface functional groups, porous structure, allotrope of carbon, elementals composition in derived activated carbon products.
Textural characteristics of the charcoal and activated carbon products were determined by N2 adsorption at −196°C on a Brunauer Emmett Teller surface area analyzer. The samples were degassed at 250°C for 12 h under vacuum before the measurements. The specific surface areas were estimated using the multipoint Brunauer Emmett Teller (BET) equation.
2.5.2 Measurement of Iodine Number
The iodine number was measured following the method of AWWA B 604-74 [22]. Charcoal and activated carbon materials were ground into a powder and sieved through a 60 mesh (0.246 mm) sieve. The screened powders were washed with distilled water, then dried at 110°C for 24 h, and stored in a desiccator containing silica gel. A certain amount (1.0000 g, Analytical balance; Sartorius ED224s Goettingen, Germany) of dried charcoals or activated carbons was added to 50 mL of a 0.1 N iodine solution. The resulting suspensions were shaken continuously at 200 rpm for 15 min at room temperature and then centrifuged with 4000 rpm for 10 min. After centrifugation, 10 mL of the supernatant was pipetted and titrated with 0.1 M sodium thiosulfate (Merck, Darmstadt, Germany) to determine the equilibrium concentration of iodine (g/L) and the amount of iodine adsorbed onto charcoals and activated carbons (mg/g). The amount of iodine adsorbed onto charcoals and activated carbons was calculated from the difference between the initial and final concentrations.
2.5.3 Measurement of Methylene Blue Number
Accurately weighed (0.0500 g) samples of sieved charcoal and activated carbon powders (≤0.246 mm) were used for methylene blue number measurement using methylene blue solution (25 mL, 100 mg/L). Suspensions were shaken at 200 rpm for 30 min in a 250 mL Erlenmeyer flask. After that, the suspensions were centrifuged at 4000 rpm for 10 min. The supernatant solutions (1 mL) were pipetted and then diluted with 100 mL, pH 7 buffer solution [KH2PO4 (CARLO ERBA Reagent) and Na2HPO4 (Ajax Finechem)]. Finally, the remaining methylene blue concentration in the diluted solutions was determined using a measurement of absorbance by UV/Visible spectrometer (UNICO 1100) at 665 nm. Methylene blue numbers were calculated from the amount of adsorbed methylene blue (disappeared after agitation) by charcoal and activated carbon powders in mg/g.
2.6 Fe(III) Adsorption Experiments
2.6.1 Adsorption Equilibrium Time Determination
Accurately weighed (0.1000 g) samples of activated carbons were placed into a 100 mL beaker. Then, solutions of 50 mL, 100 mg/L FeCl3 (AR UNILAB) were poured into the beaker to be mixed with the activated carbon adsorbents. The pH of the resulting mixture was then adjusted to 7 by using either 1.0 M HCl (reagent grade, Merck) or 1.0 NaOH (reagent grade, Merck). After that, the solutions were left at 33°C for 20–180 min, depending on the desired adsorption time. At the end of the adsorption time, the mixtures were filtered through a Whatman No. 42 filter paper. The eluted solutions were collected for Fe(III) concentration determination by AAS (Varian Spectar 220 FS, Melbourne, Australia). Percent Fe(III) removals from eluted solutions at each of time point were calculated. The amount of Fe(III) removed by activated carbon materials were calculated from the difference in the initial and final concentrations. Finally, the percent Fe(III) removal vs. soaking time were plotted for adsorption equilibrium time determination.
2.6.2 Isotherm Adsorption Experiment
Accurately weighed (0.1000 g) samples of collected activated carbons were placed into a 100 mL beaker. After that, 50, 75, 100, 12, or 150 mg/L FeCl3 solution were added and mixed with the activated carbon materials. The pH of the mixtures was adjusted to 7. The mixtures were soaked for 60 min at 33°C. After 60 min of equilibration time, the mixtures were filtered through a Whatman No. 42 filter paper and the filtrates were collected for Fe(III) concentration determination by AAS. Fe(III) concentration (Ce) of the eluted solutions and Fe(III) adsorptions (Qe) were calculated in mg/L and mg Fe/g activated carbon, respectively. The values of Ce/Qe, Log Qe, and Log Ce were also calculated. The Ce/Qe vs. Ce and Log Ce vs. Log Qe graphs were plotted for the Langmuir and the Freundlich adsorption isotherm models, respectively. The Langmuir and the Freundlich adsorption isotherm models in linear form are as follows.
The linear form of the Langmuir equation is [24]:
where Qe (mg/g) is the Fe(III) adsorbed amount per unit mass of activated carbon. Ce (mg/L) is the Fe(III) equilibrium concentration. Qmax (mg/g) is the maximum Fe(III) amount that forms a complete monolayer on the surface of activated carbon. KL (L/mg) is the Langmuir constant which is associated with adsorption heat. The constants Qmax and KL were determined from the slope, and intercept of plotting Ce/Qe vs. Ce, respectively.
The Langmuir model could be estimated by a dimensionless separation factor whether the sorption is favorable or not. The separation factor, RL is defined as [25]:
where C0 (mg/L) is the initial concentration of Fe(III), KL (L/mg) is the Langmuir constant. Values of 0 < RL < 1 indicate that the sorption is favorable.
The linear form of the Freundlich model is [24]:
where Qe and Ce have the same definitions as in the Langmuir equation. KF and n are Freundlich constants related to adsorption capacity and intensity or heterogeneity factor, respectively. The constants KF and n were determined from the slope and intercept of plotting Log Ce vs. Log Qe, respectively.
3.1 Proximate Composition of Precursor Materials
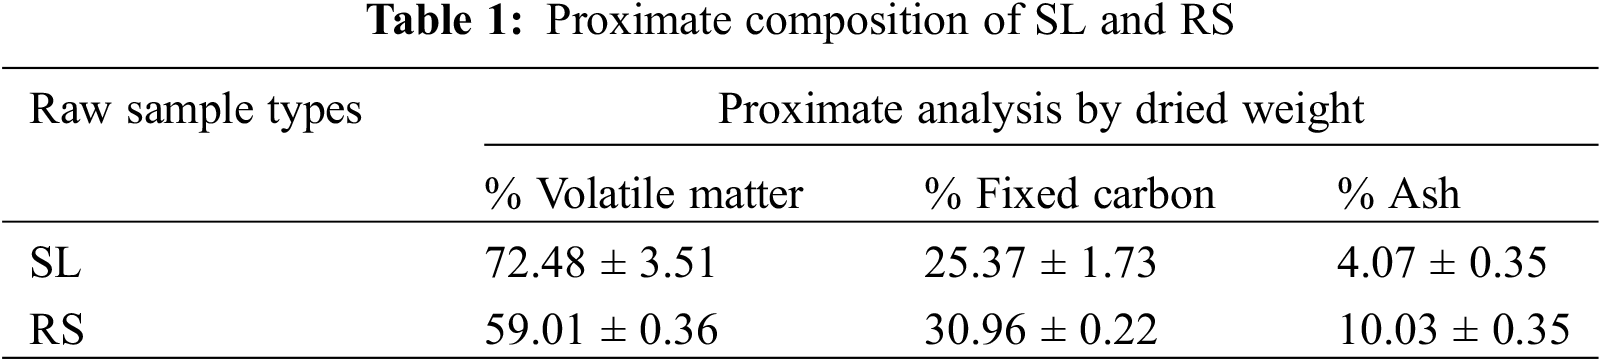
The results of the proximate analysis of sugarcane leaves (SL) and rice straw (RS) are summarized in Table 1. The results indicate that the amount of volatile matter in SL is higher than in RS. While the amounts of fixed carbon and ash were inversely proportional. However, the fixed carbon and volatile matter values of both precursors are suitable for activated carbon production. Additionally, the high percentage of volatile matter in the precursors leads to fine particles of carbonaceous products. While the high ash content, which indicates the presence of minerals as impurities in the carbon [26], would reduce the surface area of the activated carbon products.
3.2 Percent Yield of Charcoals and Activated Carbons
3.2.1 The Influence of Carbonization Temperature
In general, biomass dehydrates, dries, and releases the gas (such as N2 and CO2) in the pores were occurred at below 300°C carbonization temperature. After that, the long carbon chain breaks and splits to form small organic molecules (such as bio-oil, organic acids, aromatic hydrocarbons, tar, methanol, acetone, acetic acid) and solid char were appeared as the temperature reaches about 400°C–500°C [14]. In this study, the 250°C to 400°C carbonization temperature were conducted for finding the lowest temperature for charcoal produced from biomass.
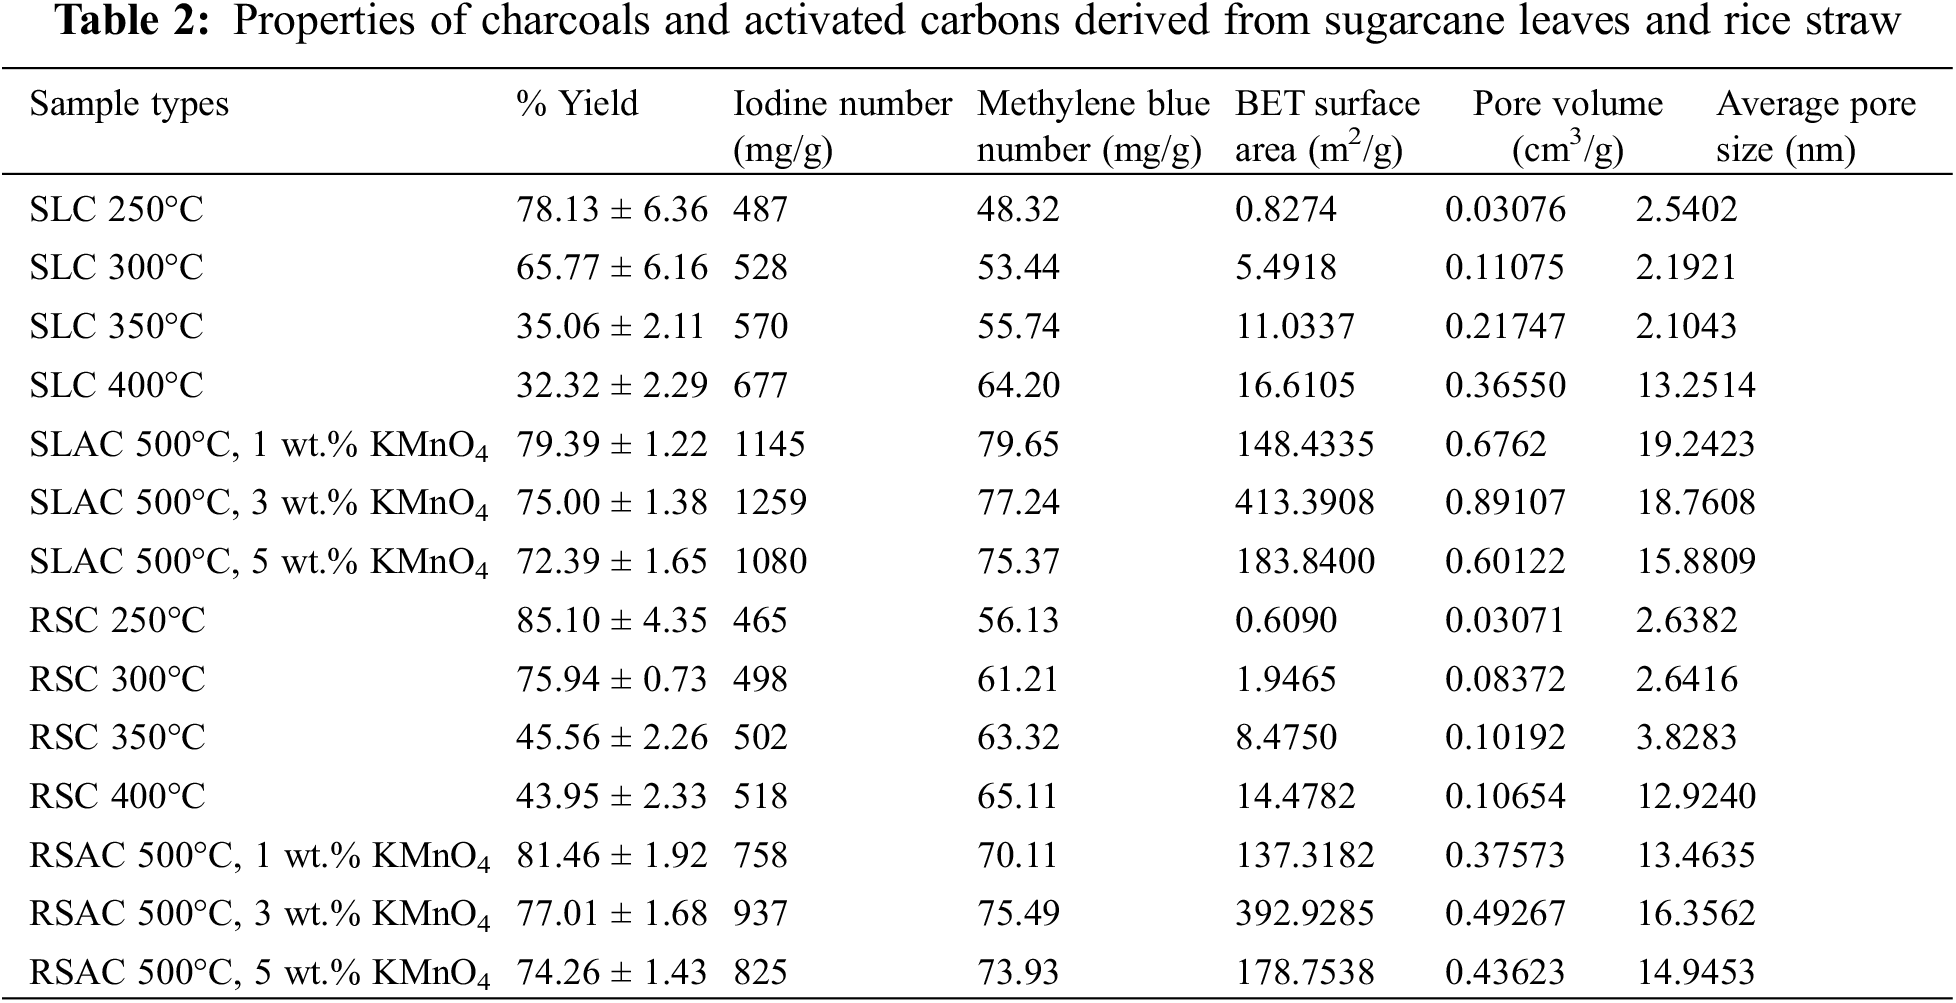
As shown in Table 2, the percent yields of sugarcane leaves-derived charcoal (SLC) and rice straw-derived charcoal (RSC) products decrease with increasing carbonization temperature from 250°C to 400°C. These results show that volatile matter degradation takes place above 250°C. On the other hand, most of the fixed carbon and ash did not decompose during carbonization in the temperature range between 250°C and 400°C. Furthermore, the percent yields of SLC are lower than those of RSC at all carbonization temperatures. This is caused by the higher content of volatile matter in SL, which results in more extensive degradation than for RS. The percent yields of both charcoals are relatively constant for carbonization temperatures between 350°C and 400°C, which is in line with the report of Cellatoğlu and İlkan [27]. This is due to almost complete degradation of volatile matters at carbonization temperatures over 350°C.
3.2.2 The Influence of Pre-Oxidation-Hydrolysis in KMnO4 Aqueous Solution
From the report of Qanytah et al. [28], the bamboo-derived activated carbon from bamboo-derived charcoal was produced by KMnO4 at 2.5% and 5% concentration and carbonization at 800°C. The standard activated carbon was archived at 2.5% concentration of KMnO4. Therefore, the KMnO4 with 1 to 5 wt.% were conducted in this study for comparison with the activated carbon production at activation temperatures below 800°C.
As considering Table 2, the percent yields of SLAC and RSAC made by pre-oxidation-hydrolysis of SLC and RSC by boiling in 1–5 wt.% KMnO4 aqueous solution and activation at a temperature of 500°C decrease sharply with increasing percent weight of KMnO4 used. This shows that increasing the wt.% of KMnO4 used for pre-oxidation-hydrolysis could enhance the partial oxidation of carbon on the surface of the charcoal materials. At the same time, hydrolysis in boiling water could increase the dissolution of remaining volatile matter and ash present in the charcoals. Furthermore, it was observed that the percent yields of SLACs are lower than those of RSACs. In this case, this is due to the silica compounds in ash content, which cover the surface of the charcoal materials, of which there is more on RS than on SL before the pre-treatment. The small amount of remaining organic matter (especially lignin) in charcoals was destroyed through saponification and hydrolysis of saponifiable bonds in lignin [29] by boiling in KMnO4 aqueous solution.
3.3 FTIR of Derived Charcoals for Collection
The FTIR transmittance spectra of SLC and RSC, which were carbonized at 250°C–400°C are shown in Fig. 1. Transmittance intensity of all bands or peaks decreases with increasing carbonization temperatures from 250°C to 400°C, except for peaks at about 1600, 1100, 780, and 455 cm−1. The peaks are attributable to cellulose can be found in the broadband range between 3200–3500 cm−1 (ν OH stretching of alcohol skeletal vibrations), double peaks at 2919/2917 cm−1 and 2868/2851 cm−1 (C–H stretching), ~1430 cm−1 (C–H and O–H deformation), 1200 cm−1 (O-H bending), 1384/1367 cm−1 (C=C stretching of the aromatic ring), and 1023/1056 cm−1 (C–O–C and C–O stretching vibration in crystalline regions). On the other hand, peaks corresponding to hemicellulose are at ~1700 cm−1 (C=O stretching of ketone/aldehyde), 1384/1367 cm−1 (C=C stretching). and 1200 cm−1 (O-H bending). The peaks attributable to lignin are at ~1700 cm−1 (C=O stretching of ketone/aldehyde), ~1600 cm−1 (C=C stretching of the aromatic ring), 1516 cm−1 (C–H deformation), ~1430 cm−1 (C–H and O–H deformation), ~1370 cm−1 (C=C stretching of the aromatic ring), ~1200 cm−1 (C−O ester stretching vibrations in methoxyl and β–O–4 linkages), and 1023/1056 cm−1 (C–O stretching) [2,30] The peaks of these components exhibit very weak intensities. These results show that these components have a very low content in all charcoals made with carbonization temperatures in the range 250°C–400°C. Especially, carbonization at temperatures of 350°C–400°C could result in the destruction of almost all surface functional groups on charcoals. Hydrogen bonds of cellulose and hemicellulose, which result in IR bands located at 3300–3500 cm−1 and 1200 cm−1, were also broken. These observations have indicated that condensed aromatic structures have developed in the charcoals. This is evident from the shift of the peak of C=C stretching of the aromatic rings of lignin to a position characteristic for C=C stretching of graphitic rings. In addition, the intensity of the C=C stretching of the aromatic rings (C=C bond in graphitic) at ~1600 cm−1 in charcoals increases with increasing carbonization temperatures. These results show that aromatization reactions were taking place during the carbonization. Furthermore, the aromatization reactions have proceeded to a greater extent at higher carbonization temperatures. In addition, C–Ο stretching bands at 1023/1056 cm−1 present in both charcoals are blue-shifted to higher frequency (1104/1083 cm−1) and exhibit higher intensities with increasing carbonization temperatures. It was also shown that the C−O ester groups in lignin as well as C–O–C and C–O groups in crystalline regions of cellulose have been decomposed. On the other hand, the C–O group corresponding to acids, alcohols, phenols, ethers, and esters [31] on the surfaces of the charcoals, which have formed through partial oxidation by oxygen from air during the carbonization stage, have appeared. Observation of the fact that the peaks for the C–O bands have blue-shifted indicates that the original surface functional groups of organic constituents have decomposed because of carbonization. This result could reduce steric hindrance on the charcoal surface. Thus, the C–O bond could be closer to and more firmly attached to the surface of the carbon. This surface functional group withdraws electron density from the graphitic ring, resulting in more electron density being present in the C–O bond giving it higher strength. The comparison of SLC and RSC shows that the intensities of bands and peaks of surface functional groups of SLC are relatively higher than those of RSC. This is caused by the fact that SLC contains more volatile matter than RSC. Finally, three peaks at 784/779, 563, and 454/458 cm−1 were assigned to bending vibrations of Si–O–C groups, stretching vibrations of the Si–O, and stretching vibrations of the Si–O–Si bonds [2], respectively. This indicates that SL and RS have a high content of silica, which is consistent with the report of Zheng et al. [32] and Malik et al. [11]. The intensities of the peaks related to silica-based compounds increased with increasing carbonization temperatures from 250°C to 400°C. This is because while the volatile matter degrades ash remains as the carbonization temperatures increase. It can be seen that peak intensities of silica compounds in RSL are relatively higher than in SLC. Based on the results from FTIR transmittance spectra of both charcoal products, the charcoals made at carbonization temperature of 400°C were collected for the subsequent activation step. This is because these charcoal products were almost devoid of surface functional groups of organic matter.
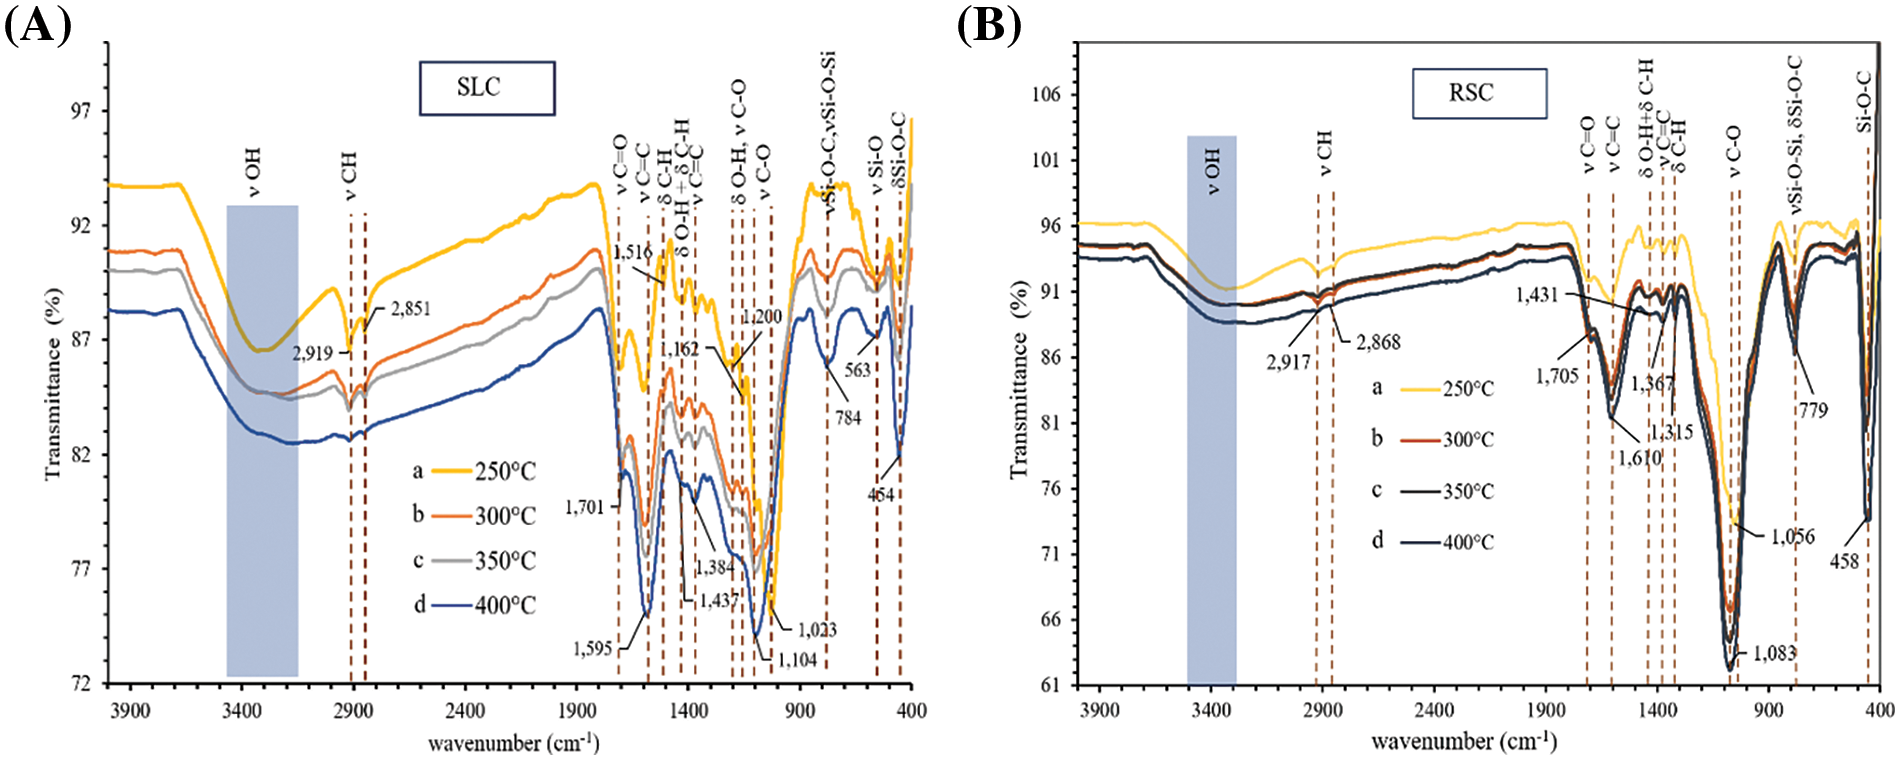
Figure 1: FTIR transmittance spectra of (A) SLC made by carbonization at (a) 250°C (b) 300°C (c) 350°C and (d) 400°C. (B) RSC made by carbonization at (a) 250°C (b) 300°C (c) 350°C and (d) 400°C
3.4 Iodine Number and Methylene Blue Number
The iodine number and methylene blue number are considered a measure of adsorption capability of charcoal and activated carbon materials and represent the amount of micropores (Ø < 2 nm) [22] and mesopores (Ø 2–50 nm) [23], respectively. The results of these experiments carried out with materials synthesized in this work are summarized in Table 2. It was found that the iodine number and methylene blue number of all charcoals increased with increasing carbonization temperatures from 250°C to 400°C. The increase in these values in response to increasing the carbonization temperatures from 250°C to 400°C can be attributed to the increasing release of volatile matter from the raw materials by the heat treatment resulting in the formation and expansion of pores within the charcoal products. Furthermore, the iodine numbers of the SLCs are higher than those of RSCs at each carbonization temperature, while the order of methylene blue numbers is inversed. This is attributed to the higher volatile matter content of SL in comparison to RS, which leads to more fine particles being present in SLCs. This phenomenon creates more micropores than mesopores. After pre-oxidation and hydrolysis by boiling in KMnO4 solution followed by activation at 500°C, both values of all derived activated carbon products increase with increasing wt.% of KMnO4 reaching maximum values at 3 wt.% KMnO4. This is followed by decreases in the values of these parameters with further increases of KMnO4 concentration up to 5% wt. Values for both parameters for all derived activated carbons are higher than for the corresponding charcoals. It was shown that pre-oxidation and hydrolysis by boiling in KMnO4 solution has a significant effect on partial oxidation of derived charcoals, which can create micropores and expand micropores to mesopores. However, both values of RSACs are lower than those of SLACs. This is attributed to the presence of more fine particles in SLCs, which allow more extensive KMnO4 diffusion due to larger surface area. Another effect is the silica content of RSAC, which is higher than in SLAC. This silica compound could cover the surface area of the derived activated carbons. Thus, the surface area of the derived activated carbons was blocked by silica, hindering the access of iodine and methylene blue to the surface of the materials. These iodine numbers were higher than that reported by another researcher. Qanytah et al. [28] reported that iodine numbers of ball-milled bamboo with 2.5–5.0 wt.% KMnO4 at 800°C activation were 600–710 mg/g, while methylene blue numbers were similar values.
3.5 Physical Properties of Charcoals and Activated Carbons
The results of the BET measurements are also shown in Table 2. BET surface area, pore volume, and average pore size of all products are consistent with the results of iodine number and methylene blue number determination. It can be seen that the porosity of all derived charcoals is mostly in the micropore regime (~2 nm). On the other hand, the average pore sizes of all derived activated carbon products are higher than 2 nm. This shows that mesopores (2–50 nm) have formed in the activated carbons during the activation by partial oxidation with KMnO4. The KMnO4 partial oxidation could create more micropores and expand micropores to mesopores. In addition, these phenomena also affected the surface areas and pore volumes. As compared with the report of Qanytah et al. [28], it was found that the surface areas also had similar values. Furthermore, these values for both types of activated carbons are decreased for pre-oxidation and hydrolysis with 5 wt.% KMnO4 relative to the pretreatment conducted with 3 wt.% KMnO4. This may be attributed to the excess of MnO2, K2O (from KMnO4 oxidation), and silica present in the products. MnO2, K2O, and silica have increased in proportion due to more extensive partial oxidation of carbon during the activation. Additionally, extensive oxidation by KMnO4 on the exterior portion of the carbon particles can also cause a reduction in porosity. Thus, activated carbons made using pre-oxidation and hydrolysis with 3 wt.% KMnO4 were collected for further Fe(III) adsorption experiments.
3.6 Surface Functional Groups of SLACs and RSACs
After the activation of charcoals, which were produced at 400°C, with KMnO4 pre-oxidation and hydrolysis followed by activation at 500°C, the remaining surface functional groups originally present on the charcoals have disapprealed (Fig. 2). This is due to the effects of KMnO4 pre-oxidation and hydrolysis followed by thermal decomposition. This is confirmed by the fact that peaks at 2919/2917 and 2868/2851 cm−1 (C–H stretching), ~1700 cm−1 (C=O stretching of ketone/aldehyde, due to acidic functionalities), 1430 cm−1 (C–H and O–H deformation of lignin), ~1380 cm−1 (C=C stretching of the aromatic ring of lignin), and ~1200 cm−1 (C−O ester stretching vibrations in methoxyl and β–O–4 linkages of lignin) present in charcoals made by carbonization at 400°C have completely disappeared after the activation step. The hydrolysis and thermal decomposition result in easy dissolution of the remaining organic substances. Small sharp peaks in activated carbons at 1039/1064 cm−1, which have shifted to lower frequencies relative to peaks in derived charcoals, were assigned to C–O stretching in acids, alcohols, phenols, ethers, and esters. In addition, Si–O (~560 cm−1), Si–O–Si (~800 and ~460 cm−1), and Si–O–C (~460 cm−1) based vibrations, which are present in the charcoals, were still present in the activated carbon products. On the other hand, peaks for functional groups such as O–H (broad band at 3200–3500 cm−1) and Mn–O (749, 614 cm−1) [33] have appeared after activation and increase in intensities with increasing wt.% of KMnO4 used. Furthermore, a new peak at 875 cm−1 has also appeared after activation, which was assigned to the Si–OH vibrations [34]. The Si–OH functional group is formed during activation, along with the reforming of the O–H group (which renders hydrophilic) as evidenced by a band at 3200–3500 cm−1. The Mn–O functional group, which demonstrates the existence of Mn–O bonds in the MnO2 structure [35], was formed by the reduction of KMnO4 during pre-oxidation, hydrolysis, and activation. The intensities of the peaks in the FTIR spectra corresponding to the Mn–O functional groups in the activated carbons increased with increasing wt.% of KMnO4. All oxygen-containing functional groups (oxygenated electron-withdrawing groups) have lowered the C=C (conjugated sp2 related to the hexagonal aromatic rings of graphene sheet) bond strength in the activated carbon products. This was confirmed by the position of the C=C peaks (~1600 cm−1) in the activated carbons, which were shifted to lower frequencies relative to the corresponding peaks in the charcoal intermediates. This is a red shift of the band corresponding to the in-plane vibration of C=C bonds (from 1595 to 1562 cm−1 of SLAC and 1603 to 1571 cm−1 of RSAC) [36]. Moreover, pre-oxidation and hydrolysis by boiling in KMnO4 solution could break down the graphitic structure and decrease the content of graphitic carbon in the activated carbon products, which would further the weakening of the C=C bonds in graphitic carbon of the activated carbon products. The C=C stretching in graphitic carbon at ~1400 cm−1 in the activated carbon products, which changed from C=C stretching of the aromatic rings of lignin, also increases with the increase of wt.% of KMnO4 used. Both C=C stretching vibrations at ~1600 cm−1 (high intensity) and ~1400 cm−1 (low intensity) are characteristic of the C=C bond in a graphene hexagonal ring, which is consistent with the report of Carpentier et al. [37]. These phenomena occur to a similar extent in both SLAC and RSAC. All of the surface oxygen-containing functional groups on the activated carbon materials exhibit strongly acidic behavior. In addition, the products are very stable, both chemically and thermally, which is important for metal ion adsorption from aqueous solutions [31].
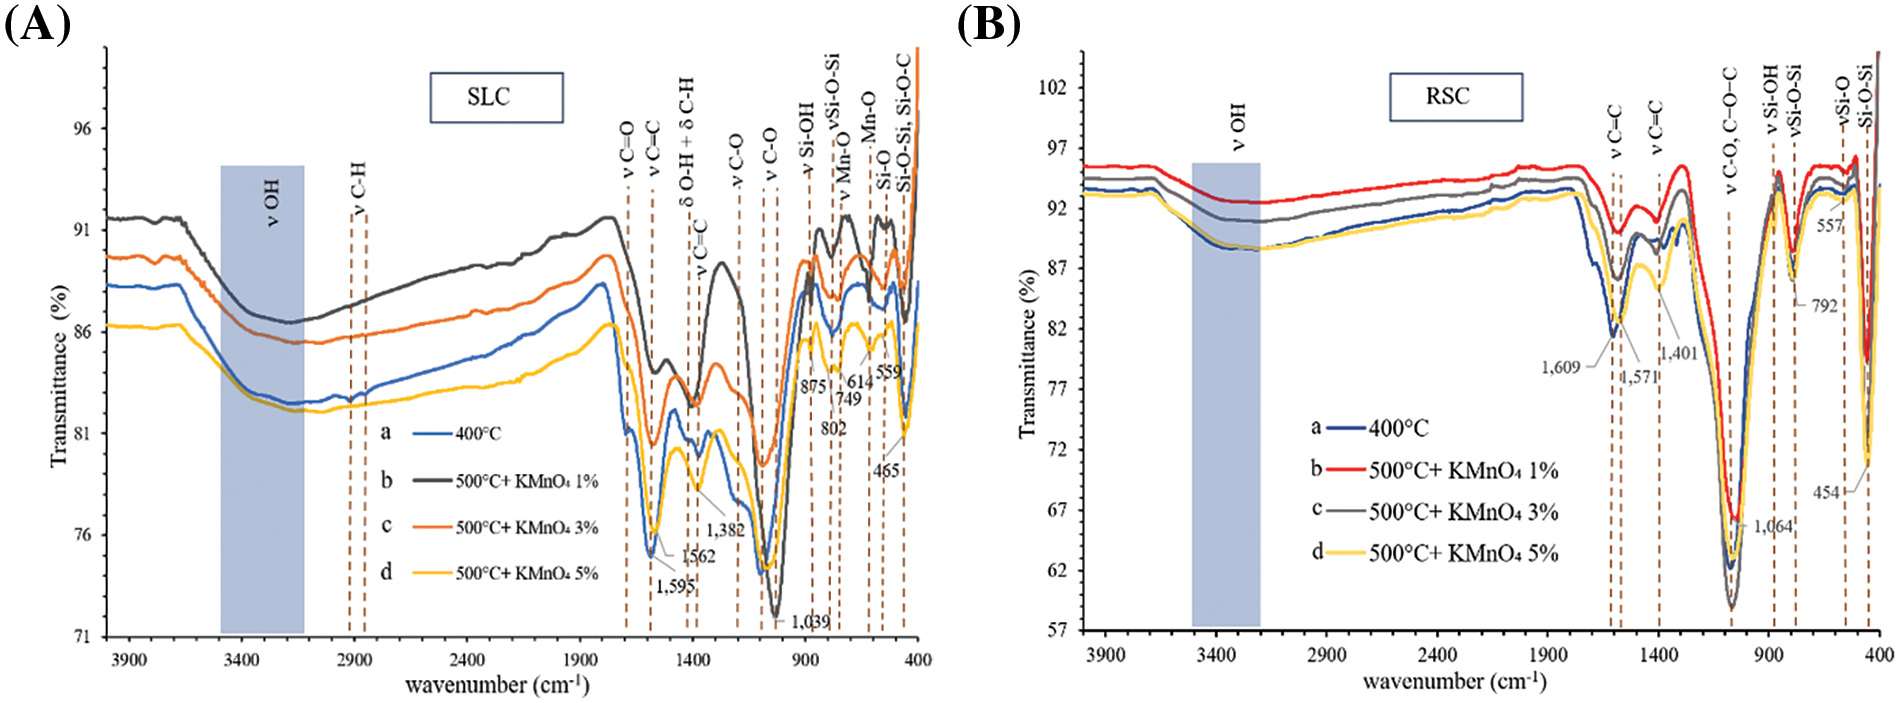
Figure 2: FTIR transmittance spectra of (A) SLAC prepared by activation at 500°C after pre-oxidation and hydrolysis with KMnO4 of (b) 1 wt.% (c) 3 wt.% (d) 5 wt.% compared to (a) SLC made by carbonization at 400°C. (B) RSAC made with activation at 500°C and peroxidation and hydrolysis with KMnO4 of (b) 1 wt.% (c) 3 wt.% (d) 5 wt.% compared to (a) RSC made by carbonization at 400°C
3.7 XRD of Charcoal and Activated Carbon Products
The powder X-ray diffractograms of charcoals made from SL and RS are presented in Fig. 3A,B, respectively. The intensities of peaks corresponding to cellulose (at approximately 2θ = 15°, 22°, and 34.5°) [7] decrease with increasing carbonization temperature from 250°C to 400°C for both charcoal products. There are no peaks corresponding to hemicellulose and lignin in the XRD traces of the products. This is because they have an amorphous nature [2]. The presence of a broad band in the 2θ range of 21° and 25° (carbon amorphous structure) and a weak peak at 2θ = 43.5° (graphite structure) indicate that the carbon has mainly an amorphous structure [38]. These features become clearer with increasing carbonization temperature. Similar observations have been made for the relatively weak diffraction peaks of silica (2θ = 22°, 24.5°, and 28.5°, [32], CaO (2θ = 38°), and K2O (2θ = 40.5°) [39], which appeared after carbonization. After activation at 500°C of charcoals that were made by carbonization at 400°C and pre-oxidized and hydrolyzed with KMnO4, the XRD peaks for cellulose disappeared in SLAC and RSAC products (Fig. 3C,D). On the other hand, new peaks at 2θ = 29.5° and 36° appeared in all activated carbon products and were attributed to the α-MnO2 crystal structure [7]. The observations made from XRD patterns and FTIR spectra indicate that Si and Mn form surface functional groups and crystalline compounds in both products. However, Si and Mn compounds are mostly in amorphous forms with relatively low XRD peak intensities. This is because these compounds do not completely crystallize at 500°C. Moreover, the XRD peaks of CaO are also of relatively low intensity. This may be attributed to the dissolution of CaO during boiling in KMnO4 solution. In addition, the content of amorphous structures of graphitic carbon increased for all activated carbon products after pre-oxidation-hydrolysis and activation. This indicated that the pre-oxidation-hydrolysis and activation has caused an increase in disorder of the structures of the charcoal intermediates. It was shown that the extended conjugated π-orbital system of graphite is destroyed [36]. These results are consistent with the results observed by FTIR.
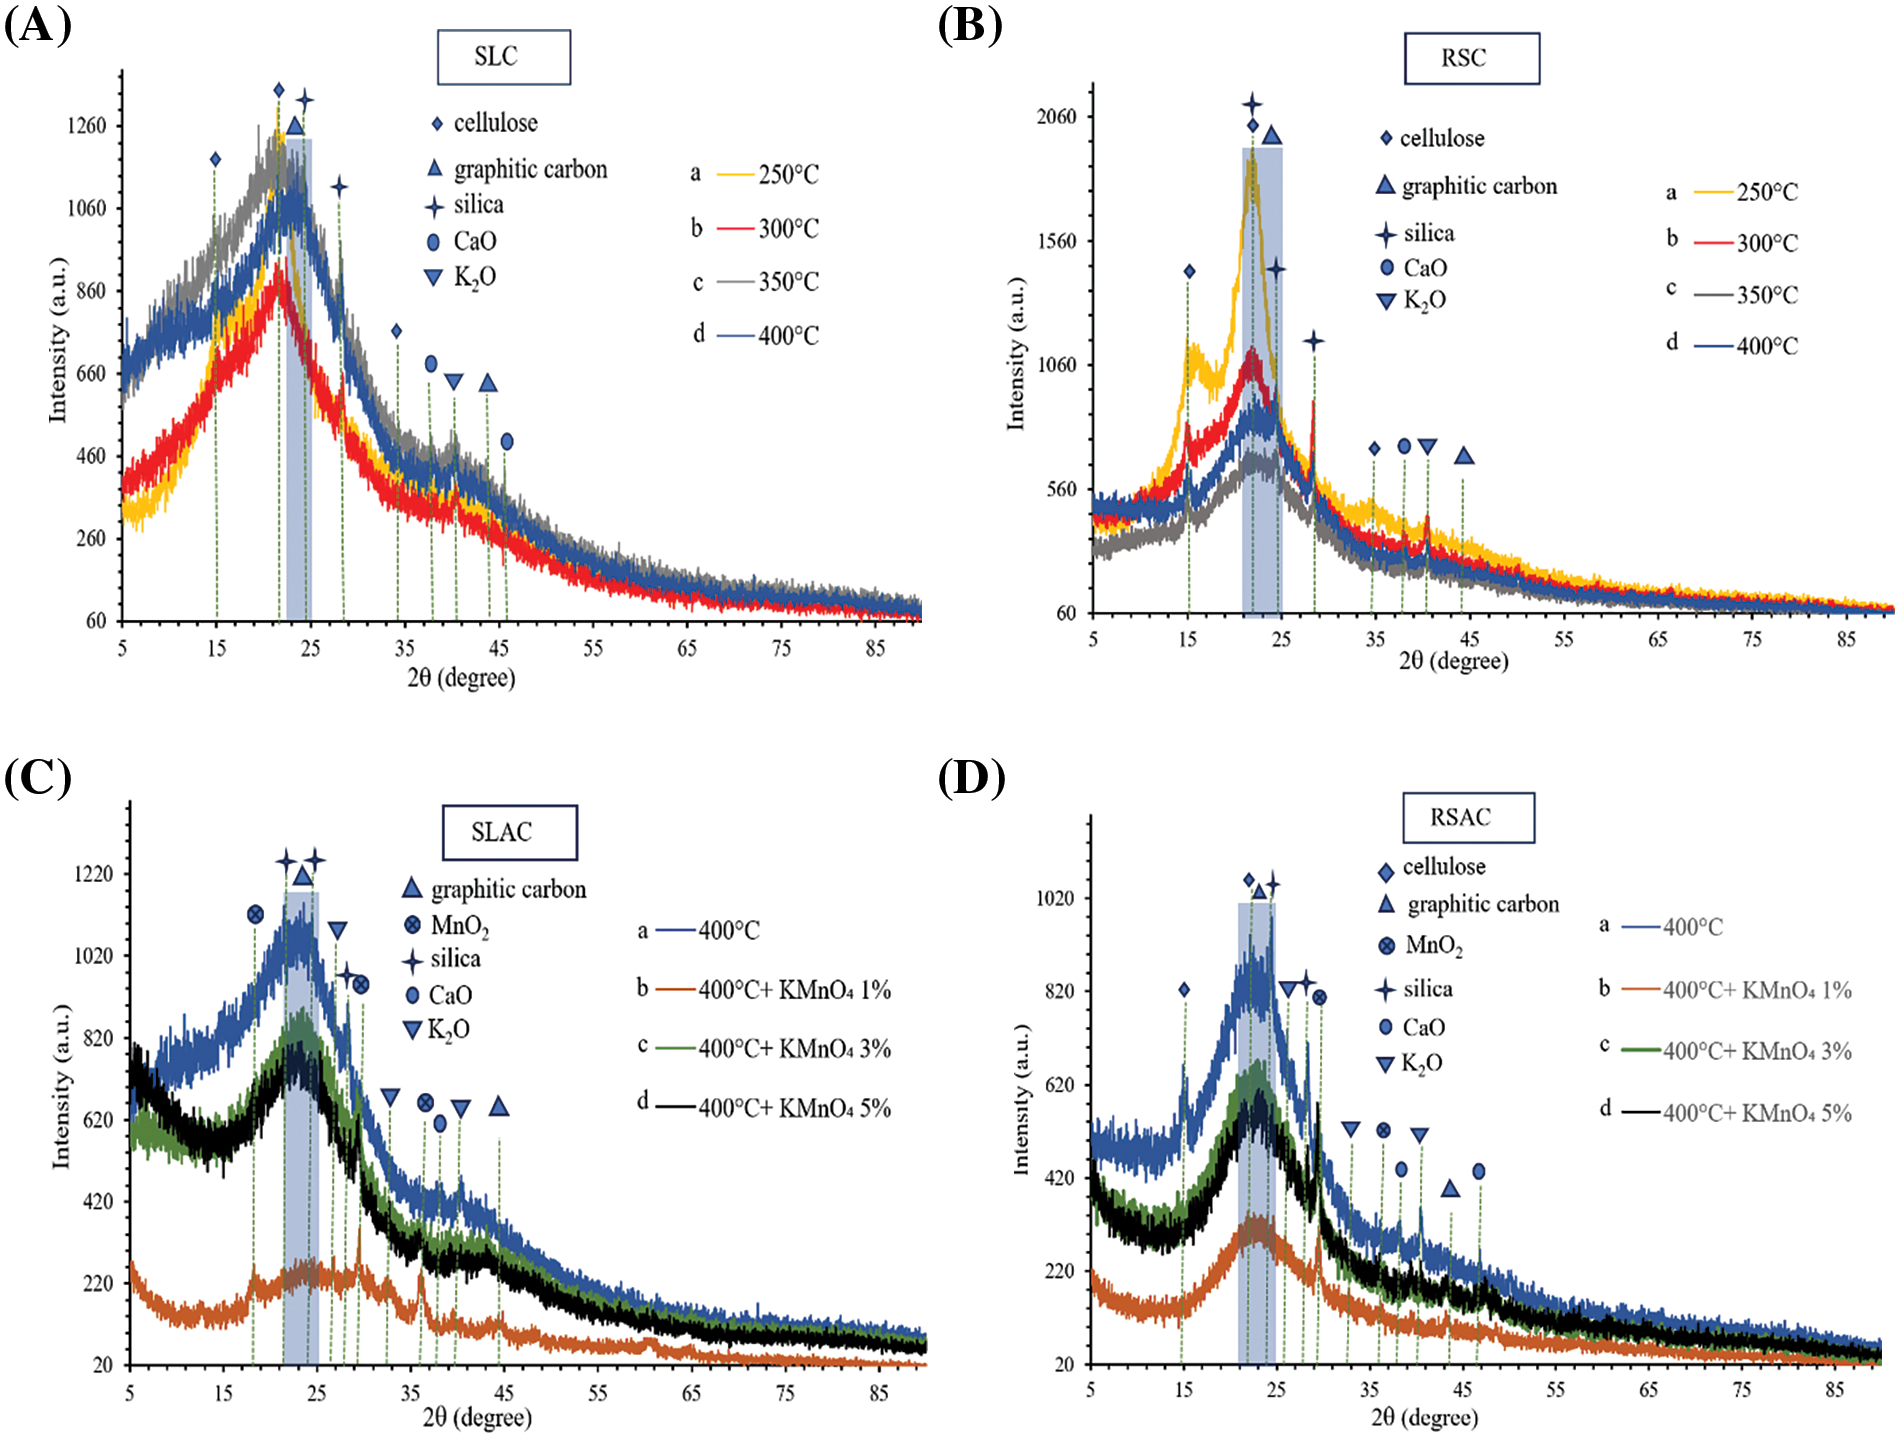
Figure 3: XRD patterns of (A) SLC made by carbonization at (a) 250°C (b) 300°C (c) 350°C, and (d) 400°C. (B) RSC made by carbonization at (a) 250°C (b) 300°C (c) 350°C, and (d) 400°C. (C) SLAC made by activation at 500°C after pre-oxidation and hydrolysis with KMnO4 of (b) 1 wt.% (c) 3 wt.% (d) 5 wt.% compared to (a) rice straw charcoal made by carbonization at 400°C. (D) RSAC made by activation at 500°C after pre-oxidation and hydrolysis with KMnO4 of (b) 1 wt.% (c) 3 wt.% (d) 5 wt.% compared to (a) rice straw charcoal made by carbonization at 400°C
SEM images of the SLC and SLAC products are shown in Fig. 4. SLC exhibits condensed texture with some small, adhered particles on a smooth surface containing original burrows and holes of SL (Fig. 4A,B), which constitute the channels that allow the solution to reach the carbon surface well. This observation confirmed the degradation of the original SL material by thermal carbonization. After activation of SLC, which was carbonized at the temperature of 400°C, with pre-oxidation, hydrolysis, and 500°C activation temperature, the SEM images of SLACs showed a larger amount of small, adhered particles, corrosion, and cleavage on the surface, as well as the presence of holes. By focusing on the point and enlarging the image, it can be seen that the surface of SLAC (Fig. 4D) has many small pores, while SLC is relatively smooth (Fig. 4B). The extent of these features increased with increasing wt.% KMnO4 used (Fig. 4C,D). These phenomena could be attributed to higher partial oxidation of surface carbon by KMnO4 and MnO2 production. It should be noted that the surface particles on SLC (Fig. 4B) are relatively weakly adhered, while surface particles on SLACs are firmly attached. This shows that some ash has disappeared while MnO2 clumped on the surface. However, SEM images of SLAC made using 5 wt.% KMnO4 for the pre-oxidation-hydrolysis treatment showed collapsed and shriveled structures on the surface together with holes (Fig. 4E). It was shown that extensive oxidation of carbon by 5 wt.% KMnO4 took place. Similar results were observed in RSC (Fig. 5A) and RSACs (Fig. 5B–D). However, it seems that RSACs are less affected by KMnO4 pre-oxidation-hydrolysis. This was attributed to the structure hardness of RS, which is higher than that of SL. Another reason for this observation is the difference in the content of volatile matter. SL has high content of volatile matter, which leads to the formation of fine particles and porous charcoal products. All SEM results were consistent with the BET measurements, which revealed an increase in the surface areas of the products in response to wt.% KMnO4 increasing from 1% to 3% followed by surface area decrease after increasing KMnO4 concentration to 5 wt.%. Therefore, the SLAC and RSAC products made with pre-oxidation-hydrolysis using 3 wt.% KMnO4 were collected for Fe(III) adsorption experiments.

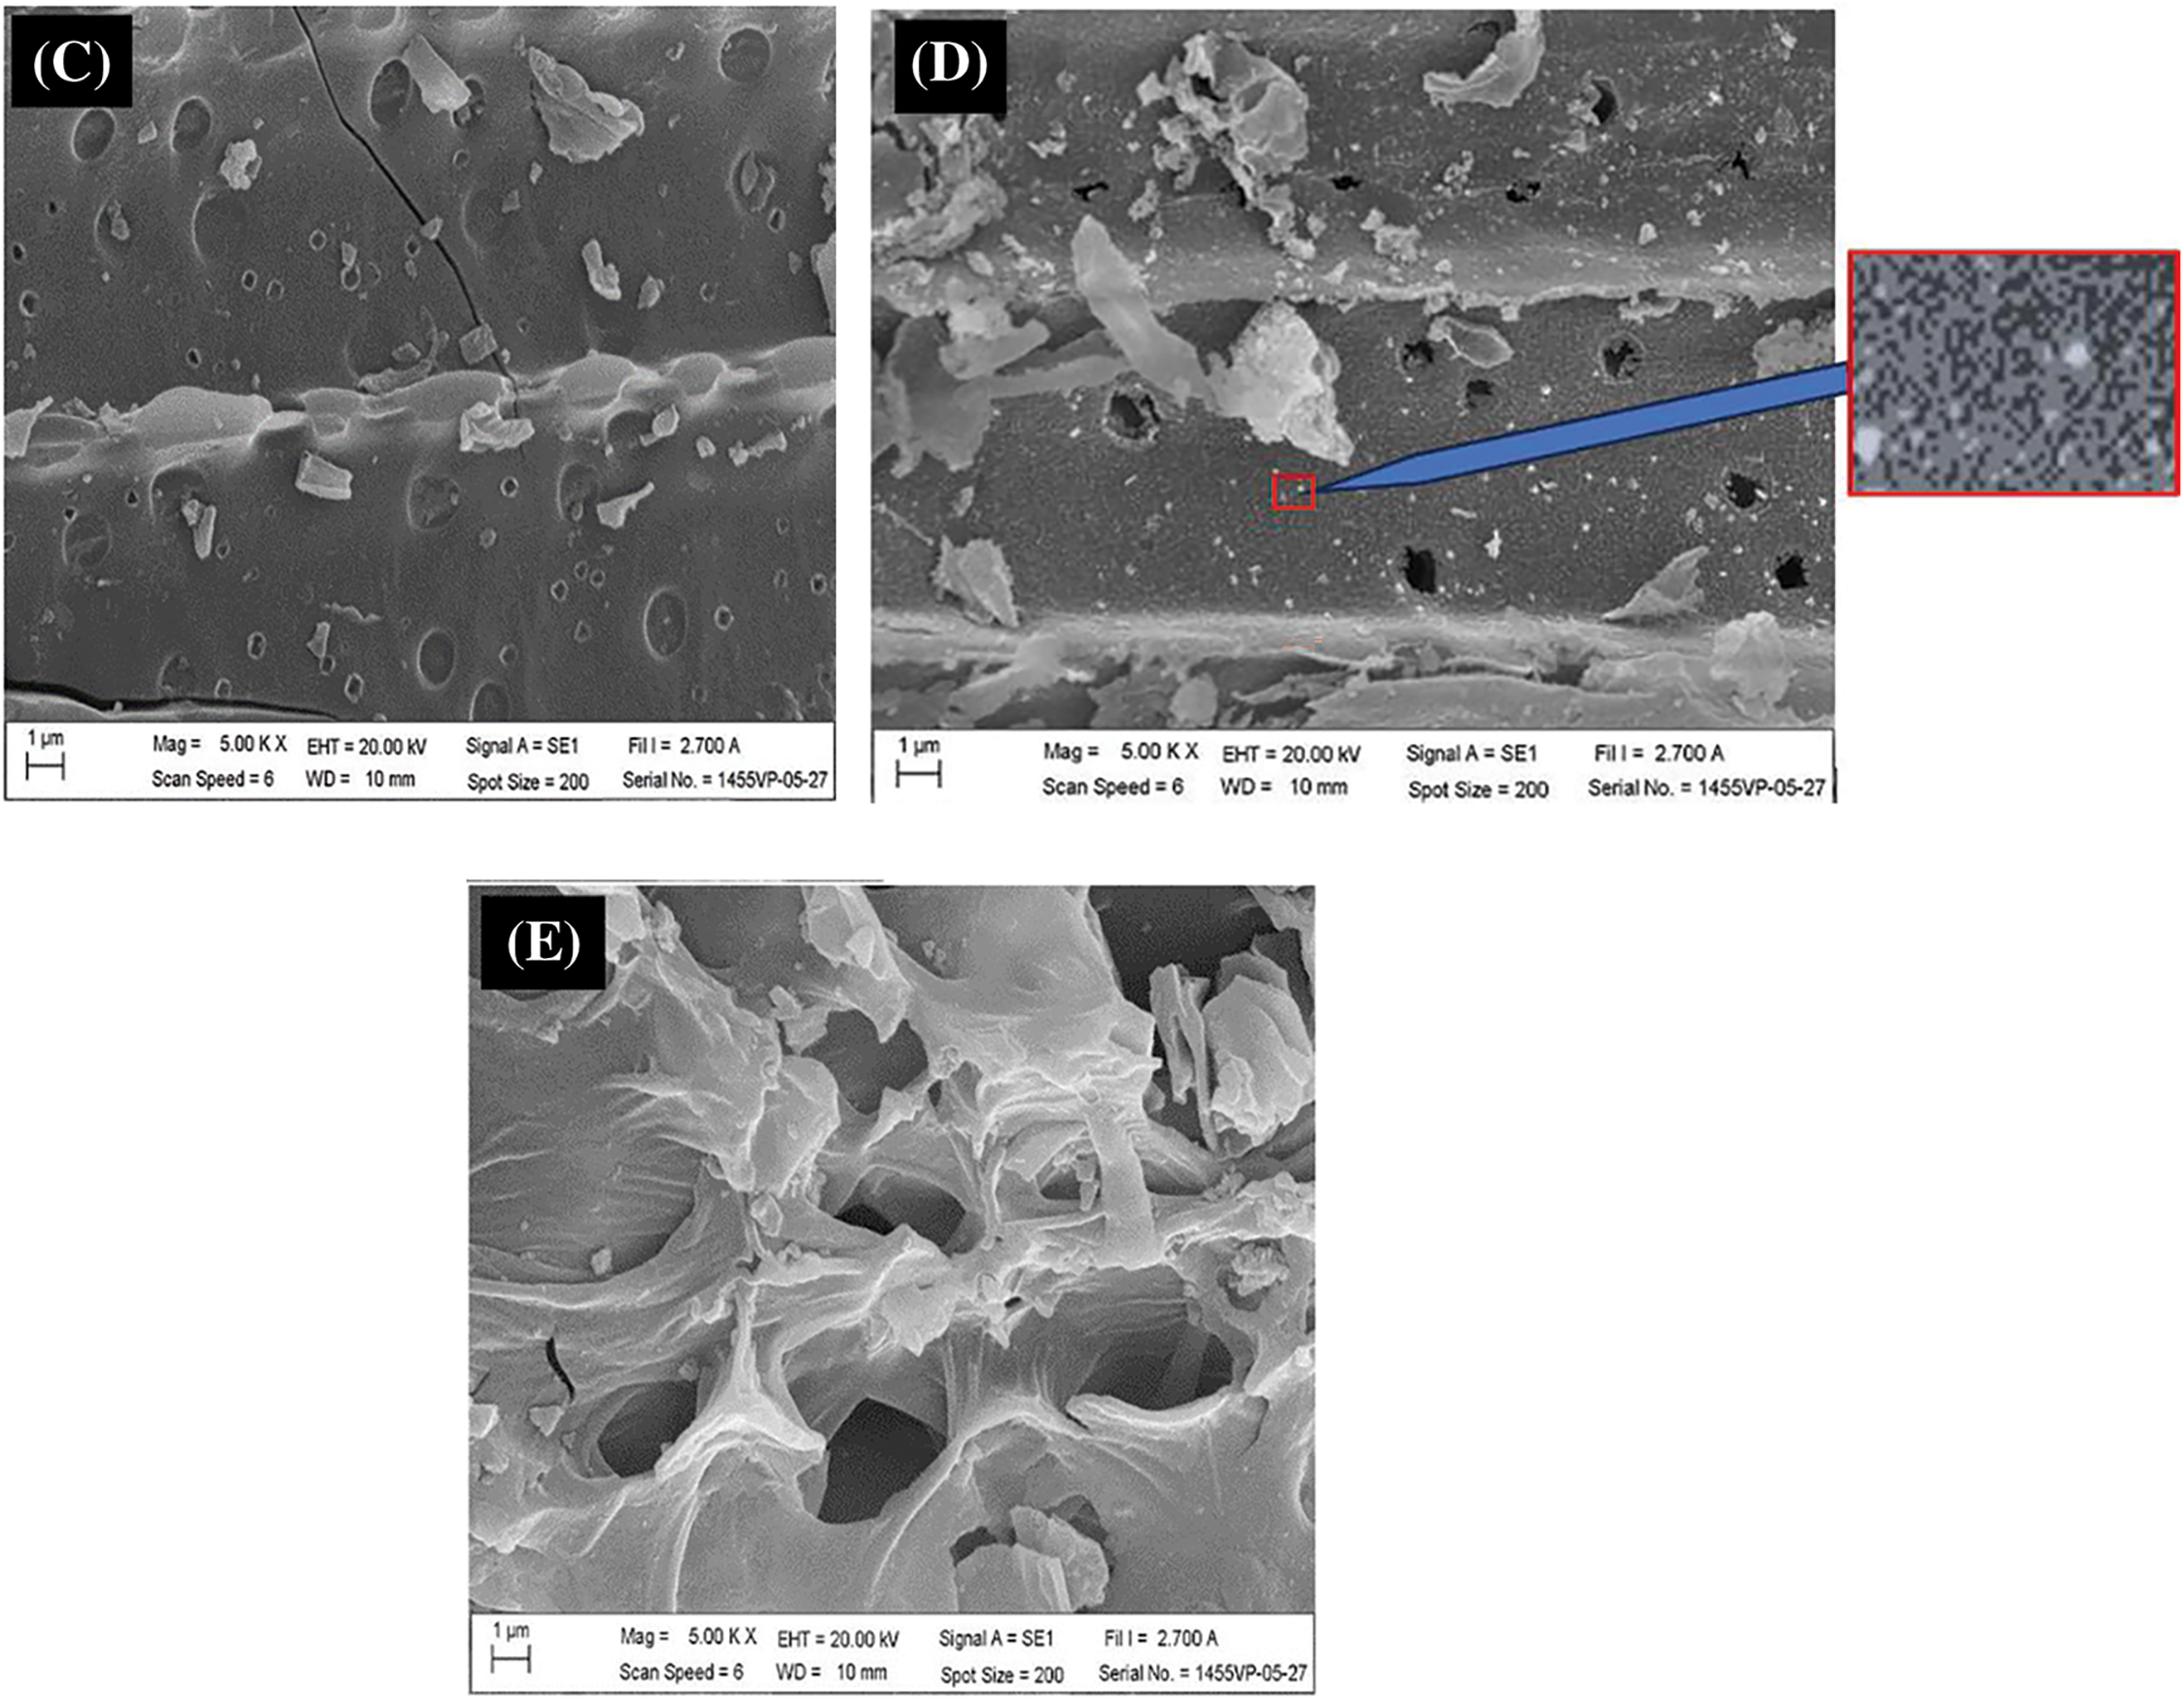
Figure 4: SEM images of (A) cross section of SLC made by carbonization at 400°C (B) SLC with carbonization at 400°C (C) SLAC from SLC made with carbonization at 400°C and activation with 1 wt.% KMnO4 and 500°C (D) SLAC from SLC made with carbonization at 400°C and activation with 3 wt.% KMnO4 and 500°C (E) SLAC from SLC made with carbonization at 400°C and activation with 5 wt.% KMnO4 and 500°C
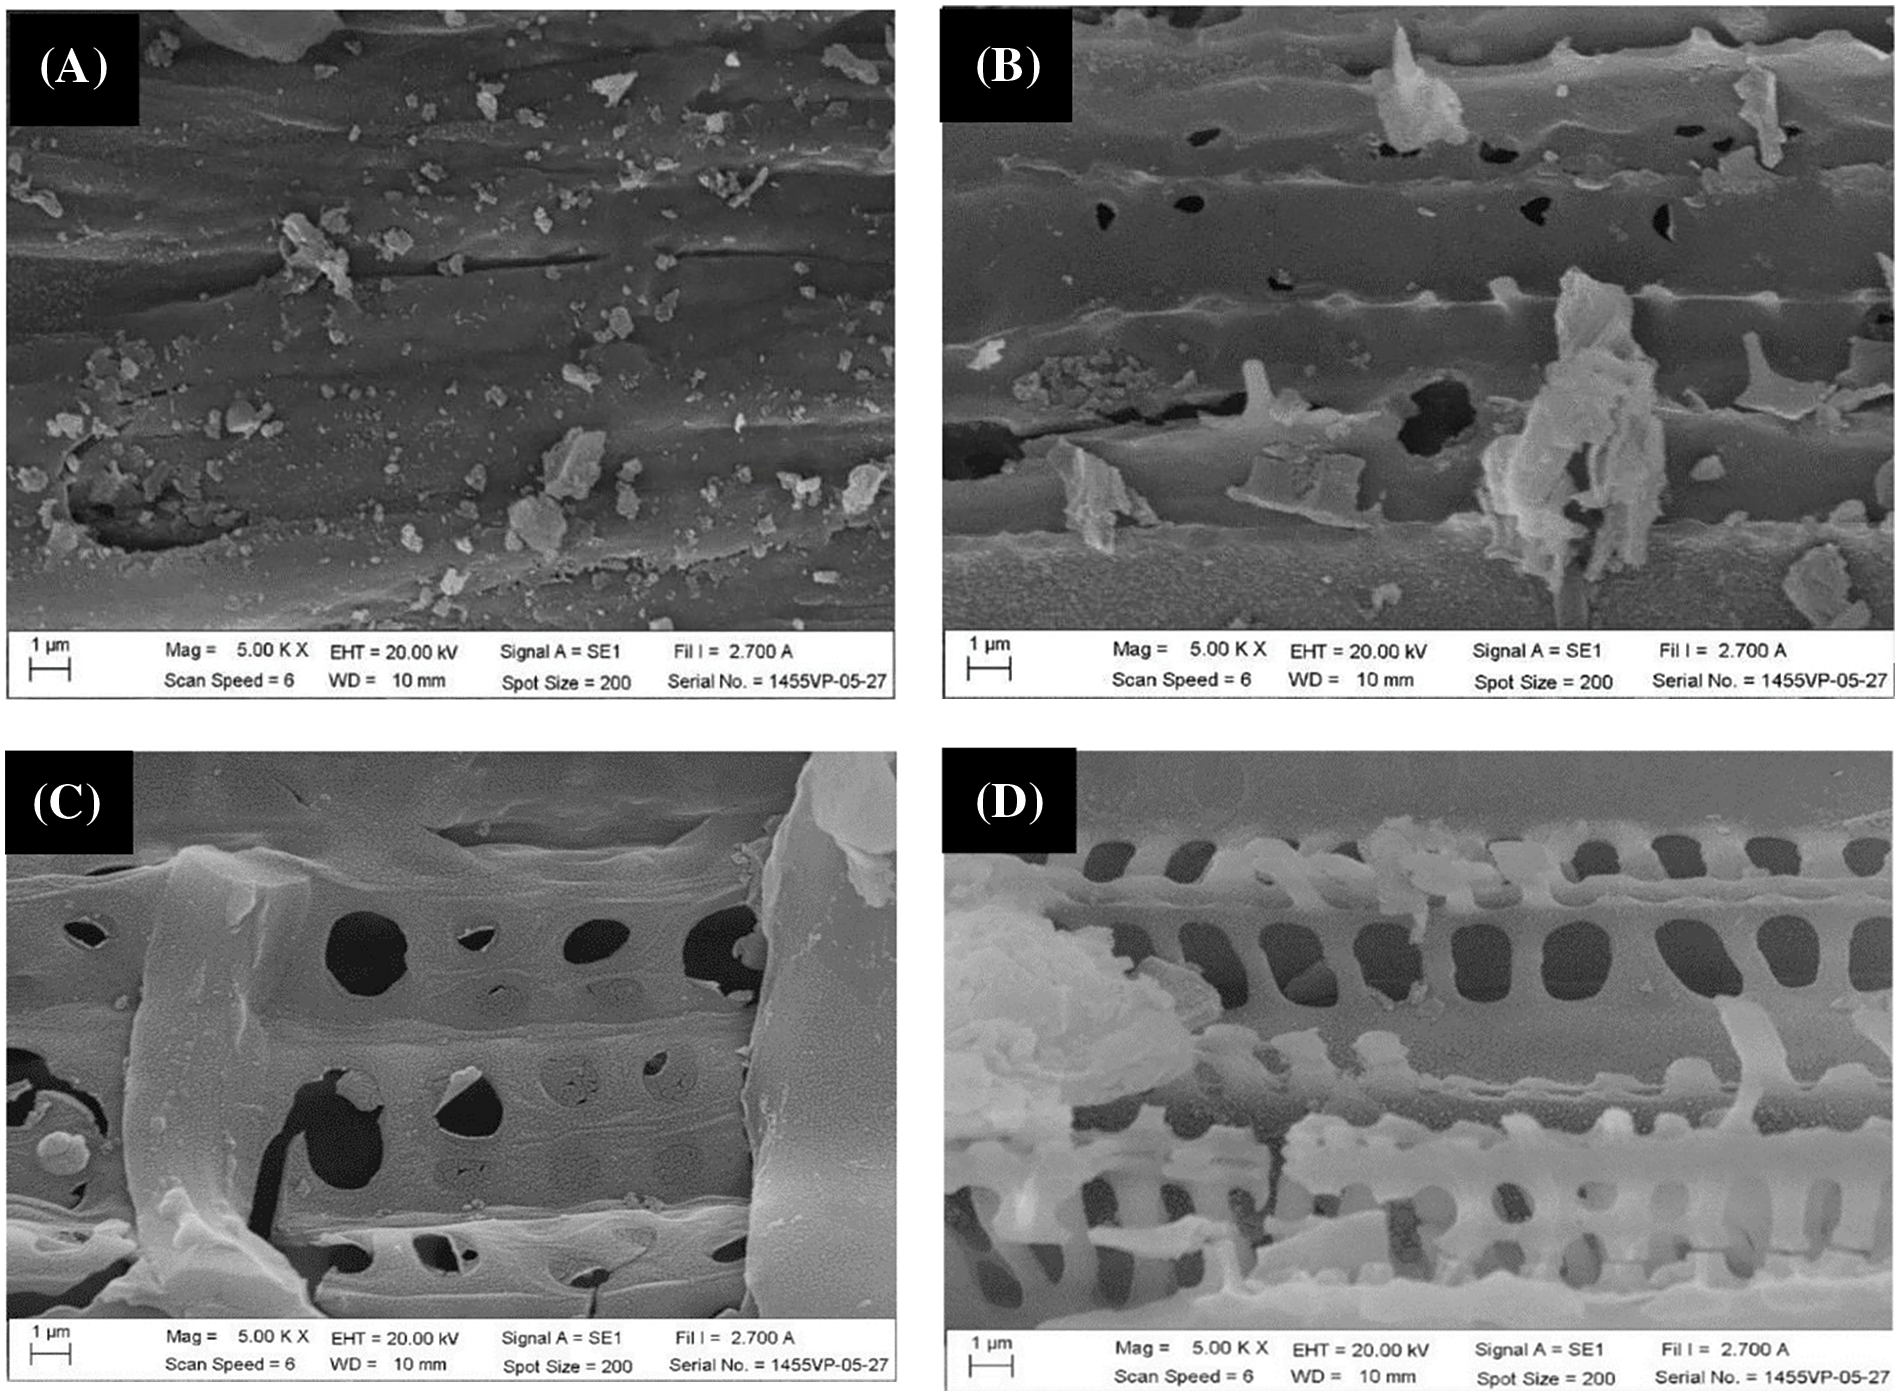
Figure 5: SEM images of (A) RSC made with carbonization at 400°C (B) RSAC from RSC made with carbonization at 400°C and activation with 1 wt.% KMnO4 and 500°C (C) RSAC from RSC made with carbonization at 400°C and activation with 3 wt.% KMnO4 and 500°C (D) RSAC from RSC made with carbonization at 400°C and activation with 5 wt.% KMnO4 and 500°C
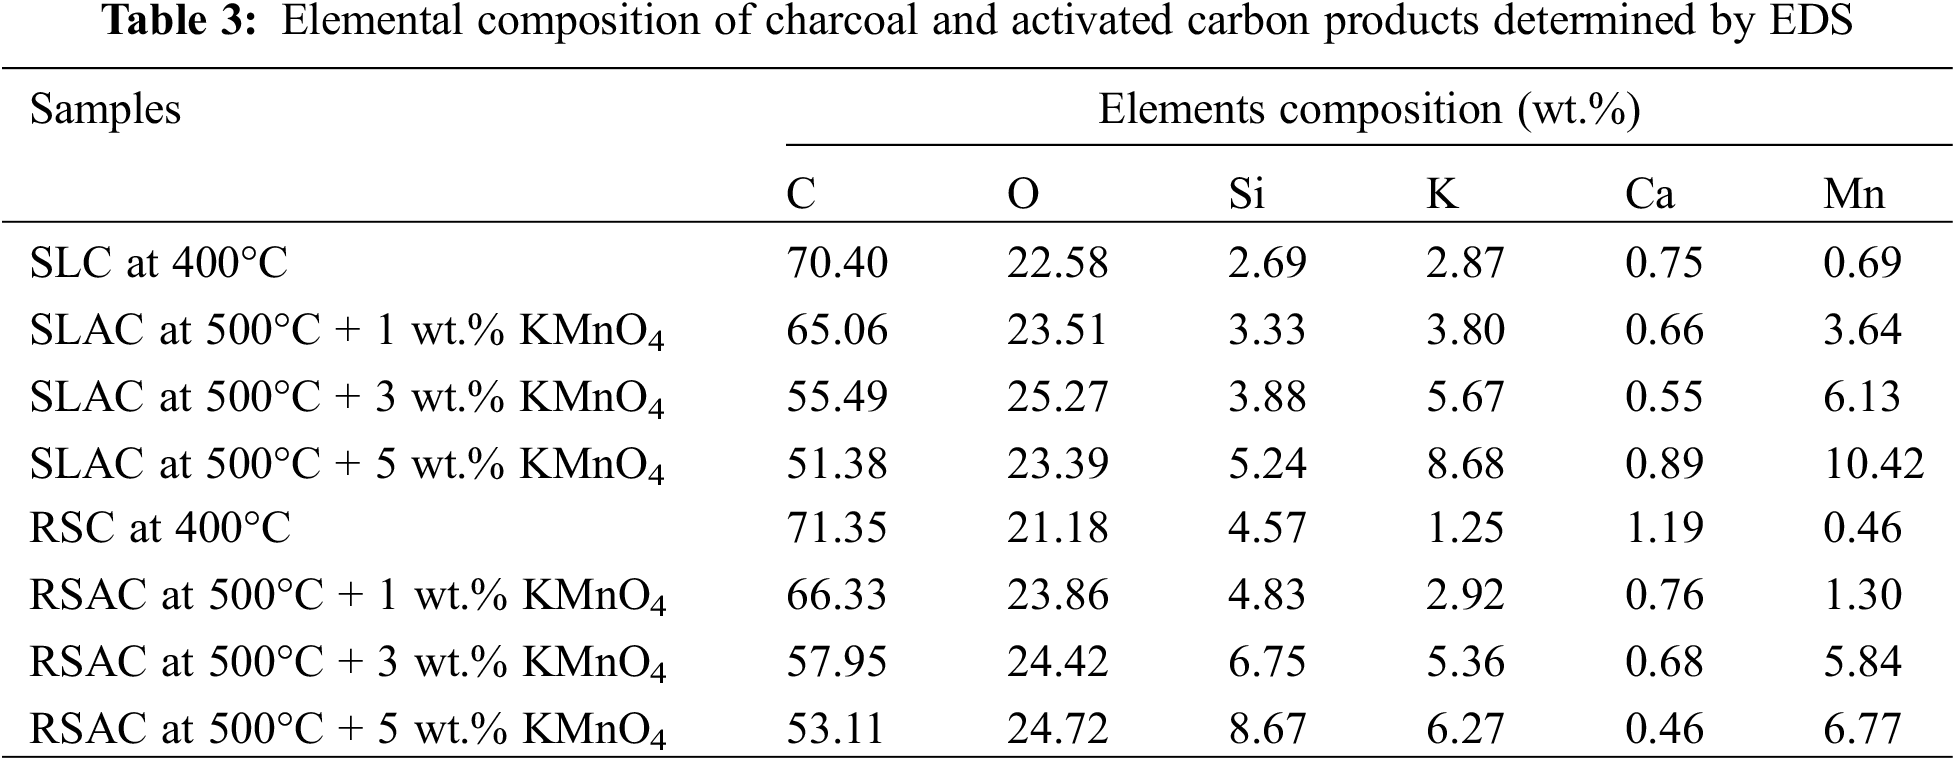
3.9 Elemental Composition Determined by EDS
The O, Si, K, Ca, and Mn contents of SLACs and RSACs increased while C and Ca contents decreased with increasing KMnO4 concentration from 1 to 5 wt.% (Table 3). The O, K, and Mn contents increased in both activated carbon products and are present due to KMnO4-mediated oxidation during activation, which created the oxygen-containing surface functional groups on the activated carbon products. On the other hand, the C content decreased in activated carbon products, which is also due to the oxidation by KMnO4, which created micropores and expanded micropores to mesopores. The decrease in Ca content was attributed to the dissolution during boiling in aqueous KMnO4 solution. The Si content, which originates from the SL and RS precursors, increased proportionally to the reduction of C content. It was seen that the K and Mn content also originated from the SL and RS precursors. Furthermore, the O content has originated in the charcoals during production by carbonization. These results, for all the products, are consistent with the FTIR results, which confirmed the effects of carbonization and KMnO4 pre-oxidation and hydrolysis. A comparison between SLACs and RSACs shows that the C and Si contents of RSACs are relatively higher than the contents for these elements in SLACs. This was attributed to the highly condensed structure and high Si content of RS, which is higher than that of SL. The KMnO4 oxidation cannot access the inside of highly condensed materials.
3.10.1 Adsorption Equilibrium Time
Fe(III), which can cause serious health problems at high levels (WHO limit in drinking water is 2 mg/L) such as stomach cramps, skin irritations, vomiting, nausea, and anemia, is a contamination ion found in surface water [40]. Therefore, Fe(III) adsorption by activated carbon products made in this work was studied. Fig. 6 shows the percent removal of Fe(III) by SLAC (Fig. 6B) and RSAC (Fig. 6A) products vs. contact time (min) plotted for the determination of adsorption equilibrium time. The experiment has revealed that the percentage of adsorbed Fe(III) increased with increasing contact time and achieved equilibrium at about 60 min with both activated carbon products. For approximately the first 20 min of contract time, the Fe(III) ions removal proceeds with a very fast rate. This is attributed to a large number of vacant surface sites available on the activated carbons, which are exposed to Fe(III) ions during initial contact time. In this range of contract time, equilibrium between the amount of adsorbed Fe(III) ions on the activated carbons and the amount of Fe(III) ions remaining in the solution is not achieved yet due to the active sites of the activated carbons not being fully occupied by Fe(III) ions. Another reason is that the high Fe(III) concentration in solution during the initial phases of contact time provides a high driving force to overcome all mass transfer resistances between the solid and liquid phases [41]. After that, the number of these surface functional group sites available for Fe(III) binding decreases and the slope flattens as the adsorption rate decreases [42]. At a 60-min contact time, the amount of adsorbed Fe(III) ions on the activated carbons and remaining in the solution were in an equilibrium [41]. The comparison between SLAC and RSAC shows that the percent Fe(III) removal is higher for SLAC than for RSAC at all contact time points. This is the case even though SLAC made using pretreatment with 3 wt.% KMnO4 has a higher surface area than the corresponding RSAC (Table 2). This shows that oxygen-containing surface functional groups on the activated carbon materials have a significant effect on Fe(III) adsorption. This is because the oxygen-containing surface functional groups on activated carbon materials are negatively charged due to deprotonation in aqueous solution at pH 7, while the hydrated Fe(III) ion has a positive charge. Thus, Fe(III) adsorption on activated carbon materials is mainly chemisorption driven by electrostatic attraction between Fe(III) and oxygen-containing surface functional groups. However, hydrated Fe(H2O)63+, which has a diameter of only 0.92 nm [43], can easily diffuse on the surface of the activated carbon materials. This is due to the fact that the size of Fe(H2O)63+ is smaller than the size of a micropore (2 nm diameter). Therefore, Fe(H2O)63+ could diffuse easily through mesopores as well as micropores of the activated carbon materials. MnO2, which was formed from oxidation reactions mediated by KMnO4, could also adsorb Fe(III) with strong attraction and then be retained on the activated carbon surface. The Fe(III) adsorption on both activated carbon materials is quite a fast process. It was shown that both activated carbon products contain a high amount of oxygen-containing surface functional group sites and accumulated MnO2. At 60-min equilibrium, the calculated amount of adsorbed Fe(III) from a 50 mg/L Fe(III) solution was 23.0 and 22.5 mg/g by SLAC and RSAC, respectively. The experiments used to determine the adsorption isotherm were performed with a duration of 60 min.
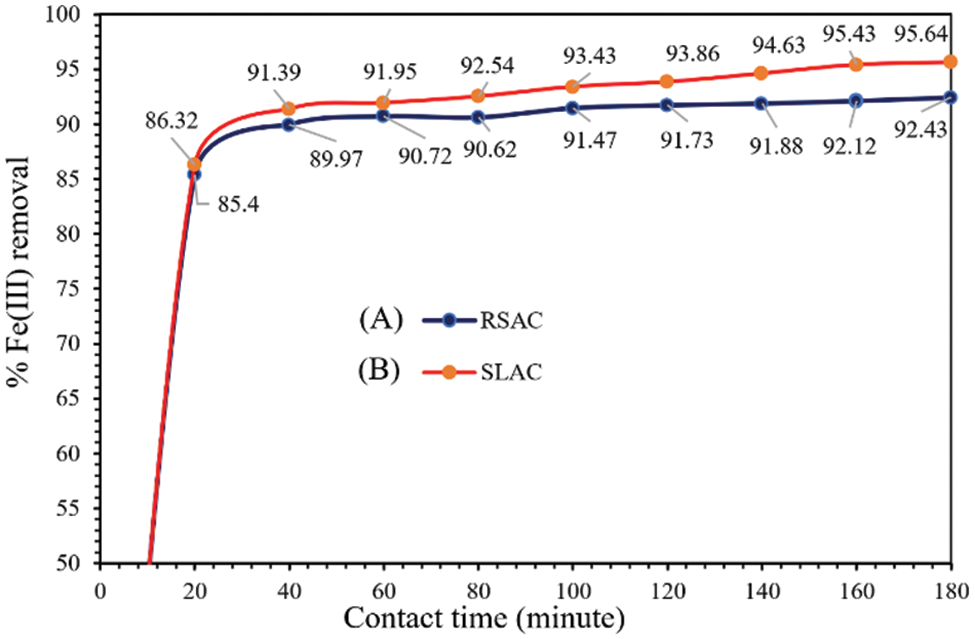
Figure 6: Effect of contact time on Fe(III) removal by (A) RSAC and (B) SLAC
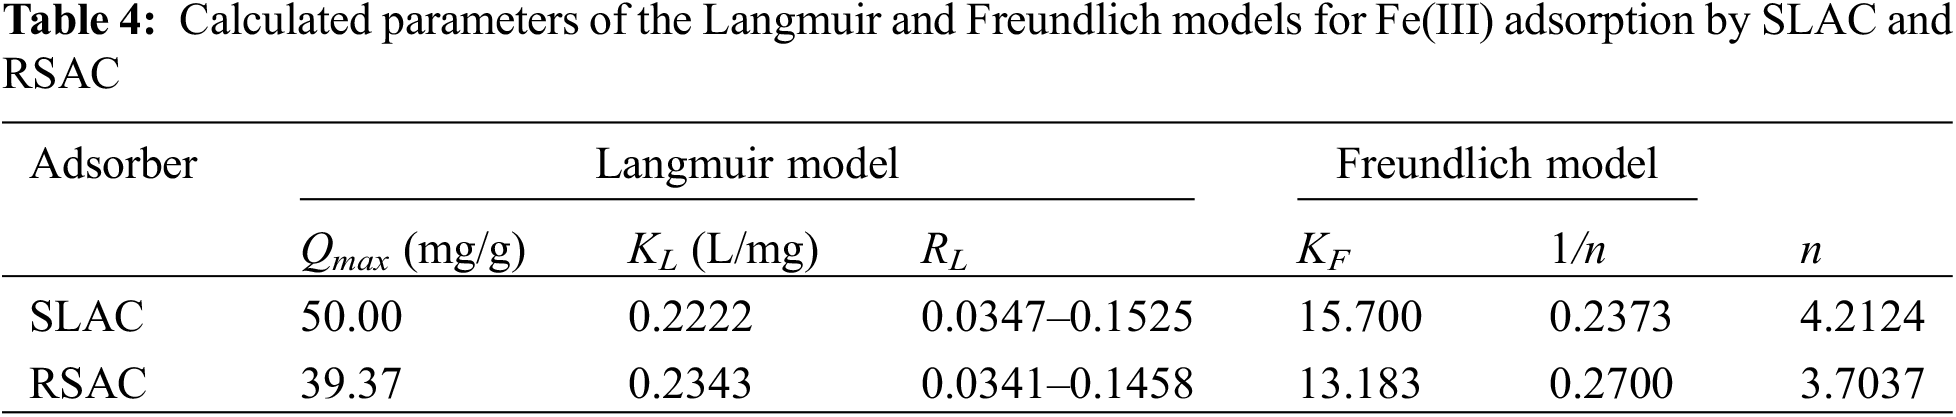
The results of the determination of adsorption isotherms are shown in Fig. 7. The data shows that both of Freundlich (Fig. 7A,B) and Langmuir (Fig. 7C,D) models provide suitable fits of the experimental data with similar correlation coefficient (R²) values. This indicates that the mechanism of Fe(III) adsorption by both activated carbons is possible in either homogenous or heterogeneous systems. However, the correlation coefficient values for the Freundlich models are marginally higher than those for the Langmuir model. Therefore, the heterogeneous system of the activated carbons is more plausible than the homogenous system. Considering the results in terms of the Freundlich isotherm model, adsorption of the Fe(III) on both activated carbons takes place at heterogeneous sites and involves multilayer adsorption on surfaces with varied affinities [44]. This is confirmed by 1/n values from Freundlich models for both activated carbons (Table 4), which are in the range between 0 and 1. This indicates that Fe(III) adsorptions by the activated carbons are associated with chemisorption by different binding sites and a favorable adsorption process. Furthermore, these values are closer to 0, which is attributed to the high content of heterogeneous sites and energetically heterogeneous adsorption [45] with strong interaction between the activated carbon sorbents and Fe(III). This result is confirmed by high KF values (Table 4), which describe the adsorption strength or reflect the relative potential of adsorption [46]. The heterogeneous nature of the systems of the activated carbon materials is confirmed by FTIR results, which showed the presence of many different surface functional groups. However, the Mn-O surface functional groups and MnO2 are the main components. Furthermore, the calculated n value of this model fell in the range of 1–10, which indicates good efficiency and favorable adsorption [44]. In addition, the Freundlich model also describes multilayer adsorption and assumes exponential decay in the energy distribution of adsorbed sites [47]. This shows that the activated carbon products could adsorb more Fe(III) by multilayer adsorption at high concentrations of Fe(III). The Langmuir isotherm model describes adsorption as a monolayer sorption process on a fixed number of functional group sites, which are energetically equivalent, and where each functional group site is occupied by one adsorbed species, which does not interact with itself [47]. In this study, the adsorption of Fe(III) on the activated carbon materials also exhibits some homogenous system characteristics for Fe(III) concentrations in the range 25–125 mg/L and 0.1 g dosage of activated carbon sorbents. In addition, the values of RL for Fe(III) adsorption derived from the Langmuir model are in the range of 0 to 1 for both SLAC and SRAC (Table 4), which shows that the adsorption of Fe(III) on the surface of both activated carbon materials is monolayer adsorption, where each Fe(III) ion is adsorbed in a single sorption site with no transmigration of the Fe(III) ion in the surfaces with unity of energies [42]. These results may be attributed to the low concentration of Fe(III) involved in only monolayer sorption occurring on the surface layer. This is confirmed by the low values of Langmuir’s constant KL (Table 4), which describe the adsorption equilibrium. In addition, it is possible that Fe(III) absorption occurs mainly on the Mn-O surface functional groups. Therefore, Fe(III) could be adsorbed by MnO2 and then accumulated on activated carbon materials by physisorption. Furthermore, RL values for both activated carbon materials increase with increasing Fe(III) concentration. This shows that Fe(III) adsorption capacities of the activated carbon products increase as Fe(III) concentration increases. This is due to the high Fe(III) concentration in the solution, which provides high driving force to overcome all mass transfer resistances between the solid and liquid phases [41]. Finally, the calculated maximum Fe(III) adsorption capacity, based on the Langmuir model (Table 4), is higher for SLAC (50.00 mg/g) than for RSAC (39.37 mg/g). This is because the SLAC material has a relatively higher surface area (Table 2). The maximum Fe(III) adsorption capacities of both SLAC and RSAC are higher than Zeolite (9.73–10.19 mg/g), bentonite (11.64–16.65 mg/g) [47], and coconut shell-based GAC (0.17 mg/g) [48].
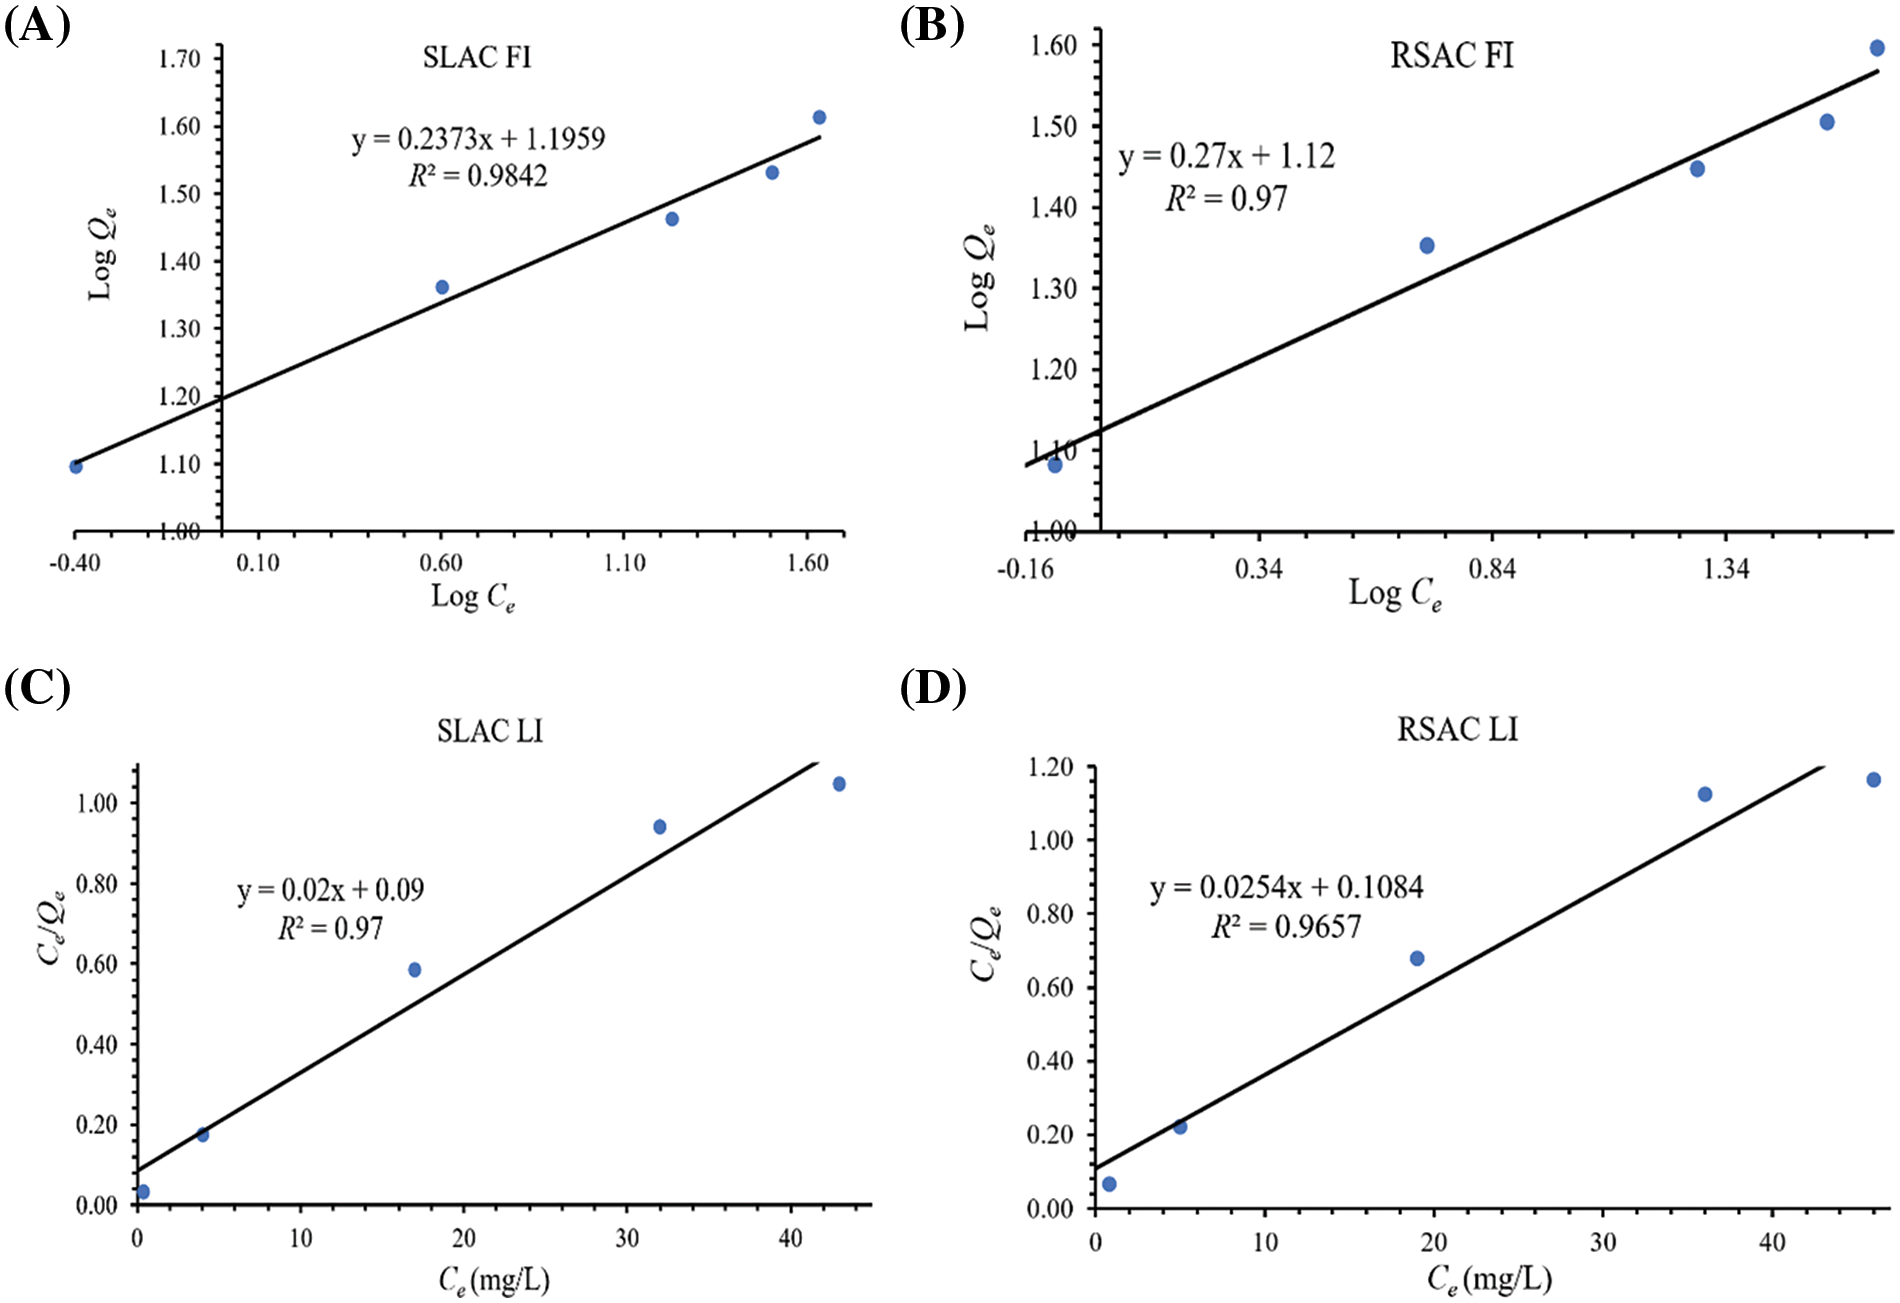
Figure 7: Freundlich and Langmuir models of Fe(III) adsorption isotherms by SLAC ((A) and (C)) and RSAC ((B) and (D)), respectively
The amount of volatile matter of SL is relatively higher than that of RS, which has the effect of the percent yield of SLC being lower than that of RSC. However, the percent yields of both charcoals are relatively constant for carbonization temperatures of 350°C–400°C. The FTIR results indicate that the content of cellulose, hemicellulose, and lignin decreases with increasing carbonization temperatures from 250°C to 400°C. On the other hand, C–O, Si–O–C, and Si–O–Si bonds are appeared as a result of carbonization. Moreover, it was seen that C–O stretching blue-shifted in both charcoals in response to increasing carbonization temperature from 250°C to 400°C. The FTIR transmissions of SLC and RSC showed vibration of only low intensity for organic functional groups after carbonization at 400°C. Therefore, charcoals made by carbonization at 400°C were collected for a subsequent activation step. After pre-oxidation-hydrolysis of SLC and RSC by boiling in 1–5 wt.% KMnO4 aqueous solution and 500°C activation treatment, the percent yields of SLAC and RSAC decreased greatly with increasing percent weight of KMnO4. It was also observed that the remaining volatile matter and ash in charcoals were dissolved during the hydrolysis in boiling water. The iodine number and methylene blue number values of SLCs and RSCs increased with increasing carbonization temperatures from 250°C to 400°C. Furthermore, it was found that the porosity of all derived charcoals has the predominant characteristics of micropores (~2 nm), while the average pore sizes of all activated carbons are higher than 2 nm after activation. The surface area and pore volume values exhibit a similar behavior. However, these values for both activated carbon products decreased when 5 wt.% KMnO4 was used for pre-oxidation and hydrolysis. Likewise, the functional groups C–O, Si–O, Si–O–Si, and Si–O–C also appeared on the activated carbon products. The intensities of peaks corresponding to functional groups O–H, Si–OH, and Mn–O, which appeared after activation, increased with increasing wt.% of KMnO4 used. In addition, a red shift of the C=C in-plane vibration of the C=C bonds in activated carbon products was observed with increasing wt.% of KMnO4. Moreover, MnO2 crystals also accumulated on the surface of activated carbon products The SEM images of the activated carbon materials showed higher content of small, adhered particles, corrosion, and cleavage of the surface with holes with increasing wt.% of KMnO4. However, the surface and holes of the activated carbons collapsed and shriveled when 5 wt.% KMnO4 was used for pre-oxidation and hydrolysis. Furthermore, it was seen that RSACs are less affected by KMnO4 pre-oxidation and hydrolysis The Fe(III) adsorption experiments have shown that absorption equilibrium for the activated carbon materials is achieved at about 60 min. Both Freundlich and Langmuir isotherm models could fit the experimental data for Fe(III) adsorption on 3 wt.% KMnO4 SLAC and RSAC well, for 25–125 mg/L of Fe(III) and 0.1 g dosage of activated carbon sorbents. This indicates that the mechanism of Fe(III) adsorption by both activated carbon materials exhibits both homogenous or heterogeneous systems. These are associated with physical and chemical adsorption by different binding functional group sites as well as by MnO2. However, the degree of heterogeneous adsorption is relatively higher than that of homogeneous. It shows that the activated carbons could adsorb Fe(III) by multilayer adsorption at high concentrations of Fe(III). Finally, the calculated maximum Fe(III) adsorption capacities from the Langmuir model are 50.00 and 39.37 mg/g for SLAC and RSAC, respectively. Therefore, it can be concluded that pre-oxidation and hydrolysis of charcoal materials made by carbonization at 400°C with KMnO4 in aqueous solution is a possible step for the production of activated carbon from SL and RS with low-pollution and cheap oxidants. From this research, it was concluded that the pre-oxidation and hydrolysis by boiling potassium permanganate solution of charcoal materials with remaining volatile substances could produce the high-quality activated carbons by low-temperature activation. The pre-oxidation and hydrolysis by KMnO4 aqueous solution at 100°C before activation of charcoals or carbonous materials is simplified, economical, and highly effective, which can reduce the activation temperature for activated carbon production. However, further studies are required to in one-step activation by pre-oxidation, hydrolysis of the starting biomass materials and then activation.
Acknowledgement: This research was partially financially supported by Department of Chemistry, Faculty of Science, Naresuan University.
Funding Statement: The authors received no specific funding for this study.
Author Contributions: The authors confirm contribution to the paper as follows: study conception and design: Sumrit Mopoung, Narissara Namkaew, Sasiwan Srikasaem; analysis and interpretation of results: Sumrit Mopoung, Narissara Namkaew, Sasiwan Srikasaem; draft manuscript preparation: Sumrit Mopoung. All authors reviewed the results and approved the final version of the manuscript.
Availability of Data and Materials: Data available on request from the authors. The data that support the findings of this study are available from the corresponding author (Sumrit Mopoung), upon reasonable request.
Conflicts of Interest: The authors declare that they have no conflicts of interest to report regarding the present study.
References
1. Hassan SS, Williams GA, Jaiswal AK. Emerging technologies for the pretreatment of lignocellulosic biomass. Bioresour Technol. 2018;262(37):310–8. doi:10.1016/j.biortech.2018.04.099. [Google Scholar] [PubMed] [CrossRef]
2. Ravindran R, Jaiswal S, Abu-Ghannam N, Jaiswal AK. Evaluation of ultrasound assisted potassium permanganate pre-treatment of spent coffee waste. Bioresour Technol. 2017;224(12):680–7. doi:10.1016/j.biortech.2016.11.034. [Google Scholar] [PubMed] [CrossRef]
3. Wang Y, Yuan T, Zhang Z, Lei Z, Shimizu K. Improved lignocellulose degradation prior to semi-dry anaerobic digestion of dairy manure via potassium permanganate treatment. Bioresour Technol Rep. 2020;11(11):100462. doi:10.1016/j.biteb.2020.100462. [Google Scholar] [CrossRef]
4. Lin T, Li L, Chen W, Pan S. Effect and mechanism of preoxidation using potassium permanganate in an ultrafiltration membrane system. Desalination. 2012;286(1–3):379–88. doi:10.1016/j.desal.2011.11.052. [Google Scholar] [CrossRef]
5. Wang K, Wang K, Chen Y, Liang S, Guo C, Wang W, et al. Adsorption-desorption behavior of malachite green by potassium permanganate pre-oxidation polyvinyl chloride microplastics. Environ Technol Innovation. 2023;30:103138. doi:10.1016/j.eti.2023.103138. [Google Scholar] [CrossRef]
6. Liu C, Liu H, Liu L. Potassium permanganate as an oxidant for a microfluidic direct formate fuel cell. Int J Electrochem Sci. 2019;14(5):4557–70. doi:10.20964/2019.05.01. [Google Scholar] [CrossRef]
7. Zhang Y, Wan Y, Zheng Y, Yang Y, Huang J, Chen H, et al. Potassium permanganate modification of hydrochar enhances sorption of Pb(IICu(IIand Cd(II). Bioresour Technol. 2023;386(2):129482. doi:10.1016/j.biortech.2023.129482. [Google Scholar] [PubMed] [CrossRef]
8. Fang Y, Ellis A, Uchimiya M, Strathmann TJ. Selective oxidation of colour-inducing constituents in raw sugar cane juice with potassium permanganate. Food Chem. 2019;298(3):125036. doi:10.1016/j.foodchem.2019.125036. [Google Scholar] [PubMed] [CrossRef]
9. Mineo A, Leto YD, Cosenza A, Capri FC, Gallo G, Alduina R, et al. Enhancing volatile fatty acid production from sewage sludge in batch fermentation tests. Chemosphere. 2024;49(3–4):140859. doi:10.1016/j.chemosphere.2023.140859. [Google Scholar] [PubMed] [CrossRef]
10. Ning P, Yang G, Hu L, Sun J, Shi L, Zhou Y, et al. Recent advances in the valorization of plant biomass. Biotechnol Biofuel. 2012;14(1):102. doi:10.1186/s13068-021-01949-3. [Google Scholar] [PubMed] [CrossRef]
11. Malik K, Sharma A, Harikarthik D, Rani V, Arya N, Malik A, et al. Deciphering the biochemical and functional characterization of rice straw cultivars for industrial applications. Heliyon. 2023;9:e16339. [Google Scholar] [PubMed]
12. Narzary A, Brahma J, Das AK. Utilization of waste rice straw for charcoal briquette production using three different binder. Clean Energ Syst. 2023;5:100072. [Google Scholar]
13. Ramos M, Laveriano E, Sebastián LS, Perez M, Jiménez A, Lamuela-Raventos RM, et al. Rice straw as a valuable source of cellulose and polyphenols: applications in the food industry. Trends Food Sci Technol. 2023;131:14–27. [Google Scholar]
14. Zhou Y, Qin S, Verma S, Sar T, Sarsaiya S, Ravindran B, et al. Production and beneficial impact of biochar for environmental application: a comprehensive review. Bioresour Technol. 2021;337:125451. [Google Scholar] [PubMed]
15. Zhang Y, Wang X, Duan Y, Li C, Cheng Y, Tao Y, et al. Biological-mechanical pretreated rice straw for constructing foam with mechanically robust and fire-retardant behaviors. Ind Crops Prod. 2023;204:117409. [Google Scholar]
16. Sinbuathong N, Sillapacharoenkul B, Palakas S, Kahraman U, Dincer I. Using sugarcane leaves and tops for exploiting higher methane yields: an assessment study. Int J Hydrogen Energy. 2022;47(77):32861–75. [Google Scholar]
17. Adigun OA, Oninla VO, Babarinde NA. Application of sugarcane leaves as biomass in the removal of cadmium(IIlead(II) and zinc(II) ions from polluted water. Int J Energ Water Resour. 2019;3:141–52. [Google Scholar]
18. Mbise E, said I, Minja RJ. Potential of using sugarcane leaves to produce pulp for paper making. J Textile Eng Fash Tech. 2012;3(1):32–5. [Google Scholar]
19. American Standard of Testing Material. Standard test method for volatile matter content of activate carbon: ASTM D 5832-98. Pennsylvania: American Society for Testing and Materials; 1998. [Google Scholar]
20. American Standard of Testing Material. Standard test method for total ash content of activate carbon: ASTM D 2866-11. Pennsylvania: American Society for Testing and Materials; 2011. [Google Scholar]
21. American Standard of Testing Material. Standard practice for proximate analysis of coal and coke: ASTM D 3172-13. Pennsylvania: American Society for Testing and Materials; 2021. [Google Scholar]
22. American Water Works Association. Standard test for determination of iodine number of granular activated carbon: AWWA B604-12. Colorado: American Water Works Association; 2012. [Google Scholar]
23. Japanese Industrial Standard. Standard test method for Activated Carbon, JIS K 1474-2014. Tokyo: Japanese Standards Association; 2014. [Google Scholar]
24. Mahmoud MA. Kinetics and thermodynamics of aluminum oxide nanopowder as adsorbent for Fe(III) from aqueous solution. Beni-Suef Univ J Basic Applied Sci. 2015;4:142–9. [Google Scholar]
25. Dai J, Ren FL, Ta CY. Adsorption behavior of Fe(II) and Fe(III) ions on thiourea cross-linked chitosan with Fe(III) as template. Molecules. 2012;17:4388–99. [Google Scholar] [PubMed]
26. Juli NBB, Talib N, Abas SRMY, Ahmad N, Alias AB. Characterization of Hydrogel and fly ash from biomass. Egypt J Chem. 2021;64(6):2819–25. [Google Scholar]
27. Cellatoğlu N, İlkan M. Torrefaction of solid olive mill residue. BioResources. 2015;10(3):5876–89. [Google Scholar]
28. Qanytah Q, Syamsu K, Fahma F, Pari G. Characterization of ball-milled bamboo-based activated carbon treated with KMnO4 and KOH as activating agents. BioResources. 2020;15(4):8303–22, 2020. [Google Scholar]
29. Popescu CM, Broda M. Interactions between different organosilicons and archaeological waterlogged wood evaluated by infrared spectroscopy. Forests. 2021;12:268. [Google Scholar]
30. Girgis BS, Elkady AA, Attia AA, Fathy NA, Abdel Wahhab MA. Impact of air convection on H3PO4-activated biomass for sequestration of Cu(II) and Cd(II) ions. Carbon Lett. 2009;10(2):114–22. [Google Scholar]
31. Teixeira LB, de Moraes EG, Shinhe GP, Falk G, de Oliveira APN. Obtaining biogenic silica from sugarcane bagasse and leaf ash. Waste Biomass Valorization. 2021;12:3205–21. [Google Scholar]
32. Zheng T, Zhang K, Chen X, Ma Y, Xiao B, Liu J. Effects of low-and high-temperature thermal-alkaline pretreatments on anaerobic digestion of waste activated sludge. Bioresour Technol. 2021;337:125400. [Google Scholar] [PubMed]
33. Purwaningsih H, Suari NMIP, Widiyastuti W, Setyawan H. Preparation of rGO/MnO2 composites through simultaneous graphene oxide reduction by electrophoretic deposition. ACS Omega. 2022;7:6760–7. [Google Scholar] [PubMed]
34. Sakhiya AK, Kaushal P, Vijay VK. Process optimization of rice straw-derived activated biochar and biosorption of heavy metals from drinking water in rural areas. Appl Surf Sci Adv. 2023;18:100481. [Google Scholar]
35. Mylarappa M, Lakshmi VV, Mahesh KRV, Nagaswarupa HP, Raghavendra N. A facile hydrothermal recovery of nano sealed MnO2 particle from waste batteries: an advanced material for electrochemical and environmental applications. IOP Conf Series: Mat Sci Eng. 2016;149:012178. [Google Scholar]
36. Groppo E, Bonino F, Cesano F, Damin A, Manzoli M. Chapter 4: Raman, IR and INS characterization of functionalized carbon materials. In: Hargreaves JSJ, Rodriguez J, Bitter H, editors. Metal-free functionalized carbons in catalysis, RSC catalysis series. London: Royal Society of Chemistry; 2018. p. 105–37. [Google Scholar]
37. Carpentier Y, Féraud G, Dartois E, Brunetto R, Charon E, Cao AT, et al. Nanostructuration of carbonaceous dust as seen through the positions of the 6.2 and 7.7 μm AIBs. Astron Astrophys. 2012;548:1–14. [Google Scholar]
38. Barakat NAM, Irfan OM, Moustafa HM. H3PO4/KOH activation agent for high performance rice husk activated carbon electrode in acidic media supercapacitors. Molecules. 2023;28:296. [Google Scholar]
39. Istadi I, Prasetyo SA, Nugroho TS. Characterization of K2O/CaO-ZnO catalyst for transesterification of soybean oil to biodiesel. Procedia Environ Sci. 2015;23:394–9. [Google Scholar]
40. Billah REK, Haddaji Y, Goudali O, Agunaou M, Soufiane A. Removal and regeneration of iron (III) from water using new treated fluorapatite extracted from natural phosphate as adsorbent. Biointerface Res Appl Chem. 2021;11(5):13130–40. [Google Scholar]
41. Kamal KH, Dacrory S, Ali SSM, Ali KA, Kamel S. Adsorption of Fe ions by modified carrageenan beads with tricarboxy cellulose: kinetics study and four isotherm models. Desalin Water Treat. 2019;165:281–9. [Google Scholar]
42. Edet UA, Ifelebuegu AO. Kinetics, isotherms, and thermodynamic modeling of the adsorption of phosphates from model wastewater using recycled brick waste. Processes. 2020;8(6):665. doi:10.3390/pr8060665. [Google Scholar] [CrossRef]
43. Uysal A, Tuncer D, Kir E, Koseoglu TS. Recovery of nutrients from digested sludge as struvite with a combination process of acid hydrolysis and Donnan dialysis. Water Sci Technol. 2017;76(10):2733–41. doi:10.2166/wst.2017.450. [Google Scholar] [PubMed] [CrossRef]
44. Anah L, Astrini N. Isotherm adsorption studies of Ni(II) ion removal from aqueous solutions by modified carboxymethyl cellulose hydrogel. IOP Conf Ser: Earth Environ Sci. 2018;160:012017. doi:10.1088/1755-1315/160/1/012017. [Google Scholar] [CrossRef]
45. Proctor A, Toro-Vazquez JF. Chapter 10-the Freundlich isotherm in studying adsorption in oil processing. In: List GR, editor. Bleaching and purifying fats and oils (2nd ed.theory and practice. Urbana, IL, USA: AOCS Press; 2009. p. 209–19. [Google Scholar]
46. Elewa AM, Amer AA, Attallah MF, Gad HA, Al-Ahmed ZAM, Ahmed IA. Chemically activated carbon based on biomass for adsorption of Fe(III) and Mn(II) ions from aqueous solution. Materials. 2023;16(3):1251. doi:10.3390/ma16031251. [Google Scholar] [PubMed] [CrossRef]
47. Bakalár T, Kaňuchová M, Girová A, Pavolová H, Hromada R, Hajduová Z. Characterization of Fe(III) adsorption onto zeolite and bentonite. Int J Environ Res Public Health. 2020;7(16):5718. [Google Scholar]
48. Thinojah T, Ketheesan B. Iron removal from groundwater using granular activated carbon filters by oxidation coupled with the adsorption process. J Water Clim Change. 2022;13(5):1985–94. doi:10.2166/wcc.2022.126. [Google Scholar] [CrossRef]
Cite This Article
 Copyright © 2024 The Author(s). Published by Tech Science Press.
This work is licensed under a Creative Commons Attribution 4.0 International License , which permits unrestricted use, distribution, and reproduction in any medium, provided the original work is properly cited.
 Downloads
 Citation Tools