
 Submit a Paper
 Propose a Special lssue
 Open Access
ARTICLE

Characteristics of Biopellets Manufactured from Various Lignocellulosic Feedstocks as Alternative Renewable Energy Sources
1 Department of Forest Products, Faculty of Forestry, Universitas Sumatera Utara. Kampus USU Padang Bulan, Medan, 20155, Indonesia
2 Research Center for Biomass and Bioproducts, National Research and Innovation Agency (BRIN), Jl Raya Bogor KM 46 Cibinong, Bogor, 16911, Indonesia
3 Department of Wood Industry, Faculty of Applied Sciences, Universiti Teknologi MARA (UiTM), Cawangan Pahang Kampus Jengka, Shah Alam, 26400, Malaysia
4 Faculty of Forest Industry, University of Forestry, Sofia, 1797, Bulgaria
* Corresponding Authors: Apri Heri Iswanto. Email: ; Petar Antov. Email:
(This article belongs to the Special Issue: Advances in Eco-friendly Wood-Based Composites: Design, Manufacturing, Properties and Applications – Ⅱ)
Journal of Renewable Materials 2024, 12(6), 1103-1123. https://doi.org/10.32604/jrm.2024.051077
Received 27 February 2024; Accepted 28 April 2024; Issue published 02 August 2024
 View Full Text
 Download PDF
Abstract
The increased valorization of renewable and cost-effective lignocellulosic feedstocks represents a viable, sustainable, and eco-friendly approach toward the production of biopellets as alternative energy sources. The aim of this research work was to investigate and evaluate the feasibility of using various lignocellulosic raw materials, i.e., raru (Cotylelobium melanoxylon), mangrove (Rhizophora spp.), sengon (Paraserianthes falcataria), kemenyan toba (Styrax sumatrana), oil palm (Elaeis guineensis), manau rattan (Calamus manan), and belangke bamboo (Gigantochloa pruriens) for manufacturing biopellets with different particle sizes. The raw materials used were tested for their moisture content, specific gravity, ash, cellulose, and lignin content. In addition, thermal analyses, i.e., calorific values, thermogravimetric analysis (TGA), and differential scanning calorimetry (DSC), were performed. The following properties of the biopellets produced were investigated: moisture content, volatile matter, ash content, fixed carbon, density, and thermal analyses. Based on an analysis of the raw materials, raru had the lowest moisture content (12%) and ash content (1.5%) and the highest specific gravity (1.2). Markedly, palm oil stem had the highest α-cellulose (55%) and lignin (37%) content. In accordance with the SNI 8675:2018 standard requirements, biopellets with optimal properties (moisture content of 1.4%, ash content of 0.79%, density of 1.09 g/m, calorific value of 4672 cal/g, and TGA residue of 13.9%), were manufactured from raru wood.Keywords
Despite the fact that energy is required for industrial, commercial, and residential purposes, the use of firewood as a solid fuel source has the potential to accelerate deforestation, which will impact ecological issues such as climate change [1]. In Indonesia, fossil fuels remain the primary source of nonrenewable energy [2,3]. Biomass has the potential to be a sustainable, affordable, renewable, and environmentally friendly alternative energy source [4]. Due to several disadvantages, including its ease of water absorption and release, high moisture content, and low calorific value, biomass must be pre-treated through milling or drying [5].
One of the issues that the energy sector is currently dealing with is the storage of large amounts of biomass fuel [6]. To solve this issue, biomass is converted into solid fuels such as biopellets for easier handling, transportation, and storage [7]. Furthermore, biopellets are a quick and easy way to generate biomass energy [8], which is both efficient and renewable [9]. As plant growth is a result of the photosynthesis process, which requires CO2, biopellets also provide other benefits in the combustion process, which is part of the neutral carbon concept [10].
Producing biopellets is one method of dealing with the waste generated by forestry and agro-industrial operations [11]. The potential of raru wood, toba frankincense, sengon, mangroves, oil palm stems, belangke bamboo and manau rattan biopellets as alternative renewable energy sources were investigated in this work. Mangrove wood has a significant calorific value. Hence, Numbere [12] claimed that it can be utilized as a solid fuel. The calorific value of briquettes made from mangrove wood branches varies depending on the kind of mangrove, from 3778.78−3846.66 cal/g [13]. Due to the ratio of waste wood left over compared to high-value logs harvested from the forest (2.5:1), waste wood is valuable but has not been utilized efficiently [14]. About 40%–60% of wood waste and by-product products are produced by the sawmilling sector [15]. Bamboo and rattan have a variety of applications, including furniture. Debarking, chopping, skinning, and coring, for example, can generate approximately 50% solid waste during the furniture-making process [16]. The oil palm plant’s fruit is its primary source of income. Therefore, its stem is always deemed as waste and burned after being felled [17]. However, the stems of the oil palm plant can also be utilized as solid fuel.
Many agricultural and forestry plants are developed in Indonesia’s tropical forests, producing large amounts of lignocellulosic waste that can be used as a raw material for renewable energy sources via the palettization process [18]. However, before this biopellet can be used, its properties must be evaluated in order to determine its characteristics in terms of lowering the market barriers and creating product flows where necessary. Raw materials with varying particle sizes of wood or non-wood were used in this study. The raw materials chosen were chosen because different biomass sources have different chemical constituents that may be relevant to the quality of the biopellets. When the raw material has higher specific gravity, the quality of the biopellets produced improves [19], and a smaller particle size may increase density [20]. The objective of this research work was to evaluate and identify the best type of biomass that can be used as a substitute for fossil fuels, particularly biopellet and a renewable energy source. It also intends to characterize various lignocellulosic components in biomass as raw materials for biopellet production.
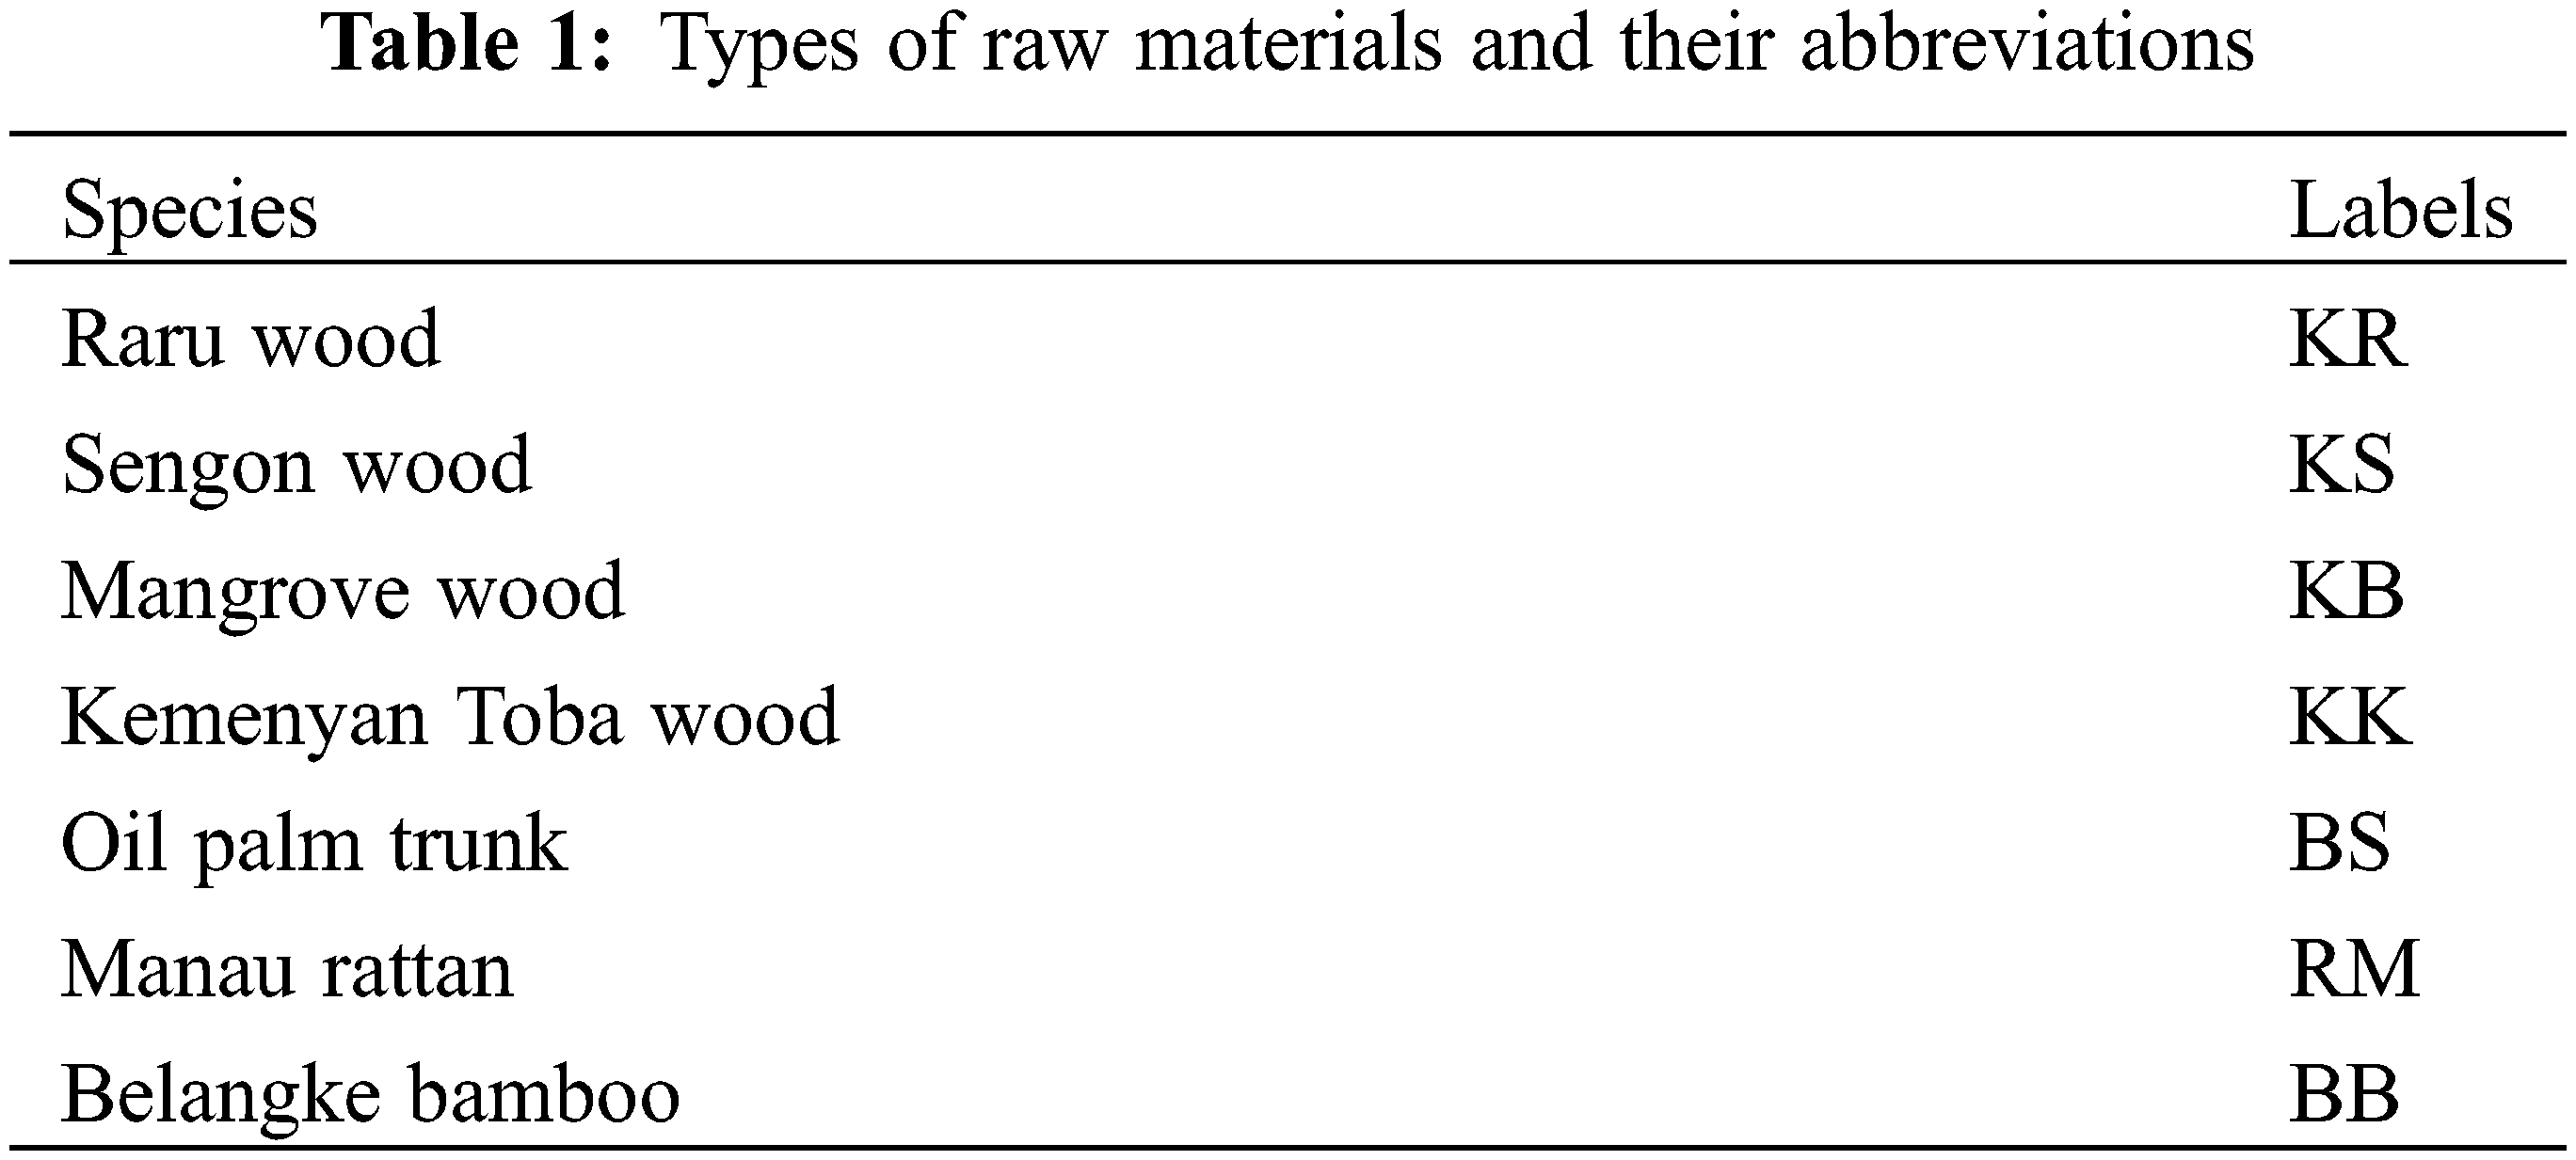
The materials used in the study were the middle stems of raru wood, toba frankincense, sengon, mangroves, oil palm stems, belangke bamboo, and manau rattan (Table 1). Several types of chemicals from Central Laboratory for Standardization of Forest Management Instruments were used, namely H2SO4, NaOH, acetone, and distilled water. The instruments used in this research were Thermo Gravimetric Analizer (TGA 4000, PerkinElmer, Waltham, MA, USA), Differential Scanning Calorimetry (DSC 4000, PerkinElmer, Waltham, MA, USA), and bomb calorimeter 6400 (Parr Instrument Company, Moline, IL, USA).
In the process of preparing raw materials, raw materials are purchased and powders are made. The samples were first processed in a disc flaker, and then they were refined once more in a hammer mill. The sample was sieved so that it could pass through a sieve with a mesh size of 40 and 60, each sieve holding a 1 kg sample.
The method of densifying biomass into tightly packed cylinders allows for the molding of biopellets. The biopellet has a 16 mm diameter and varies in length from 18 to 32 mm. Using a hydraulic pellet press, biomass powder in the sizes of 40 mesh and 60 mesh was formed into biopellets for 5 min at 200°C and 2100 psi pressure. The biopellets’ properties were subsequently evaluated.
a) Raw materials
Moisture content (SNI 8675:2018)
The petri dish was heated to 105°C in the oven for 4 h, followed by 30 min in a desiccator. 0.1 g of sample was weighed in an empty petri dish using an analytical balance with a Mettler Toledo brand accuracy of 0.0001 g. The sample-containing petri dish was heated to 105°C in the oven for 24 h, followed by 30 min in a desiccator, before being weighed. Formula (1) is used to calculate the sample’s water content after six iterations as shown below:
where A is the dry weight of the petri dish (g), B is the weight of the sample (g), C is the dry weight of the sample and petri dish (g).
Specific gravity (SNI 8675:2018)
The relationship between a sample’s density and water’s density is known as specific gravity. Formula (2) can be used to determine specific gravity as follows:
Ash content (SNI 8675:2018)
A porcelain cup with a known weight is filled with a 1 g sample. After that, place in the furnace for 6 h at 600°C. Then it was stable after cooling in a desiccator, and it was weighed. The following formula (3) is used to determine the sample’s ash content:
α-cellulose content
This test was carried out based on press releases from the Chemical Rubber Company (CRC) Florida, USA. A 1G3 glass filter that has been used up is dried in an oven for at least 4 h at 105°C. The oven dry weight was measured after it had cooled in a desiccator for 30 min. A vial with a 20 mL opening was filled with a 0.5 g sample of holocellulose. The sample’s water content was also determined at the same time. 6.25 mL of 17% NaOH was added to the sample, which was then agitated with a magnetic stirrer for 15 min before being left alone for 30 min. The mixture was added 8.25 mL of distilled water, was stirred for 5 min with a magnetic stirrer, and then left for 1 h without stirring. It was then put through a 1G3 glass filter, rinsed with 25 mL of 8.3% NaOH, and washed with 100 mL of distilled water to finish. After adding the sample to 10 mL of 10% acetone and letting it sit for 3 min, the vacuum line was then reconnected, and the process was continued until all of the solution was drawn in. The sample is dried in an oven at 105°C for 24 h after being rinsed with distilled water until it is neutral. The dried samples were weighed after 30 min in a desiccator. Using the formula (4), the amount of
where A is oven dry weight of filter glass 1G3 and cellulose residue (g), B is oven oven-dry weight of filter glass 1G3 (g), C is the weight of holocellulose (g), D is the percentage of holocellulose (%).
Lignin content (NREL LAP-003 dan LAP-004 method)
The first step in determining the amount of acid-insoluble lignin was to dry an empty 1G3 filter glass at 105°C for 4 h, let it cool in a desiccator for 30 min, and then measure the oven dry weight. In a little vial with a broad mouth of about 20 mL, 0.3 g of extractive-free lignin sample was placed. The sample was mixed with a magnetic stirrer for two hours at room temperature after being supplemented with 3 mL of a 72% w/v H2SO4 solution. The sample was put into a 100 mL Duran container, and 84 mL of distilled water was added to give the H2SO4 a final concentration of 4% weight/volume. The sample was placed in a Duran container, autoclaved at 121°C for 1 h, and then filtered through a 1G3 glass filter. To quantify the amount of lignin dissolved in acid, 10 mL of the filtrate was saved. Samples were placed in a 1G3 glass filter, rinsed with at least 50 mL of hot water, and dried for 24 h at 105°C in an oven. Samples were placed in a desiccator for 30 min, after which the dry weight was measured. To determine the amount of lignin ash present, the residue from filter glass 1G3 was moved to a porcelain cup and heated in a furnace at 525°C for six hours. Following the computation in accordance with Eq. (5), the amount of acid-insoluble lignin is determined:
where A is dry weight of filter glass 1G3 and residue of lignin (g), B is dry weight of filter glass 1G3 (g), C is dry weight of porcelain cup and ash of lignin (g), D is dry weight of porcelain cup (g), E is dry weight of lignin (g).
A Shimadzu UV-1800 UV-Vis spectrophotometer was used to determine the absorbance of the filtrate’s diluted acid-insoluble lignin concentration at a wavelength of 240 nm. For an automatic zero absorbance UV-Vis spectrometer, 4% w/v H2SO4 solution is used as the blank. The test range for lignin that has been dissolved in acid is between 0.7 and 0.9. Eq. (6) is used to calculate the amount of lignin that has been dissolved in acid.
where A is the absorbance of the sample, V is volume filtrate (86.73 mL), fp is dilution factor, ε is molar absorbtivity (25 M−1cm−1), BKO is oven dry weight of the sample (g), l is cuvette length (1 cm).
Particle Size Analyzer (PSA)
The HORIBA Laser Scattering Particle Size Distribution Analyzer LA-960 was used to characterize the size of the granular particle distribution.
b) Biopellet
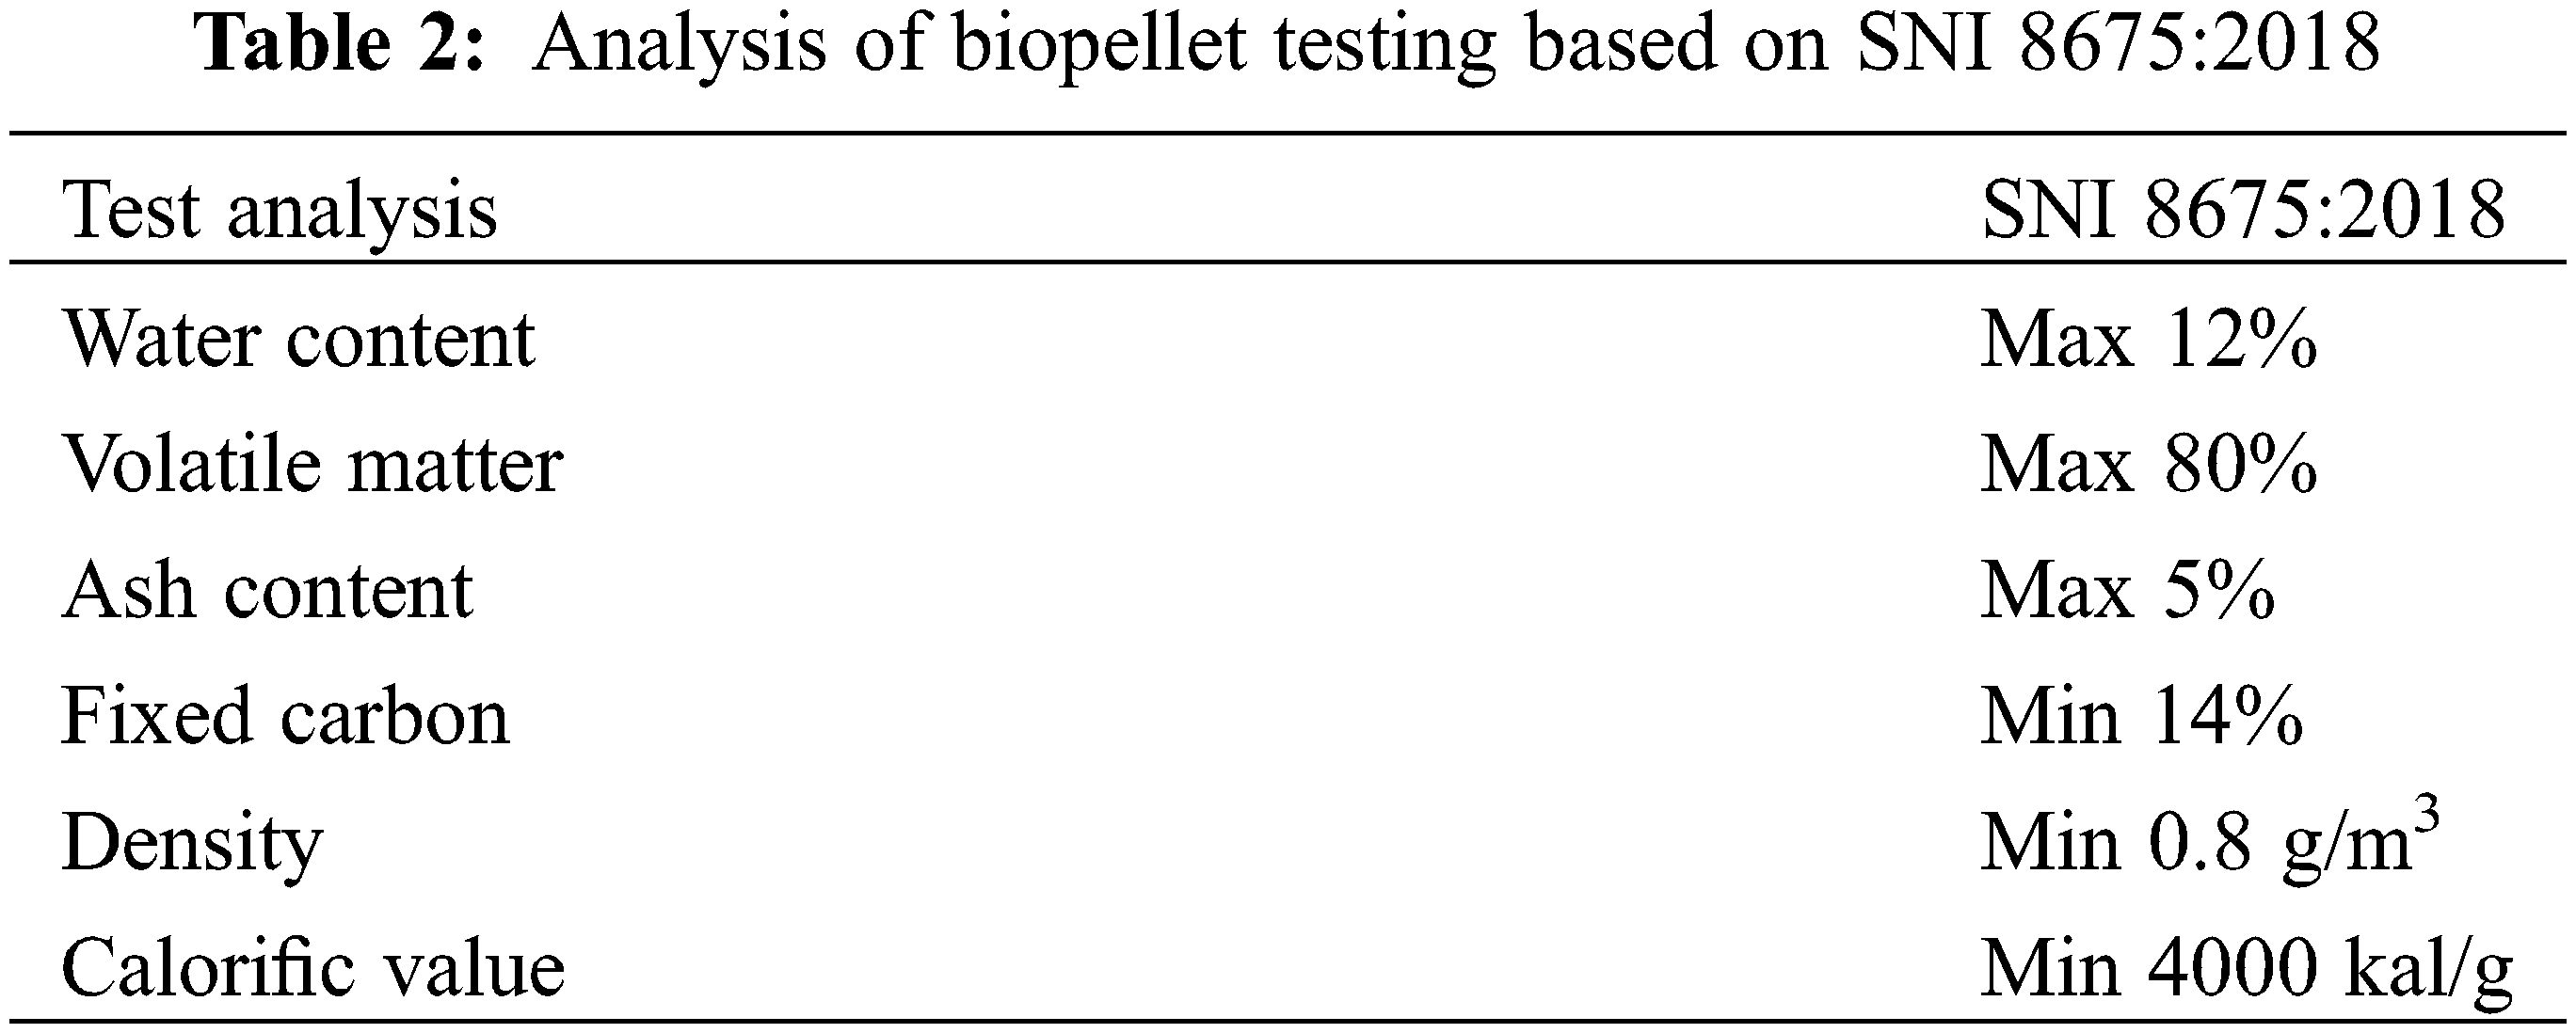
The quality of biopellets created in accordance with SNI (Indonesian National Standards), as shown in Table 2, is assessed using analyses of biopellets made from various kinds of raw materials.
Moisture content (SNI 8675:2018)
The moisture content of biopellets is the proportion of water to their total dry weight, stated as a percentage. The sample of 2 g is placed in a petri dish with a known weight, and the water capacity is calculated from there. After that, place in the oven for three hours at 103°C to maintain a constant water level. Once stable, it was chilled in a desiccator before being weighed. Using the formula (7), the sample’s water concentration is determined as follows:
where BB is the weight before drying in the oven (g), BKO is oven dry weight of sample (g).
Volatile matter content (SNI 8675:2018)
The proportion of weight lost when the biopellet is heated without outside air is known as the volatile matter content, and it is adjusted for the sample’s overall moisture content. A ceramic cup with a known weight and 2 g of the sample were used to determine the volatile matter value. After that, place it in the oven for 10 min at 950°C. Once stable, it was chilled in a desiccator before being weighed. Using the formula (8), the sample’s volatile matter is determined as follows:
where B is the sample weight after being dried from the water content test (g), C is the sample weight after heating in the furnace (g), W is the initial sample weight before testing for water content (g).
Ash content (SNI 8675:2018)
One gram of the sample was weighed and put into a porcelain cup with a known weight to calculate the ash content number. After that, place it in the furnace for 6 h at 600°C. After about 30 min of cooling in a desiccator, the product was measured. Using the formula (9), the following is determined to represent the sample’s ash content:
Fixed carbon content (SNI 8675:2018)
The percentage of carbon that is bonded within a substance and excluded from water, volatile matter, and ash components is known as the fixed carbon content. Formula (10) can be used to calculate the number of fixed carbon contents, as shown below:
Density (SNI 8675:2018)
The findings of a comparison between the weight and volume of the biopellets measured under the same circumstances are used to determine density. Formula (11) is used to determine sample density, as shown below:
where B is the weight of sample (g), V is the volume of sample (m3).
c) Thermal
Calorific value with ASTM D5865 [21].
A silica cup containing up to 2 g of sample was sealed with nickel wire, and positioned inside of a tube, and the tube’s mouth was shut. Oxygen was pumped into the passage for 30 s. The oxygen bomb calorimeter is equipped with a tube. When the water’s temperature is set, combustion starts. Measurements continue until the ideal temperature is reached. Using the formula (12), the sample’s calorific value is determined as follows:
where NK is the calorific value of sample (cal g−1), ∆t is the Average temperature difference (°C), W is the calorific value of water (cal/°C), Mbb is the mass of fuel (g), B is heat correction on iron wire (cal g−1).
Thermogravimetric analysis (TGA)
Thermogravimetric Analyzer (TGA 4000) of PerkinElmer was used to heat a standard ceramic crucible containing 4 mg of sample powder from ambient temperature (25°C) to 750°C at a rate of 10°C/min. The test was conducted with nitrogen gas flowing at a rate of 20 mL/min. The findings of an analysis using TGA are used to determine the weight reduction curve for temperature.
Differential Scanning Calorimetry (DSC)
The biopellet samples were subjected to DSC analysis using a Perkin Elmer DSC 4000 with an instantly calculable Tg value. A sample weighing 4 mg was compressed and weighed using an aluminum pan (40 L). The sample was heated at 30°C–100°C at a rate of 10°C/min, held at 100°C for 3 min, then cooled from 100°C to –20°C at a rate of 10°C/min, held at −20°C for 3 min. It was then heated to a temperature of 200°C for one minute while heating at a rate of 10°C/min between 30°C and 200°C. Once more, chilling was done at a temperature range of 200°C to 30°C at a cooling rate of 10°C/min.
The experimental design used to analyze the raw materials was a Non-Factorial Complete Randomised Design, while to analyze the biopellets, a 2-factor Factorial Complete Randomised Design (raw material type and particle size) was used.
3.1 Characterization of Raw Materials
The characteristics of the lignocellulosic raw materials used in this study, both wood and non-wood, were investigated to determine how they influenced the quality of the biopellets produced. The moisture content of the seven raw material samples analyzed ranged from 12%–14% (Fig. 1). Statistical analysis of the moisture content value of the material showed that the raw material type was significantly different (p < 0.05). The moisture content of woody biomass ranged from 12%–13%, with mangrove wood having the highest moisture level, while non-timber biomass moisture content ranged from 13%–14%, with oil palm trunk having the highest moisture content. The moisture content of the sengon, jabon, and acacia wood samples has an average value of 15.3%, according to the research by Karlinasari et al. [22]. The determined moisture content of belangke bamboo was 13.69%, which is nearly equal to the value reported by Daud et al. [23]. The stem’s top, middle, and bottom all affect the average moisture content of the Gigantochloa scortechinii species, which was 13.13%. According to Hisham et al. [24], rattan’s moisture content is influenced by its age; the older the rattan, the more moisture content it has lost. Manau rattan contains 12.53% water. This study found that oil palm trunks had the highest moisture content of 14.2%.
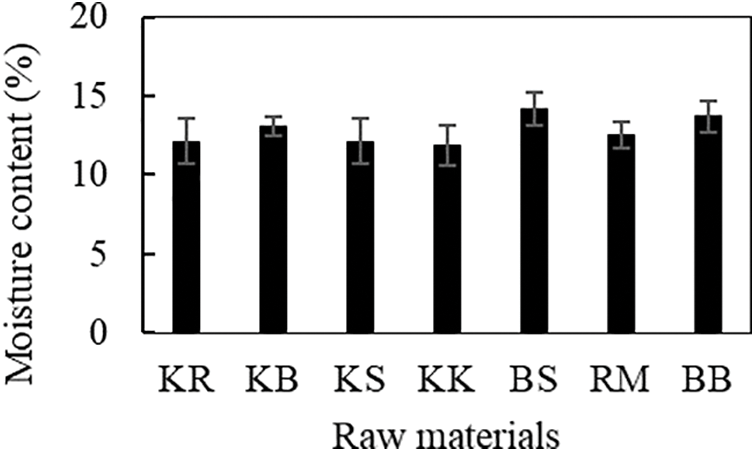
Figure 1: Moisture content of raw materials used in this work
During the moisture content analysis, the sample was dried, causing the moisture content to be lost and the weight to decrease. The amount of water present can influence the nature of the biomass. Silvério et al. [25] stated that high moisture content levels can increase the risk of microbial degradation. In other cases, moisture content increases humidity, which reduces the physical quality and durability of the fuel by increasing microbial respiration [26]. Because water absorbs heat from the combustion process or heat from the evaporation process, a high moisture content reduces the calorific value of combustion. As a result, the combustion temperature falls, and only partially the volatile elements burn. As a result, heat will be lost throughout the combustion process [27]. The density of biomass can also be impacted by the moisture content [28], where the higher the moisture content, the lower the density.
The specific gravity value is one of the most important factors in determining the purpose of the materials. Its traits are determined by genetics, development, location, and ambient climate [29]. The specific gravity of the seven different types of biomasses ranged from 0.34 to 1.16 (Fig. 2), with the samples of woody and non-timber biomass, specifically sengon wood and oil palm stems, having the lowest values. Statistical analysis of the specific gravity value of the material showed that the raw material type was significantly different (p < 0.05). Sengon wood had a specific gravity of 0.24 [30], a number lower than the specific gravity of 0.57 found in this study. The specific gravity of belangke bamboo was 0.77, which is greater than the estimate provided by Iswanto et al. [31], who stated that the specific gravity varies from 0.58–0.60 depending on the stem region. Sharma et al. [32] tested several types of rattan samples, including Calamus latifolius, Calamus leptospadix, Daemonorops jenkinsiana, and Plectocomia bractealis, and reported that they had an average specific gravity of 0.37, 0.42, 0.33, and 0.28, respectively. Manau rattan had a specific gravity of 0.45. In addition to the type of biomass, the section of the stem in the same sample influences the specific gravity readings.
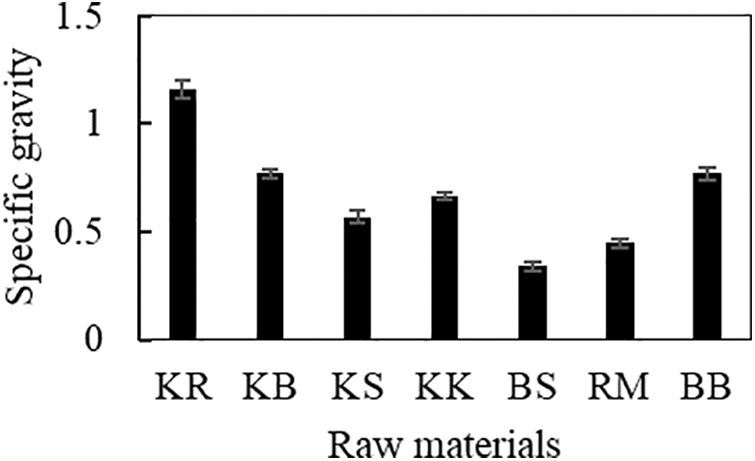
Figure 2: Specific gravity of raw materials used in this work
The amount of holocellulose, a component of the cell wall, present in a lignocellulosic material can influence its specific gravity. The amount of cellulose and lignin in wood affects its specific gravity, which affects its mechanical properties [33]. Hidayat et al. [28] stated that the low moisture content affects biomass density, which in turn affects the biomass’s high specific gravity. This may influence the calorific value produced; for instance, oil palm trunks have the lowest specific gravity, which corresponds to their low caloric value.
The ash composition contains a variety of elements, including Cu, Fe, K, MN, Ca, P, K, and Mg [34]. The ash content values of the tested samples ranged from 0.92% to 11.51% (Fig. 3a). Statistical analysis of the ash content value of the material showed that the raw material type was significantly different (p < 0.05). The average ash level of Toba incense produced in the West Pakpak area was 0.7%, while that of North Tapanuli was 1.4%. Therefore the toba incense wood used in this study had a relatively high ash content of 3.13%, which was greater than that of the study by Iswanto et al. [35]. This demonstrates that the location of a plant’s growth influences its ash content, which varies by plant variety.
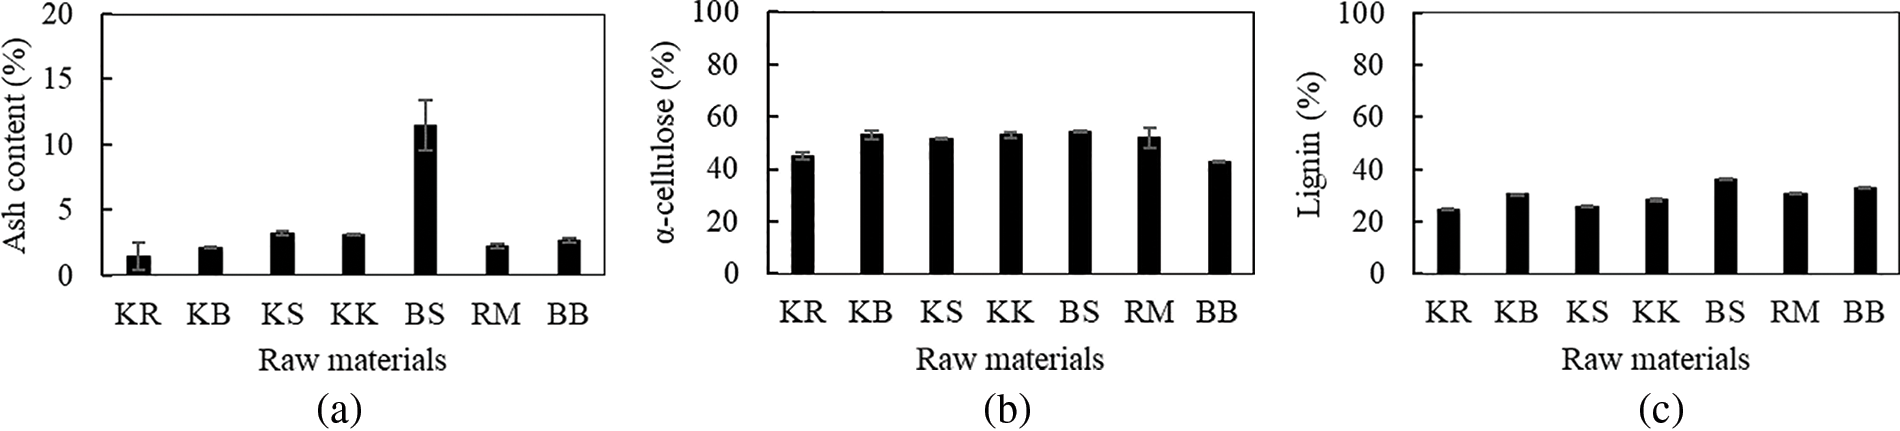
Figure 3: (a) Ash content of raw materials used in this work. (b) α-cellulose content of raw materials used in this work. (c) Lignin content of raw materials used in this work
In contrast to this study’s C. manan, which showed an ash content of 2%, research by Ahmed et al. [36] found that two distinct kinds of rattan, C. zollingeri, and C. ornatus, had ash contents of 2.0%–4.6% and 7.7%, respectively. The sample with the highest ash concentration was oil palm, which had an ash level of 11.51%. In contrast, the study by Umar et al. [37] found that the palm ash content was 9.82%, which is a rather high value. The use of an application may be impacted by the high silica content that is anticipated, given the high ash concentration. According to a previous study by García et al. [26], the combustion process results in the production of ash content in the form of inorganic residue, which can lead to a loss in calorific value and inefficient combustion. This is compatible with the oil palm trunk’s high percentage of ash content, which contributes to its low calorific value.
The α-cellulose is created by eliminating impurities like wax, lignin, hemicellulose, and other substances that dissolve during hydrolytic reactions, filtration, and washing processes [38]. The cellulose content of the wood and non-wood samples analyzed in this research ranged from 43%–55%, with the oil palm sample having the highest value at 54.47% and the bamboo belangke sample having the lowest value at 42.79% (Fig. 3b). Cotylelobium melanoxylon from this study produced 25% of α-cellulose. In contrast, Cotylelobium lanceolatum and Vatica pauciflora from previous research by Iswanto et al. [39] have lignin levels that range from 41%–44%, based on the part of the stem.
In this research, the amount of α-cellulose found in Toba frankincense was higher than that found by Iswanto et al. [35]; the amounts found in Toba incense wood from North Tapanuli and West Pakpak are approximately 25.94% and 39.87%, respectively. According to a prior study by Hisham et al. [24], the α-cellulose content of softwood was 45%, and that of hardwood was 42%. The variety of biomass affects the variation in α-cellulose content. The oil palm trunk sample had the highest α-cellulose content in this study, at 54.47%. The study by Lamaming et al. [40] found that the α-cellulose content in palm stems was 50.74%. Ding et al. [41] revealed a 42% proportion of cellulose in Manau rattan. The hydrogen bonds in cellulose have an impact on a sample’s strength [41]. This result was lower than the 52% found in this research.
Cellulose-based materials can be used as raw materials for renewable energy because they are environmentally friendly. According to research by Taokaew et al. [42], cellulose can be produced commercially as a chemical or biofuel. Cellulose has a linear polymer structure, making it stronger; this affects the biopellet properties, which are not easily destroyed. The cellulose structure can also affect the combustion process because it is difficult to degrade at temperatures below 200°C [43]. The primary element carbon, which impacts on burning, is found in lignocellulosic materials’ primary constituents, including lignin, cellulose, and hemicellulose. The carbon element will affect the calorific value produced because cellulose has a smaller carbon content than lignin [44]. In contrast, α-cellulose can alter a substance’s moisture content or hygroscopic characteristics in addition to its calorific value [44].
After cellulose, lignin is the biopolymer most prevalent in lignocellulosic cell walls, with an approximate percentage of 15%–35% [45]. The research used wood samples, raru, mangrove, sengon, and toba frankincense each having a percentage value of 25%–31% (Fig. 3c). Toba frankincense had a lignin content of 28%, which is greater than the estimate of Iswanto et al. [35]. The lignin content of toba frankincense from North Tapanuli and West Pakpak was 10% and 25%, respectively. According to the portion of the stem, Cotylelobium lanceolatum and Vatica pauciflora have lignin levels of 28%–30% and 30%–31%, respectively [39], whereas Cotylelobium melanoxylon had lignin levels of 25% in this study. This percentage varies not only in different types but also in the stem of the same type.
Various amounts of lignin were determined from the different lignocellulosic feedstocks. The lignin content of several bamboo species ranges from 21%–29% [46]. Ding et al. [41] found that the percentage of lignin in manau rattan was 27%; the 31% lignin content of manau rattan is higher than this finding, and the high lignin content will impact the sample’s resistance to biological attack.
The type of biomass, parts of the plant, and the environment in which it develops all impact the amount of lignin present, with wood having a lower percentage of lignin than other types of biomasses [47]. The lignin content of softwood was higher than that of hardwood, at 28% and 20% [24]. The amount of lignin in biomass impacts its thermal characteristics, affecting alternative fuel production [48]. According to previous research by Ghatak et al. [49], lignin can create charcoal to slow down the rate of burning.
The use of high temperatures during the production of biopellets may cause lignin, a component of the biomass, to melt, allowing it to bond to the particles and solidify after conditioning [50], which may have an impact on the density of the biopellets that are produced. According to a prior study by Lubis et al. [51], biomass contains lignin that can be used as a natural adhesive when creating biopellets. This results in biopellets that are not fragile because they have a high density. Lignin, a carbon source obtained from biomass, has a percentage of about 60% [52], which may impact the final product’s calorific value.
A particle has various shapes, sizes, and size distribution properties or features [53]. The raw materials’ particle sizes were determined from samples with the highest and lowest calorific values because these two raw materials adequately indicated of the representative of the biopellets produced. Fig. 4 shows that oil palm stem powder was smaller than raru wood, which was expected to impact the raw material’s properties. The density is influenced by particle size; the greater the density, the smaller the particle size. Ningsih et al. [54] also found that particle size impacts biomass moisture content; the smaller the particle size, the larger the surface area, which impacts high water uptake. The high moisture content of the palm stalks is referenced in this remark. Briquettes made from sawdust and coconut shells measured 40 mesh, which had a greater value than ten mesh, which was 4.76%, and had a higher ash content than ten mesh [55]. Ash content and particle size are related. These findings are consistent with the results obtained in this work for palm stems, which had a higher ash content than raru wood.

Figure 4: Particle size of raw materials used in this work
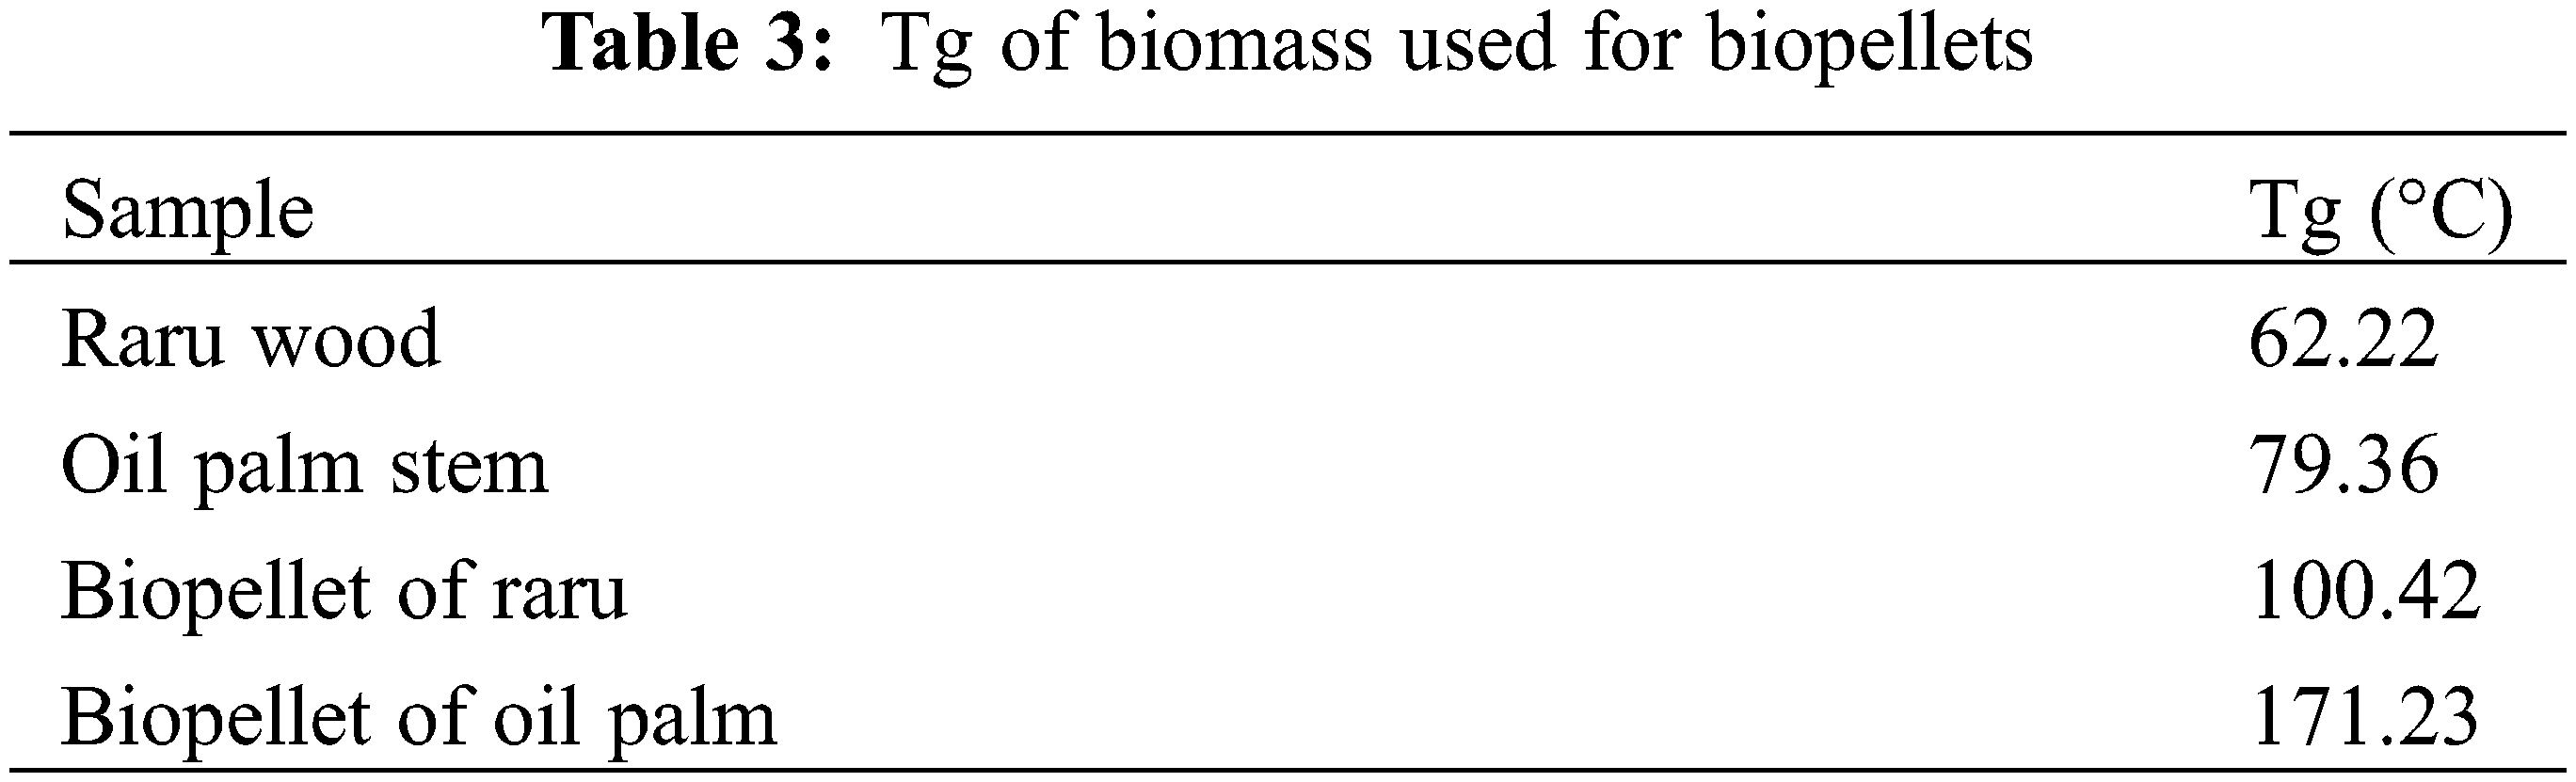
The char formation and subsequent combustion of the resulting biopellets can both be impacted by the source material’s particle size. Smaller samples will reportedly create less char, but the chemical content of the raw material can also have an impact [56]. A higher proportion of weight is lost when particles are smaller and the temperature is higher [57]. This claim is supported by the TGA analysis’ third step (Table 3), which demonstrated that raru sawdust loses weight more quickly than palm stalk powder.
3.2 Characteristics of Biopellets
The moisture content in the 40 mesh and 60 mesh biopellet samples ranged from 1.4% to 7.5% (Fig. 5a). Statistical analysis of the moisture content of biopellets showed that the interaction between the type of raw material and particle size was not significantly different (p > 0.05). The biopellets fabricated in this work fulfill the SNI 8675:2018 standard requirements, i.e., a maximum of 12% water content. The moisture content value of palm oil briquettes, reported by Kpalo et al. [58], was much lower−9.24%. The moisture content of biopellets made from oil palm stem waste ranged from 5.27%–6.75% [59]. According to a study by Mustamu et al. [60], the moisture content of biopellets made from eucalyptus and gondorukem wood is 1.3%–5.8%.

Figure 5: (a) Water content of biopellets 40 mesh and 60 mesh. (b) Volatile matter content of biopellets 40 and 60 mesh. (c) Ash content of biopellets 40 and 60 mesh. (d) Fixed carbon content of biopellets 40 mesh and 60 mesh
Heat treatment during the biopellet printing procedure caused the biomass’s moisture content to decrease, leading to the biopellets’ loss of moisture content. According to a study by Lubis et al. [51], the densification process that employs heat has an impact on the decrease in moisture content from biomass to biopellets. Compared to the study by Susanti et al. [61], the moisture content reported in the current study is lower. The rapid impact of the low moisture content value on the combustion process, lack of smoke production, reduction of air pollution, and ease of fire lighting are all benefits [60]. Solid fuels’ moisture percentage significantly impacts their stability, effectiveness, and combustion process, among other things. The combustion process is impacted by the high moisture content of biopellets, which is typically a result of storage, the chemical makeup of the raw materials, and the production method for biopellets [62]. This impacts the calorific value generated, as demonstrated by the low calorific value of biopellets made from oil palm stems due to the high-moisture content.
The raw material’s particle size can impact the variation in the proportion of moisture content, where the lower the moisture content of the biopellets, the smaller the particle size. This can be seen in the biopellets produced in this research, which had a lower moisture content value than biopellets with a raw material size of 40 mesh. This is possible because of the relationship between its masses [63]. The smaller cavities that can fill water particles result in a biopellet having a reduced moisture content and, therefore, become denser.
The volatile matter content of biopellets was examined using a high-temperature combustion method. At temperatures between 250°C and 400°C, the volatile matter is released during this process, converting inorganic components into solid parts like charcoal and gaseous products like vapor molecules [63]. The amounts of volatile substance found in the 40 mesh and 60 mesh biopellets were 71%–79% and 75%–82%, respectively (Fig. 5b). Statistical analysis of the volatile matter content of biopellets showed that the interaction between raw material type and particle size was significantly different (p < 0.05). In this study, all samples with a size of 40 mesh fulfilled the SNI 8675:2018 standard requirement for volatile matter, below 80%.
The volatile matter was greater than 80% in the samples of raru and incense biopellets with a mesh size of 60. The value of the volatile matter concentration will rise because smaller samples will be more flammable. These findings, however, contrast with the results reported by Amaya [64], who found that biopellets produced from wood waste had a volatile matter value of 87.8%. The combustion process will be impacted by the high amounts of volatile matter in biopellets, which will result in more smoke [65]. Al Qadry et al. [66] found that wood has a greater percentage of volatile matter than oil palm and therefore biopellets made from wood with a size of 60 mesh have a higher volatile matter content than those made from non-wood materials.
The amounts of volatile matter and fixed carbon in biopellets are negatively correlated. Hersztek et al. [67] found that the ash concentration decreased with increasing volatile matter value. According to the research by Ariski et al. [68], despite having other benefits like simple ignition and combustion, large levels of volatile matter will result in low levels of bound carbon. If the calorific value of the biopellets has a high volatile matter content, the majority of the calorific value will be released as combustion vapor [27].
All samples with sizes 40 mesh and 60 mesh had ash content values of 1.31%−10.75% and 0.79%−9.89%, respectively, with biopellet samples made from palm oil having the greatest ash content (Fig. 5c). Statistical analysis of the ash content of biopellets showed that the interaction between raw material type and particle size was significantly different (p < 0.05). Based on SNI 8675:2018, a few biopellet samples were excluded from excellent quality biopellets because their percentage values were higher than 1.5%. However, raru wood, in both 40 mesh sizes and 60 mesh sizes, was still included. The densification process, which uses heat to vaporize the inorganic mineral content that is considered to be ash, has an impact on the decrease in the amount of ash from biomass into biopellets [51]. Compared to the research by Iskandar et al. [69], biopellets made from rice husk have ash content values ranging from 14%–19%; this research has a lower ash content value. This is affected by variations in the raw ingredients used to make biopellets.
The high percentage of ash content is caused by the presence of non-organic materials in the biopellet samples, which hinders their complete burning. It is important to take the ash content of biopellets into account because it influences the scale that develops as a result of the burning process, either by evaporating into the air or by remaining in the finished product [70]. Biopellets made from raw materials with a size of 60 mesh had a smaller ash content than pellets with a size of 40 mesh. These findings are inversely related to the research by Simanjuntak et al. [71], who found that biopellets from sawdust with coarser particle sizes had higher values than those with finer ones, namely between 0.8%−1.3% and 1.7%−2.6%. High ash content influences the low calorific value of the biopellets produced [72], which is consistent with the findings of the low calorific value of biopellets made from oil palm stems.
Analysis of the fixed carbon value was carried out to determine the burnt solid samples after the removal of volatile matter content [65]. The percentage of fixed carbon in biopellets made from various raw materials and measuring 40 mesh and 60 mesh varies from 13%–21% (Fig. 5d). Statistical analysis of the biopellet-fixed carbon content showed that the interaction between raw material type and particle size was significantly different (p < 0.05). The fixed carbon content in biopellets with a 60-mesh size had a slightly greater value than those with a 40-mesh size, according to particle size. The resulting biopellets were of high quality because some of the biopellet samples fulfilled the minimum standard requirement for the fixed carbon content of 14%. Previous investigation combined rubber fruit shells and ater bamboo (Gigantochloa atter) at a specific concentration to create a fixed carbon level between 14.75%–15.48% [44]. A high fixed carbon level indicates of a higher quality biopellet burning process.
The high heating value generated by the high fixed carbon content can have an impact on the quality of the biopellets [73]. A prior studies reported that biopellets with a high calorific value are impacted by their high content of fixed carbon as a result of the substantial amount of solid material that is burned to create a higher calorific value, which supports this claim [74]. These findings are consistent with the amount of carbon that is tightly bonded in biopellets made from raru wood, which had a high calorific value. However, the fixed carbon value of the biopellets was inversely correlated with the volatile matter; the greater the fixed carbon, the lower the volatile matter [67]. Another study by Zulfian et al. [59] also found a positive correlation between the amount of fixed carbon and the ash content of biopellets, with a greater fixed carbon value corresponding to higher ash content.
The density values of the biopellets made from 40 mesh varied from 0.7–1.1 g/cm3 (Fig. 6). The greatest and lowest values, 1.09 and 0.74 g/cm3 were obtained for the samples fabricated from raru and belangke bamboo, and 60 mesh was almost as dense as 40 mesh. Statistical analysis of the biopellet density showed that the interaction between raw material type and particle size was significantly different (p < 0.05). Based on SNI 8675:2018, biopellets manufactured from raru, mangroves, toba frankincense, oil palm stems, and manau rattan raw materials surpassed the minimum standard requirement for high-quality biopellets, which is above 0.8 g/cm3. Because they have an impact on both the storage process and the combustion mechanism, high-quality pellets should not be broken or crushed readily [62].

Figure 6: Density of biopellets 40 and 60 mesh
Rattan-based biopellets had a mass between 0.83 and 1.04 g/cm3. These findings are nearly identical to those of Jannah et al. [75], who found that biopellets made from a rattan and sawdust mixture measuring 60 mesh had the highest density value of 1.1 g/cm3. The density of biopellets can vary depending on the particle size; it can be seen that biopellets with a 60-mesh size had a greater value than those with a 40-mesh size. There are several factors that can influence the density of biopellets, including specific gravity and particle size [76]. If the particle size is smaller and it has a higher specific gravity, the density will be higher. The density of the resulting biopellets can also be impacted by the moisture content of the biopellets. The dense nature of biopellets causes the openings to be smaller and less able to hold water molecules [77].
In addition to the raw materials, the manufacturing method for biopellets also affects their density. High temperature and pressure will raise the density value of biopellets during the densification or compaction process [51]. The calorific value of the biopellets and their density value are inversely correlated; the higher the density value, the higher the calorific value. If the density value is lower, the biopellets will be extremely flammable but will lose some of their heating value and become crumbly or easily destroyed [19]. The density of the biopellets that are produced can also be influenced by the biomass’s initial density value; the higher the biomass’ initial density, the higher the density of the biopellets [78].
The calorific values for some of the examined material samples ranged from 3578–4393 cal/g (Fig. 7a). Statistical analysis of the calorific value of material showed that the raw material type was significantly different (p < 0.05). The samples with the highest and lowest calorific values were discovered in raru wood and oil palm samples, with oil palm samples having lower calorific values than those produced in the research by Umar et al. [37], who determined that oil palm trunks had a calorific value of 4158 cal/g. Due to the high specific gravity of raru wood, the findings had an impact on the specific gravity and chemical components of the biomass [65]. Selivanovs et al. [79] claimed that the moisture content can impact the calorific value because it can take more than 2.6 MJ/kg of energy to evaporate 1 kg of water from the moisture of biomass.
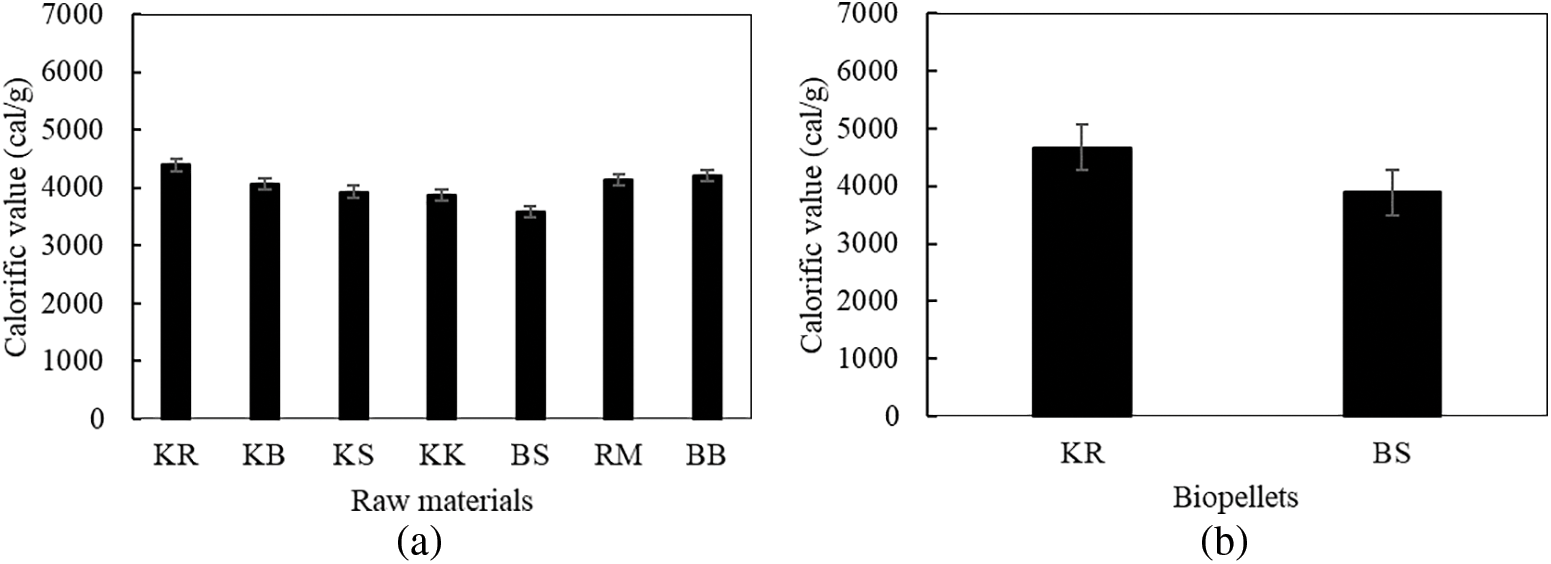
Figure 7: (a) Calorific value of raw materials used in this work, (b) Calorific value of biopellets
The moisture and ash content both have an impact on the calorific value [80]. Liliana [81] stated that high moisture content can lower the calorific value due to the challenging nature of ignition and the quantity of smoke generated during combustion, which is corroborated by this. The relationship between calorific value and moisture content is inverse, with greater calorific values corresponding to lower moisture contents. The low water level lowers the biomass’s specific gravity, which lowers its high calorific value. Brayen et al. [72] also claimed that the calorific value is impacted by the biopellets’ low ash level.
The samples of raru wood and oil palm had the greatest and lowest calorific values when the seven biomass samples were analyzed. The two raw materials’ calorific values for biopellets must, therefore, be examined because they adequately reflect the quality of the biopellets that will be made. Only samples with a mesh size of 60 were used for the heat test because those with a mesh size of 40 or less had lower quality, according to several earlier tests. The calorific value of palm oil was 3888 cal/g, while raru wood biopellets exhibited a calorific value of 4672 cal/g (Fig. 7b). In accordance with SNI 8675:2018, biopellets made from raw raru wood measuring 60 mesh fulfilled the standard requirement for calorific value of biopellets, namely those above 4000 cal/g. Smołka-Danielowska et al. [82] stated that several factors, including storage duration, raw material type, and chemical makeup, can influence a material’s calorific value and combustion process. The greater the calorific value of the raw material, the more impact it has on the calorific value of the biopellets. However, the calorific value is inversely proportional to the values of moisture content, ash content, and volatile matter content, which can lower it [60].
According to a prior study, the moisture content and density of biopellets can have an impact on their calorific value. It is possible that biopellets with a size of 60 mesh will have a greater calorific value than biopellets with a size of 40 mesh because 60 mesh biopellets have a lower moisture content value than 40 mesh. The calorific value of biopellets, which is correlated with the amount of fixed carbon and ash content, is said to impact the quality of the biopellets. The higher the calorific value, the better the quality of the biopellets [83]. Oil palm stems had a high lignin content but a low calorific value, even though the lignin content influences the calorific value. According to the research by Wistara et al. [84], the calorific value is affected by a number of other analyses, such as the percentage of ash, even though it has a high lignin concentration. The calorific value decreases as the ash concentration increases. Furthermore, Prasetyo et al. [80] claimed that a high fixed carbon value would influence the high heating value of the produced biopellets.
3.3.2 Thermogravimetric Analysis (TGA)
TGA can be used to examine weight loss in timber brought on by high temperatures. Figs. 8a and 8b depict the structure of the generated raru wood, oil palm stem, and biopellets of raru and palm as they degrade thermally. The samples were examined in light of their greatest and lowest calorific values. The four samples’ degradation process was broken down into three phases (Table 3). The sample degraded in the first step at a temperature range of 28°C–128°C, causing weight loss. The weight loss was 7.09% in the raru wood sample, 7.41% in the oil palm stem sample, 1.59% in the raru biopellet sample, and 3.05% in the oil palm biopellet sample. Weight loss comes from the first stage, which is the loss of moisture content and simple volatile substances [85]. The weight of the sample decreases in the first step due to the loss of free water and water that is chemically and physically bound to the wood [86].
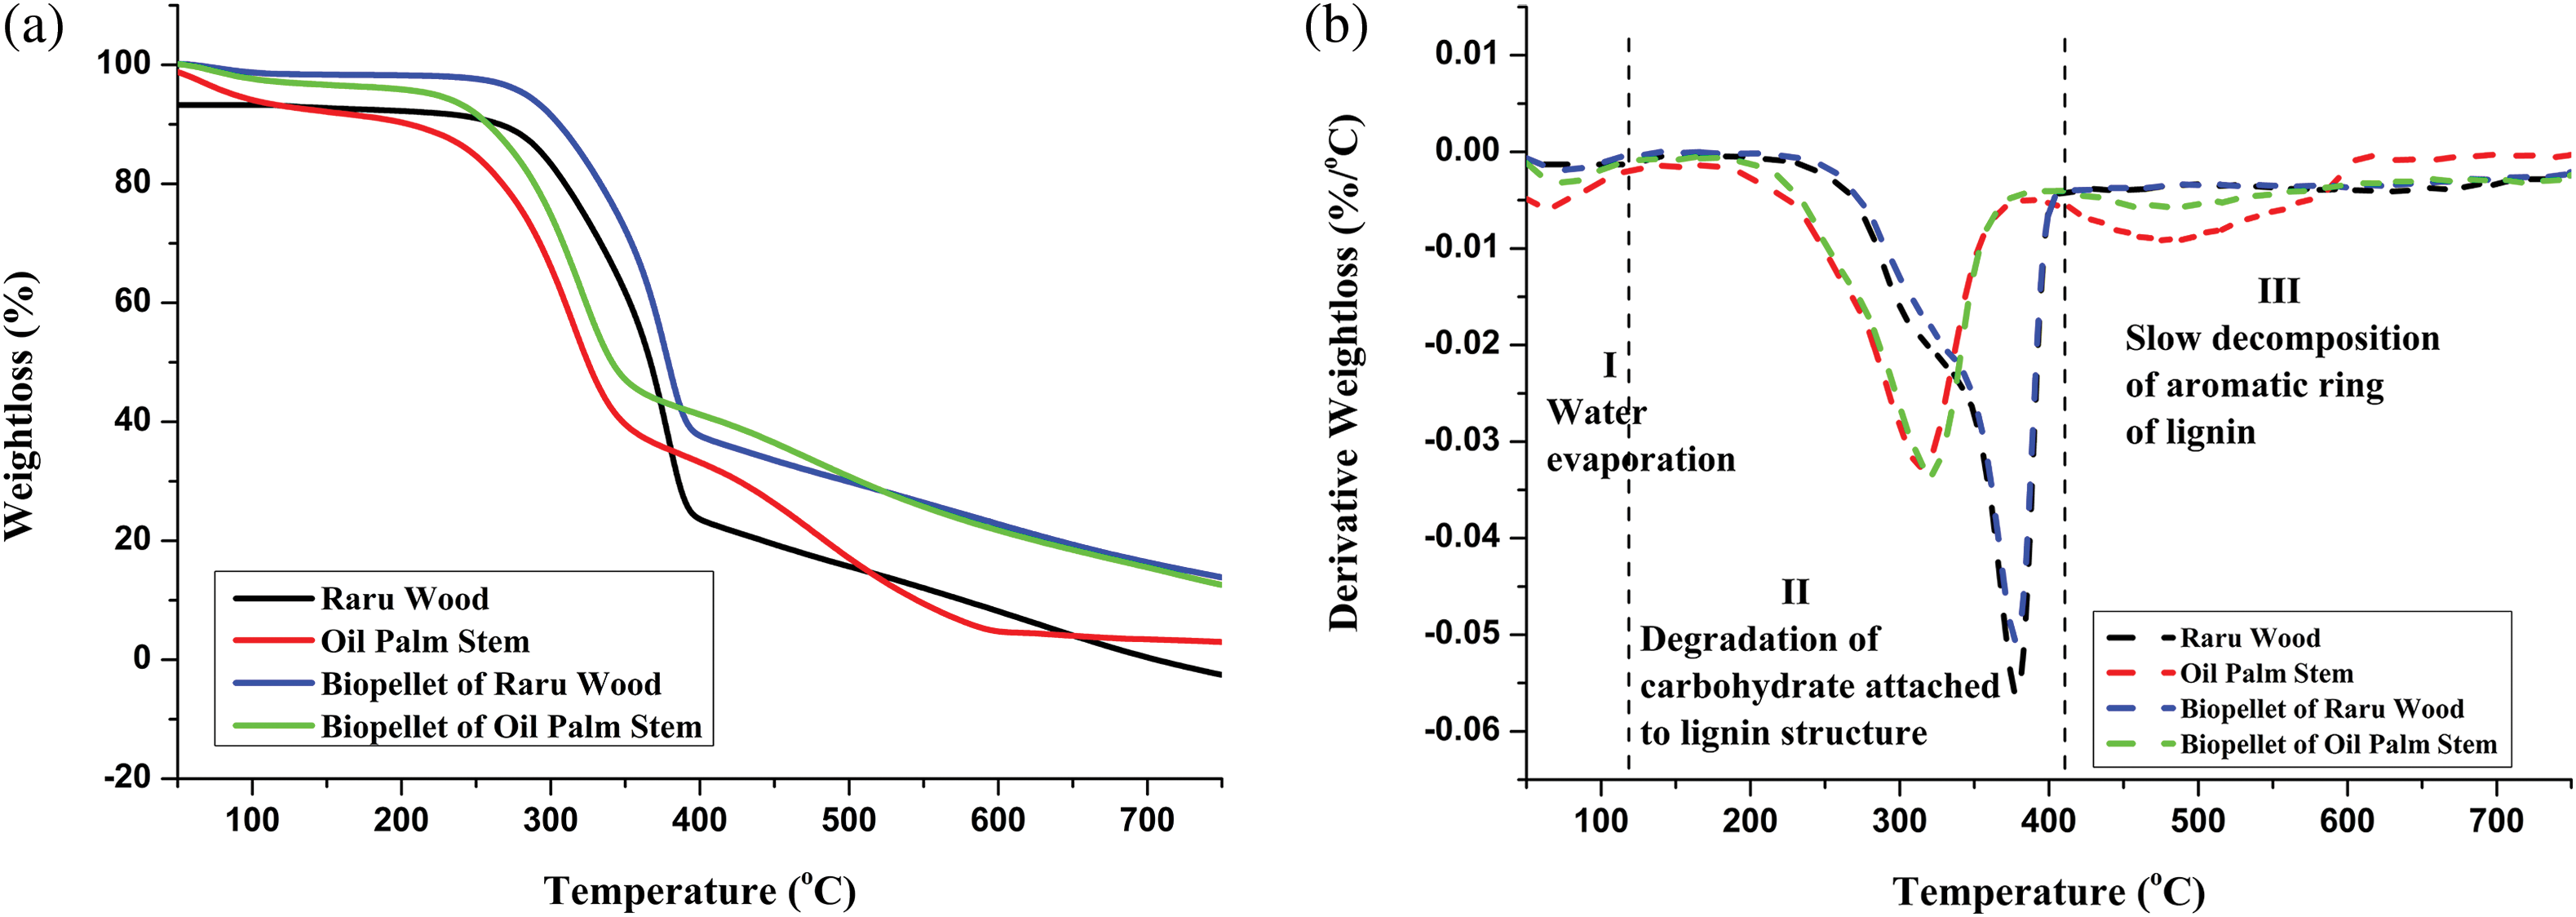
Figure 8: (a) TG of raru wood, oil palm stem, biopellet of raru wood and oil palm stem. (b) DTG of raru wood, oil palm stem, biopellet of raru wood and oil palm stem
In the second step, the raru sample lost 70.17% of its weight, compared to the palm sample’s loss of 58.17%, the raru biopellet sample’s loss of 62.54%, and the palm sample’s loss of 55.12%. Guo et al. [87] claim that the samples’ primary decomposition reaction took place between 250°C–450°C and that the highest weight loss rate was attained between 340°C–385°C. At temperatures between 220°C–450°C, cellulose can degrade and cause this [88]. Hemicellulose breakdown takes place between 100°C–250°C [89]. Decomposition of cellulose takes place between 340°C–425°C for cellulose and 180°C–340°C for hemicellulose [90].
The final step took place at a temperature between 384°C–746°C and was caused by the structure of lignin degradation. Wang et al. [91] claimed that the processes of decomposition and condensation of the lignin aromatic rings take place simultaneously at temperatures above 500°C. The structure and molecular makeup of cellulose, hemicellulose, and lignin vary, which affects how they behave thermally. Cellulose has a comparatively high thermal durability because it is made up of long, unbranched glucose polymers with a regular structure. Hemicellulose is readily broken down at low temperatures because of its random, amorphous structure. Lignin has the greatest thermal stability due to its aromatic ring structure [92].
3.3.3 Differential Scanning Calorimetry (DSC)
Thermogravimetric analysis (TGA), differential thermal analysis (DTA), and differential scanning calorimetry (DSC) are three types of thermal analyses that are frequently performed on a substance [93]. The characterization of heterogeneous elements was done through thermal analysis [94]. So that the particle size is more uniform, the material is first sieved before the thermal analysis is performed. The Tg values for the raru samples were lower than those for the oil palm samples, and both values rose once the samples were turned into biopellets (Table 3). The ultimate endothermic transformation of lignin from a solid to a plastic phase yields the Tg temperature [95]. This is due to the fact that oil palms have more lignin than raru, which raises the Tg temperature. The existence of an aromatic ring in the lignin structure makes lignin the chemical component that resists heat the best [91].
The formation of hydrogen bonds between phenolic hydroxyl groups and the number of aromatic rings in lignin is a major factor contributing to the elevated Tg temperature [96]. The value of tg lignin varies based on where the biomass comes from. Lignin can be melted at the proper temperature without breaking its polymer structure, making it a useful adhesive for holding particles together [84]. In order to prevent the weight of the biopellets from decreasing due to lignin degradation, Wistara et al. [97] stated that the densification procedure, in particular, must be carried out below a temperature of 200°C. Tg’s temperature may rise after becoming a biopellet as a result of this procedure.
Based on SNI 8675:2018, the results of tests for moisture content, density, and fixed carbon value showed that biopellets made from seven kinds of lignocellulosic raw materials (raru wood, sengon, mangrove, toba frankincense, oil palm stems, manau rattan, and belangke bamboo) were of good quality. The best biopellets were produced by 40 mesh and 60 mesh from raru wood. A significance value of >0.05 in the homogeneity study indicated that the data was homogeneous. In terms of volatile matter, ash content, fixed carbon, and biopellet density, statistical analysis showed that the interaction between raw material type and particle size was significantly different (p < 0.05).
Acknowledgement: We would like to express our sincere gratitude to the Directorate General of Higher Education Ministry of Research, Technology and Higher Education, Republic Indonesia and University of Forestry, Sofia, Bulgaria for supporting the research fund.
Funding Statement: We would like to express our sincere gratitude to the Directorate General of Higher Education Ministry of Research, Technology and Higher Education, Republic Indonesia, for supporting the research fund through to Grant of Penelitian Tesis Magister (PTM) year 2022 (Number 14/UN5.2.3.1/PPM/KP-DRTPM/TI/2022). This research was also supported by the project “Development, Exploitation Properties and Application of Eco-Friendly Wood-Based Composites from Alternative Lignocellulosic Raw Materials”, Project No. НИС-Б-1290/19.10.2023, carried out at the University of Forestry, Sofia, Bulgaria.
Author Contributions: A.H.I., A.N., S.D., L.S.H., P.A., W.F.: conceptualization, writing—original draft, and writing—review and editing; A.H.I., A.N., S.D.: methodology and validation; D.S.K., L.M.O., S.S.K., A.H.I., W.F., L.S.H., P.A., P.R.N.: resources and project administration; A.H.I., P.A.: investigation; A.R.P, E.W.M., H.M., A.P.A.S.H.P.: visualization, and investigation. All authors have read and agreed to the published version of the manuscript.
Availability of Data and Materials: Data are contained within the article.
Conflicts of Interest: The authors declare that they have no conflicts of interest to report regarding the present study.
References
1. Bot BV, Sosso OT, Tamba JG, Lekane E, Bikai J, Ndame MK. Preparation and characterization of biomass briquettes made from banana peels, sugarcane bagasse, coconut shells and rattan waste. Biomass Convers Biorefin. 2023;13:7937–46. doi:10.1007/s13399-021-01762-w. [Google Scholar] [CrossRef]
2. Pambudi NA, Firdaus RA, Rizkiana R, Ulfa DK, Salsabila MS, Suharno S. Renewable energy in Indonesia: current status, potential, and future development. Sustainability. 2023;15:2342. [Google Scholar]
3. Aswadi K, Jamal A, Syahnur S, Nasir M. Renewable and non-renewable energy consumption in Indonesia: does it matter for economic growth? Int J Energy Econ Policy. 2023;13:107–16. [Google Scholar]
4. Saleem M. Possibility of utilizing agriculture biomass as a renewable and sustainable future energy source. Heliyon. 2022;8:1–11. [Google Scholar]
5. Chen WH, Peng J, Bi XT. A state-of-the-art review of biomass torrefaction, densification and applications. Renew Sustain Energ Rev. 2015;44:847–66. [Google Scholar]
6. Craven JM, Swithenbank J, Sharifi VN, Peralta-Solorio D, Kelsall G, Sage P. Hydrophobic coatings for moisture stable wood pellets. Biomass Bioenergy. 2015;80:278–85. [Google Scholar]
7. Tauro R, García CA, Skutsch M, Masera O. The potential for sustainable biomass pellets in Mexico: an analysis of energy potential, logistic costs and market demand. Renew Sustain Energ Rev. 2018;82:380–9. [Google Scholar]
8. Patzek TW, Pimentel D. Thermodynamics of energy production from biomass. CRC Crit Rev Plant Sci. 2005;24:327–64. [Google Scholar]
9. Thomson H, Liddell C. The suitability of wood pellet heating for domestic households: a review of literature. Renew Sustain Energ Rev. 2015;42:1362–9. [Google Scholar]
10. Kowollik M. Costa Rica carbono neutral : un país pequeño con metas grandes. FES Costa Rica. 2014;8:6. [Google Scholar]
11. Rabier F, Temmerman M, Böhm T, Hartmann H, Daugbjerg JP, Rathbauer J, et al. Particle density determination of pellets and briquettes. Biomass Bioenergy. 2006;30:954–63. [Google Scholar]
12. Numbere AO. Utilization of the mangrove forest for sustainable renewable energy production. Progress Petrochem Sci. 2020;3:324–29. doi:10.31031/pps.2020.03.000561. [Google Scholar] [CrossRef]
13. Tambunan H, Nuryawan A, Iswanto AH, Risnasari I, Basyuni M, Fatriasari W. Briquettes made of branches wood of three mangrove species bonded by starch adhesive. Materials. 2023;16:5266. [Google Scholar] [PubMed]
14. Ruslandi, Novita N, Malik A. Utilization of timber harvesting residues for wood pellet production: a green strategy to improve timber concession’s profitability. IOP Conf Ser Earth Environ Sci. 2020;415:1–9. [Google Scholar]
15. Souza AM, Nascimento MF, Almeida DH, Lopes Silva DA, Almeida TH, Christoforo AL, et al. Wood-based composite made of wood waste and epoxy based ink-waste as adhesive: a cleaner production alternative. J Clean Prod. 2018;193:549–62. [Google Scholar]
16. Astari L, Sudarmanto, Kusumah SS, Akbar F, Prasetiyo KW. Quality of particleboard made from rattan waste. IOP Conf Ser Earth Environ Sci. 2019;374:012009-1–7. doi:10.1088/1755-1315/374/1/012009. [Google Scholar] [CrossRef]
17. Srivaro S, Matan N, Lam F. Property gradients in oil palm trunk (Elaeis guineensis). J Wood Sci. 2018;64:709–19. [Google Scholar]
18. Ulloa JB, van Weerd JH, Huisman EA, Verreth JAJ. Tropical agricultural residues and their potential uses in fish feeds: the Costa Rican situation. Waste Manage. 2004;24:87–97. [Google Scholar]
19. Hendra D. Design and manufacture of wood pellets machine and testing of its product. Jurnal Penelitian Hasil Hutan. 2012;30:144–54. [Google Scholar]
20. Harun NY, Afzal MT. Effect of particle size on mechanical properties of pellets made from biomass blends. Procedia Eng. 2016;148:93–9. [Google Scholar]
21. Maciel J. Standard test method for gross calorific value of coal and coke. ASTM D5865; 2017. doi:10.1520/D5865-10A.2. [Google Scholar] [CrossRef]
22. Karlinasari L, Lestari AT, Priadi T. Evaluation of surface roughness and wettability of heat-treated, fast-growing tropical wood species sengon (Paraserianthes falcataria (L.) I.C. Nielsenjabon (Anthocephalus cadamba (Roxb.) Miqand acacia (Acacia mangium Willd.). Int Wood Prod J. 2018;9:142–8. [Google Scholar]
23. Daud NM, Nor NM, Yusof MA, Al Bakhri AAM, Shaari AA. The physical and mechanical properties of treated and untreated Gigantochloa Scortechinii bamboo. AIP Conf Proc. 2018;1930:020016-1–8. doi:10.1063/1.5022910. [Google Scholar] [CrossRef]
24. Hisham HN, Hale M, Norasikin AL. Equilibrium moisture content and moisture exclusion efficiency of acetylated rattan (Calamus manan). J Trop Forest Sci. 2014;26:32–40. [Google Scholar]
25. Silvério FO, Barbosa LCA, Maltha CRA, Fidêncio PH, Cruz MP, Veloso DP, et al. Effect of storage time on the composition and content of wood extractives in Eucalyptus cultivated in Brazil. Bioresour Technol. 2008;99:4878–86. [Google Scholar]
26. García R, Pizarro C, Lavín AG, Bueno JL. Spanish biofuels heating value estimation. Part II: proximate analysis data. Fuel. 2014;117:1139–47. [Google Scholar]
27. Zardzewiały M, Bajcar M, Saletnik B, Puchalski C, Gorzelany J. Biomass from green areas and its use for energy purposes. Appl Sci. 2023;15:6517. [Google Scholar]
28. Hidayat W, Suri IF, Febryano IG, Afkar H, Rahmawati L, Duryat, et al. Environmentally-friendly wood modification: physical and mechanical properties of Jabon wood (Anthocephalus cadamba) as affected by oil heat treatment. Int J Heat Technol. 2023;41:769–74. [Google Scholar]
29. Vlad R, Pei G, Sidor CG, Cuciurean C, Ispravnic A, Stefan G. Assessing standing-tree wood density by microdrilling in tending forestry work carried out on norway spruce (Picea abies (L.) H. Karst) stands. Forest. 2022;13:1–15. [Google Scholar]
30. Sushardi RA, Gunawan S, Santi IS, Azman MNA, Dharmawati ND, Isnawan BH. The selection of environmentally friendly wood for raw materials in the creative industries. Syst Rev Pharm. 2020;11:523–8. [Google Scholar]
31. Iswanto AH, Madyaratri EW, Hutabarat NS, Zunaedi ER, Darwis A, Hidayat W, et al. Chemical, physical, and mechanical properties of Belangke Bamboo (Gigantochloa pruriens) and its application as a reinforcing material in particleboard manufacturing. Polymers. 2022;14:1–25. doi:10.3390/polym14153111. [Google Scholar] [PubMed] [CrossRef]
32. Sharma M, Sharma CL, Haokip D. Anatomical and physical characteristics of some rattan species. J Indian Acad Wood Sci. 2018;15:132–9. [Google Scholar]
33. Baharoğlu M, Nemli G, Sarı B, Birtürk T, Bardak S. Effects of anatomical and chemical properties of wood on the quality of particleboard. Compos B Eng. 2013;52:282–5. [Google Scholar]
34. Manzoor E, Majeed Z, Nawazish S, Akhtar W, Baig S, Baig A, et al. Wood ash additive for performance improvement of gelatin-based slow-release urea fertilizer. Agriculture. 2022;12:1–16. [Google Scholar]
35. Iswanto AH, Siregar YS, Susilowati A, Darwis A, Hartono R, Wirjosentono B, et al. Variation in chemical constituent of Styrax sumatrana wood growing at different cultivation site in North Sumatra, Indonesia. Biodiversitas. 2019;20:448–52. [Google Scholar]
36. Ahmed SA, Hosseinpourpia R, Brischke C, Adamopoulos S. Anatomical, physical, chemical, and biological durability properties of two rattan species of different diameter classes. Forests. 2022;13:1–13. [Google Scholar]
37. Umar HA, Sulaiman SA, Ahmad RK, Tamili SN. Characterisation of oil palm trunk and frond as fuel for biomass thermochemical. IOP Conf Ser Mater Sci Eng. 2020;863:012011-1–10. doi:10.1088/1757-899X/863/1/012011. [Google Scholar] [CrossRef]
38. Szymanska-Chargot M, Chylinska M, Gdula K, Koziol A, Zdunek A. Isolation and characterization of cellulose from different fruit and vegetable pomaces. Polymers. 2017;9:1–16. doi:10.3390/polym9100495. [Google Scholar] [PubMed] [CrossRef]
39. Iswanto AH, Tarigan F, Susilowati A, Darwis A, Fatriasari W. Wood chemical compositions of raru species originating from central Tapanuli, North Sumatra, Indonesia: effect of differences in wood species and log positions. J Korean Wood Sci Technol. 2021;49:416–29. [Google Scholar]
40. Lamaming J, Hashim R, Sulaiman O, Leh CP, Sugimoto T, Nordin NA. Cellulose nanocrystals isolated from oil palm trunk. Carbohydr Polym. 2015;127:202–8. [Google Scholar] [PubMed]
41. Ding L, Han X, Cao L, Chen Y, Ling Z, Han J, et al. Characterization of natural fiber from manau rattan as a potential reinforcement for polymer-based composites. J Biores Bioprod. 2022;7:190–200. [Google Scholar]
42. Taokaew S, Kriangkrai W. Recent progress in processing cellulose using ionic liquids as solvents. Polysaccharides. 2022;3:671–91. [Google Scholar]
43. Yuan Y, Li F, Han N, Zeng B, Imaizumi Y, Na R. Exploring the valorization of buckwheat waste: a two-stage thermo-chemical process for the production of saccharides and biochar. Fermentation. 2022;8:1–15. [Google Scholar]
44. Prabawa IDGP, Miyono M. The quality of biopellet from rubber seed shell and ater bamboo. Jurnal Riset Industri Hasil Hutan. 2018;9:99–110. [Google Scholar]
45. Solihat NN, Sari FP, Falah F, Ismayati M, Lubis MAR, Fatriasari W, et al. Lignin as an active biomaterial: a review. Jurnal Sylva Lestari. 2021;9:1. [Google Scholar]
46. Nawawi DS, Rita KS, Wistara NJ, Fatrawana A, Astuti P, Syafii W. Lignin characteristic of four bamboo species). Jurnal Ilmu dan Teknologi Kayu Tropis. 2019;17:1–7. [Google Scholar]
47. Kusiak W, Majka J, Zborowska M, Ratajczak I. Chemical composition and related properties of lime (Mill.) bark and wood as affected by tree growth conditions. Materials. 2022;15:1–13. [Google Scholar]
48. Wang N, Tahmasebi A, Yu J, Xu J, Huang F, Mamaeva A. A comparative study of microwave-induced pyrolysis of lignocellulosic and algal biomass. Bioresour Technol. 2015;190:89–96. [Google Scholar] [PubMed]
49. Ghatak HR, Kundu PP, Kumar S. Thermochemical comparison of lignin separated by electrolysis and acid precipitation from soda black liquor of agricultural residues. Thermochim Acta. 2010;502:85–9. [Google Scholar]
50. Frodeson S, Henriksson G, Berghel J. Biomass pellet bonding. BioResources. 2018;13:1202–22. [Google Scholar]
51. Lubis AS, Romli M, Yani M, Pari G. The qualities of biopellets from bagasse, peanut shell and cacao pod. Jurnal Teknologi Industri Pertanian. 2016;26:77–86. [Google Scholar]
52. Chatterjie S, Saito T. Lignin derived carbon materials. ChemSusChem. 2016;9:3441–7. [Google Scholar]
53. Ramandhany S, Sugiarti E, Desiati RD, Martides E, Junianto E, Prawara B, et al. The effect of silicon as a reactive element for NiCrAl coating performance on hastelloy substrate. IOP Conf Series: Mat Sci Eng. 2018;432:12017. [Google Scholar]
54. Ningsih E, Udyani K, Budianto A, Hamidah N, Afifa S. Effect of charcoal particle size from plastic bottle caps waste on briquette quality. Majalah Kulit Karet dan Plastik. 2020;36(2):101. [Google Scholar]
55. Dewi RP, Saputra TJ, Purnomo SJ. Analysis of the characteristics of sawdust and coconut shell charcoal briquettes. Jurnal teknik Mesin Indonesia. 2022;17:1–5 (In Indonesia). [Google Scholar]
56. Rosyadi I, Wahyudi H, Satria D, Yusvardi Y, Febriando. Analysis of pyrolysis results on corn cob biomass waste with acacia wood. Prosiding seminar Nasional Inovasi dan Aplikasi Teknologi di Industri; 2018; Indonesia: Malang. p. 229–34 (In Indonesia). [Google Scholar]
57. Suriapparao DV, Vinu R. Effects of biomass particle size on slow pyrolysis kinetics and fast pyrolysis product distribution. Waste Biomass Valori. 2018;9:465–77. [Google Scholar]
58. Kpalo SY, Zainuddin MF, Manaf LA, Roslan AM. Production and characterization of hybrid briquettes from corncobs and oil palm trunk bark under a low pressure densification technique. Sustainability. 2020;12:2468. doi:10.3390/su12062468. [Google Scholar] [CrossRef]
59. Zulfian Z, Diba F, Setyawati D, Nurhaida N, Roslinda E. The quality of biopelet from oil palm trunk waste with different size of particle and adhesives. Jurnal Hutan Lestari. 2015;3:208–16. [Google Scholar]
60. Mustamu S, Hermawan D, Pari G. Characteristic of biopellet made of solid waste of cajuput and pine resin. Jurnal Penelitian Hasil Hutan. 2018;36:191–204. [Google Scholar]
61. Susanti PD, Wahyuningtyas RS, Ardhana A. Utilization of peat swamp weed as raw material for Bio-briquettes. Jurnal Penelitian Hasil Hutan. 2015;33:35–46. [Google Scholar]
62. Terzopoulou P, Kamperidou V, Lykidis C. Cypress wood and bark residues chemical characterization and utilization as fuel pellets feedstock. Forests. 2022;13:1–18. [Google Scholar]
63. Thy P, Barfod GH, Cole AM, Brown EL, Jenkins BM, Lesher CE. Trace metal release during wood pyrolysis. Fuel. 2017;203:548–56. [Google Scholar]
64. Amaya A. Preparation of charcoal pellets from eucalyptus wood with different binders. J Energy Nat Resour. 2015;4:34. [Google Scholar]
65. Wibowo S, Laia DPO, Khotib M, Pari G. Characterization of carbon pellets made from elephant grass (Pennisetum purpureum Scumach) mixed with nyamplung shell (Calophyllum inophyllum Linn.). Jurnal Penelitian Hasil Hutan. 2017;35:73–82. [Google Scholar]
66. Al Qadry MG, Saputra DD, Widodo RD. Characteristics and combustion tests of biopellet mixture of palm oil shells and wood powder as a renewable alternative fuel. Jurnal Sains dan Teknologi. 2018;16:177–88 (In Indonesia). [Google Scholar]
67. Hersztek MM, Gondek K, Jewiarz M, Dziedzic K. Assessment of energy parameters of biomass and biochars, leachability of heavy metals and phytotoxicity of their ashes. J Mater Cycles Waste Manage. 2019;21:786–800. [Google Scholar]
68. Ariski MA, Mikhratunnisa. Characteristics of Albizia Chinensis wood Sawdust Briquette product at high compression method. J Mech Electric Ind Eng. 2023;5:139–50 (In Indonesia). [Google Scholar]
69. Iskandar N, Sulardjaka S, Munadi M, Nugroho S, Muhamadin RC, Fitriyana DF. The effect of water content and binder made from cassava starch and densification pressure on the quality of rice husk bio-pellets. J Phys Conf Ser. 2020;1517:012019-1–6. doi:10.1088/1742-6596/1517/1/012019. [Google Scholar] [CrossRef]
70. Kamperidou V, Lykidis C, Barmpoutis P. Utilization of wood and bark of fast-growing hardwood species in energy production. J For Sci. 2018;64:164–70. [Google Scholar]
71. Simanjuntak FA, Wisnu FK, Telaumbanua M, Haryanto A. Effect of holding time and particle size on the quality of sawdust pellets. J Agric Biosyst Eng. 2022;1:349–60. [Google Scholar]
72. Brayen D, Windiarti RYP, Erlinawati ZA. The influence of process variables and the addition of palm oil shells on the characteristics of sawdust biopellets. Distilasi. 2022;7:41–51 (In Indonesia). [Google Scholar]
73. Junary E, Pane JP, Herlina N. The effect of carbonization temperature and time on the calorific value and characteristics of making bioarang from sugar palm fronds (Arenga pinnata). Jurnal Teknik Kimia USU. 2015;4:46–52 (In Indonesia). [Google Scholar]
74. Lamanda DD, Setyawati D, Nurhaida DF, Roslinda E. Characteristic biopellets based on composition of oil palm trunk and laban wood charcoal with different adhesive type as a new renewable energy. Jurnal Hutan Lestari. 2015;3:313–21. [Google Scholar]
75. Jannah R, Sribudiani E, Somadona S. Biopelet from biomass waste rattan shavings powder and mixed sawdust using sago adhesive as alternative energy sources. Wahana Forestra: Jurnal Kehutanan. 2022;17:1478–161. [Google Scholar]
76. Damayanti R, Lusiana N, Prasetyo J. Study effect of particle size and tapioca starch addition on biopelet characteristic from cacao shell (Theobroma cacao L.) as alternative renewable fuel. Jurnal Teknotan. 2017;11:51–60. [Google Scholar]
77. Fatriani F, Sunardi S, Arfianti A. Air conditions, revenues, and conditions abu wood pellet powder wood galam timber (Melaleuca cajuputi Roxb) and wood Akasia (Acacia mangium Wild). EnviroScienteae. 2018;14:77. [Google Scholar]
78. Wardani L, Massijaya MY, Machdie MF. Utilization of oil palm wastes and recycled plastic as raw materials for wood-plastic composites. Jurnal Ilmu dan Teknologi Kayu Tropis. 2012;10:51–9. [Google Scholar]
79. Selivanovs J, Blumberga D, Ziemele J, Blumberga A, Barisa A. Research of woody biomass drying process in pellet production. Environ Clim Technol. 2012;10:46–50. [Google Scholar]
80. Prasetyo DM, Wulandari FT, Webliana K. Characteristics of biopellets from rice husk and teak wood shaws (Tectona grandis Linn. F). J Forest Sci Avicennia. 2022;5:137–50. [Google Scholar]
81. Liliana W. Improving the quality of jatropha meal biopellets as fuel through carbonization techniques (Master Thesis). IPB University: Bogor, Indonesia; 2010 (In Indonesia). [Google Scholar]
82. Smołka-Danielowska D, Jabłońska M. Chemical and mineral composition of ashes from wood biomass combustion in domestic wood-fired furnaces. Int J Environ Sci Technol. 2022;19:5359–72. [Google Scholar]
83. Alpian Y, Supriyati W. Making pellets from wood waste powder using simple pressing and molding tools. Agrienvi. 2019;3:22–31 (In Indonesia). [Google Scholar]
84. Wistara NJ, Bahri S, Pari G. Biopellet properties of agathis wood fortified with its peeled-off bark. IOP Conf Ser Mater Sci Eng. 2020;935:012047-1–14. doi:10.1088/1757-899X/935/1/012047. [Google Scholar] [CrossRef]
85. Azizi K, Moshfegh Haghighi A, Keshavarz Moraveji M, Olazar M, Lopez G. Co-pyrolysis of binary and ternary mixtures of microalgae, wood and waste tires through TGA. Renew Energy. 2019;142:264–71. [Google Scholar]
86. Rahman MR, Hamdan S, Chang HJL. Differential scanning calorimetry (DSC) and thermogravimetric analysis (TGA) of wood polymer nanocomposites. MATEC Web Conf; 2017;87:03013. doi:10.1051/matecconf/20178703013. [Google Scholar] [CrossRef]
87. Guo F, Liu Y, Wang Y, Li X, Li T, Guo C. Pyrolysis kinetics and behavior of potassium-impregnated pine wood in TGA and a fixed-bed reactor. Energy Convers Manage. 2016;130:184–91. [Google Scholar]
88. Martha R, Mubarok M, Batubara I, Rahayu IS, Setiono L, Darmawan W, et al. Effect of furfurylation treatment on technological properties of short rotation teak wood. J Mater Res Technol. 2021;12:1689–99. [Google Scholar]
89. Lu M, He W, Li Z, Qiang H, Cao J, Guo F, et al. Effect of lignin content on properties of flexible transparent poplar veneer fabricated by impregnation with epoxy resin. Polymers. 2020;12:1–13. [Google Scholar]
90. Jambreković B, Bajsić EG, Španić N, Sedlar T, Sinković T. Viscoelastic and thermal properties of styrene modified fir wood. Polymers. 2022;14:786. doi:10.3390/polym14040786. [Google Scholar] [PubMed] [CrossRef]
91. Wang Q, Wu X, Yuan C, Lou Z, Li Y. Effect of saturated steam heat treatment on physical and chemical properties of bamboo. Molecules. 2020;25:1999. doi:10.3390/molecules25081999 [Google Scholar] [CrossRef]
92. Ding L, Han X, Chen L, Jiang S. Preparation and properties of hydrophobic and transparent wood. J Bioresour. Bioproducts. 2022;16:1–11. [Google Scholar]
93. Halmaciu IA, Wachter MR, Wachter AR. Comparative analysis of the energy content of diverse fuels performed via thermogravimetric investigations. J Phys: Conf Series. 2022;2212:12005. [Google Scholar]
94. Bryś J, Flores LFV, Górska A, Ostrowska-Ligęza E, Bryś A, Niemiec T, et al. Synthesis followed by spectral and calorimetric evaluation of stability of human milk fat substitutes obtained from thistle milk and lard. Int J Anal Chem. 2019;2019:5417962. [Google Scholar] [PubMed]
95. Solihat NN, Santoso EB, Karimah A, Madyaratri EW, Sari FP, Falah F, et al. Physical and chemical properties of Acacia mangium lignin isolated from pulp mill byproduct for potential application in wood composites. Polymers. 2022;14:491. [Google Scholar] [PubMed]
96. Buranov AU, Ross KA, Mazza G. Bioresource technology isolation and characterization of lignins extracted from flax shives using pressurized aqueous ethanol. Bioresour Technol. 2010;101:7446–55. [Google Scholar] [PubMed]
97. Wistara NJ, Diputra P, Hendra D. Biopellet from demineralized oil palm trunk. IOP Conf Ser Earth Environ Sci. 2021;891:012022-1–11. doi:10.1088/1755-1315/891/1/012022. [Google Scholar] [CrossRef]
Cite This Article
 Copyright © 2024 The Author(s). Published by Tech Science Press.
This work is licensed under a Creative Commons Attribution 4.0 International License , which permits unrestricted use, distribution, and reproduction in any medium, provided the original work is properly cited.
 Downloads
 Citation Tools