
 Submit a Paper
 Propose a Special lssue
 Open Access
ARTICLE

Adsorption of Malachite Green Using Activated Carbon from Mangosteen Peel: Optimization Using Box-Behnken Design
Department of Chemistry, Faculty of Science and Data Analytics, Institute Technology of Sepuluh Nopember, Surabaya, 60111, Indonesia
* Corresponding Author: Yatim Lailun Ni’mah. Email:
(This article belongs to the Special Issue: Special Issue in Celebration of JRM 10 Years)
Journal of Renewable Materials 2024, 12(5), 981-992. https://doi.org/10.32604/jrm.2024.049109
Received 28 December 2023; Accepted 08 March 2024; Issue published 17 July 2024
 View Full Text
 Download PDF
Abstract
In this research, activated carbon from mangosteen peel has been synthesized using sulfuric acid as an activator. The adsorption performance of the activated carbon was optimized using malachite green dye as absorbate. Malachite green dye waste is a toxic and non-biodegradable material that damages the environment. Optimization of adsorption processes was carried out using Response Surface Methodology (RSM) with a Box-Behnken Design (BBD). The synthesized activated carbon was characterized using FTIR and SEM instruments. The FTIR spectra confirmed the presence of a sulfonate group (-SOH) in the activated carbon, indicating that the activation process using sulfuric acid was successful. SEM characterization shows that activated carbon has porous morphology. Optimization was carried out for three adsorption parameters, namely contact time (20, 60, and 120 min), adsorbent mass (0.005, 0.025, and 0.05 g), and initial concentration of malachite green solution (5, 50, and 100 mg·L). The concentration of the malachite green solution was determined using a UV-Vis spectrophotometer at the maximum wavelength of malachite green, 618 nm. The optimum of malachite green adsorption using mangosteen peel activated carbon was obtained at a contact time of 80 min, an adsorbent mass of 0.032 g, and malachite green initial concentration of 25 mg·L, with a maximum removal percentage and maximum adsorption capacity of 93.66% and 19.345 mg·g, respectively.Keywords
Dyes play an important role in various industries, especially textile and printing industries. The textile sector largely depends on synthetic dyes due to their diverse color spectrum, stability, affordability, and ease of use. Malachite green is a synthetic dye commonly used in the textile industry [1]. However, its presence in water systems is strictly regulated, with an accepted limit of 0.01 mg·L-1. Accumulation of malachite green substances in the human body is carcinogenic and can disrupt the immune system and reproductive system [2].
In the textile coloring process, as much as 5%–15% of the dyes used in the fabric coloring process were disposed of as liquid waste [3]. Many studies have been carried out to convert or decompose dye liquid waste, such as biological degradation [2], phytoremediation [3], coagulation-flocculation [4], reverse osmosis [5], and adsorption [6]. Adsorption is a popular method because it is relatively cheap, efficient, a simple process, and easy to apply even on a small scale [7]. Biomass is a source of absorbent that is widely studied today. The main advantages of using biomass as a carbon precursor are ease of processing, economic benefits, and recyclability. The structural and surface properties and chemical composition of the obtained activated carbon vary depending on the biomass source used for its production. Based on research by Mukti et al., mangosteen peel is rich in lignin (48.52%), cellulose (26.22%), and hemicellulose (15.39%) which is a good carbon source for making activated carbon adsorbents [8]. Research by Jawad et al., has utilized H3PO4 activated mangosteen peel activated carbon for the adsorption of methylene blue dye [9,10]. The use of mangosteen peel as an adsorbent in the adsorption of sky blue and rhodamine B dyes was also carried out by Mukti et al. [8].
The adsorption capacity of activated carbon can be increased by chemical or physical activation processes using the pyrolysis process. The activation process can remove impurities from the absorbent so that the pores of the activated carbon open and have a greater adsorption capacity. The physical activation process is carried out by breaking the carbon chain which involves a high-temperature heating process using hot steam or carbon dioxide gas. This heating process will also remove volatile impurities [11]. The purpose of adding chemical activators is to make the surface of the adsorbent become more negatively or positively charged according to its functional group so that it can adsorb anionic or cationic dyes optimally. One chemical activator that is often added to activated carbon is H2SO4. As an activated carbon activator, H2SO4 has the advantage of being cheap and not requiring high temperatures [12].
Optimization of adsorption parameters is generally carried out using the one-factor-at-a-time (OFAT) method. The OFAT method is more commonly used due to its simple implementation. However, this approach requires a relatively large number of experimental runs. In addition, the OFAT method cannot explain the relationship between variables under their optimal setting [13]. Alternatively, Response Surface Methodology (RSM) present a statistical method that can be used to optimize a process where the response variable is influenced by several independent variables [14]. One of the experimental designs in RSM to determine the optimum factor in adsorption is the Box-Behnken Design (BBD). The advantage of using RSM-BBD is that the experimental design is efficient, structured, and enables comprehensive exploration of variable interactions within the experiment [15].
Application of Design of Experiment (DoE) in the optimization of the analytical parameter has some advantages notably reducing the number of experiments required, minimizing reagent consumption, and streamlining laboratory work. The Response Surface Methodology (RSM) is an efficient statical tool for estimating optimal conditions or describing the optimal response generated by completing multi-variable problems using graphical and polynomial equations [16,17].
Box-Behnken design (BBD) serves as a valuable tool for optimizing input variables that influence the percentage of adsorption removal, such as: contact time, adsorbent mass and initial concentration. Using regression analysis, BBD establishes correlations between input factors and response values, thereby facilitating the creation of plots and contour maps for response surface analysis. This visual aid has proven helpful in identifying areas for optimization and determining optimal conditions [18].
2.1 Synthesis of Active Carbon from Mangosteen Peel
Mangosteen peel was washed with demineralized water and ground to become powder. The mangosteen peel powder obtained was dried in an oven at 110°C for 24 h and then sieved to obtain a powder with a size of less than 420 μm. Sulfuric acid 98% was added to mangosteen peel powder with a ratio of 1:1 (w/w). The mixture was stirred and heated in an oven at 150°C for 24 h. The activated carbon from the mangosteen peel was washed using distilled water and then soaked in 1% sodium bicarbonate solution until the foam disappeared and soaked in the same solution for 24 h. The activated carbon was washed again using distilled water and dried in an oven at 80°C for 24 h.
2.2 Adsorption of Malachite Green
The malachite green adsorption onto activated carbon was optimized using parameters including contact time of 20, 60, and 120 min, adsorbent mass of 0.005, 0.025, and 0.05 g, and initial concentration of 5, 50, and 100 mg·L−1 in 25 ml of malachite green solution. The removal percentage was calculated as Eq. (1).
where Co and Ce are the initial and equilibrium malachite green concentrations (mg·L−1), respectively. The initial (Co) and the equilibrium (Ce) concentrations can be determined using a calibration curve of the malachite green standard solution.
2.3 Experimental Design for Optimization
Response Surface Methodology (RSM) with Box-Behnken Design (BBD) was used to optimize malachite green adsorption. RSM is used to display the output of the optimization process, while BBD is used to vary the input in the experimental design. BBD design, regression analysis, and response surface diagrams were performed using Python software [19]. In particular, BBD requires less experimentation compared to central composite design (CCD), thereby reducing chemical consumption during the optimization process.
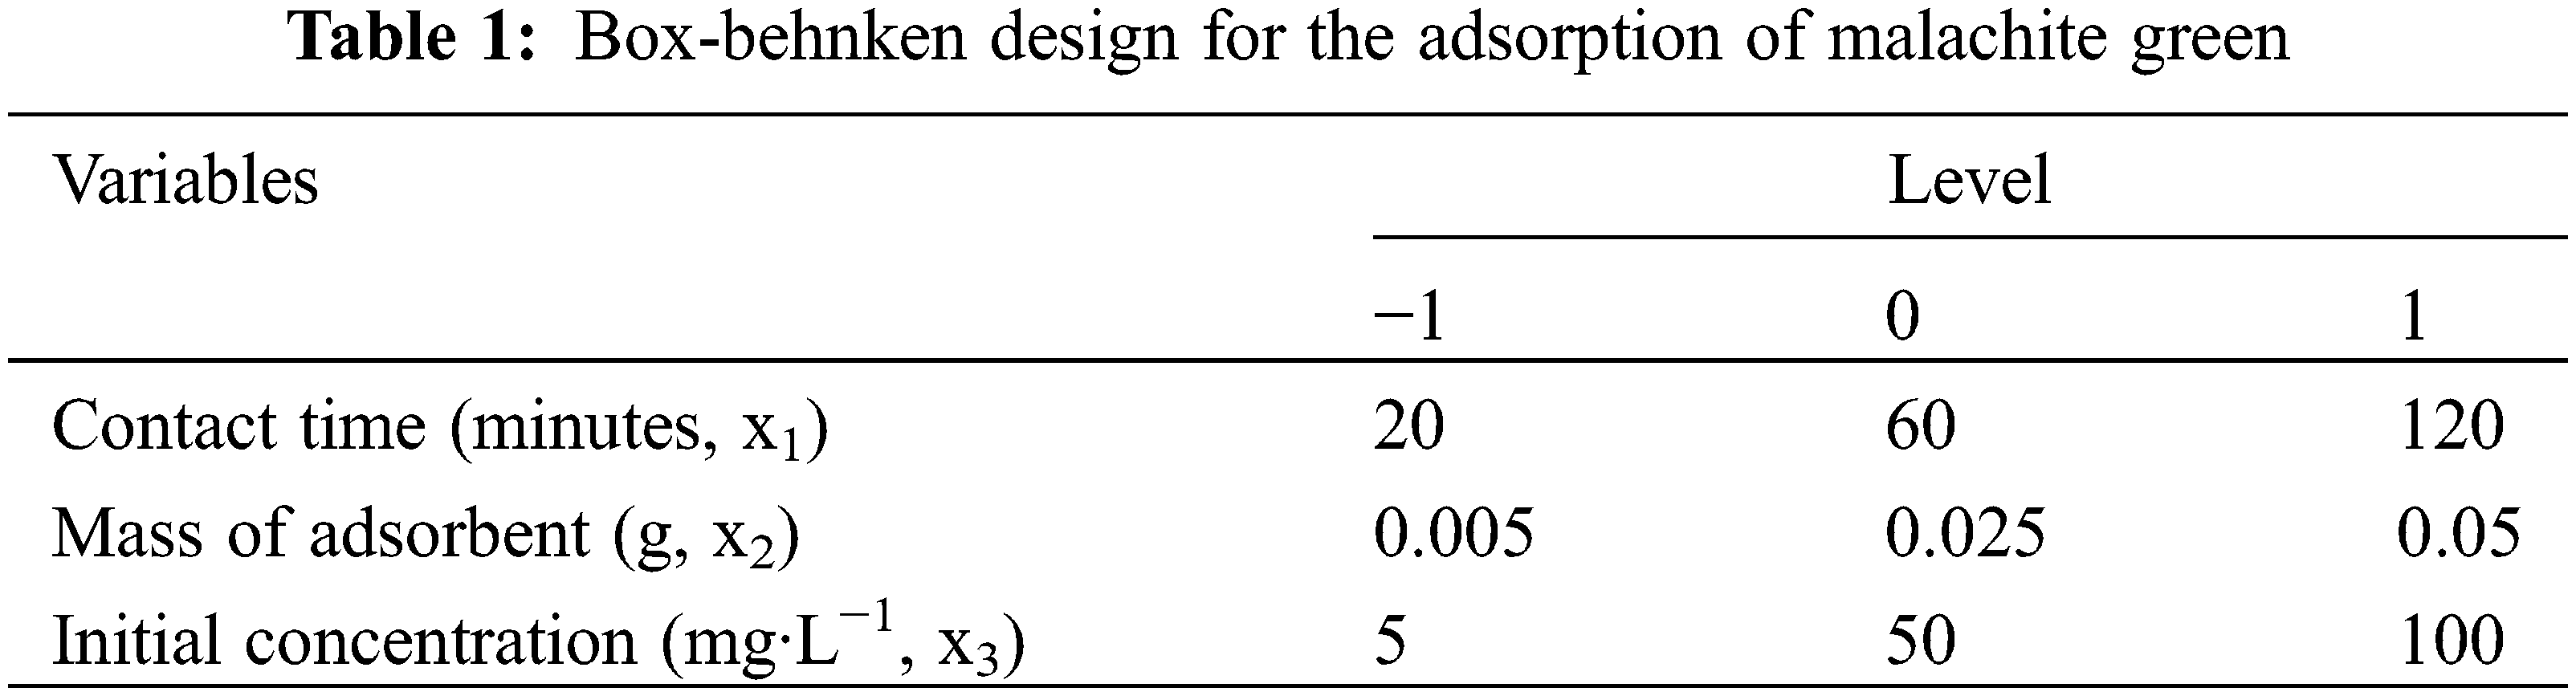
Optimization of malachite green adsorption using BBD with three factors and three levels requires 15 input variations. Three independent factors, namely contact time (x1), adsorbent mass (x2) and initial concentration (x3), were examined at high (+1), medium (0) and low (−1) values, respectively, as summarized in Table 1. RSM displays the optimization of factors influencing the adsorption of malachite green, taking into account the response (% removal) and the relationship between response and factors.
Fourier Transform Infrared Spectroscopy (FTIR) (Rigaku SmartLab®) was used to determine functional groups in mangosteen peel powder, mangosteen peel activated carbon, and mangosteen peel activated carbon after adsorption. Scanning Electron Microscope (SEM) was employed to determine the surface morphology structure of mangosteen peel before and after adsorption.
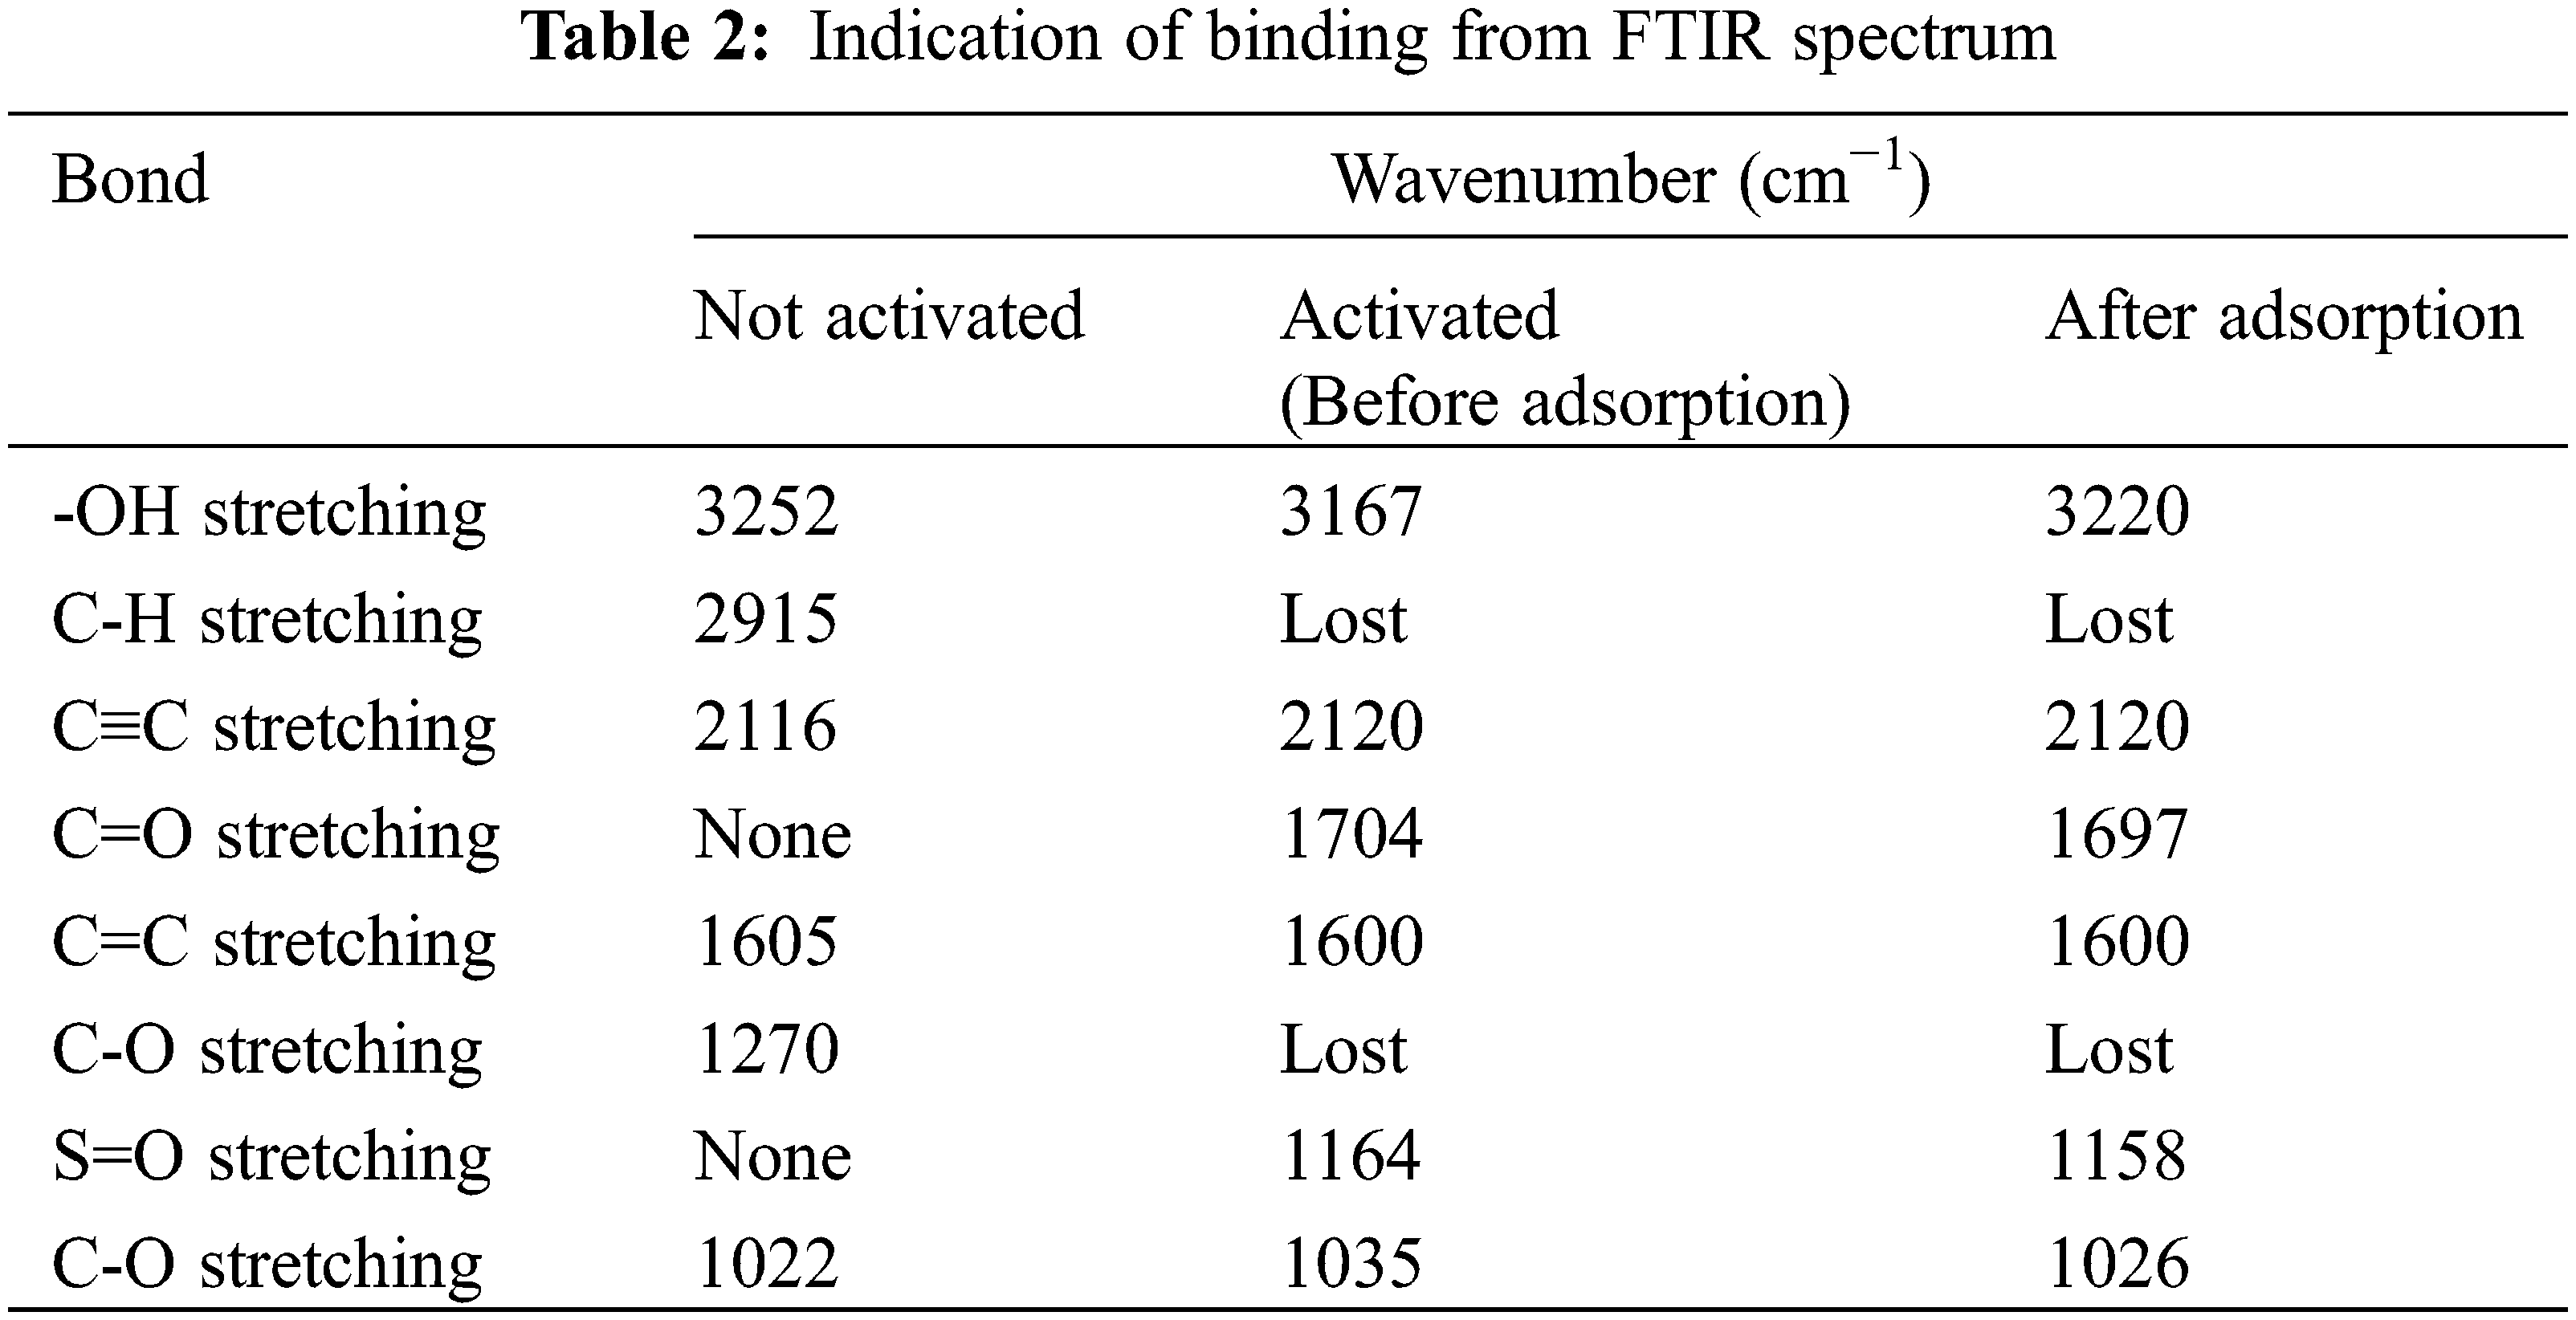
Analysis of functional groups in mangosteen peel powder (KM), mangosteen peel activated carbon (KAKM), and mangosteen peel activated carbon after adsorption was carried out using FTIR as presented in Fig. 1. Based on Fig. 1 and Table 2, it can be seen that the number of peaks in the mangosteen peel activated carbon spectrum is much less compared with the number of peaks in the spectrum of mangosteen peel without activation. This can be caused by the activation process breaking the bonds in the structure of the mangosteen peel, as well as the loss of impurity compounds [20].
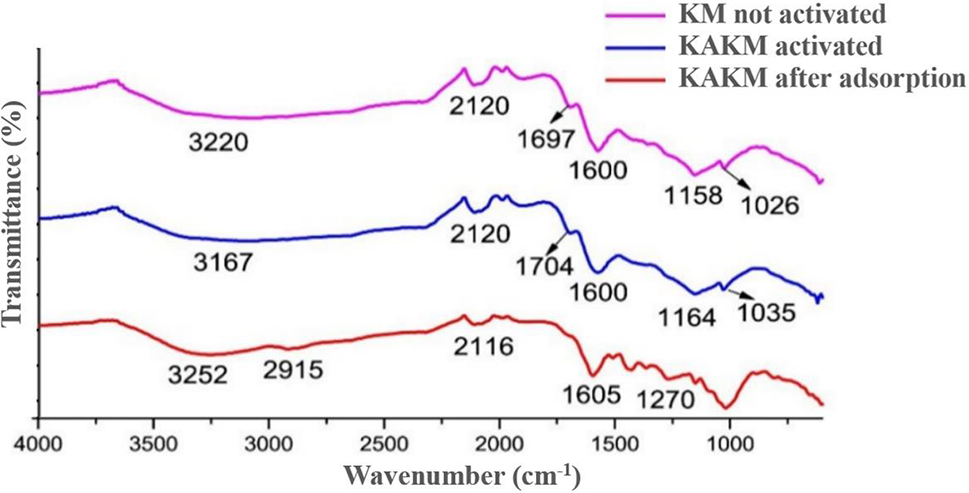
Figure 1: FTIR spectra of mangosteen peel activated carbon before activation, before adsorption, and after adsorption
It can be seen in the KM spectrum that in the wave number area 1500–1000 cm−1, there are many weak peaks, while in the KAKM spectrum, there are none. The strong and broad peak at 3167 cm−1 indicates the stretching vibration of the -OH group from the carboxyl and hydroxyl groups formed from the activation processed with sulfuric acid in the active carbon structure. The formation of these oxide groups makes the surface of the activated carbon acidic and able to absorb basic or cationic compounds [21].
In the KAKM spectrum, the peak at 2915 cm−1 disappears. The peaks at 1704 and 1600 cm−1 indicate the C=O stretching vibration of the carboxyl group and C=C of the organic structure of active carbon, respectively. The peak at 1164 cm−1 indicates the sulfonate group formed from the activation of sulfuric acid. Meanwhile, the peak at 1035 cm−1 indicates the stretching vibration of C-O from the phenol, ester, and ether groups [22,23].
In the spectrum of mangosteen peel-activated carbon and mangosteen peel-activated carbon after adsorption, it can be observed that there are not many peak differences. This can be explained that during the adsorption process, no chemical bonds are formed between the dye and the absorbent as evidenced by the absence of new peaks formed in the KAKM spectrum after adsorption. Where the interaction between adsorbent and adsorbate is only in the form of weak intermolecular attractive forces, such as Van der Waals forces [24].
In the spectrum of mangosteen peel-activated carbon and mangosteen peel-activated carbon after adsorption, it can be observed that there are not many peak differences. This can be explained that during the adsorption process, no chemical bonds are formed between the dye and the absorbent as evidenced by the absence of new peaks formed in the KAKM spectrum after adsorption. Where the interaction between adsorbent and adsorbate is only in the form of weak intermolecular attractive forces, such as Van der Waals forces, electrostatic interactions, and weak hydrogen bonds between molecules [25].
The surface morphology characterization of mangosteen peel-activated carbon was carried out using SEM instruments. SEM analysis was carried out with a voltage of 1.0 kV and magnifications of 1.300× and 500× using SE. The SEM micrograph of mangosteen peel-activated carbon can be seen in Fig. 2. The micrograph shows an uneven surface, with gaps and holes of varying sizes. This condition is formed during the chemical activation process using sulfuric acid. From the SEM characterization results, it can be concluded that the synthesized mangosteen peel-activated carbon has the potential to be used as an adsorbent in the adsorption of malachite green [26].
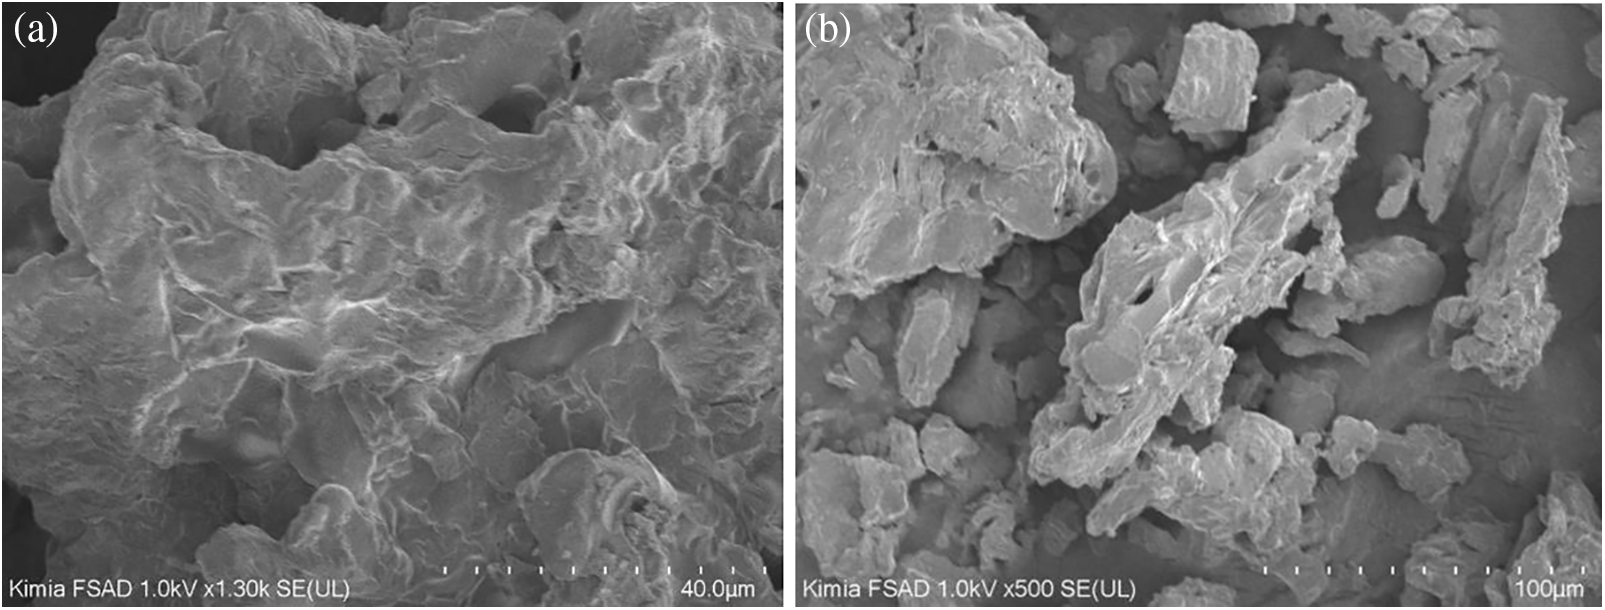
Figure 2: SEM micrograph of mangosteen peel activated carbon (a) magnification 1300×, and (b) magnification 500×
3.2 Optimization of Adsorption Malachite Green
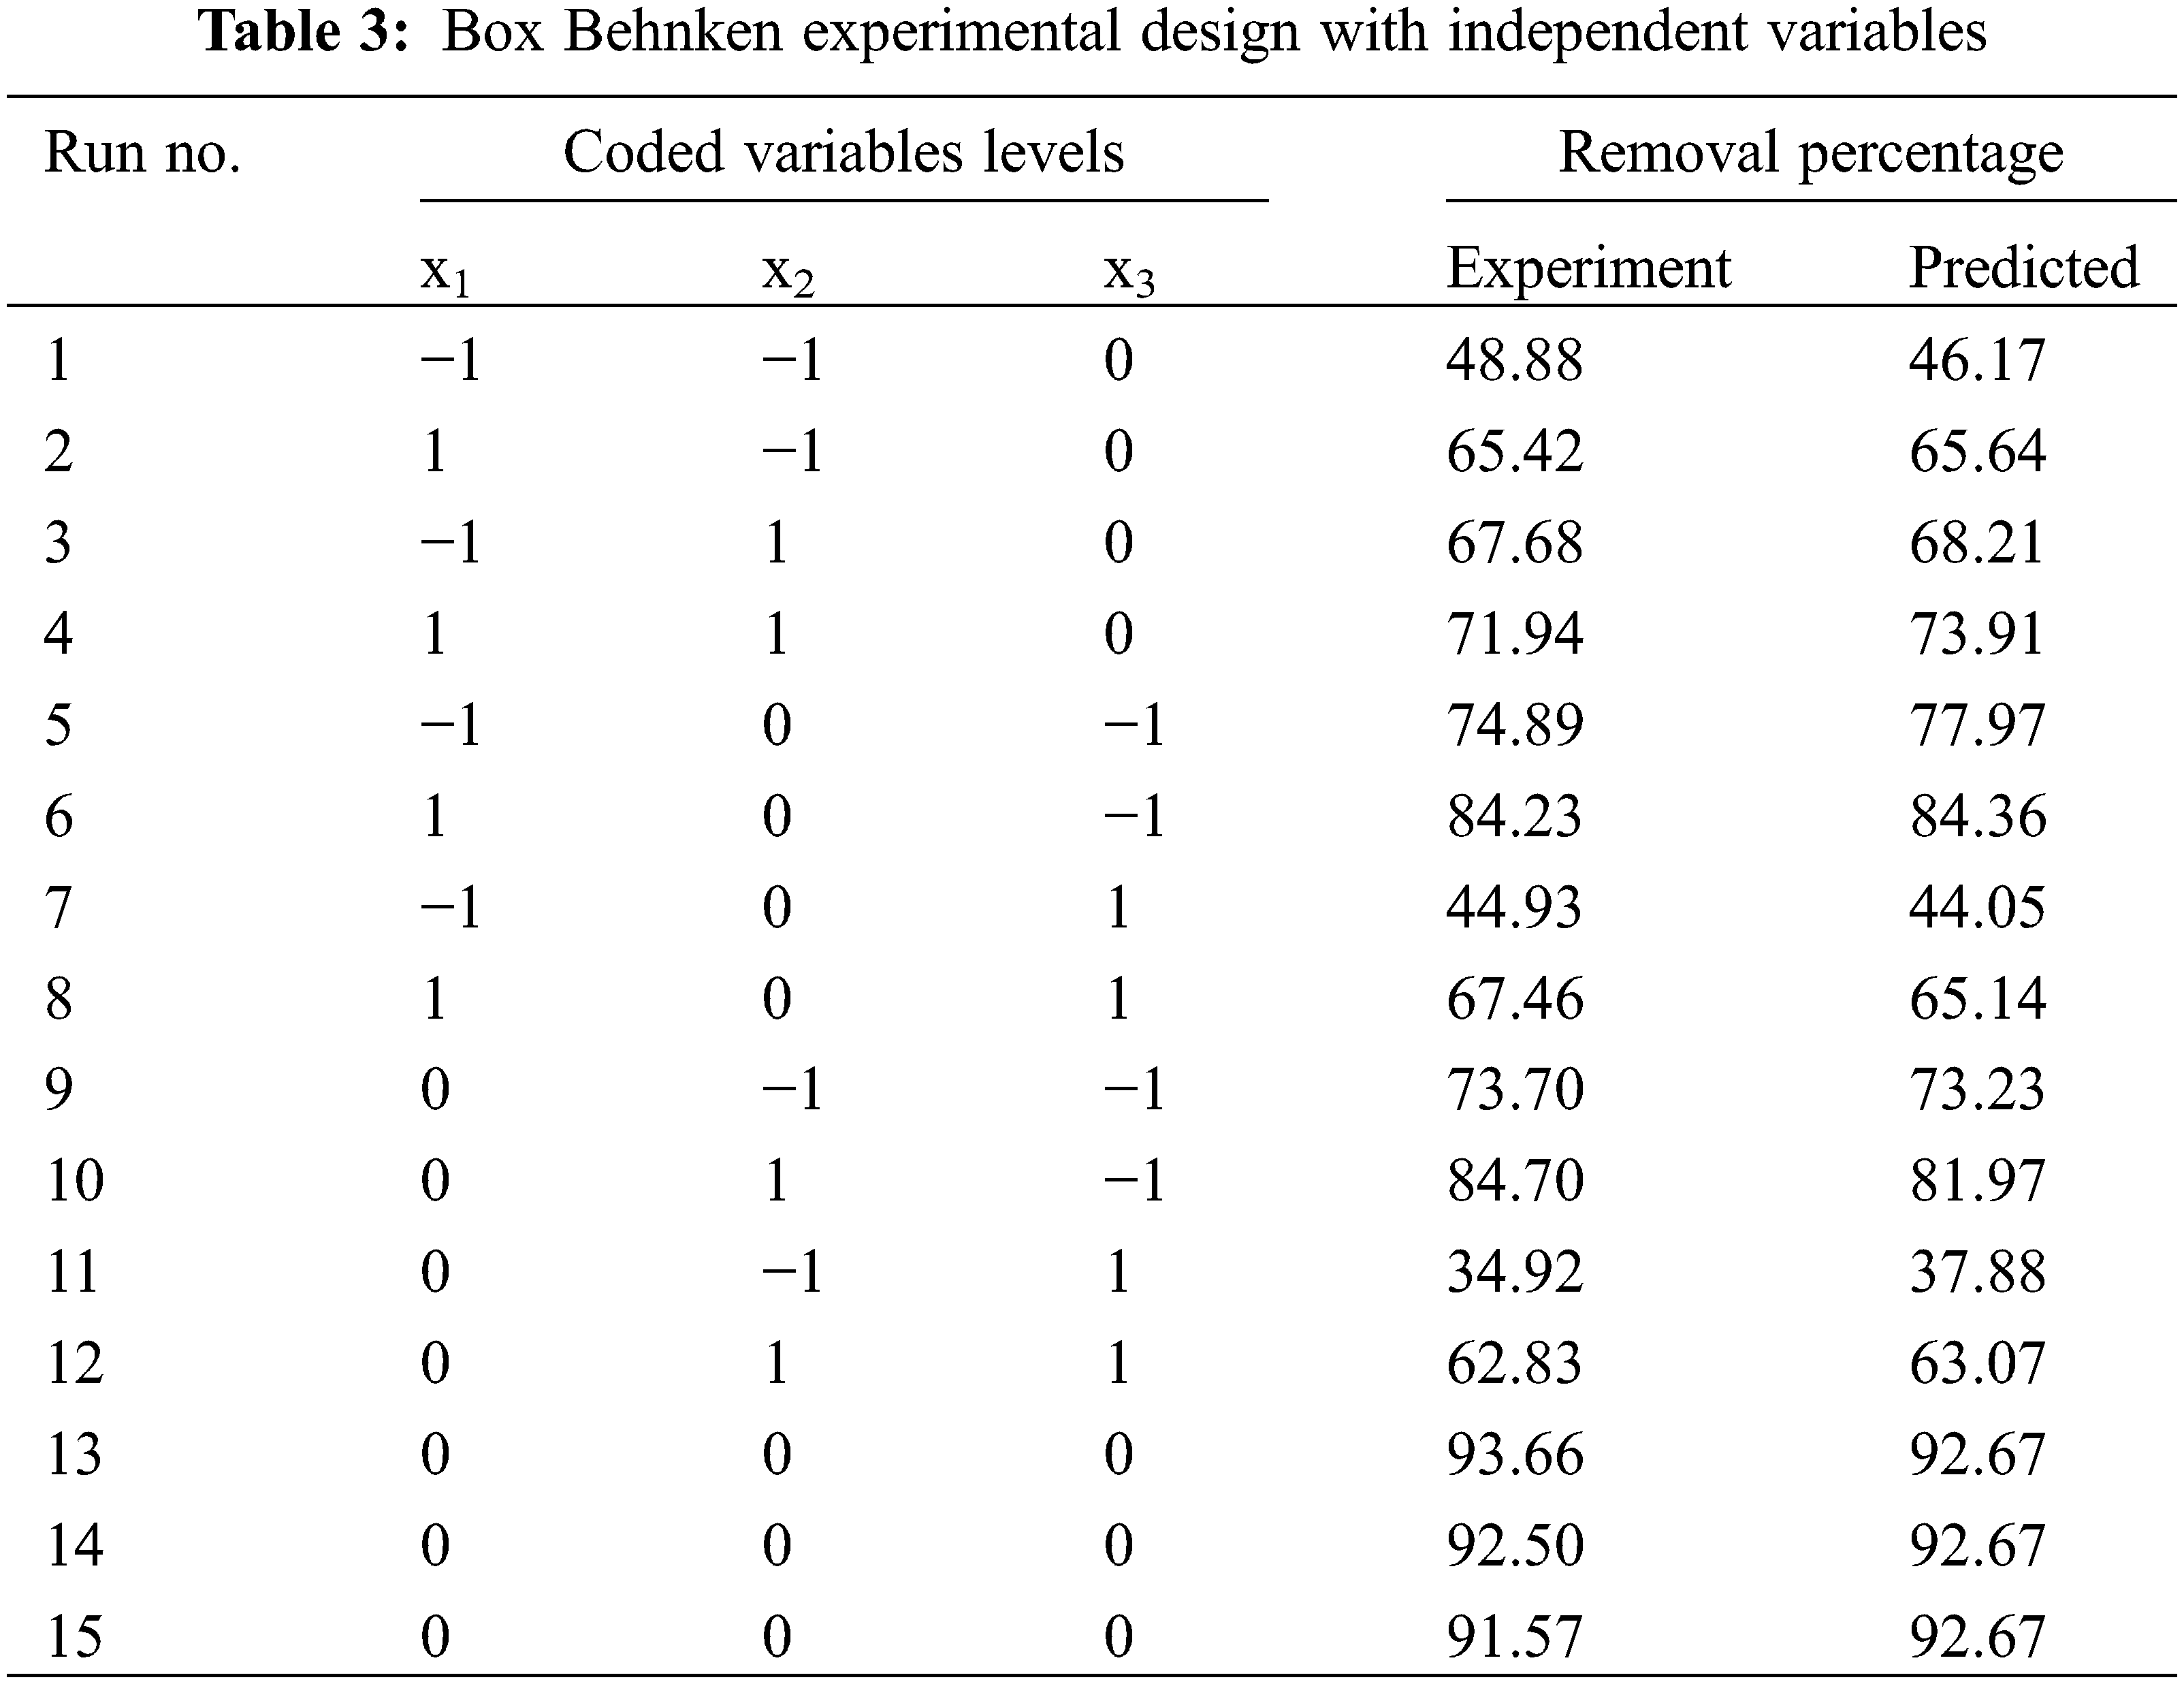
Adsorption was optimized using BBD with 15 experiments from a combination of three factors and three levels of contact time, adsorbent mass, and initial concentration. The malachite green adsorption results obtained are shown in Table 3. Regression analysis of experimental results as a function of input factors was carried out using a polynomial equation (Eq. (2)).
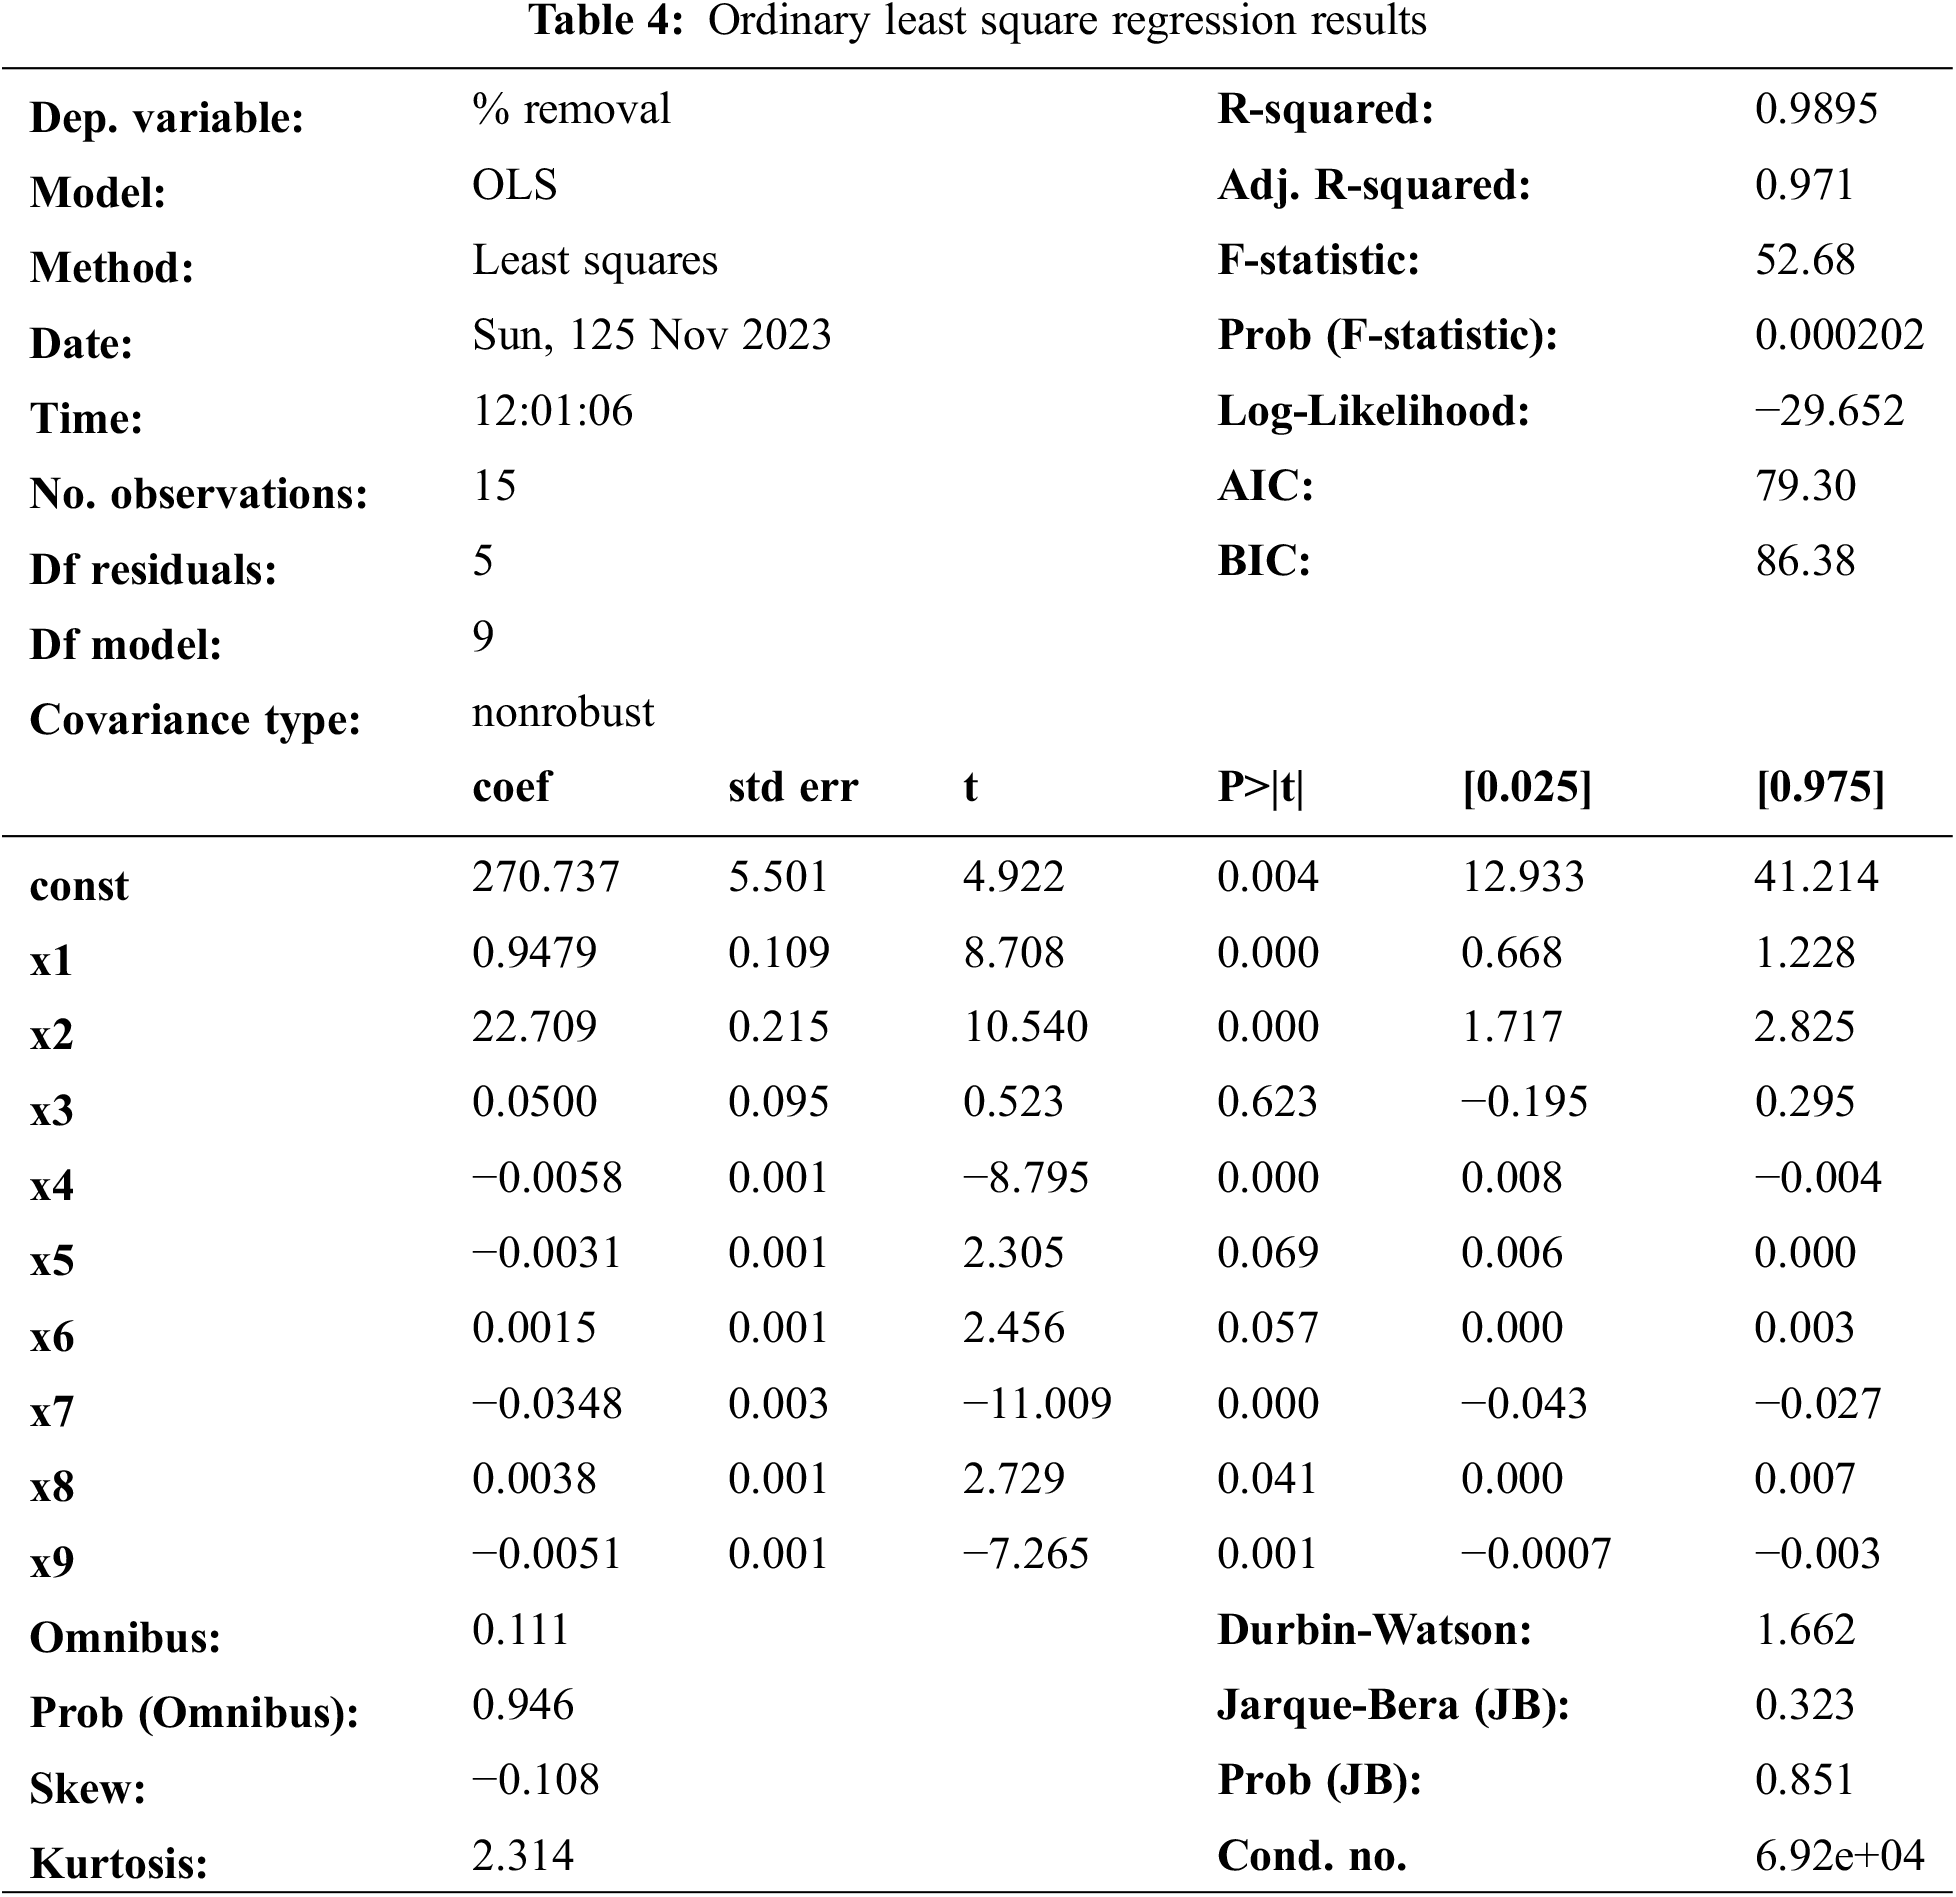
The correlation coefficient (R2) shows the linear relationship between two or more variables. The closer it is to 1, the more linear the relationship between variables and vice versa. The correlation coefficient (R2) for malachite green adsorption was obtained at 0.9895 from Eq. (2), as shown in Table 4. A high R2 indicates a high level of correlation between the observed value and the predicted value. A correlation coefficient close to 1 indicates that the regression model meets the principle of linearity and the possibility of correct prediction results [27].
The interaction of the variable and the optimal level of each variable are determined by the plotted response surface curve. 3-D response surface plots were obtained by plotting the response (removal percentage) on the Z-axis against any two variables while keeping other variables at their “0” level [28].
Fig. 3a shows the effect of initial concentration, contact time, and their interaction on the removal percentage of adsorption when the mass adsorbent was fixed at 0.025 g. The removal percentage was increased with the higher initial concentration of 5 to 60 mg·L−1 and contact time of 55–155 min. Likewise, Fig. 3b shows the effect of initial concentration and mass adsorbent on the removal percentage of adsorption when the contact time is fixed at 60 min. The removal percentage was increased with a higher concentration of 5–60 mg·L−1 and mass adsorbent of 0.025 to 0.055 g. As shown in Fig. 3c, shows the effect of contact time and mass adsorbent on the removal percentage of adsorption when the initial concentration is fixed at 50 mg·L−1. The removal percentage was increased with a higher contact time of 60–100 min and mass adsorbent of 0.02 to 0.04 g.
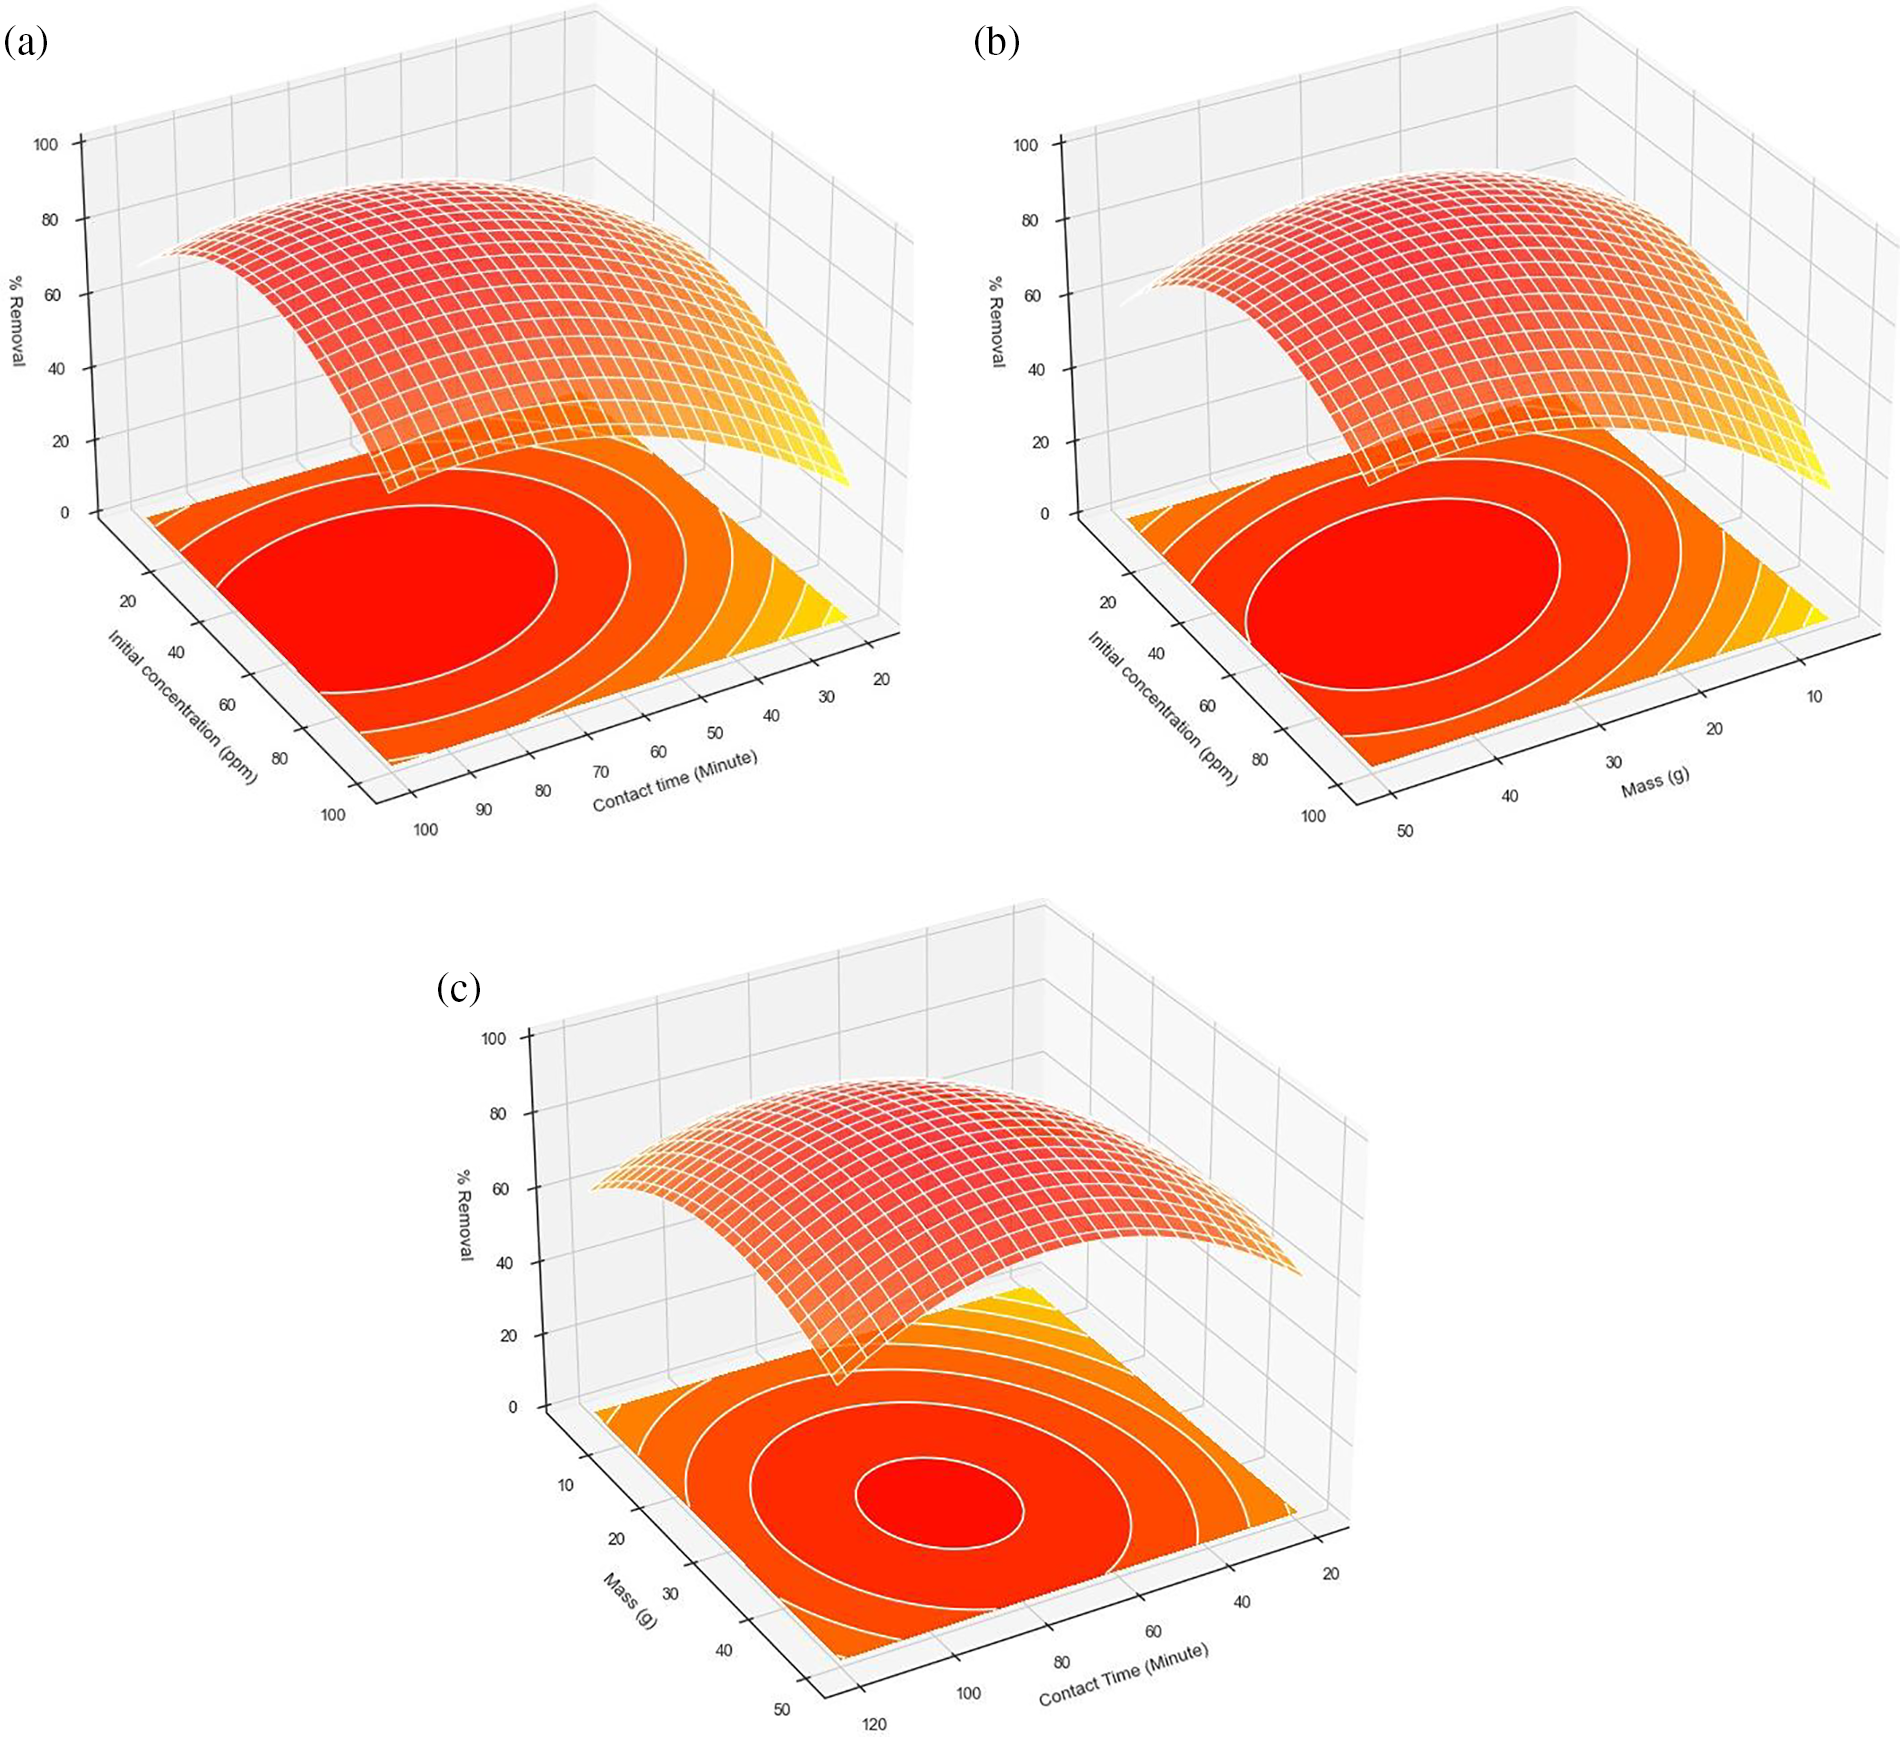
Figure 3: Response Surface (3-D) shows the effect of % removal adsorption malachite greento (a) initial concentration vs. contact time, (b) initial concentration vs. mass adsorbent, and (c) mass adsorbent vs. contact time
The optimal conditions (x1 = 80 min, x2 = 0.032 g, x3 = 25 mg·L−1) for malachite green removal were determined by analyzing the response surface obtained from the regression equation. Under these conditions, the theoretical percent removal is estimated at 93.66%, with a maximum adsorption capacity of 19.345 mg·g−1.
As a comparison, Ghasemi et al. conducted research on the adsorption of malachite green using straw activated carbon and found that optimal results were achieved with a contact time of 120 min, an initial concentration of 20 mg·L−1, and an adsorbent mass of 0.15 g, resulting in a removal percentage and adsorption capacity of 94% and 6.66 mg·g−1, respectively [28].
Ordinary Least Square (OLS) regression analysis between experimental results and predictions is shown in Table 4. The p-value (p < 0.05) is used to evaluate the relationship between the independent and dependent variables which represent the hypothesis value. The p-value of the regression equation obtained is 0.000202, which is smaller than the significance level (0.05). This shows that there is a significant relationship between input and response variables [29].
The mechanism of the adsorption process can be studied by determining the adsorption isotherm model. The isotherm model testing was carried out to determine an equilibrium model that suitable to use in the adsorption process. Determination of adsorption isotherms was carried out by fitting the adsorption data to the Langmuir, Freundlich, Temkin, and Dubinin-Radushkevich isotherm equations. Determining the equilibrium model depends on the value of the determinant coefficient (R2). Adsorption equilibrium is a mathematical description of an isothermal condition that is specific to each adsorbent [26]. The adsorption isotherm model obtained can be seen in Table 5.
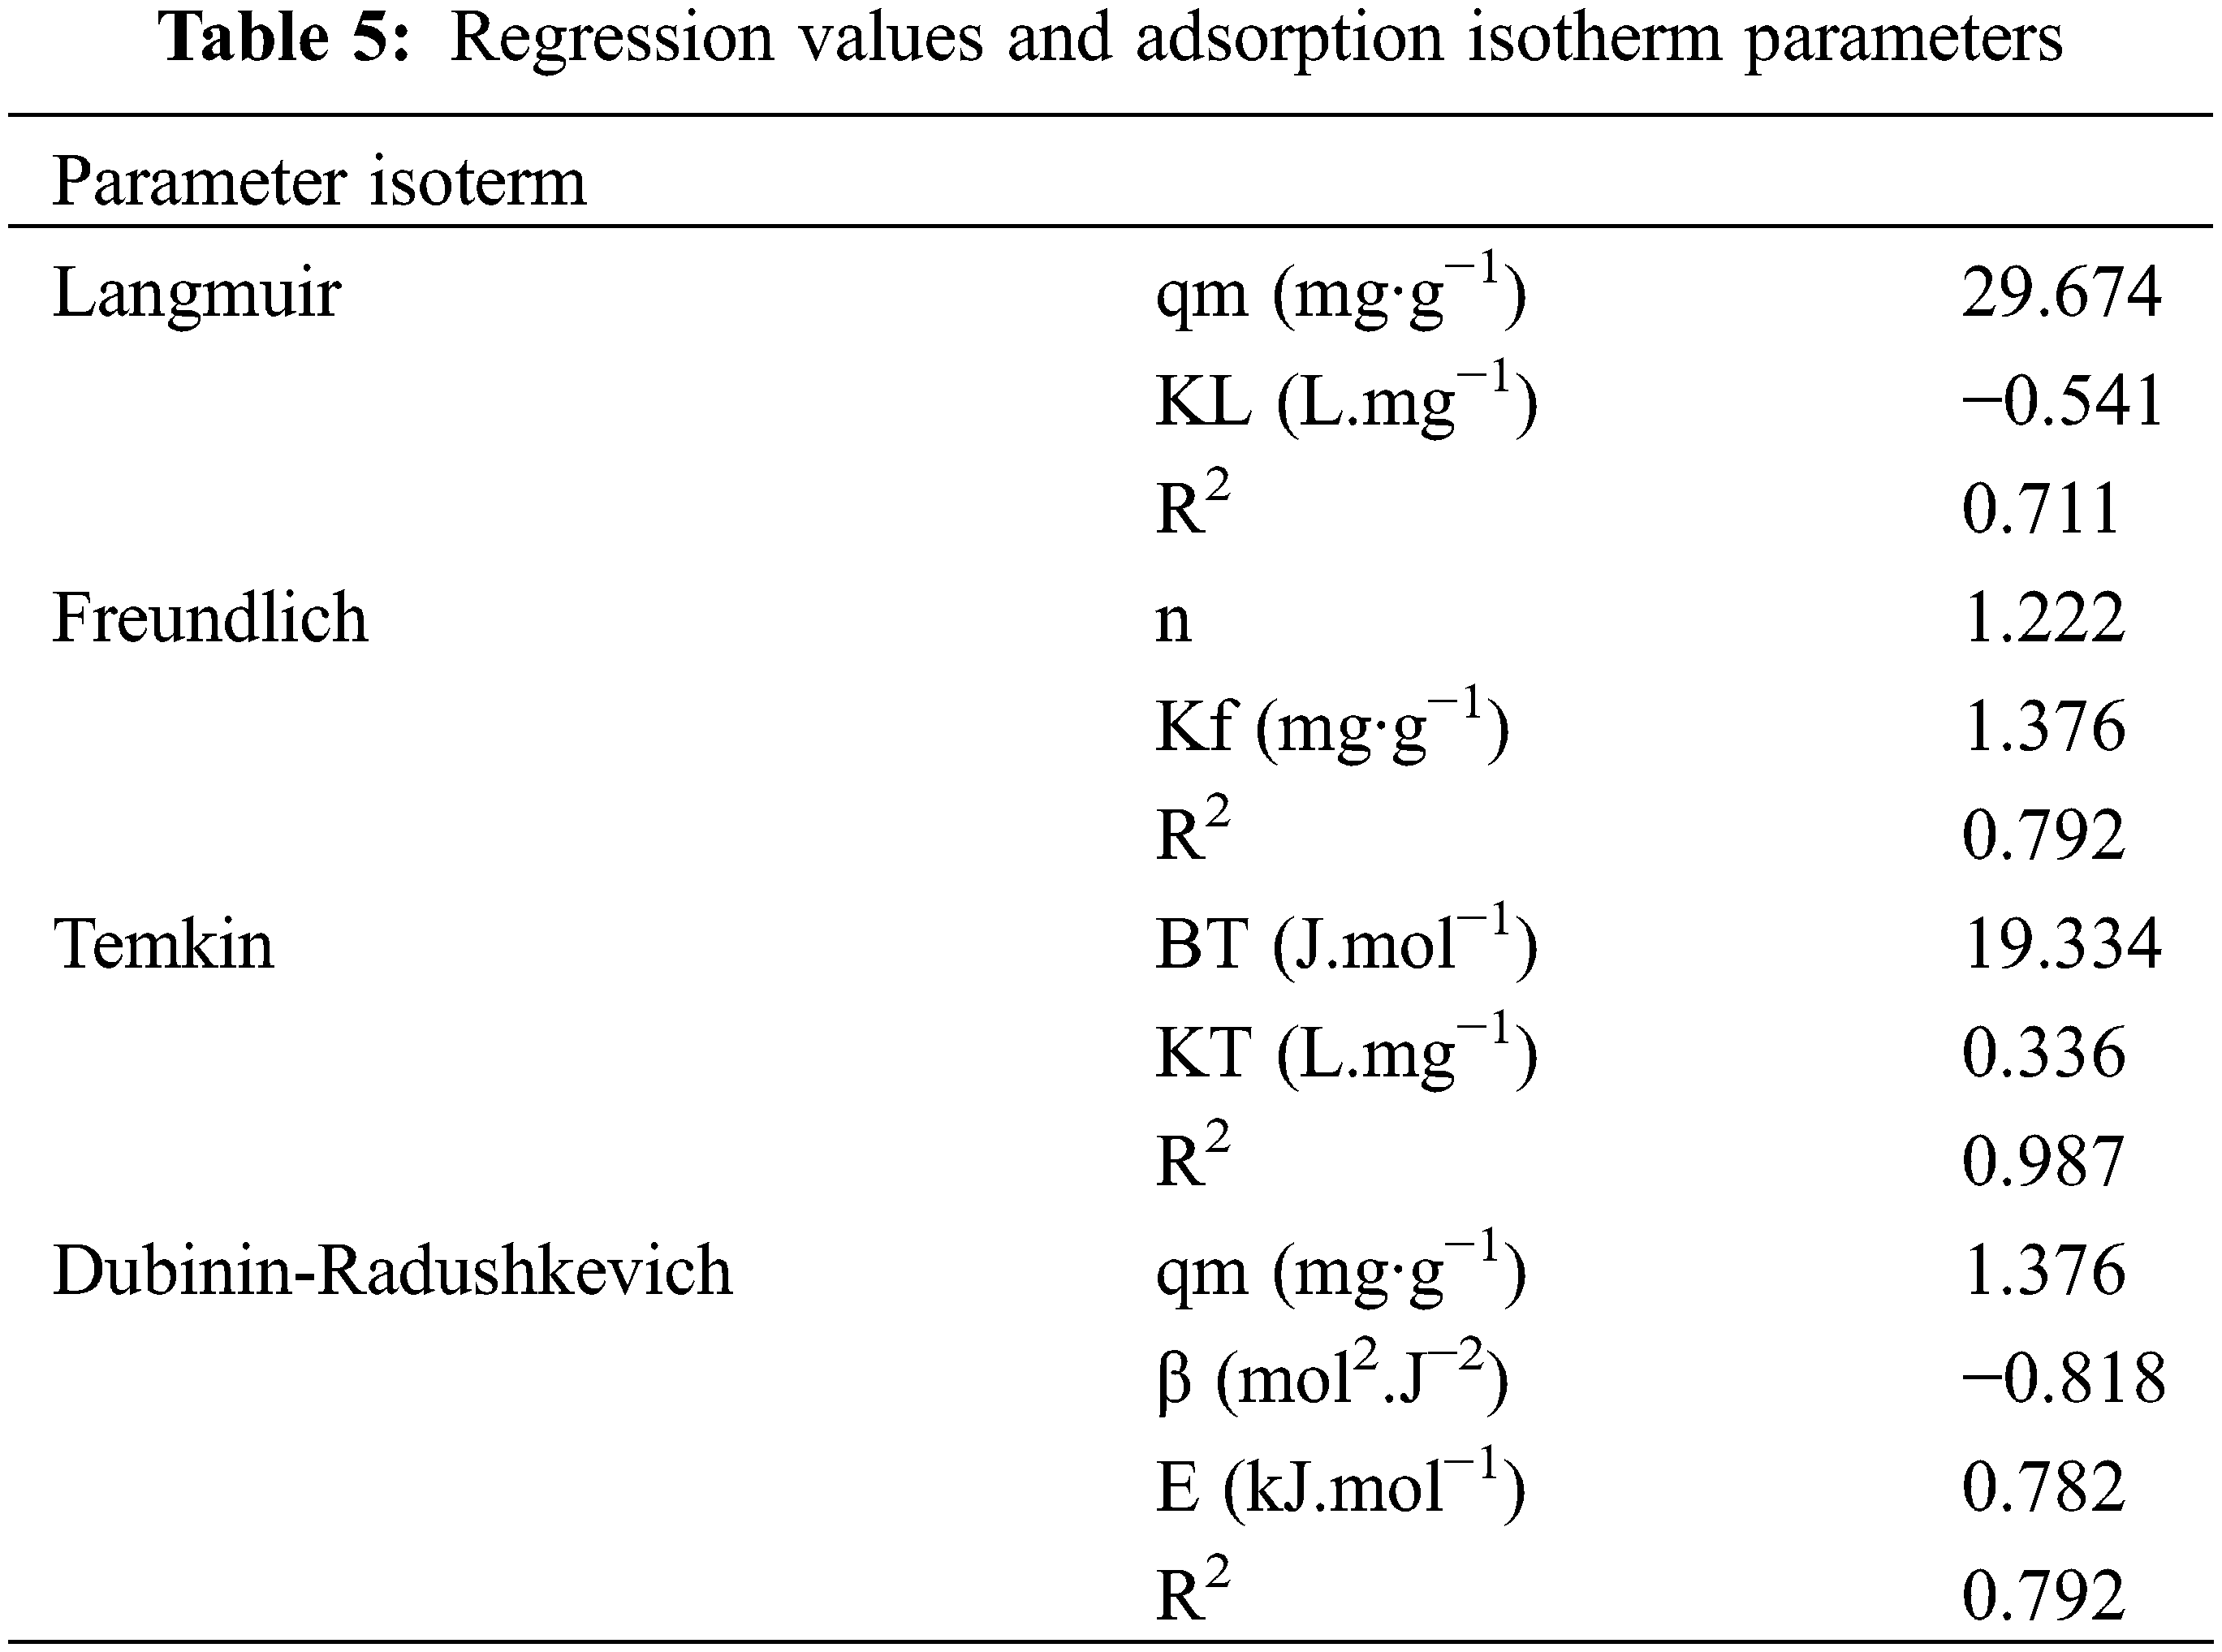
The adsorption process by an adsorbent is influenced by several factors and has certain unique adsorption isotherm patterns caused by the type of adsorbent, type of adsorbate, surface area of the adsorbent, concentration of the adsorbate, and temperature. The isotherm model shown in Fig. 4. Given these factors, adsorbent interaction with various adsorbates will not have the same adsorption pattern [30]. In this study, the Temkin isotherm model has a high determinant coefficient (R2) of 0.987 as shown in Fig. 4c.
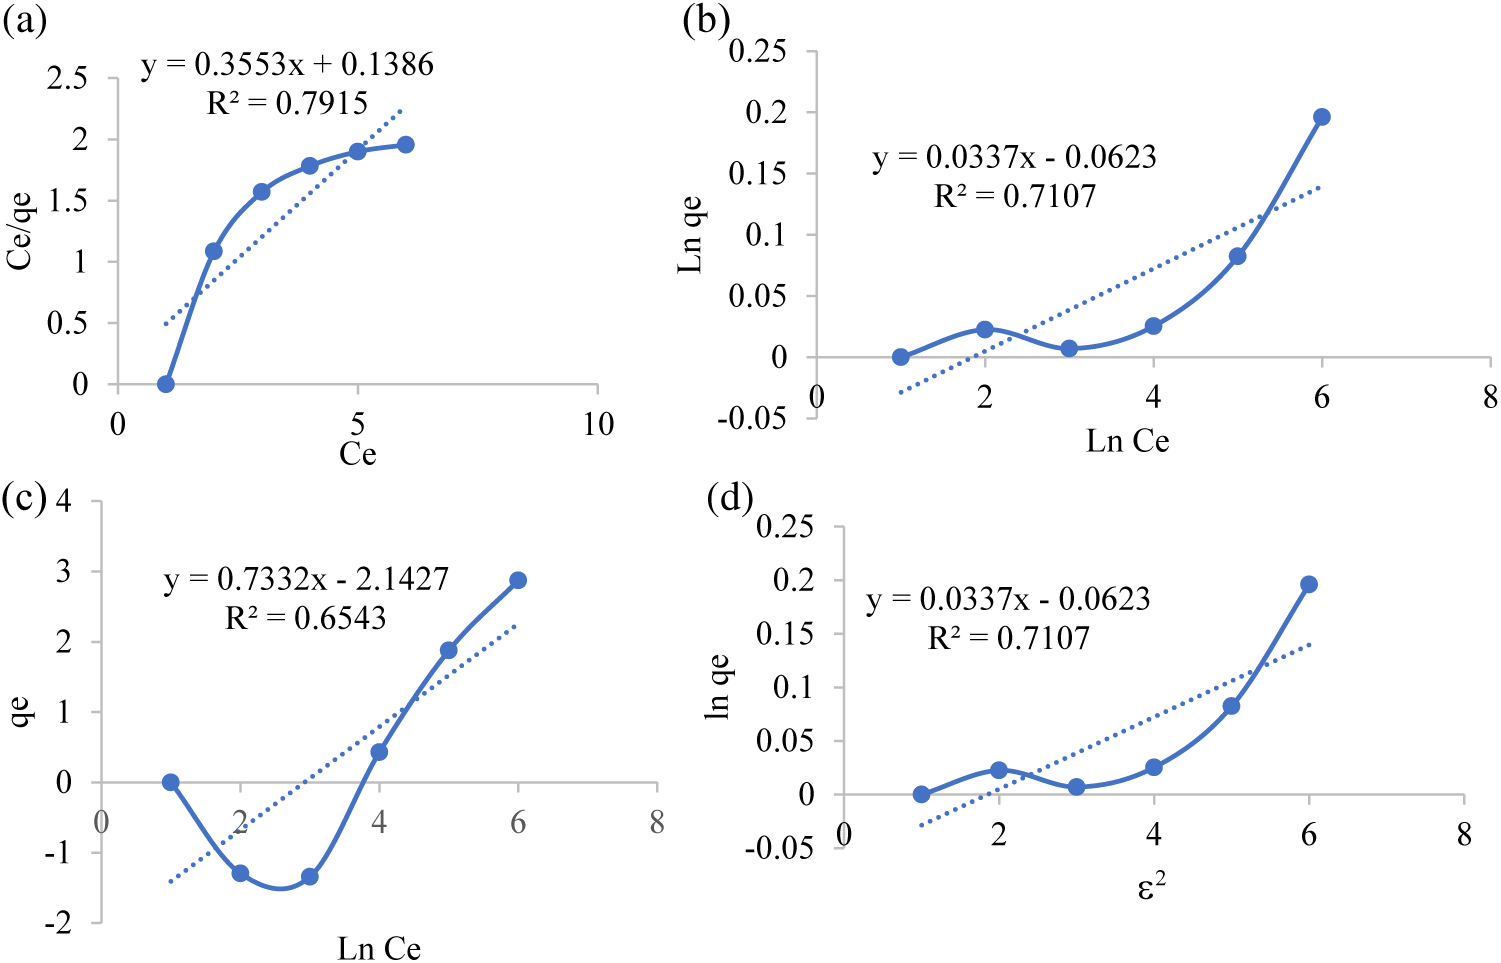
Figure 4: Isotherm curve (a) Langmuir, (b) Freundlich, (c) Temkin and (d) Dubinin-Radushkevich
Evaluation of reaction kinetics is very important to determine the factors that influence the reaction rate. The kinetics model of malachite green adsorption was calculated to estimate the adsorption rate. Fig. 5 presents the pseudo-first-order kinetic model (a) and pseudo-second-order (b). Fig. 5 shows the coefficient of determination (R2) for the pseudo-second-order is larger than the pseudo-first-order (R2 = 0.9865). As a result, the adsorption of malachite green with mangosteen peel can be well represented by the pseudo-second-order kinetics model. This model assumed which chemical controlling the reaction rate in the adsorption process.
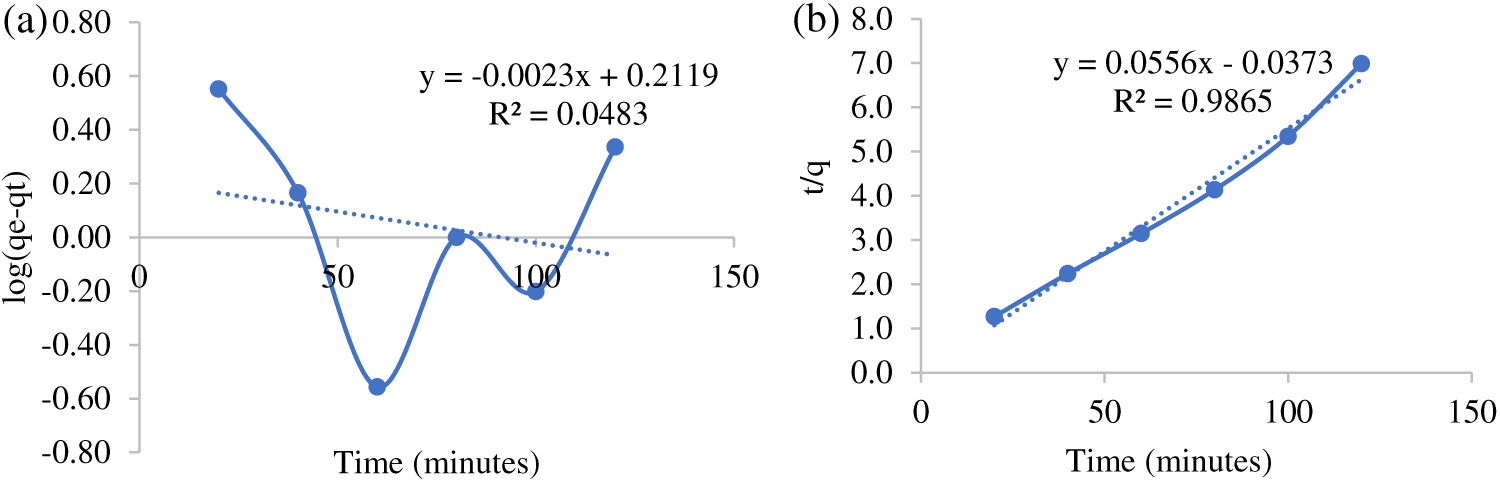
Figure 5: The Kinetic’s models: Pseudo-first-order (a), and Pseudo-second-order (b)
Activated carbon was successfully synthesized from mangosteen peel waste using an H2SO4 activator as an adsorbent for malachite green dye in solution. From this research, it was concluded that the malachite green dye concentration can be reduced through the adsorption method using mangosteen peel-activated carbon adsorbent. Optimization of adsorption parameters has been successfully carried out using the Response Surface Methodology (RSM) based on Box-Behnken Design (BBD). The optimum adsorption conditions obtained were at contact time of 80 min, adsorbent mass of 0.032 g, and initial concentration of malachite green of 25 mg·L−1, with a maximum removal of 93.66% and maximum adsorption capacity of 19.345 mg·g−1.
Acknowledgement: The authors gratefully acknowledge financial support from the Institut Teknologi Sepuluh Nopember for this work, under the Project Scheme of the Publication Writing and IPR Incentive Program (PPHKI) 2024.
Funding Statement: The authors received no specific funding for this study.
Author Contributions: The authors confirm contribution to the paper as follows: study conception and design: Yatim Lailun Ni’mah and Suprapto Suprapto; data collection: Nabila Eka Yuningsih; analysis and interpretation of results: Latifa Ariani and Hendro Juwono; draft manuscript preparation: Ita Ulfin and Harmami Harmami. All authors reviewed the results and approved the final version of the manuscript.
Availability of Data and Materials: The authors confirm that the data supporting the findings of this study are available within the article.
Conflicts of Interest: The authors declare that they have no conflicts of interest to report regarding the present study.
References
1. Ardiyanti A, Suprapto S, Ni’mah YL. Malachite green adsorption using carbon-based and non-conventional adsorbent made from biowaste and biomass: a review. J Renew Mater. 2023;11(11):3789–806. doi:10.32604/jrm.2023.031354. [Google Scholar] [CrossRef]
2. Theivarasu C, Mylsamy S. Removal of malachite green from aqueous solution by activated carbon developed from cocoa (Theobroma Cacao) shell-a kinetic and equilibrium studies. J Chem. 2011;8(S1):S363–71. doi: 10.1155/2011/714808. [Google Scholar] [CrossRef]
3. Nasra E, Kurniawati H, E. D, Etika SB, Rahmatika A. Effect of pH and concentration on biosorption malachite green and rhodamine B dyes using banana peel (Musa balbisiana Colla) as biosorbent. J Phys: Conf Ser. 2021;1788(1):012003. [Google Scholar]
4. Biradar AI, Sarvalkar PD, Teli SB, Pawar CA, Patil PS, Prasad NR. Photocatalytic degradation of dyes using one-step synthesized silica nanoparticles. Mater Today Proc. 2020;43:2832–8. doi:10.1016/j.matpr.2020.11.946. [Google Scholar] [CrossRef]
5. Raza M, Nosheen A, Yasmin H, Naz R, Usman Shah SM, El-Sheikh MA. Application of aquatic plants alone as well as in combination for phytoremediation of household and industrial wastewater. J King Saud Univ Sci. 2023;35(7):102805. doi:10.1016/j.jksus.2023.102805. [Google Scholar] [CrossRef]
6. Hargreaves AJ, Vale P, Whelan J, Alibardi L, Constantino C, Dotro G, et al. Impacts of coagulation-flocculation treatment on the size distribution and bioavailability of trace metals (Cu, Pb, Ni, Zn) in municipal wastewater. Water Res. 2018;128:120–8. doi:10.1016/j.watres.2017.10.050. [Google Scholar] [PubMed] [CrossRef]
7. Minier-Matar J, AlShamari E, Raja M, Khan F, Al-Maas M, Hussain A, et al. Detailed organic characterization of process water to evaluate reverse osmosis membrane fouling in industrial wastewater treatment. Desalination. 2024;572:117128. doi:10.1016/j.desal.2023.117128. [Google Scholar] [CrossRef]
8. Suprapto S, Augista Nur Azizah P, Lailun Ni’mah Y. Silica gel from chemical glass bottle waste as adsorbent for methylene blue: optimization using BBD. J Renew Mater. 2023;11(12):1–17. doi:10.32604/jrm.2023.031210. [Google Scholar] [CrossRef]
9. Rita K. Adsorption of yellow dye: acid yellow RR from its aqueous solution using two different samples of activated carbon by static batch method. Nat Sci. 2012;4(2):112–5. doi:10.4236/ns.2012.42016. [Google Scholar] [CrossRef]
10. Mukti NIF, Prasetyo I, Mindaryani A. Preparasi Karbon Teremban Oksida Cobalt Dari Limbah Kulit Manggis Sebagai Adsorben Penjerap Etilen Untuk Pengawetan Buah. Reaktor. 2015;15(3):165(In Indonesian). doi:10.14710/reaktor.15.3.165-174. [Google Scholar] [CrossRef]
11. Jawad AH, Saber SEM, Abdulhameed AS, Reghioua A, ALOthman ZA, Wilson LD. Mesoporous activated carbon from mangosteen (Garcinia mangostana) peels by H3PO4 assisted microwave: optimization, characterization, and adsorption mechanism for methylene blue dye removal. Diam Relat Mater. 2022;129:109389. doi:10.1016/j.diamond.2022.109389. [Google Scholar] [CrossRef]
12. Silva AIC, Paranha N, Maia G, L. S, Mulinari DR. Development of activated carbon from pineapple crown wastes and its potential use for removal of methylene blue. J Nat Fibers. 2021;19(3):1875365. doi:10.1080/15440478.2021.1875365. [Google Scholar] [CrossRef]
13. Kini MS, Saidutta MB, Murty VR. Studies on biosorption of methylene blue from aqueous solutions by powdered palm tree flower (Borassus flabellifer). Int J Chem Eng. 2014;5:1–13. doi:10.1155/2014/306519. [Google Scholar] [CrossRef]
14. Asadi Z, Norouzbeigi R. Synthesis of colloidal nanosilica from waste glass powder as a low cost precursor. Ceram Int. 2018;44(18):22692–97. doi:10.1016/j.ceramint.2018.09.050. [Google Scholar] [CrossRef]
15. Ding H, Li J, Gao Y, Zhao D, Shi D, Mao G. Preparation of silica nanoparticles from waste silicon sludge. Powder Technol. 2015;284:231–6. doi:10.1016/j.powtec.2015.06.063. [Google Scholar] [CrossRef]
16. Rahbar N, Ramezani Z, Ghanavati J. CuO-nanoparticles modified carbon paste electrode for square wave voltammetric determination of lidocaine: comparing classical and box-behnken optimization methodologies. Chin Chem Lett. 2016;27(6):837–42. doi:10.1016/J.CCLET.2016.04.017. [Google Scholar] [CrossRef]
17. Khair A, Putri HA, Suprapto S, Ni’Mah YL. The optimization of Sumbawa manganese ore beneficiation using response surface method (RSM). AIP Conf Proc. 2021;2349(1):020050. doi:10.1063/5.0051614. [Google Scholar] [CrossRef]
18. Ni’mah YL, Yuningsih NE, Suprapto S. The adsorption of Pb(II) using silica gel synthesized from chemical bottle waste: optimization using box-behnken design. J Renew Mater. 2023;11(6):2913–24. doi:10.32604/jrm.2023.025431. [Google Scholar] [CrossRef]
19. Rahman N, Nasir M, Varshney P, Al-Enizi AM, Ubaidullah M, Shaikh SF, et al. Efficient removal of Pb(II) from water using silica gel functionalized with thiosalicylic acid: response surface methodology for optimization. J King Saud Univ Sci. 2021;33(1):101232. doi:10.1016/j.jksus.2020.101232. [Google Scholar] [CrossRef]
20. Anitha D, Ramadevi A, Seetharaman R. Biosorptive removal of nickel(II) from aqueous solution by mangosteen shell activated carbon. Mater Today Proc. 2021;45:718–22. doi:10.1016/j.matpr.2020.02.748. [Google Scholar] [CrossRef]
21. Flores KP, Omega JLO, Cabatingan LK, Go AW, Agapay RC, Ju YH. Simultaneously carbonized and sulfonated sugarcane bagasse as solid acid catalyst for the esterification of oleic acid with methanol. Renew Energy. 2019;130:510–23. doi:10.1016/j.renene.2018.06.093. [Google Scholar] [CrossRef]
22. Le Van K, Luong Thi TT. Activated carbon derived from rice husk by NaOH activation and its application in supercapacitor. Prog Nat Sci Mater Int. 2014;24(3):191–8. doi:10.1016/j.pnsc.2014.05.012. [Google Scholar] [CrossRef]
23. Faaizatunnisa N, Lestari WW, Saputra OA, Saraswati TE, Larasati L, Wibowo FR. Slow-release of curcumin induced by core-shell mesoporous silica nanoparticles (MSNs) modified MIL-100(Fe) composite. J Inorg Organomet Polym Mater. 2022;32(5):1744–54. doi:10.1007/s10904-022-02230-2. [Google Scholar] [CrossRef]
24. Hua Y, Xu D, Liu Z, Zhou J, Han J, Lin Z, et al. Effective adsorption and removal of malachite green and Pb2+ from aqueous samples and fruit juices by pollen-inspired magnetic hydroxyapatite nanoparticles/hydrogel beads. J Clean Prod. 2023;411:137233. doi:10.1016/j.jclepro.2023.137233. [Google Scholar] [CrossRef]
25. Altun T, Ecevit H. Adsorption of malachite green and methyl violet 2B by halloysite nanotube: batch adsorption experiments and box-behnken experimental design. Mater Chem Phys. 2022;291:126612. doi:10.1016/j.matchemphys.2022.126612. [Google Scholar] [CrossRef]
26. Onder A, Ilgin P, Ozay H, Ozay O. Removal of dye from aqueous medium with pH-sensitive poly[(2-(acryloyloxy)ethyl]trimethylammonium chloride-co-1-vinyl-2-pyrrolidone] cationic hydrogel. J Environ Chem Eng. 2020;8(5):104436. doi:10.1016/j.jece.2020.104436. [Google Scholar] [CrossRef]
27. Ni’mah YL, Suprapto S, Subandi APK, Yuningsih NE, Pertiwi AC. The optimization of silica gel synthesis from chemical bottle waste using response surface methodology. Arab J Chem. 2022;15(12):104329. doi:10.1016/j.arabjc.2022.104329. [Google Scholar] [CrossRef]
28. Mohamad Yusop MF, Abdullah AZ, Ahmad MA. Malachite green dye adsorption by jackfruit based activated carbon: optimization, mass transfer simulation and surface area prediction. Diam Relat Mater. 2023;136:109991. doi:10.1016/j.diamond.2023.109991. [Google Scholar] [CrossRef]
29. Montgomery DC. Design and analysis of experiments, eighth edition; John Wiley & Sons, Inc.; 2013. [Google Scholar]
30. Mehdinia A, Heydari S, Jabbari A. Synthesis and characterization of reduced graphene oxide-Fe3O4@polydopamine and application for adsorption of lead ions: isotherm and kinetic studies. Mater Chem Phys. 2020;239:121964. doi:10.1016/j.matchemphys.2019.121964. [Google Scholar] [CrossRef]
Cite This Article
 Copyright © 2024 The Author(s). Published by Tech Science Press.
This work is licensed under a Creative Commons Attribution 4.0 International License , which permits unrestricted use, distribution, and reproduction in any medium, provided the original work is properly cited.
 Downloads
 Citation Tools