
 Submit a Paper
 Propose a Special lssue
 Open Access
ARTICLE

Dynamic Behaviour of Pond Ash Mixed with Coir and Crumb Rubber
Civil Engineering Department, Punjab Engineering College (Deemed to be University), Chandigarh, 160012, India
* Corresponding Author: Ashish Malik. Email:
(This article belongs to the Special Issue: Renewable Material from Agricultural Waste and By-Product and Its Applications)
Journal of Renewable Materials 2023, 11(3), 1271-1291. https://doi.org/10.32604/jrm.2022.023084
Received 08 April 2022; Accepted 01 June 2022; Issue published 31 October 2022
 View Full Text
 Download PDF
Abstract
An experimental program was conducted to determine the dynamic properties of pond ash (PA) and pond ash mixed with admixtures like crumb rubber (CR) and coir fiber (CF) which are wastes of different industries. Additives CR and CF were mixed separately with pond ash in a percentage ranging from 0%–20% at an interval of 5% and 0%–2% at an interval of 0.5% by weight of pond ash, respectively. Dynamic properties (Shear modulus, Number of cycles to initiate liquefaction, Degradation index and Damping ratio) for pond ash mixes were determined using strain-controlled cyclic tri-axial apparatus. The shear strain was kept constant at 1.2% and the frequency varied from 0.4 to 1 Hz. Liquefaction resistance improves when crumb rubber is added to pond ash, however adding Coir fiber to pond ash has essentially no effect on the number of cycles required to initiate liquefaction. The dynamic shear modulus decreases when crumb rubber was mixed in pond ash whereas when coir fiber is added to pond ash, the dynamic shear modulus increases significantly. A mix of PA, CR, and CF was also tried to balance the number of cycles required to initiate liquefaction and shear modulus. The mixed sample in the proportion of PA (84%) + CR (15) + CF (1%) can be termed a balanced mix as the number of cycles to initiate liquefaction was more than all PA-CF mixes and also the shear modulus was more than all PA-CR mixes. Damping ratio increases with increasing frequency of loading (0.4 to 1 Hz).Keywords
Nomenclature
| PA | Pond Ash |
| CR | Crumb Rubber |
| CF | Coconut Fiber |
| MDD | Maximum Dry Density |
| TPP | Thermal Power Plants |
| MoP | Ministry of Power |
| CEA | Central Electricity Authority |
| SEM | Scanning Electron Microscope |
| BEC | Backscattered Electron Composition |
| EDS | Energy Dispersive X-Ray Spectroscopy |
| ASTM | American Society for Testing and Materials |
| SM | Silty Sand |
| CU | Consolidated Undrained |
| PWP | Pore Water Pressure |
| Δu | Excess Pore Pressure |
| σ3’ | Effective Confining Pressure |
| G | Shear Modulus |
| Τ | Shear Stress |
| γ | Shear Strain |
| E | Young’s Modulus |
| ν | Poisson’s Ratio |
| δ | Degradation Index |
| Dr | Damping Ratio |
The demand for electricity in developing countries is growing at an exponential rate. India has relied heavily on coal-based power production and coal-based energy accounts for 86 percent of total fossil-derived energy in India MoP [1]. In the process of combustion of coal, Indian power plants produce roughly 220 metric tonnes of ash in a year, making it the country’s second-largest waste source after domestic waste CEA [2]. Bottom ash collected from the blast furnace is the coarser element of coal ash, accounting for roughly 10% of the total ash Palmer [3]. For most thermal power plants (TPPs), the bottom ash is disposed of in the nearby areas with relatively lower reduced levels, leading to the creation of ash ponds. Wet disposal is the most widely used method in India for coal ash disposal. The Indian coal is low grade and has high ash content (30%–45%) as compared to imported coals (10%–15%) and therefore the ash produced after combustion is also very high Vasistha [4]. The ash ponds in India like the Ropar thermal power plant is about 750 acres, whereas that of the Ludhiana thermal power plant is 600 acres. Though the use of coal ash has grown in popularity in recent years and the highest level of ash utilisation of about 79.18 percent was achieved in the first half of the year 2020–21 CEA [5], the 100% utilization still looks fairly a distant sight. Nowadays, all new plants developed in India after January, 2017, have to be constructed with a zero-waste philosophy; there is still a legacy of old thermal power plants that need to be addressed. Also, the continuous accumulation of ash in ash ponds has already set the alarm for its pernicious effects on the environment. Earlier, thermal power plants used to require around 0.5–1 acre of land per megawatt capacity of plant for ash disposal, which has resulted in the occupation of 65000 acres of valuable land in India [6,7] for ash ponds. As the land requirement is growing, therefore the new thermal power plants have been permitted temporary ash pond with an area of 0.25 acres per MW MoEF [8]. The properties of coal ash (fly ash and pond ash) had been extensively studied by various researchers [9–12]. As a result, the use of coal ash has gained momentum in various civil engineering applications e.g., construction of a reinforced approach embankment, cement industry, paver blocks, filling low-lying area and road construction. A few examples where coal ash has been successfully used are the construction of power plant roads at Dadri thermal power plants; rural roads in Raichur (Karnataka) and Dadri (Uttar Pradesh); high road embankment for Nizamuddin Bridge (1.9 km long 6–9 m high) and Okhla flyover; Hanuman Setu flyover, and Noida-Greater Noida Expressway project in and around the national capital Delhi used the ‘Reinforced Embankment Technique’. The ash ponds of the Kanti thermal power plant, Muzaffarpur (Bihar), and Bhatinda plants each contained about 600 acres of ash ponds that are now closed and abandoned and the list is fairly long. Such ash ponds create a land use and environmental dilemma that must be addressed, and the properties of ash pond must be determined in order to reclaim the land resource. If the pond ash is suitable in static and dynamic properties, affordable housing for the poor could be constructed as part of the reclamation of abandoned ash ponds, which is also a scheme of the Government of India.
The static behaviour of pond ash has been studied by various researchers [13,14] and a few pilot projects that included the construction of single and double-storey buildings on hydraulically deposited pond ash bed have also been carried out. Dayal et al. [15] found that single and double-storeyed buildings founded on pond ash were safe under static loading conditions. It has been found that coal ash used in the studies behaves as silty sands. Several researches have been undertaken to improve the static behaviour of pond ash using various admixtures [16–18]. From the studies, it was found that admixtures like crumb rubber, coconut fiber and polypropylene fibers can enhance the static strength of different soils. The disposal of waste tyres by burning or burying them underground has seriously degraded our environment in recent decades. One of the most effective ways to address this problem is to convert scrap tyres into recycled aggregate [19]. Crumb rubber has received a lot of attention as a typical solid waste reclamation and recycling solution and it also gives concrete an outstanding impact resistance [20]. For the sustainable development of concrete, Liu et al. [19] used crumb rubber as a partial replacement for natural aggregates. However, scanty literature is available on improving the dynamic properties of pond ash. The dynamic properties of pond ash are required to be ascertained. Some investigations have indicated that pond ash is prone to liquefaction [21–23] and this is why the dynamic properties of pond ash required improvement. Susilo [24] tested the behavior and performance of the fly ash combined with three waste materials, namely crumb rubber, shredded carpet, and shredded paper. In comparison to shredded carpet and shredded paper, crumb rubber performed better as an additive for improving the characteristics of Class F fly ash in a stress-controlled test. Pond ash may be strengthened against liquefaction by adding some additives, and if the admixture is again a waste product from society, then a planetary goal of sustainability can be fulfilled. Crumb rubber used by Susilo [24] was bigger (5–6.35 mm in width, 2.5–3.2 mm in thickness), and a stress controlled test was performed whereas in the current study crumb rubber was chosen to be in line with grain size of pond ash, so that it could mix uniformly and strain-controlled test have been undertaken, which is expected to improve the dynamic properties of pond ash admixture.
To safeguard natural resources for future generations, the use of locally accessible materials and waste materials should be promoted. Natural fibers are widely accessible in many tropical places and may be found all around the world. Coir degrades significantly more slowly than other natural fibers because of its high lignin concentration. As a result, the fiber has a prolonged service life in the field [25]. The strength deformation behaviour of fiber-reinforced soil has been studied, and it has been proven beyond a shadow of a doubt that adding fiber to soil increases its overall engineering performance. Various researchers [26–28] have studied the coal ash, soil and coir fiber interaction. Coir fiber is a good additive when it comes to static strength. As a result, coir fiber was chosen as the second additive to pond ash to improve its static and dynamic properties.
Before pond ash can be employed in geotechnical engineering applications, its engineering properties must be fully understood. This study aims to see how pond ash and pond ash mixed admixtures (crumb rubber and coir) behave under dynamic loads. This study employs waste materials from the coal, tyre, and coconut industries to help the usage of pond ash, ease its disposal problem, and reclaim an underutilised land resource.
In this experimental study, three basic materials have been used in which pond ash is the main material and crumb rubber and coir fiber are the admixtures. All the materials have been collected sufficiently in advance to avoid any variation in properties during experimentation.
Pond ash was collected from the Ash pond of Guru Gobind Singh Super Thermal Power Plant located in Rupnagar, Punjab, India. The power station is a coal-fired power plant with a capacity of 1240 MW. Pond ash was collected as a representative sample from roughly 300 metres away from the partition dyke. Representative pond ash sample used in the study has been shown in Fig. 1.

Figure 1: Representative pond ash sample used in the study
By 2030, the global car fleet is expected to grow to 1.7 billion cars, up from over 1 billion currently, resulting in billions of waste tyres [29]. In a country like India, the rate of vehicular growth is quite significant, which further increases the number of tyres to dispose of and also poses environmental difficulties [30,31]. The disposal problem of tyres can be minimized if tyres are recycled as a substitute for disposal. Rubber is light in weight and is quite efficient when it comes to soaking energy [32]. Therefore, rubber has been chosen as the material and has been collected from a tyre processing unit in the Industrial area in Ludhiana of Punjab, India. Crumb rubber was chopped and ground to a mean diameter of 0.25 mm. The representative crumb rubber has been shown in Fig. 2 which was later on mixed with pond ash homogenously.

Figure 2: Representative crumb rubber sample used in the study
Coir, often known as coconut fiber, is a type of hard mechanical fiber. The coir fiber is resilient enough to twist without fracturing, and it maintains its curl as if it were continually waved. Coir has one of the highest lignin contents, making it more durable. Shivkumar Babu et al. [26] have proven that coir is beneficial in a variety of applications for erosion control, enhancing the performance of embankments, and so on, due to its high lignin concentration. The engineering behaviour of soil-coir mixes has been significantly influenced by the addition of fibers [25]. As a result, soil-fiber reinforcement has become increasingly popular. Coir degrades significantly more slowly than other natural fibers because of its high lignin concentration [28]. As a result, the fiber has a prolonged service life in the field. Also, coir is treated as a waste from Coconut industries and temples. Coir fiber has been collected from a mattress industry in the district Panchkula of Haryana, India. The mean diameter of coir fiber (0.25 mm) was found using Micrometre Calliper. The aspect ratio was kept at 100 for the current study and a representative sample has been shown in Fig. 3.

Figure 3: Coir fiber used in the study
Scanning electron microscope (SEM) analysis is a strong investigative tool that produces complex, high magnification images of a sample’s surface topography using a focussed beam of electrons. A scanning electron microscope was used to examine the topography of the pond ash, crumb rubber and coconut fiber used in this study. The SEM image of pond ash is shown in Fig. 4a at ×100 magnification with a scale of 100 μm and is a Backscattered electron composition (BEC) image. Pond ash particles are spherical in shape and the diameter ranges from 2 to 70 μm. The black portion visible in Fig. 4a is carbon tape. Also, the particles which are not spherical are having some attached moisture.

Figure 4: (a) Scanning electron microscope image of pond ash (b) Scanning electron microscope image of crumb rubber (c) Scanning electron microscope image of coconut fiber
The Backscattered electron composition (BEC) image of crumb rubber is presented in Fig. 4b at ×100 magnification with a scale of 100 μm. Crumb rubber particles are irregular in shape and range in size from 10 to 150 μm. The surface of crumb rubber is also rough and highly porous.
The Backscattered electron composition (BEC) image of coir fiber is presented in Fig. 4c at ×27 magnification with a scale of 500 μm. Coir fibers do not have a consistent diameter throughout their length, and the average size ranges from 200 to 300 μm.
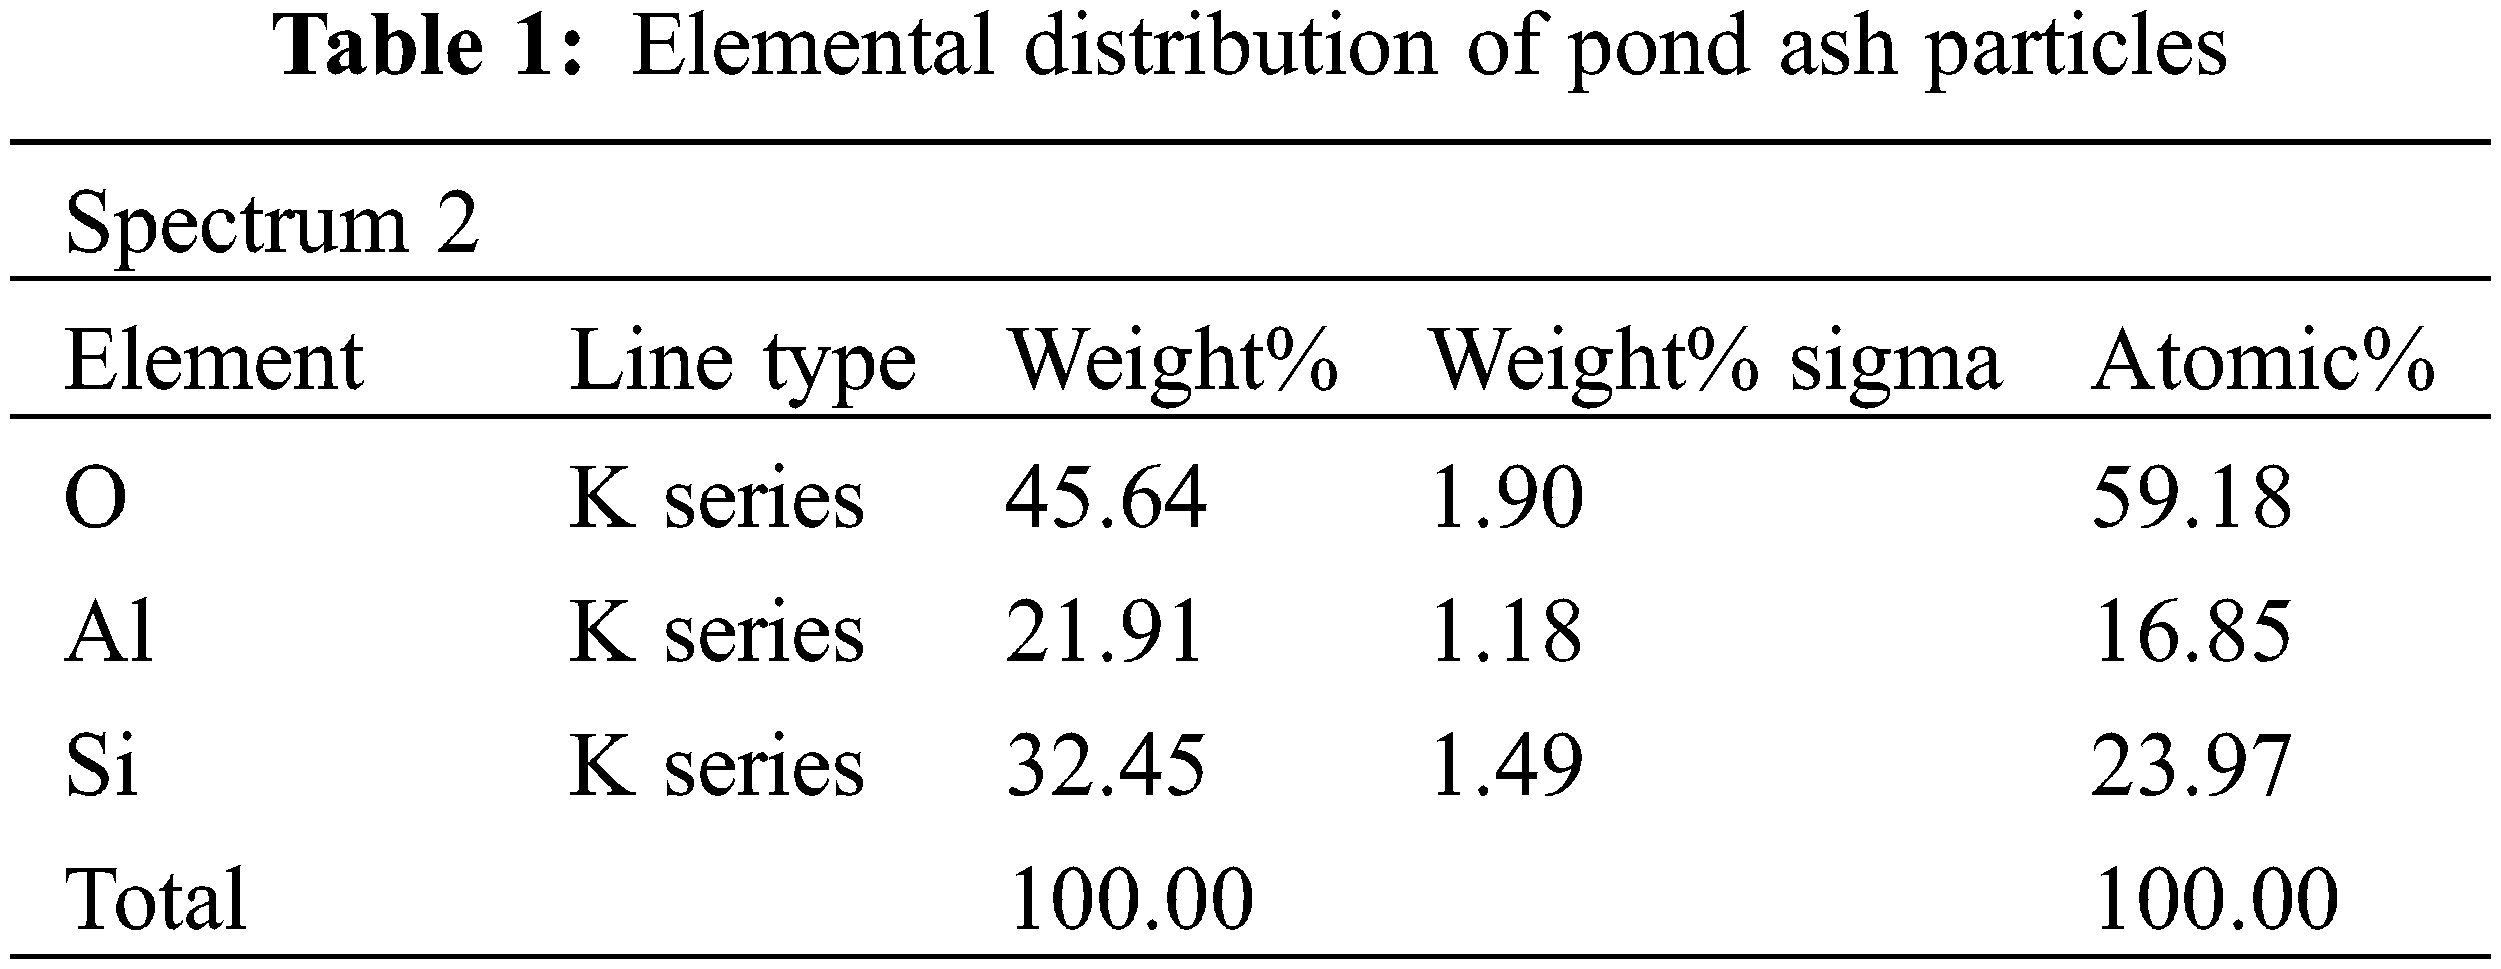
Energy-dispersive X-ray Spectroscopy (EDS) was used to determine the elemental composition of the primary material, i.e., pond ash. The elemental distribution of pond ash particles is shown in Table 1. The three main components of pond ash are oxygen, silicon, and aluminium. It has also been established from past studies by Das et al. [13] that pond ash contains oxides of silica and alumina. Pond ash has good potential binding ability due to its high SiO2 and Al2O3 content [21].
Three materials have been used in the experimental plan, i.e., pond ash, crumb rubber and coconut fiber. These waste materials have been used in order to find out the most appropriate mix. Geotechnical characterization of PA-CR and PA-CF mixes used in the study have also been discussed. The dry weight of the specimens used in this study was taken to determine their composition. The composition and nomenclature of the sample mix are given in Table 2. There is no control over the strain in a stress controlled test on a specimen because there is a constant value of cyclic stress throughout each cycle of load to which the specimen is subjected. As a result, the strain is lower in initial cycles and increases as the sample’s effective stress decreases. Susilo [24] had used crumb rubber percentage of 5, 10 and 20 with coal ash and performed stress controlled test. The size of the crumb rubber sample used in the previous study was, i.e., 5–6.35 mm in width, 2.5–3.2 mm in thickness and 85–90 mm3 effective volume. The current study has been planned to analyze the effect of finer crumb rubber particles mixed with pond ash on dynamic properties and the variation of the percentage of crumb rubber (0%, 5%, 10%, 15% and 20%) at a frequency of cyclic loading (0.4 and 1 Hz). A series of strain-controlled Cyclic Tri-axial tests were planned to be conducted for pond ash-crumb rubber (PA-CR) and pond ash-coir fiber (PA-CF) mix compositions to understand their dynamic properties. Coir fiber has shown its significance when used to enhance static strength and after a review of literature [26,33], coir fiber imparts good static strength when added to a proportion of 0.5% to 1%. Therefore, it was planned to use coir fiber as an additive to pond ash with percentage varying from 0% to 2% at an incremental interval of 0.5% by weight of pond ash. The aspect ratio of coir fiber was kept around 100. Strain controlled tests were conducted at a cyclic shear strain of 1.2% at two different frequencies of 0.4 and 1 Hz. Dynamic properties like shear modulus, degradation index and damping ratio in addition to liquefaction potential can be found using strain controlled experimentation.

4 Geotechnical Characterization of Pond Ash Mixes
Geotechnical characterization of materials has been carried out by conducting various tests like specific gravity, grain size distribution, and compaction characteristics as per the American Society for Testing and Materials (ASTM).
The grain size properties of the mix and specific gravity of materials found using a pycnometer are shown in Table 3. The specific gravity of pond ash used in the current study was 1.98, crumb rubber was 1.14 and coconut fiber was 0.91 found using ASTM D854 [34]. Coir fiber and crumb rubber are lighter than pond ash as evident from the comparison of their respective specific gravity. Grain size analysis was performed for PA and CR considered in the current study as per ASTM D422 [35]. The hydrometer method was used to determine the gradation curve for particles finer than 75 microns. The mix compositions are therefore described as non-plastic silt sized fractions. As per the unified soil classification system, ASTM D2487–11 [36] pond ash used in the current study has been classified as poorly graded silty sand (SM). The Grain size analysis of PA & CF mixes has not been performed due to the fact that coir lies longitudinally on sieve; hence, it could not be sieved. The diameter of the coir was measured with the help of Vernier and it was 0.25 mm. Coir was cut in pieces such that its aspect ratio was maintained at approximately 100.

4.2 Compaction Characteristics
The maximum dry density (MDD) for PA-CR and PA-CF mixes has been found using Standard Proctor Test as per ASTM D698 [37]. MDD is a measure of maximum dry density corresponding to optimum moisture content that can be achieved for a particular soil. Greater MDD is preferred from the construction point of view. For PA-CR mix compositions, initially, a slight increase has been witnessed in MDD with increasing percentage of CR till 10% and further increase in percentage of CR decreases the MDD of mix composition which is evident from Fig. 5a. This decrease can be attributed to the poorer interlocking and lower specific gravity of CR and decrease in porosity of mix. The decrease is about 10% in the case of PA20CR when compared to the PA sample. In the case of PA-CF mix composition there is a better bonding between PA-CF particles when the CF percentage is increased from 0 to 1, thereby increasing the MDD of the mix composition. The possible explanation for increasing the MDD after mixing CF up to 1% by weight of pond ash may be attributed to better bonding/interlocking of pond ash with coir fiber. At higher percentages, MDD went down possibly due to the effect of lower specific gravity of CF. At percentage of CF higher than 1%, the effect of lower specific gravity of admixture, i.e., coir fiber overrides the effect of better bonding. This decrease is associated to a lower compaction achieved because of a higher percentage of coir in the mix. At initial increments of coir fiber, the voids in the pond ash get filled, but further increase in coir fiber decreases the MDD. Too much coir fiber or crumb rubber interferes with the compaction of the mix. It has been found that the addition of crumb rubber and coir reduces the optimum moisture content.

Figure 5: (a) Compaction characteristics for PA-CR mixes (b) Compaction characteristics test for PA-CF mixes
In the current study cyclic tri-axial test was performed on a cyclic triaxial testing machine with CU test conditions as per ASTM 3999 [38]. The machine has seven components namely a pneumatic pressure cylinder attached with an air filter device, a pressure panel with various pressure regulating knobs, a cyclic loading machine, a double walled tri-axial cylinder, a vacuum pump, a de-airing chamber and a computer as shown in Fig. 6.

Figure 6: Cyclic triaxial testing apparatus used in the present study
Samples were made in a cylindrical mould with a length of 140 mm, which is double the diameter of the sample (70 mm). The higher the sample size, the more accurate the results. Generally, 90–95 percent of MDD is usually the density that can be achieved on site. Hence, the samples for the current investigation were prepared at 95 percent MDD at the dry side of optimum. The sample is then affixed to the cyclic tri-axial cell with filter paper porous stones on top and bottom, O-rings, and a platen at the top once it has been prepared. The membrane is inspected for leaks before the tri-axial cell is placed over the pond ash sample and sealed with silicon sealant. A vacuum pump is used to remove air from the cell, and the piston of the tri-axial cell is placed on the platen so that the base of the piston touches the top of the platen. Through the pneumatic control panel, water from the de-airing chamber is subsequently forced into the triaxial cell under gravity. After the water is filled, the sample is subjected to an initial confining pressure and back pressure of 1 and 0.8 kPa, respectively, for saturation purposes. Pore pressure reaches the back pressure with time and the saturation of the sample starts. Saturation at any point of time is determined by Pore pressure parameter ‘B’ (ratio of change in pore pressure after the back pressure valve is closed to the change in confining pressure). For B-values of 0.95 or higher, full saturation was presumed to have been attained. The time required for full saturation takes about 4 to 8 days for the pond ash sample used in the study. After complete saturation is achieved, the next phase of isotropic consolidation begins. The back pressure was kept constant during consolidation, while the confining pressure was increased until the effective confining pressure reached the consolidation pressure at which the sample was evaluated. The sample was consolidated until there was no more water coming out of it. After consolidation the cyclic tri-axial cell is attached to the loading assembly and the load valve is opened. The back pressure valve is closed when performing the cyclic test so that undrained conditions can be developed in the sample. The cyclic tri-axial cell was then connected to the loading frame and the lock on it was released such that the assembly acted as a single unit. Load and displacement were then tared before starting the test. The sample was said to liquefy when the pore water pressure reaches confining pressure.
The strain value of 1.2% was taken for the analysis because the study aims to find the effect of variables at higher strain and a comparative study of different admixtures was made. To enable enough time for pore water pressure equalisation, a frequency of 1 Hz for coarser material and a lower frequency of 0.4 Hz was used for finer material [21] and results of the two frequencies have been compared. A series of strain-controlled Cyclic Tri-axial tests were conducted for pond ash-crumb rubber and pond ash-coconut fiber compositions with a proportion of crumb rubber ranging from 0% to 20% and a proportion of coconut fiber ranging from 0% to 2% by weight, at 1.2% shear strain and at two frequencies of magnitude 0.4 and 1 Hz, respectively.
The dynamic properties of pond ash mixed with coir and crumb rubber samples at a strain of 1.2% strain and at two frequencies were examined in the study. The number of cycles to initiate liquefaction, shear modulus, degradation index and damping ratio are important in understanding the dynamic behaviour of ash ponds. The variables used in the present study are frequency of cyclic loading (0.4 and 1 Hz), variation of percentage of coir (0%, 0.5%, 1%, 1.5% and 2%) and variation of percentage of crumb rubber (0%, 5%, 10%, 15% and 20%).
The variation of deviatoric stress in (kg/cm2) and axial strain (%) was recorded as an output file from the device during cyclic-triaxial testing and a representative sample of pond ash sample at 0.4 Hz frequency is shown in Fig. 7. A total of 128 data points were collected for each cycle, correlating to strain amplitudes varying from compression to elongation.

Figure 7: Hysteresis loop for axial stress-strain of pond ash sample at 0.4 Hz
6.1 Number of Cycles to Initiate Liquefaction
The liquefaction behavior of pond ash when mixed with coir fiber and crumb rubber at different frequencies have been presented in this study. The liquefaction potential is measured by the amount of excess pore water pressure corresponding to the resultant cyclic shear strain in a strain-controlled approach. Excess pore water pressure (PWP) can be measured using laboratory or field experiments. The excess pore water pressure ratio is the ratio of pore water pressure change to effective confining pressure after the cyclic loading begins. Theoretically, when this ratio reaches one, the specimen is said to have liquefied. A sample failed in liquefaction has been depicted in Fig. 8. Liquefaction is expected when the excess pore water pressure ratio is 0.9 or higher [39]. Before beginning the strain controlled test, it was ensured that the effective confining pressure (σ̍3) was kept at 100 kPa. Subsequently, anytime the excess pore pressure (Δu) surpasses 100 kPa, the sample under evaluation is considered to have failed in liquefaction because at this point, the excess PWP ratio would reach unity. The greater number of cycles taken to reach the excess pore water pressure ratio one signifies that the sample will liquefy late.
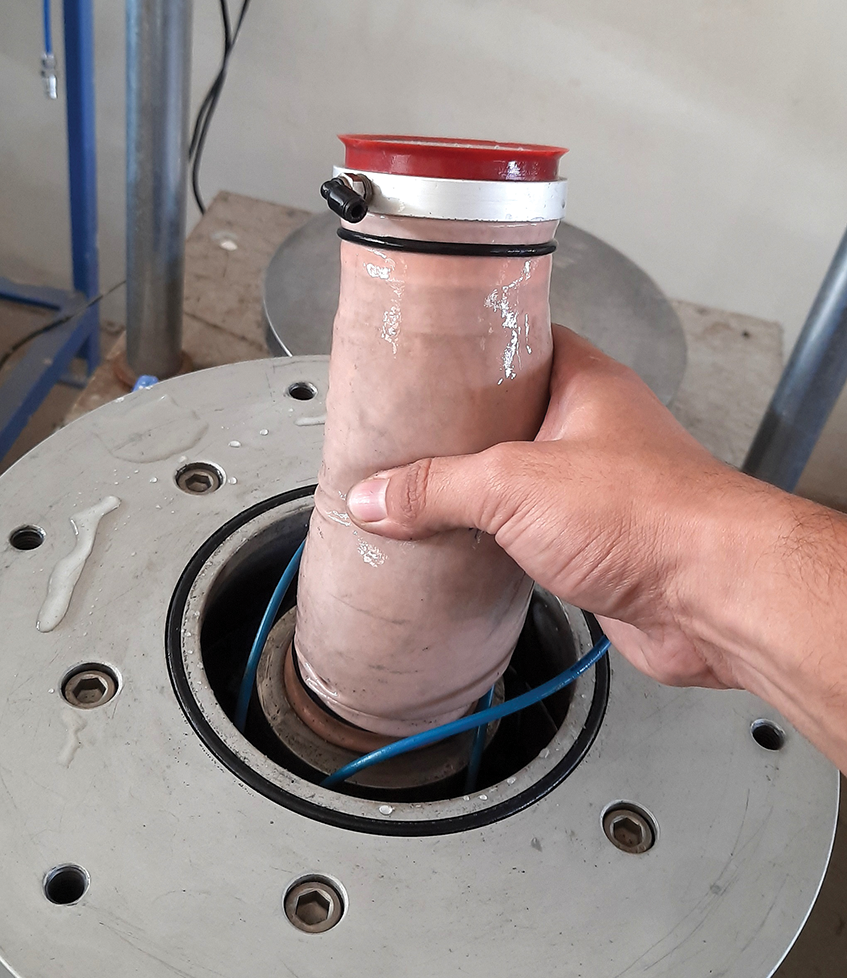
Figure 8: A representative pond ash sample failure in liquefaction
Excess pore water pressure ratio and the number of cycles have been plotted for frequencies of 0.4 and 1 Hz in Fig. 9. When the frequency of the mix compositions was increased from 0.4 to 1 Hz, it was observed that the number of cycles required to initiate liquefaction decreased. Excess pore pressure is generated rapidly at high frequencies, enhancing the specimen’s liquefaction potential. For both frequencies investigated, 85 percent pond ash with 15 percent crumb rubber took the highest number of cycles to initiate liquefaction out of all the composition of mixes. It implies that the addition of 15% crumb rubber to pond ash can sustain dynamic loads for a longer duration as the number of cycles to reach excess pore water pressure ratio equal to one (42 at 0.4 Hz) and (26 at 1 Hz) are considerably more when compared to pond ash sample (12 at 0.4 Hz) and (8 at 1 Hz). The increased number of cycles could be due to crumb rubber’s superior cushioning capabilities. However, the addition of coir fiber had not any significant effect on the liquefaction potential of pond ash. It may be due to coir fiber being a brittle material. The number of cycles needed to initiate liquefaction for the PA sample is more or less equal to the PA1CF mix. Among PA-CR and PA-CF mix compositions, PA15CR and PA1CF showed better results in liquefaction potential and therefore optimal of both PA-CR and PA-CF mixes were taken together. A new sample comprised of 84 percent PA, 15 percent CR and 1 percent CF with nomenclature PA15CR1CF was prepared and tested for dynamic properties. It took 22 cycles at 0.4 Hz and 17 cycles at 1 Hz to initiate liquefaction for the PA15CR1CF mix. The new sample had 15 percent crumb rubber added to the PA1CF sample and when compared to the PA1CF sample, the number of cycles needed to cause liquefaction increased to 20 and 17 (for PA15CR1CF) from 13 and 9 (for PA1CF) at 0.4 Hz and 1 Hz respectively. This increase could be attributed to the cushioning effect of crumb rubber in the PA-CF mix.

Figure 9: Excess pore pressure ratio v/s no. of cycles to liquefaction (N) for PA-CR represented in (a) & (c), PA-CF and PA-CR-CF mix represented in (b) & (d)
For each set of data points from the axial stress-strain plot, the ratio of deviatoric stress to axial strain was used to calculate Young’s modulus (E). Then, a relationship given as Eq. (1) was used to calculate the shear stress and shear strain.
G stands for shear modulus, which is defined as the ratio of shear stress represented by (τ) to shear strain represented by (γ). E stands for Young’s modulus, while ν stands for Poisson’s ratio. For the saturated undrained test sample, the Poisson’s ratio can be taken as 0.5 [40]. The following Eq. (2) given by Towhata [41] was used to calculate the shear strain (γ) that corresponds to the applied axial strain (ε).
The shear stress and shear strain corresponding to deviatoric stress and axial strain were calculated, and a hysterics loop was plotted to demonstrate the variability in shear stress and shear strain. A single hysteresis loop generated from a particular loading cycle is examined for the dynamic characteristics of pond ash and admixture material, out of all the loading cycles. For evaluating the dynamic pond ash characteristics, several researchers suggest using varied number of loading cycles [40,42–45]. In the current study, secant shear modulus corresponding to 1.2% shear strain for all the cycles up to initiation of liquefaction have been considered and plotted in Fig. 10.

Figure 10: Shear modulus and no. of cycles up to liquefaction (N) for PA-CR and PA-CR-CF mix represented in (a) & (c) and for PA-CF mix represented in (b) & (d)
The value of secant shear modulus is higher when coir fiber is added to pond ash than when crumb rubber is added to pond ash when comparing PA-CF and PA-CR mixes. Likely, the better interlocking between the coir and the pond ash sample accounts for the increased secant shear modulus in PA-CF mixes. At 0.4 Hz frequency, for initial cycles shear modulus value ranges from 3000–1200 kPa for PA-CR mix (maximum for PA, i.e., 3024 kPa) and 5400–3000 kPa for PA-CF mix (maximum for PA1CF i.e., 5416 kPa). At 1 Hz frequency, for initial cycles shear modulus value ranges from 2000–900 kPa for PA-CR mix (maximum for PA, i.e., 2000 kPa) and 4300–2000 kPa for PA-CF mix (maximum for PA1CF, i.e., 4333 kPa). The value of shear moduli for PA1CF was highest among PA-CR and PA-CF mixes at 5416 and 4333 kPa for 0.4 and 1 Hz, respectively. When crumb rubber is mixed with pond ash, the secant shear modulus decreases when compared to the PA sample. It has also been found that tyre crumbs decrease shear modulus when added to sand [46]. This may be due to a lack of adhesion between crumb rubber and pond ash, resulting in a lower secant shear modulus than that of PA. As a result, it was decided to use the material with good liquefaction resistance and better shear modulus together and PA15CR1CF was prepared and tested for its dynamic properties. After testing PA15CR1CF at 0.4 and 1 Hz, it was found that the shear modulus was greater than PA-CR mixes but lesser than PA-CF mixes. PA15CR1CF sample can be termed as optimal as the number of cycles to initiate liquefaction was more than all PA-CF mixes and also the shear modulus of PA15CR1CF was more than all PA-CR mixes. This may be due to the good cushioning ability of crumb rubber and better interlocking with coir acting together at an optimal composition.
Degradation occurs when the shear modulus of a sample decreases as the number of loading cycles increases [47]. For the stability of foundations of structures during ground shaking, it is required to examine the variation of dynamic shear modulus with loading cycles. As the number of loading cycles increases, then excess pore pressure in the mixes increases, causing the effective stress to decrease and hence, bonding between pond ash particles to break down. The dynamic characteristics of a pond ash sample must be evaluated under various loading cycles. For earthquakes with magnitudes of 5.25, 6.75 and 7.5 the number of critical cycles is 3, 10 and 15 [48]. The degradation index (δ) is calculated as the ratio of dynamic shear modulus in the Nth cycle against dynamic shear modulus in the first cycle [49]. The degradation index has been determined till liquefaction failure has not occurred because a sample that has undergone liquefaction loses its effective stress and finding the degradation index after liquefaction is not a wise idea. In Fig. 7, the degradation index has been plotted against the number of cycles required to liquefy. The rate of decrease of shear modulus with each cycle is determined by the slope of the Degradation index vs. the number of cycles required to initiate liquefaction curve. The steeper the slope, the faster the degradation of shear modulus.
For pond ash sample mixed with coir and crumb rubber at an effective confining pressure of 100 kPa and shear strain of 1.2 percent, the effect of frequency and addition of additives to pond ash on degradation index was studied and plotted in Fig. 10. It was observed that loading at a higher frequency weakens the sample more readily than low-frequency loading. The dynamic shear modulus of pond ash degrades faster than PA-CR samples and slower than PA-CF samples, also evident in Fig. 11. The shear modulus of the PA2CF sample is significantly degraded after only 6 loading cycles. At 0.4 Hz frequency, 60% of the shear modulus degrades between 8–15 cycles and 4–9 cycles for PA-CR and PA-CF mixes, respectively. At 1 Hz frequency, 60% of the shear modulus degrades between 6–12 cycles and 4–7 cycles for PA-CR and PA-CF mixes, respectively. The rate of decrease of shear modulus with no. of cycles is lesser for PA15CR1CF when compared to PA-CF mixes as it takes 10 and 9 cycles to degrade 60% for PA15CR1CF sample at 0.4 and 1 Hz, respectively. Pond ash sample loses its strength substantially after 8 loading cycles, which is less than significant cycles (10 cycles) for an earthquake of magnitude 6.75. The PA2CF sample degrades the fastest of all the samples tested for degradation index. In a nutshell, it can be said that a pond ash-crumb rubber mix imparts liquefaction resistance whereas pond ash-coir mix imparts shear strength and mixture of the three, i.e., PA15CR1CF imparts both liquefaction resistance as well as shear strength.

Figure 11: Degradation index and no. of cycles to liquefaction (N) for PA-CR mix represented in (a) & (c) and for PA-CF and PA-CR-CF mix represented in (b) & (d)
The absorption of energy by the materials through which the wave travels causes damping [50]. The damping ratio (Dr) reflects how much energy a sample dissipates in a given cycle due to the hysteretic character of the loop. The hysteresis loop for estimating the damping ratio during the second cycle of the PA0.5CF sample at 100 kPa effective confining pressure at 1 Hz is shown in Fig. 12. The damping ratio of non-plastic soil is higher than highly plastic soils [47]. The damping ratio was calculated using the following formula given in Eq. (3):

Figure 12: Typical shear stress vs. shear strain curve hysteresis
Here, Al = loop’s area; AAOB = Area triangle ABO; AA′B′O = Area triangle A′B′O
The loss of energy in a vibrating or cyclically loaded system is known as damping. In geotechnical engineering, the damping ratio is usually employed as a measure of energy dissipation during dynamic or cyclic stress [51]. The damping ratio and energy dissipated for a given loading cycle are proportional to the area of the hysteresis loop. Shear modulus and damping ratio of sand-granulated rubber mixtures have been studied and found that with increasing crumb rubber the damping ratio increases and the damping ratio decreases as the number of loading cycles increase [46]. The rate of damping ratio decrease is faster initially and slows as the number of cycles increases. During cyclic triaxial tests, the effective confining pressure and shear strain amplitude (%) was kept at 100 kPa and 1.2 percent, respectively. It was observed that Dr decreases with increasing no. of cycles and increases with increasing frequency of loading. At 0.4 Hz frequency, the damping ratio (Dr) of pond ash is smaller than PA-CR mixes and the PA20CR sample has shown largest damping among all the mixes. PA-CR mixtures have a higher dampening characteristic due to the viscoelastic properties of rubber particles and rubber to rubber and pond ash to rubber interactions. For PA-CF mix at 0.4 and 1 Hz, the damping ratio is lowest in PA2CF mix among PA-CF mixes. Although, when 15% crumb rubber was added to the PA-CF mix, the damping ratio increased significantly, i.e., evident in Fig. 13. There is a sudden drop in the value of the damping ratio when the percentage of coir was increased from 1% to 2% in PA-CF mixes. The damping ratio increases as the percentage of crumb rubber increase because crumb rubber serves as a cushioning agent for pond ash, but coconut fiber is brittle in nature. The damping of coir mixed to pond ash samples is lesser than that of crumb rubber added samples and the damping ratio decreases as the percentage of coir fiber in the composition increases.

Figure 13: Plot of damping ratio and number of cycles (N) for PA-CR mix represented in (a) & (c) and for PA-CF and PA-CR-CF mix represented in (b) & (d)
The study presents a detailed analysis of the experimental results for the geotechnical characteristics and dynamic properties of pond ash with admixture materials (crumb rubber and coconut fiber). The following are the findings of the study:
• Pond ash has been found susceptible to liquefaction. Dynamic properties like shear modulus at initial cycles could be improved by adding coir fiber to pond ash whereas the liquefaction potential can be reduced by adding crumb rubber to pond ash. The damping of coir mixed to pond ash samples is lesser than that of crumb rubber added samples.
• Adding crumb rubber to pond ash allows dynamic loads to be sustained for longer periods. The addition of coir fiber to pond ash has almost no effect on the number of cycles required to initiate liquefaction. Mix having PA (85%) + CR (15%) takes the maximum number of cycles to liquefy. When the frequency of the mix compositions was reduced, the number of cycles to initiate liquefaction increased.
• The dynamic shear modulus of pond ash and pond ash-crumb rubber samples decreases by 25%–30% upon increasing the frequency from 0.4 to 1 Hz. The value of shear modulus for PA (99%) + CF (1%) was highest. The shear modulus of pond ash is nearly half that of PA (99%) + CF (1%) at initial cycles.
• PA-CF mixes degrade faster than PA and PA-CR mixes. PA-CF mixes have liquefaction resistance on the lower side. The mix with PA (84%) + CR (15%) + CF (1%) at 0.4 and 1 Hz, had greater shear modulus than PA and PA-CR mixes. Further, PA (84%) + CR (15%) + CF (1%) sample can be termed as an optimal mix as the number of cycles to initiate liquefaction was more than all PA and PA-CF mixes and also a shear modulus greater than PA and PA-CR mixes.
• Effect of increase in frequency is adverse on degradation index. Almost 60% of the shear modulus degrades between 8–15 cycles and 4–9 cycles for PA-CR and PA-CF mixes at 0.4 Hz, respectively. Whereas 60% of the shear modulus degrades between 6–12 cycles and 4–7 cycles for PA-CR and PA-CF mixes at 1 Hz. The shear modulus degradation of PA (84%) + CR (15%) + CF (1%) is a value in between PA-CF and PA-CR.
• Damping ratio (Dr) decreases with no. of cycle and increases with frequency of loading (0.4 to 1 Hz). Pond ash’s Dr is lower than PA-CR mixes and for PA-CF mixes, pond ash’s damping ratio is higher. The PA (84%) + CR (15%) + CF (1%) mix had a higher damping ratio than PA and PA-CF mixtures, regardless of frequency.
• It is concluded that the number of cycles to initiate liquefaction of pond ash can be improved better with adding 15% of crumb rubber by weight of pond ash. The coir fiber increases the shear modulus for a few initial cycles but is not effective in improving liquefaction resistance. However, a mix of PA (84%) + CR (15%) + CF (1%) had better dynamic properties in comparison to pond ash.
Data Availability Statement: Some or all data, models, or codes that support the findings of this study are available from the corresponding author upon reasonable request. All data, models, and code generated or used during the study appear in the submitted article.
Acknowledgement: First of all, I would like to thank the Almighty for giving me the self-belief to conduct this study. Moreover, I would like to thank all my friends, teachers, and family for being consistent support when it was needed the most.
Funding Statement: The authors received no specific funding for this study.
Conflict of Interest: The authors declare that they have no conflicts of interest to report regarding the present study.
References
1. Ministry of Power (MoP, GoI) (2022). Power sector at a glance: All India. https://powermin.gov.in/en/content/power-sector-glance-all-india. [Google Scholar]
2. Annual Report, C. E. A. (2020). Central electricity authority annual report 2019–20. New Delhi, India: CEA, Government of India. [Google Scholar]
3. Palmer, B. (2022). Coal Ash, fly ash, bottom Ash, and boiler slag. NRDC. https://www.nrdc.org/onearth/coal-ash-fly-ash-bottom-ash-and-boiler-slag. [Google Scholar]
4. Vasistha, V. (2014). Effects of pollutants produced by thermal power plant on environment: A review. International Journal of Mechanical Engineering and Robotics Research, 3(2), 202–207. [Google Scholar]
5. Central Electrical Authority (2021). Fly ash generation at coal/lignite based thermal power stations and its utilization in the country for the first half of the year 2020–2021. New Delhi, India: CEA, Government of India. [Google Scholar]
6. Kaniraj, S. R., Gayathri, V. (2004). Permeability and consolidation characteristics of compacted fly ash. Journal of Energy Engineering, 130(1), 18–43. DOI 10.1061/(ASCE)0733-9402(2004)130:1(18). [Google Scholar] [CrossRef]
7. Pant, A., Datta, M., Gunturi, V. R. (2019). Influence of engineering behaviour of coal ash on design of ash dykes. In: Lecture notes in civil engineering, pp. 219–226. Singapore: Springer. [Google Scholar]
8. MoEF (2021). The gazette of India: Extraordinary. Ministry of environment, forest and climate change notification. Government of India. [Google Scholar]
9. Mohanty, S., Patra, N. R. (2015). Geotechnical characterization of panki and panipat pond ash in India. International Journal of Geo-Engineering, 6(1), 1–18. DOI 10.1186/s40703-015-0013-4. [Google Scholar] [CrossRef]
10. Kumar, J. S., Sharma, P. (2018). Geotechnical properties of pond Ash mixed with cement kiln dust and polypropylene fiber. Journal of Materials in Civil Engineering, 30(8), 04018154. DOI 10.1061/(ASCE)MT.1943-5533.0002334. [Google Scholar] [CrossRef]
11. Singh, J., Singh, S. K., Alam, M. A. (2019). A study on the geotechnical characterization and water retention characteristic curve of pond ash. Water Science and Technology, 80(5), 929–938. DOI 10.2166/wst.2019.334. [Google Scholar] [CrossRef]
12. Singh, J., Singh, S. K. (2022). Dynamic properties of spatially-varied pond Ash within a coal Ash pond. International Journal of Geomechanics, 22(3), 1–14. DOI 10.1061/(ASCE)GM.1943-5622.0002255. [Google Scholar] [CrossRef]
13. Das, S. K., Yudhbir (2005). Geotechnical characterization of some Indian fly ashes. Journal of Materials in Civil Engineering, 17(5), 544–552. DOI 10.1061/(ASCE)0899-1561(2005)17:5(544). [Google Scholar] [CrossRef]
14. Ding, Y., Zhang, J., Chen, X., Wang, X., Jia, Y. (2021). Experimental investigation on static and dynamic characteristics of granulated rubber-sand mixtures as a new railway subgrade filler. Construction and Building Materials, 273. DOI 10.1016/j.conbuildmat.2020.121955. [Google Scholar] [CrossRef]
15. Dayal, U., Sinha, R. (2005). Geo environmental design practice in fly ash disposal & utilization. India: Allied Publishers Private Limited. [Google Scholar]
16. Mishra, D. P., Das, S. K. (2014). Comprehensive characterization of pond ash and pond ash slurries for hydraulic stowing in underground coal mines. Particulate Science and Technology, 32(5), 456–465. DOI 10.1080/02726351.2014.894162. [Google Scholar] [CrossRef]
17. Yadav, J. S., Tiwari, S. K. (2018). Influence of crumb rubber on the geotechnical properties of clayey soil. Environment, Development and Sustainability, 20(6), 2565–2586. DOI 10.1007/s10668-017-0005-y. [Google Scholar] [CrossRef]
18. Mogili, S., Mohammed, A. G., Mudavath, H., Kumar, K. (2020). Mechanical strength characteristics of fiber-reinforced pond ash for pavement application. Innovative Infrastructure Solutions, 5(3), 1–12. DOI 10.1007/s41062-020-00313-y. [Google Scholar] [CrossRef]
19. Liu, L., Guan, Q., Zhang, L., Liu, C., Chen, X. et al. (2022). Evaluation of the compressive-strength reducing behavior of concrete containing rubber aggregate. Cleaner Materials, 4, 100057. DOI 10.1016/j.clema.2022.100057. [Google Scholar] [CrossRef]
20. Cai, X., Zhang, L., Pan, W., Wang, W., Guan, Q. et al. (2022). Study on evaluation of elastic modulus of crumb rubber concrete in meso-scale. Construction and Building Materials, 331, 127247. DOI 10.1016/j.conbuildmat.2022.127247. [Google Scholar] [CrossRef]
21. Jakka, R. S., Datta, M., Ramana, G. V. (2010). Liquefaction behaviour of loose and compacted pond ash. Soil Dynamics and Earthquake Engineering, 30(7), 580–590. DOI 10.1016/j.soildyn.2010.01.015. [Google Scholar] [CrossRef]
22. Mohanty, B., Kumar, P., Patra, N., Chandra, S. (2011). Evaluation of residual strength and liquefaction potential of pond ash. International Journal of Geotechnical Engineering, 5(1), 119. DOI 10.3328/IJGE.2011.05.01.119. [Google Scholar] [CrossRef]
23. Reddy, M. V. R. K., Mohanty, S., Rehana, S. (2020). Experimental investigation on dynamic characterization of equi-proportionate silt–sand range pond ash at high strain. International Journal of Geosynthetics and Ground Engineering, 6(2), 1–14. DOI 10.1007/s40891-020-00211-4. [Google Scholar] [CrossRef]
24. Susilo, A. J. (2016). Enhancing the strength properties of fly ash by adding waste products (Doctoral Thesis). University of Kentucky, USA. [Google Scholar]
25. Maurya, S., Sharma, A. K., Jain, P. K., Kumar, R. (2015). Review on stabilization of soil using coir fiber. International Journal of Engineering Research, 4(6), 296–209. [Google Scholar]
26. Shivkumar Babu, G. L., Vasudevan, A. K. (2008). Strength and stiffness response of coir fiber-reinforced tropical soil. Journal of Materials in Civil Engineering, 20(9), 571–577. DOI 10.1061/(ASCE)0899-1561(2008)20:9(571). [Google Scholar] [CrossRef]
27. Singh, S. P., Sharan, A. (2015). Strength characteristics of fiber-reinforced compacted pond ash. International Journal of Geotechnical Engineering, 9(2), 132–139. DOI 10.1179/1939787913Y.0000000038. [Google Scholar] [CrossRef]
28. Mishra, M., Maheshwari, U. K., Saxena, N. K. (2016). Improving strength of soil using fiber and fly ash–A review. International Research Journal of Engineering and Technology, 3(10), 1262–1266. [Google Scholar]
29. Maroufi, S., Khayyam Nekouei, R., Sahajwalla, V. (2017). Thermal isolation of rare earth oxides from Nd–Fe–B magnets using carbon from waste tyres. ACS Sustainable Chemistry & Engineering, 5(7), 6201–6208. DOI 10.1021/acssuschemeng.7b01133. [Google Scholar] [CrossRef]
30. Lee, J., Salgado, R., Bernal, A., Lovell, W. (1999). Shredded tires and rubber-sand as lightweight backfill. Journal of Geotechnical and Geoenvironmental Engineering, 125(2), 132–141. DOI 10.1061/(ASCE)1090-0241(1999)125:2(132). [Google Scholar] [CrossRef]
31. Zornberg, J. G., Cabral, A. R., Viratjandr, C. (2004). Behaviour of tire shred sand mixtures. Canadian Geotechnical Journal, 41(2), 227–241. DOI 10.1139/t03-086. [Google Scholar] [CrossRef]
32. Nakhaei, A., Marandi, S. M., Sani Kermani, S., Bagheripour, M. H. (2012). Dynamic properties of granular soils mixed with granulated rubber. Soil Dynamics and Earthquake Engineering, 43, 124–132. DOI 10.1016/j.soildyn.2012.07.026. [Google Scholar] [CrossRef]
33. Singh, R., Mittal, S. (2014). Improvement of local subgrade soil for road constuction by the use of coconut coir fiber. International Journal of Research in Engineering and Technology, 3(5), 707–711. DOI 10.15623/ijret. [Google Scholar] [CrossRef]
34. ASTM (2014). Standard test methods for specific gravity of soil solids by water pycnometer. ASTM D854-14. West Conshohocken, PA: ASTM. [Google Scholar]
35. ASTM (2007). Standard test method for particle-size analysis of soils (unified soil classification system). ASTM D422. West Conshohocken, PA: ASTM. [Google Scholar]
36. ASTM (2011). Standard practice for classification of soils for engineering purposes (unified soil classification system). ASTM D2487-11. West Conshohocken, PA: ASTM. [Google Scholar]
37. ASTM (2012). Standard test methods for laboratory compaction characteristics of soil using standard effort. ASTM D698. West Conshohocken, PA: ASTM. [Google Scholar]
38. ASTM (1997). Standard test methods for the determination of the modulus and damping properties of soils using the cyclic triaxial apparatus. ASTM D3999. West Conshohocken, PA: ASTM. [Google Scholar]
39. Hazirbaba, K., Omarow, M. (2019). Strain-based assessment of liquefaction and seismic settlement of saturated sand. Cogent Engineering, 6(1), 1–16. DOI 10.1080/23311916.2019.1573788. [Google Scholar] [CrossRef]
40. Kokusho, T. (1980). Cyclic triaxial test of dynamic soil properties for wide strain range. Soil and Foundations, 20(2), 45–60. DOI 10.3208/sandf1972.20.2_45. [Google Scholar] [CrossRef]
41. Towhata, I. (2008). Mitigation of liquefaction-induced damage. Springer Series in Geomechanics and Geoengineering, 1, 588–642. DOI 10.1007/978-3-540-35783-4. [Google Scholar] [CrossRef]
42. Seed, H. B., Wong, R. T., Idriss, I. M., Tokimatsu, K. (1986). Moduli and damping factors for dynamic analyses of cohesionless soils. Journal of Geotechnical Engineering, 112(11), 1016–1032. DOI 10.1061/(ASCE)0733-9410(1986)112:11(1016). [Google Scholar] [CrossRef]
43. Rollins, K. M., Evans, M. D., Diehl, N. B., Daily, W. D. (1998). Shear modulus and damping relationships for gravels. Journal of Geotechnical and Geoenvironmental Engineering, 124(5), 396–405. DOI 10.1061/(ASCE)1090-0241(1998)124:5(396). [Google Scholar] [CrossRef]
44. Okur, D. V., Ansal, A. (2007). Stiffness degradation of natural fine grained soils during cyclic loading. Soil Dynamics and Earthquake Engineering, 27(9), 843–854. DOI 10.1016/j.soildyn.2007.01.005. [Google Scholar] [CrossRef]
45. Vucetic, M., Mortezaie, A. (2015). Cyclic secant shear modulus versus pore water pressure in sands at small cyclic strains. Soil Dynamics and Earthquake Engineering, 70, 60–72. DOI 10.1016/j.soildyn.2014.12.001. [Google Scholar] [CrossRef]
46. Ehsani, M., Shariatmadari, N., Mirhosseini, S. M. (2015). Shear modulus and damping ratio of sand-granulated rubber mixtures. Journal of Central South University, 22(8), 3159–3167. DOI 10.1007/s11771-015-2853-7. [Google Scholar] [CrossRef]
47. Vucetic, M., Dobry, R. (1991). Effect of soil plasticity on cyclic response. Journal of Geotechnical Engineering, 117(1), 89–107. DOI 10.1061/(ASCE)0733-9410(1991)117:1(89). [Google Scholar] [CrossRef]
48. Seed, H. B., Idriss, I. M. (1982). On the importance of dissipation effects in evaluating pore pressure changes due to cyclic loading. In: Soil mechanics–transient and cyclic loads. [Google Scholar]
49. Idriss, I. M., Dobry, R., Singh, R. D. (1978). Nonlinear behavior of soft clays during cyclic loading. Journal of the Geotechnical Engineering Division, 104(12), 1427–1447. DOI 10.1061/AJGEB6.0000727. [Google Scholar] [CrossRef]
50. Kramer, S. L. (1996). Geotechnical earthquake engineering. India: Pearson Education. [Google Scholar]
51. Ashmawy, A. K., Salgado, R., Guha, S., Drnevich, V. P. (1995). Soil damping and its use in dynamic analyses. Third International Conference on Recent Advances in Geotechnical Earthquake Engineering and Soil Dynamics, vol. 1, pp. 35–41. Missouri, St. Louis. [Google Scholar]
Cite This Article
 Copyright © 2023 The Author(s). Published by Tech Science Press.
This work is licensed under a Creative Commons Attribution 4.0 International License , which permits unrestricted use, distribution, and reproduction in any medium, provided the original work is properly cited.
 Downloads
 Citation Tools