
 Submit a Paper
 Propose a Special lssue
 Open Access
ARTICLE

Extraction and Characterization of Litopenaeus vannamei’s Shell as Potential Sources of Chitosan Biopolymers
1
Higher Institution Centre of Excellence (HICoE), Institute of Tropical Aquaculture and Fisheries (AKUATROP), Universiti
Malaysia, Terengganu, Malaysia
2
East Coast Environmental Research Institute (ESERI), Universiti Sultan Zainal Abidin (UniSZA), Terengganu Darul Iman, Malaysia
3
Faculty of Bioresources and Food Industry, Universiti Sultan Zainal Abidin (UniSZA), Terengganu Darul Iman, Malaysia
4
Faculty of Innovative Design and Technology, Universiti Sultan Zainal Abidin, Terengganu Darul Iman, Malaysia
5
Faculty of Marine Science and Fisheries, Hasanuddin University, Makassar, Indonesia
* Corresponding Author: Nor Azman Kasan. Email:
(This article belongs to the Special Issue: Bio-based Composite/Hybrid Structures and Components)
Journal of Renewable Materials 2023, 11(3), 1181-1197. https://doi.org/10.32604/jrm.2023.022755
Received 24 March 2022; Accepted 30 June 2022; Issue published 31 October 2022
 View Full Text
 Download PDF
Abstract
Chitin is the second most abundant polysaccharide, produced mainly as an industrial waste stream during crustacean processing. Chitin can be derived into chitosan through the deacetylation process. Conversion of shrimp waste into chitosan via the deacetylation process could be considered a practical approach for shell waste remediation. In this study, chitosan’s physicochemical characteristics extracted from two types of Pacific white leg shrimp, L. vannamei’s shell (i.e., rough and smooth), were compared with commercial chitosan. The yield, moisture, ash, solubility, water and fat binding capacity were measured. The degree of deacetylation (DDA) was calculated using FTIR, and their chemical Structure was confirmed using XRD and SEM-EDS. Both extracted chitosan showed no significant difference in yield, moisture, ash, solubility and water binding capacity but showed a significant difference with commercial chitosan. Moreover, the fat binding capacity of commercial chitosan showed the lowest percentage (408.34 ± 0.83%) as compared to extracted chitosan (smooth shell 549.59 ± 12.48%; rough shell 500.55 ± 12.10%). The DDA indicated that extracted chitosan from the smooth and rough shell was considered good chitosan as compared to commercial chitosan with 84.08 ± 1.27%, 80.78 ± 0.79% and 74.99 ± 1.48%, respectively. Additionally, the presence of hydroxyl and amino groups from FTIR and a good crystallinity index was recorded using XRD of extracted chitosan. Based on observed characteristics, shrimp shell waste from L. vannamei can achieve chitosan standard quality as a biopolymer and highly potential to be applied in various industrial applications.Graphic Abstract
Keywords
In the last three decades, coastal shrimp farming has expanded rapidly as an economic activity in many countries globally, including Malaysia, Thailand, China, Vietnam, Indonesia, and many other south-east Asian countries [1]. However, new management and processing techniques for these wastes are needed to produce valuable co-products and lower the impact on the environment, promoting sustainable development of the fishing industry and increasing job creation [2].
The main species with the highest production produced by the Malaysian shrimp farming industry in 2018 were Pacific white leg shrimp, Litopenaeus vannamei, followed by Black tiger shrimp, Penaeus monodon, worth 203.82 million USD with a quantity of 36,007 tons and 70.19 million USD with 9906 tons, respectively [3]. In Malaysia, a seafood processing plant marketed shrimp as a raw or processed product. According to their demand, most processed shrimp are exported to Europe, Japan, New Zealand, and Australia. Peeled-off shrimp or headless shell-on are preferred by the American and Japanese markets, while peeled and cooked shrimp are preferred by New Zealand and Australia [4].
The shrimp processing plant has proliferated with farmed shrimp production in the region, increasing shrimp shell biowaste. Consequently, it leads to environmental pollution in terms of odor nuisance and aesthetic degradation of the environment. The shell wastes are the principal sources of chitin which constitute calcium carbonate (20%–50%), protein (20%–40%), chitin (15%–40%), pigments, and lipids [5,6]. These constituents vary with shrimp species and whether the waste comprises only the head, the shell, or the total waste. It was discoverable that waste from shrimp has a high economic value for its chitin and chitosan; thus, conversion of shrimp waste into chitosan could be considered a practical approach for shell waste remediation.
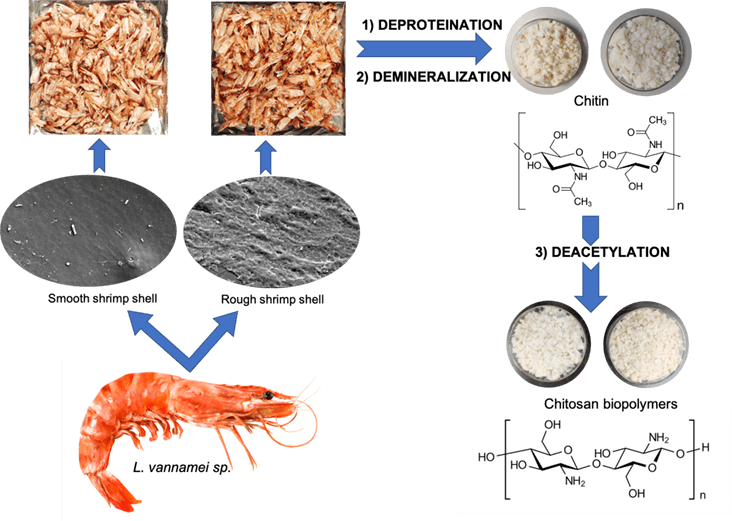
Chitin is a natural polymer with white and hard appearances, nitrogenous, and has low chemical reactivity. Moreover, this polymer has a highly organized crystalline structure and counts as the second most abundant polysaccharide in nature, after cellulose [7]. Therefore, chitin and its derivatives have an excellent economic value due to their agrochemical applications and biological activities. Chitin derivatives called chitosan are linear polysaccharides composed of N-acetylglucosamine and glucosamine. Chitosan can be extracted using the traditional method consisting of three main steps. They are demineralization, deproteination, and deacetylation of shell waste [8]. Demineralization uses an acidic solution, while deproteination uses an alkaline solution. Lastly, deacetylation was performed to remove the acetyl group from the chitin polymer to obtain chitosan. During deacetylation, chitin is treated using highly concentrated alkaline [9].
Chitosan is an amino polysaccharide with hemostatic activity, wound healing, non-toxic, biodegradability, and biocompatibility. Therefore, it has received much attention as one of the promising polymeric materials with various applications, primarily in wastewater treatment [10], food [11], aquaculture and biotechnology [12], pharmaceutical [13], and textile [14]. In addition, chitosan also presents the properties like antibacterial, film-forming, and antioxidant [15].
In this study, the extraction of chitosan was performed using a low-value of rough shrimp shell and a normal smooth shrimp shell of L. vannamei as a raw material to produce higher-value chitosan. The characterization of chitosan extracted from both shells was performed to determine their potential as a source of chitosan biopolymer and to compare the characteristic of extracted chitosan with commercially available chitosan based on shrimp shells purchased from Sigma Aldrich Sdn Bhd. In future work, chitosan extracted in this study may serve as an alternative to chemical coagulants in treating wastewater.
2.1 Sample Collection and Preparation
Two types of smooth- and rough-type shells were collected from L. vannamei species. The smooth shell of L. vannamei is a typical shrimp, while the rough shell of L. vannamei is a shrimp with minerals accumulated on its shell surface. The sampling of L. vannamei was carried out at Integrated Shrimp Aquaculture Park (iSHARP) Sdn. Bhd., located at Setiu, Terengganu (5°34′18.32″N, 111 102°48′25.86″E), which is 30 km away from Universiti Malaysia Terengganu (UMT). iSHARP Sdn. Bhd (a wholly owned subsidiary of Blue Archipelago Berhad) was operated since 2012. It is a modern design facility to enable shrimp hatchery and farming activities to be carried out in an orderly and more sustainable manner. This farm is equipped with biosecurity, 115 superintensive design, and vis-à-vis location. The shell of L. vannamei was wholly separated from its body in the laboratory, washed with deionized water, and dried at 70°C. The commercial chitosan based on shrimp shell with 75% deacetylated was purchased from Sigma Aldrich Sdn. Bhd. This commercial chitosan was used for Research and Development (R&D) purposes only.
2.2 Extraction of Chitin from Shrimp Shell of L. vannamei
A total of 100 g grounded shrimp shell waste was added in 2 M NaOH using the ratio of 1:16 (w/v). The samples were stood for 24 h at room temperature [16]. The solution was then filtered, and the samples obtained were washed until pH 7.
The demineralization process was carried out by using 1 M HCl using the ratio of 1:16 (w/v) and was stood for 24 h at room temperature [16,17]. The samples were then filtered, washed until pH 7, and dried in the oven at 70°C. The final sample is known as chitin.
2.3 Extraction of Chitosan from Chitin
The chitin was treated with 50% NaOH for 24 h at room temperature. The final product is known as chitosan [16]. The chitosan was then filtered, washed until pH 7, and dried in the oven at 70°C.
The chitin and chitosan yields were calculated based on the dry weight of the chitin and chitosan powder relative to the wet weight of the dry shrimp shell [18]. The percentage yield of chitin and chitosan was determined by following Eqs. (1) and (2):
2.5 Physicochemical Characteristics of Chitosan
2.5.1 Determination of Moisture Content
Moisture content was determined by using the gravimetric method. First, the mass of water was determined by drying the sample to constant weight. The sample was weight before and after drying. The mass of water was determined by the difference between the wet and oven-dried samples [19]. Then moisture content was calculated by following Eq. (3):
2.5.2 Determination of Ash Content
The ash content of chitosan was determined by placing 1 gram of chitosan into a pre-weighed crucible. The chitosan in the crucible was heated in a furnace at 600°C for 2 h. The crucible was cooled in a desiccator for 30 min and re-weighed [20]. The percentage of ash content was determined by following Eq. (4):
2.5.3 Determination of Solubility
Solubility was measured by placing 0.1 g of chitosan into a known weight centrifuge tube and then dissolved in 10 ml of 1% acetic acid. The mixture was left for 30 min and the centrifuged at 9,000 rpm for 10 min. Next, the supernatant liquid was decanted, then the undissolved particles were rewashed with distilled water and centrifuge at 9000 rpm. Finally, the supernatant liquid was removed, and the undissolved chitosan was dried at 70°C for 24 h. The amount of residue was weighted, and the percentage of solubility was determined by following Eq. (5) [21]:
where A is the initial weight of the centrifuge tube and chitosan, B is the final weight of the centrifuge tube and chitosan, and C is the initial weight of chitosan.
2.5.4 Water and Fat Binding Capacity
Water binding capacities (WBC) and fat binding capacities (FBC) were measured using a modified method by Li et al. [22]. First, the centrifuge tube with 0.5 g of chitosan was weighed. Then, 10 ml of water was added for WBC, and 10 ml of corn oil was added for FBC. Next, the centrifuge tube was shaken well using a vortex mixer for 1 min. The contents were left at room temperature for 30 min and were shaken for 5 s every 10 min. Then, the centrifuge tube was centrifuged at 4000 rpm for 30 min. The supernatant was removed, and the tube was reweighed. The WBC and FBC were determined by following Eqs. (6) and (7):
2.6 Characterization of Chitosan
2.6.1 Fourier Transform Infrared Spectroscopy (FTIR)
Chitosan samples were prepared in the form of a KBr disc. First, the spectra of chitosan were established using a Fourier Transform Infrared Spectroscopy (FTIR) instrument (Thermo Nicolet Nexus 670 spectrometer, USA) with a frequency of 4000–400 cm−1 at 4 cm−1 resolution and 16 scans [23]. Next, the FTIR results calculated the chitosan’s degree of deacetylation (DDA) using the baseline method [24]. The equation for the baseline was determined by following Eq. (8):
where A1655 were the absorbances at 1655 cm−1 of the amide-I band, which measures the N-acetyl group content. The A3450 is the absorbances at 3450 cm−1 of the hydroxyl band as an internal standard to correct disc thickness. The factor of 1.33 denoted the value of the ratio of A1655/A3450 for fully N-acetylated chitosan.
2.6.2 Scanning Electron Microscopy with Energy-Dispersive X-Ray Spectroscopy (SEM-EDS)
The morphological characteristic of the chitosan was analyzed using Scanning electron microscopy with energy-dispersive X-ray spectroscopy (SEM-EDS) (Thermo Scientific Quattro, USA). To perform the analysis of SEM-EDS, a thin layer of chitosan sample was spread on black tape and bonded to a stub. Then, it was coated with a thin Aurum layer to make them more conductive. Next, the EDS was performed by selecting a wanted region and analyzed by Electrons Secondary (SEI) detector at 15 kV with a working distance: 10 mm, spot size: 30, and under high vacuum conditions [25].
Chitosan samples were analyzed by X-ray diffractometer (Rigaku Miniflex, United States of America) to evaluate their crystallinity. XRD spectra were collected by setting their CuKα radiation at 30 mA and 40 kV, 3–40° of 2θ scan range with a time/step of 1 s and step size of 0.1°. The crystallinity index (CrI) was calculated by following Eq. (9):
where I110 is the maximum intensity of the diffraction peak at 2θ = 20° and Iam is the amorphous diffraction signal at 2θ = 16° [26].
Correlation analysis was performed using one-way analysis of variance (ANOVA) to obtain the correlation between groups. In order to find the significant difference in the reported results, a post hoc test using Turkey HSD was executed. All statistical analyses were performed using OriginPro 9 software. The conclusion was taken under the confidence interval of 95% (α = 0.05), with significant differences in the results indicated by a p-value < 0.05 [27].
3.1 Yield and Physicochemical Properties of Chitosan
The chitin yield extracted from L. vannamei smooth shell was 30.09 ± 0.92%, while the rough shell was 26.80 ± 1.05% (Table 1). After the deacetylation process, the chitosan yield from both shells showed no significant difference (p > 0.05) with 20.75 ± 0.83% and 19.34 ± 1.30%, respectively. The physicochemical characteristics of both chitosan were studied and compared with commercial chitosan. The moisture and ash content of chitosan extracted from both shells does not show any significant different (p > 0.05) with 4.71 ± 0.26% and 0.09 ± 0.01% for the smooth shell, while 4.30 ± 0.07% and 0.13 ± 0.01% for the rough shell. In comparison, the commercial chitosan showed a higher moisture and ash content value with 5.48 ± 0.14% and 0.25 ± 0.02%.

The solubility of extracted and commercialized chitosan was calculated. It was found that the commercial chitosan has higher solubility with 83.22 ± 1.25%, while the extracted chitosan from smooth and rough shells dissolved 52.45 ± 0.98% and 51.69 ± 0.66%, respectively. Furthermore, the DDA of all chitosan was calculated using the baseline method from FTIR, which resulted in 74.99 ± 1.48%, 84.08 ± 1.27%, and 80.78 ± 0.79% for chitosan from the smooth, rough shell and commercial shell, respectively. The value of DDA indicated more than 50% for all chitosan, proving the chitin has turned into chitosan.
The similarities between extracted and commercialized chitosan were found in water binding capacity (WBC) in the range of 691.32 ± 5.05% to 723.21 ± 40.21%. Fat binding capacity (FBC) showed a significant difference in commercial chitosan (408.34 ± 0.83%) and chitosan extracted from smooth (549.59 ± 12.48%) and rough shrimp shells (500.55 ± 12.10%). In addition, the crystallinity index (CrI) of extracted chitosan was lower than the CrI of chitin by showing a reduction from 90.63 ± 0.60% to 77.73 ± 0.98% (smooth shell) and 90.52 ± 0.75% to 78.73 ± 0.64% (rough shell). The color of chitosan extracted from both shells shows the same color as the commercial chitosan.
3.2 Characterisation of Chitosan
The present study was the first attempt to determine the physicochemical properties of chitosan extracted from two different types of L. vannamei’s shell. Physically, these two types of shells look similar. However, the difference could be observed using barehand. The difference between the two types of the shell was clearly shown in Fig. 1B, where there are uneven and rough layers deposited on the surface of the shell compared to Fig. 1A, which appeared smooth with some impurities intact. The uneven layer deposited on the rough shrimp shell surface was suspected to be due to the initial stage of mineral deposition. This conclusion is supported by the EDX results, as indicated in Fig. 1B, which showed that the calcium content from rough shrimp shell surfaces was higher than from smooth shrimp shell surfaces.


Figure 1: SEM-EDX micrograph at 2000X magnification after pretreatment step (A) Smooth shell (B) Rough shell; after deproteination and demineralization step (C) Chitin from smooth shell (D) Chitin from rough shell; after deacetylation (E) Chitosan from smooth shell (F) Chitosan from the rough shell of L. vannamei (G) Commercial chitosan
After alkaline and acidification treatment, both shrimp shell has to turn into chitin. Fig. 1C showed a dense microfibrillar and fibrous Structure with a pore entrapped together, while Fig. 1D showed a looser fibrous structure. After the deacetylation process, chitin from both shell types has turned into chitosan by showing a smooth and crinkled surface (Figs. 1E and 1F). Compared to commercial chitosan in Fig. 1G, the morphology showed the presence of rough surfaces. The EDX result showed the nitrogen content decreased from smooth shrimp shells to chitosan with 16.4% to 2.5% and 17.3% to 3.7% for rough shrimp shells, respectively. While for the commercial chitosan, the nitrogen value was 3.3%.
Fig. 2 and Table 2 present the results of FTIR. The shrimp shell and chitin pattern from both shell types possess similar spectra as no new band is formed except for the weakened band. In addition, a difference in intensity was observed between A1 (low) and A2 (high) owing to mineral accumulation on the A2 surface. Therefore, after the deproteination and demineralization, the intensity of B1 was low, and B2 was high. This trend was observed because both shell types react differently with acid and alkali treatment concentrations. However, after the deacetylation process, higher intensity in C1 was observed compared to C2 and C3.

Figure 2: FTIR spectra of smooth shrimp shell (A1), Chitin (B1) and Chitosan (C1) Extracted from smooth shell; rough shrimp shell (A2), Chitin (B2) and Chitosan (C2) Extracted from the rough shell and commercial chitosan (C3)

Functional groups exist on the same wavenumber except for a shift in stretching and bending of calcite (CaCO3) near 870 cm−1 in A1 and A2. FTIR spectra of B1 and B2 showed the presence of OH groups at 3448.02 and 3448.16 cm−1, and NH group at 3266.29 & 3116.87 and 3128.12 cm−1. However, these bands nearly disappeared in C1 and C2 after deacetylation, comparable to C3. The CH stretching, both asymmetric and symmetric, was observed in A1, B1, A2, B2, C3 and weakened in C1 and C2. FTIR spectra of B1 was shown two separated Amide I peak at 1654.28 and 1636.97 cm−1, while for B2 at 1654.30 and 1646.52 cm−1. The split peak of Amide I for B1 and B2 showed a reduction in band intensity of C1 and C2. Moreover, the peak of Amide II (1559.86, 1559.91 cm−1) and Amide III (1320.04, 1320.34 cm−1) for B1 and B2 also showed a reduction after deacetylation. The stretching vibration of the glycosidic bond of polysaccharides structure at 1157.18, 1074.14, 1026.84 cm−1 (B1) and 1156.32, 1073.89, 1024.27 cm−1 (B2) weakened distinctly after the deacetylation process indicates the depolymerization of C1 and C2 has occurred using this study method. The other peaks at weak intensity were found near 897 cm−1 (C-O stretching of glycosidic linkage) for both chitin and chitosan.
In Fig. 3, XRD peaks of both A1 and A2 showed chitin at a peak near 2θ = 20°, 2θ = 10° and the presence of a weak peak near 2θ = 30° was also observed. In this study, chitin showed a crystalline plane (110) observed at a reflection of 19.29° for B1, while 18.97° for B2. Thus, it showed that both types of L. vannamei shells are composed of α-chitin, supported by our FTIR results. XRD examination of chitosan obtained in this study also showed a peak at 19.36° for C1, 19.55° for C2, and 19.60° for C3. All these peaks were reflected around 2θ = 20° same as chitin. However, the intensity is lower and amorphous compared to chitin.

Figure 3: XRD patterns of smooth shrimp shell (A1), Chitin (B1) and Chitosan (C1) Extracted from smooth shrimp shell; rough shrimp shell (A2), Chitin (B2) and Chitosan (C2) Extracted from rough shrimp shell; commercial chitosan (C3)
The rough shell syndrome among the L.vannamei decreases their price to be sold in the market. According to a previous report, mineral deposition made the shrimp’s shells rough [28]. Furthermore, the image of a rough shrimp shell obtained from this study is almost similar to the study reported by Sakthivel et al. [29]. In contrast, the image of smooth shrimp shells was comparable with other researchers [30–32]. In this study, the percentage of chitin and chitosan yield from both shells shows no significant difference because of the prolonged treatment using acid and alkali. Similar to the present study, a chitin yield of 14.72% was reported from shrimp shell waste of unknown species [33], while others reported a 30% yield of chitin from Black tiger shrimp, P. monodon [23]. After the deacetylation process, the chitosan yield from L. vannamei from both smooth and rough shells showed no significant difference with 20.43% and 19.10%, respectively. Since the mineral deposition occurred on the shell of the shrimp, the deproteination, demineralization, and deacetylation process, which involve a harsh chemical, might wash off the mineral deposited. This explains why the chitosan yield from both shells is not significant.
Furthermore, chitosan extracted in this study showed better moisture and ash content performance than commercial chitosan. Ash content measurement is an indicator of the effectiveness of the demineralization step for the removal of calcium carbonate. The value of ash content is below 1%, which indicates the efficiency of calcium carbonate removal in high-quality chitosan [34]. Some residual ash of chitosan may affect other essential characteristics of the final product. Despite the drying process of all chitosan, the moisture content of all chitosan shows that chitosan can absorb moisture due to its hygroscopic nature [24]. However, the value of its moisture is less than 10%, comparable with commercial chitosan reported previously [12]. The commercial chitosan showed a higher solubility than extracted chitosan in this study. Solubility depends on various factors such as degree of deacetylation and molecular weight. Even though the value of the degree of deacetylation (DDA) for commercialized chitosan is lower, the higher solubility was expected to occur because of the low molecular weight owned by commercial chitosan.
Deacetylation is crucial in converting chitin to chitosan by removing the acetyl group from chitin [8,21]. The conversion of chitin into chitosan lies in the value DDA. However, the deacetylation of chitin in an alkaline solution cannot reach completion even under harsh treatment, and most reported DDA usually ranges from 70% to 95%, depending on the method used. Identifying the right combination of bands and baselines is complicated and causes variations in the method of DDA calculation. This study calculated the DDA using a formula based on the FTIR baseline result. This formula was calculated based on the relationship between the absorbance (A) value of the primary Amide at 1655 cm−1 and hydroxyl at 3450 cm−1. While the other formula reported uses an absorption band at 1320 and 1420 cm−1. However, it does not give an accurate result because the peaks were too small to be measured [35]. Among critical factors affecting deacetylation are temperature and time of deacetylation, treatment during chitin isolation, alkali concentration and chitin ratio. The varied results in the literature were due to different methods used for DDA calculation [36–38]. In this study, both extracted chitosan showed better deacetylation degrees due to the removal of the acetyl group is higher during the deacetylation process. Commercial chitosan properties and quality may vary widely due to the different manufacturing processes and its immense production scale [39,40].
The results of WBC were in line with shrimp chitosan (712.99 ± 11.98%) reported by Kucukgulmez et al. [19]. No et al. [41] showed a different WBC ranging from 485% to 805%. The difference report on WBC depends on the source used and possibly due to differences in chitosan crystallinity, the products’ residual protein content, and the number of salt-forming groups [42,43]. The increment of WBC occurs as the deacetylation time increase due to the breakdown of chitosan [26]. The breakdown of chitosan will increase the surface area, thus improving the binding sites of -NH2, -OH, and other end groups.
Additionally, the FBC of extracted chitosan is in the range that agrees with the previous study by Kucukgulmez et al. [19] and Toan [44]. However, some reported findings are contrary, which showed higher FBC due to changes in the sequence of extraction steps, where demineralization was conducted before deproteination [45]. On the other hand, the commercial chitosan showed a low FBC but was similar to the previous study reported by Hossain et al. [46].
The nitrogen content of all chitosan is in line with the reported study, where deproteination and demineralization lowered the shell’s total nitrogen content [26,47]. The proteins in the shrimp shells and other nitrogenous materials were removed during the conversion process of shrimp shells to chitin. After deacetylation of chitin, the chitosan showed a decreased value of nitrogen for smooth shrimp shells, indicating hydrolytic deamination or contamination. In contrast, the chitosan in rough shrimp shells has shown an increased nitrogen content where the acetamide group was converted into the amino groups. Despite this result, nitrogen in all chitosan is still in an acceptable range of 2% to 8% to be applied in several industrial applications. Moreover, if the nitrogen content is higher than the theoretical value of 6.9%, it means partial deacetylation or incomplete protein removal has occurred [45].
The color of the chitosan extracted from both shells is a pale yellow, the same as commercialized chitosan. The proposed route removed almost all the pigment color of the shrimp shell without a bleaching process. A previous study also reported that chitosan extraction started with deproteination and produced whiter chitin [48]. If the extraction starts with deproteination, efficient demineralization will occur. This is because the protective layer of protein is removed and exposed the chitin to acidic conditions. However, the yield of chitin and chitosan produced by this route is lower.
The morphological Structure of chitin obtained from both shells shows a similarity with α-chitin and is different with β-chitin which has slightly visible fibers, and γ-chitin which showed a cocoon microfiber [49]. After the deacetylation process, both extracted chitosan showed an image comparable with the previous study, which is smooth with a crinkled surface [26,36,50–52]. The differences in morphologies between commercial chitosan and extracted chitosan from the smooth and rough shell of L. vannamei were expected due to different concentrations and duration of acid and alkaline treatment. Moreover, the sources and the species of shrimp shells used were also unknown for the commercial chitosan.
FTIR was used to identify the functional group present in the chitin and chitosan from both shell types, which was later compared with commercial chitosan. The same functional group was observed in shrimp shell, chitin, and chitosan from both shell and commercial chitosan, except for a shift in stretching and bending of calcite (CaCO3) near 870 cm−1 in shrimp shell [53,54]. However, the difference was seen in intensities due to different reactions of both shells toward alkali and acid treatment. Also, some band was weakened after the deproteination and demineralization process. The effective deacetylation was seen in this study when Amides I and II showed a reduction due to the removal of the N-acetyl group [55,56]. Additionally, the split Amide I band proved the presence of α-chitin in both shell types. In the case of β-chitin, only a single band has appeared at 1656 cm−1, indicating that its amide groups establish hydrogen bonds of the same energy [57].
Furthermore, the XRD result also showed a peak around 10° and 20°, with a minor peak around 30° which showed α-chitin sharp peak [49,58]. Thus, it is shown that both types of L. vannamei shells are composed of α-chitin, comparable with the previous study by Si Trung et al. [59]. The peaks of chitin are high and sharp compared to the chitosan peak, indicating a highly ordered crystal structure of α-chitin. However, after the deacetylation, the sharp peak decreased and became broader. In contrast, the minor peaks of the chitosan have disappeared, indicating a reduction in crystallinity with the presence of the amorphous structure of the chitosan. A similar peak was observed in previous works for chitin obtained from crab, lobster shells, and squid pens [60]. Overheating chitin under alkaline conditions during the deacetylation process will distort the chitosan’s crystalline structure [49]. This explained the reducing CrI from 90.63 ± 0.60% to 77.73 ± 0.98% (smooth shell) and 90.52 ± 0.75% to 78.73 ± 0.64% (rough shell). In this study, the value of CrI recorded falls within the range of previous literature between 48% and 89.7%. The varied value of CrI was expected depending on the genus of the living organism studied and the different methods of preparation and chitosan extraction [61].
In this study, 20.75 ± 0.83% yield of chitosan products were extracted from smooth shrimp shells, and 19.34 ± 1.30% yield of chitosan products were extracted from rough shrimp shells of the L. vannamei species using the chemical treatment method. The final product of both extracted chitosan showed no significant difference in yield, moisture, ash, solubility, water binding capacity, and crystallinity index but showed a significant difference with commercial chitosan. Therefore, it can be concluded that extracted chitosan from both shells showed lower moisture, ash and nitrogen content compared to commercial chitosan but a high percentage of fat and water binding capacities. Additionally, the chemical structure showed the presence of hydroxyl and amino groups comparable with commercial chitosan. According to these findings, the extracted chitosan from smooth and rough shrimp shells has the potential to be used as a biopolymer in different industrial applications such as aquaculture wastewater treatment, agrochemicals, pulp & paper, and textile effluents.
Acknowledgement: The authors would like to acknowledge Higher Institution Centre of Excellence (HICoE), Institute of Tropical Aquaculture and Fisheries (AKUATROP) Program [Vot. No. 63933, JPT.S(BPKI) 2000/016/018/ 015 Jld.3 (23) and Vot. No. 56050, UMT/PPPI/2-2/5 Jld.2 (24)] granted by the Ministry of Higher Education Malaysia for funding this research project. All authors also appreciate the Long-Term Research Grant Scheme 1/2018, LRGS (LRGS/2018/USM-UKM/EWS/01). Finally, all authors would like to express our thanks to Integrated Shrimp Aquaculture Park (iSHARP) Sdn. Bhd., Setiu, Terengganu for both smooth and rough shrimp shell samples, Institute of Tropical Aquaculture and Fisheries (AKUATROP), Universiti Malaysia Terengganu, Malaysia, and Encik Shahril Amin Hashim from Material Characterization Lab, Faculty of Innovative Design and Technology, Universiti Sultan Zainal Abidin, Malaysia for providing scientific facilities and analysis during the experimental period.
Funding Statement: This work was funded by The Ministry of Higher Education (MOHE), Malaysia, under The Higher Institution Centre of Excellence (HICoE), Institute of Tropical Aquaculture and Fisheries (AKUATROP) Program [Vot. No. 63933, JPT.S(BPKI) 2000/016/018/ 015 Jld.3 (23) and Vot. No. 56050, UMT/PPPI/2-2/5 Jld.2 (24)]. This work was also funded by the Long-Term Research Grant Scheme 1/2018, LRGS (LRGS/2018/USM-UKM/EWS/01).
Conflicts of Interest: The authors declare they have no conflicts of interest to report regarding the present study.
References
1. Lee, W. C., Lim, S. Z., Viswanathan, K. K., Islam, M. A. (2020). Marketing margins of aquaculture shrimp production in Kedah. Borneo Journal of Marine Science and Aquaculture, 4(1), 20–23. DOI 10.51200/bjomsa.v4i1.1992. [Google Scholar] [CrossRef]
2. Sivaraman, I., Krishnan, M., Radhakrishnan, K. (2019). Better management practices for sustainable small-scale shrimp farming. Journal of Cleaner Production, 214(429), 559–572. DOI 10.1016/j.jclepro.2018.12.172. [Google Scholar] [CrossRef]
3. Waiho, K., Fazhan, H., Ishak, S. D., Kasan, N. A., Liew, H. J. et al. (2020). Potential impacts of COVID-19 on the aquaculture sector of Malaysia and its coping strategies. Aquaculture Reports, 18, 100450. DOI 10.1016/j.aqrep.2020.100450. [Google Scholar] [CrossRef]
4. Hashim, M., Kathamuthu, S. (2005). Shrimp farming in Malaysia. Regional technical consultation on the aquaculture of P. vannamei and other exotic shrimps in Southeast Asia. Manila, Philippines. [Google Scholar]
5. Bradic, B., Novak, U., Likozar, B. (2019). Crustacean shell bio-refining to chitin by natural deep eutectic solvents. Green Processing and Synthesis, 9(1), 13–25. DOI 10.1515/gps-2020-0002. [Google Scholar] [CrossRef]
6. Lin, Y. S., Liang, S. H., Lai, W. L., Lee, J. X., Wang, Y. P. et al. (2021). Sustainable extraction of chitin from spent pupal shell of black soldier fly. Process, 9(6), 976. DOI 10.3390/pr9060976. [Google Scholar] [CrossRef]
7. Vanessa, P. S., Nathalia, S. S. M., Patricia, C. S. V. M., Marcos, A. B. L., Luciana, O. F. et al. (2020). Review: Seafood waste as attractive source of chitin and chitosan production and their applications. International Journal of Molecular Sciences, 21(12), 4290. DOI 10.3390/ijms21124290. [Google Scholar] [CrossRef]
8. Iber, B. T., Kasan, N. A., Torsabo, D., Omuwa, J. W. (2021). A review of various sources of chitin and chitosan in nature. Journal of Renewable Materials, 10(4), 1097–1123. DOI 10.32604/jrm.2022.018142. [Google Scholar] [CrossRef]
9. Kandile, N. G., Zaky, H. T., Mohamed, M. I., Nasr, A. S., Ali, Y. G. (2018). Extraction and characterization of chitosan from shrimp shells. Journal of Organic Polymer and Materials, 8(3), 33–42. DOI 10.4236/ojopm.2018.83003. [Google Scholar] [CrossRef]
10. Benalia, A., Derbal, K., Khalfaoui, A., Pizzi, A., Medjahdi, G. (2021). The use of aloe vera as natural coagulant in algerian drinking water treatment plant. Journal of Renewable Materials, 10(3), 625–637. DOI 10.32604/jrm.2022.017848. [Google Scholar] [CrossRef]
11. Chattopadhyay, K., Xavier, K. A. M., Layana, P., Balange, A. K., Nayak, B. B. (2019). Chitosan hydrogel inclusion in fish mince-based emulsion sausages: Effect of gel interaction on functional and physicochemical qualities. International Journal of Biological Macromolecules, 134(2), 1063–1069. DOI 10.1016/j.ijbiomac.2019.05.148. [Google Scholar] [CrossRef]
12. Alishahi, A., Mirvaghefi, A., Tehrani, M. R., Farahmand, H., Shojaosadati, S. A. et al. (2011). Enhancement and characterization of chitosan extraction from the wastes of shrimp packaging plants. Journal of Polymers and the Environment, 19(3), 776–783. DOI 10.1007/s10924-011-0321-5. [Google Scholar] [CrossRef]
13. Shriatinia, Z. (2019). Pharmaceutical applications of chitosan. Advances in Colloid and Interface Science, 263(4), 131–194. DOI 10.1016/j.cis.2018.11.008. [Google Scholar] [CrossRef]
14. Zhou, C. E., Kan, C. W., Sun, C., Du, J., Xu, C. (2022). A review of chitosan textile applications. AATCC Journal of Research, 6(1_suppl), 8–14. DOI 10.14504/ajr.6.S1.2. [Google Scholar] [CrossRef]
15. Nurilmala, M., Fauzi, S., Mayasari, D., Batubar, I. (2019). Collagen extraction from yellowfin tuna (Thunnus albacares) skin and its antioxidant activity. Jurnal Teknologi, 81(2), 141–149. DOI 10.11113/jt.v81.11614. [Google Scholar] [CrossRef]
16. Kumari, S., Rath, P., Sri Hari Kumar, A., Tiwari, T. N. (2015). Extraction and characterisation of chitin and chitosan from fishery waste by chemical method. Environmental Technology and Innovation, 3, 77–85. DOI 10.1016/j.eti.2015.01.002. [Google Scholar] [CrossRef]
17. William, W., Wid, N. (2019). Comparison of extraction sequence on yield and physico-chemical characteristic of chitosan from shrimp shell waste. Journal of Physics: Conference Series, 1358, 13002. DOI 10.1088/1742-6596/1358/1/012002. [Google Scholar] [CrossRef]
18. Olafadehan, O. A., Amoo, K. O., Ajayi, T. O., Bello, V. E. (2021). Extraction and characterization of chitin and chitosan from Callinectes amnicola and Penaeus notialis shell wastes. Journal of Chemical Engineering and Materials Science, 12(1), 1–30. DOI 10.5897/JCEMS2020.0353. [Google Scholar] [CrossRef]
19. Kucukgulmez, A., Celik, M., Yanar, Y., Sen, D., Polat, H. et al. (2011). Physicochemical characterization of chitosan extracted from Metapenaeus stebbingi shells. Food Chemistry, 126(3), 1144–1148. DOI 10.1016/j.foodchem.2010.11.148. [Google Scholar] [CrossRef]
20. Renuka, V., Ravishankar, C. N. R., Elavarasan, K., Zynudheen, A. A., Joseph, T. C. (2019). Production and characterization of chitosan from shrimp shell waste of Parapeneopsis stylifera. International Journal of Current Microbiology and Applied Science, 8(11), 2076–2083. DOI 10.20546/ijcmas.2019.811.240. [Google Scholar] [CrossRef]
21. Fernandez-Kim, S. O. (2004). Physicochemical and functional properties of crawfish chitosan as affected by different processing protocols (Ph.D. Thesis). Louisiana State University, Baton Rouge, La, USA. [Google Scholar]
22. Li, B., Wu, X., Bao, B., Guo, R., Wu, W. (2021). Evaluation of α-chitosan from crab shell and β-chitosan from squid gladius based on biochemistry performance. Applied Science, 11(7), 3183. DOI 10.3390/app11073183. [Google Scholar] [CrossRef]
23. Srinivasan, H., Kanayairam, V., Ravichandran, R. (2018). Chitin and chitosan preparation from shrimp shells Penaeus monodon and its human ovarian cancer cell line, PA-1. International Journal of Biological Macromolecules, 107(4), 662–667. DOI 10.1016/j.ijbiomac.2017.09.035. [Google Scholar] [CrossRef]
24. Khan, T. A., Peh, K. K., Ch’ng, H. S. (2002). Reporting degree of deacetylation values of chitosan: The influence of analytical methods. Journal of Pharmacy and Pharmaceutical Science, 5(3), 205–212. [Google Scholar]
25. Eddya, M., Tbib, B., EL-Hami, K. (2020). A comparison of chitosan properties after extraction from shrimp shells by diluted and concentrated acids. Heliyon, 6(2), e03486. DOI 10.1016/j.heliyon.2020.e03486. [Google Scholar] [CrossRef]
26. Rasweefali, M. K., Sabu, S., Sunooj, K. V., Sasidharan, A., Xavier, K. A. M. (2021). Consequences of chemical deacetylation on physicochemical, structural and functional characteristics of chitosan extracted from deep-sea mud shrimp. Carbohydrate Polymer Technologies and Applications, 2(5), 100032. DOI 10.1016/j.carpta.2020.100032. [Google Scholar] [CrossRef]
27. Ahmad, A., Abdullah, S. R. S., Hasan, H. A., Othman, A. R., Ismail, N. I. (2021). Plant-based versus metal-based coagulants in aquaculture wastewater treatment: Effect of mass ratio and settling time. Journal of Water Process Engineering, 43, 102269. DOI 10.1016/j.jwpe.2021.102269. [Google Scholar] [CrossRef]
28. Chanratchakool, P. (2003). Problems in Penaeus monodon culture in low salinity areas. Aquaculture Asia, 8, 54–56. [Google Scholar]
29. Sakthivel, A., Selvakumar, P., Gopalakrishnan, A. (2014). Effect of mineral deposition on shrimp Litopenaeus vannamei in high alkaline water of Pennar River, Andhra Pradesh of South-East Coast of India. Journal of Aquaculture Research and Development, 5(4), 1000241. DOI 10.4172/2155-9546.1000241. [Google Scholar] [CrossRef]
30. Elhussieny, A., Faisal, M., D’angelo, G., Everitt, N. M., Fahim, I. S. (2020). Experimental investigation of chitosan film reinforced by chitin fibers and chitin whiskers extracted from shrimp shell waste. Journal of Engineering Science and Technology, 15(4), 2730–2745. [Google Scholar]
31. Tolesa, L. D., Gupta, B. S., Lee, M. J. (2019). Chitin and chitosan production from shrimp shells using ammonium-based ionic liquids. International Journal of Biological Macromolecules, 130, 818–826. DOI 10.1016/j.ijbiomac.2019.03.018. [Google Scholar] [CrossRef]
32. Zhang, H., Jin, Y., Deng, Y., Wang, D., Zhao, Y. (2012). Production of chitin from shrimp shell powders using Serratia marcescens B742 and Lactobacillus plantarum ATCC, 8014 successive two-step fermentation. Carbohydrate Research, 362, 13–20. DOI 10.1016/j.carres.2012.09.011. [Google Scholar] [CrossRef]
33. Varun, T. K., Senani, S., Jayapal, N., Chikkerur, J., Roy, S. et al. (2017). Extraction of chitosan and its oligomers from shrimp shell waste, their characterisation and antimicrobial effect. Veterinary World, 10(2), 170–175. DOI 10.14202/vetworld.2017.170-175. [Google Scholar] [CrossRef]
34. Abdullah, Q. H., Zamri, A. I., Chilek, T. Z. T., Ahmad, F., Razak, S. B. A. et al. (2019). Optimization of chitosan extracted from Matuta lunaris by using response surface methodology (RSM). Asian Journal of Agriculture and Biology, 100–110. [Google Scholar]
35. Nessa, F., Masum, S. M., Asaduzzaman, M., Roy, S., Hossain, M. et al. (2010). A process for the preparation of chitin and chitosan from prawn shell waste. Bangladesh Journal of Scientific and Industrial Research, 45(4), 323–330. DOI 10.3329/bjsir.v45i4.7330. [Google Scholar] [CrossRef]
36. Abdel-Rahman, R. M., Hrdina, R., Abdel-Mohsen, A. M., Fouda, M. M. G., Soliman, A. Y. et al. (2015). Chitin and chitosan from Brazilian Atlantic Coast: Isolation, characterisation and antibacterial activity. International Journal of Biological Macromolecules, 80, 107–120. DOI 10.1016/j.ijbiomac.2015.06.027. [Google Scholar] [CrossRef]
37. de Alvarenga, E. S., Pereira de Oliveira, C., Roberto Bellato, C. (2010). An approach to understanding the deacetylation degree of chitosan. Carbohydrate Polymers, 80(4), 1155–1160. DOI 10.1016/j.carbpol.2010.01.037. [Google Scholar] [CrossRef]
38. Kasaai, M. R. (2008). A review of several reported procedures to determine the degree of N-acetylation for chitin and chitosan using infrared spectroscopy. Carbohydrate Polymers, 71(4), 497–508. DOI 10.1016/j.carbpol.2007.07.009. [Google Scholar] [CrossRef]
39. Kalut, S. A. (2008). Enhancement of degree of deacetylation of chitin in chitosan production (Master’s Thesis). Universiti Malaysia Pahang, Malaysia. [Google Scholar]
40. Li, Q., Dunn, E. T., Grandmaison, E. W., Goosen, M. F. A. (1992). Applications and properties of chitosan. Journal of Bioactive and Compatible Polymers, 7(4), 370–397. DOI 10.1177/088391159200700406. [Google Scholar] [CrossRef]
41. No, H. K., Lee, K. S., Meyers, S. P. (2000). Correlation between physicochemical characteristics and binding capacities of chitosan products. Journal of Food Science, 65(7), 1134–1137. DOI 10.1111/j.1365-2621.2000.tb10252.x. [Google Scholar] [CrossRef]
42. Knorr, D. (1982). Functional properties of chitin and chitosan. Journal of Food Science, 47(2), 593–595. DOI 10.1111/j.1365-2621.1982.tb10131.x. [Google Scholar] [CrossRef]
43. Kumari, S., Kishor, R. (2020). Handbook of chitin and chitosan: Chitin and chitosan: Origin, properties, and applications. Handbook of Chitin and Chitosan, 1, 1–33. DOI 10.1016/B978-0-12-817970-3.00001-8. [Google Scholar] [CrossRef]
44. Toan, N. V. (2009). Production of chitin and chitosan from partially autolyzed shrimp shell materials. The Open Biomaterials Journal, 1, 21–24. DOI 10.2174/1876502500901010021. [Google Scholar] [CrossRef]
45. Rout, S. K. (2001). Physicochemical, functional and spectroscopic analysis of crawfish chitin and chitosan as affected by process modification (Master Thesis). Louisiana State University, USA. [Google Scholar]
46. Hossain, M. S., Iqbal, A. (2014). Production and characterisation of chitosan from shrimp waste. Journal of Bangladesh Agriculture University, 12(1), 153–160. DOI 10.3329/jbau.v12i1.21405. [Google Scholar] [CrossRef]
47. Teli, M. D., Sheikh, J. (2012). Extraction of chitosan from shrimp shells waste and application in antibacterial finishing of bamboo rayon. International Journal of Biological Macromolecules, 50(5), 1195–1200. DOI 10.1016/j.ijbiomac.2012.04.003. [Google Scholar] [CrossRef]
48. Lertsutthiwong, P., How, N. C., Chandrkrachang, S., Stevens, W. F. (2002). Effect of chemical treatment on the characteristics of shrimp chitosan. Journal of Metals, Materials and Minerals, 12(1), 11–18. [Google Scholar]
49. Kaya, M., Baran, T., Saman, I., Asan Ozusaglam, M., Cakmak, Y. S. et al. (2014). Physicochemical characterisation of chitin and chitosan obtained from resting eggs of Ceriodaphnia Quadrangula (Branchiopoda: Cladocera: Daphniidae). Journal of Crustacean Biology, 34(2), 283–288. DOI 10.1163/1937240X-00002221. [Google Scholar] [CrossRef]
50. Antonino, R. S. C. M. D. Q., Fook, B. R. P. L., Lima, V. A. D. O., Rached, R. Í. D. F., Lima, E. P. N. et al. (2017). Preparation and characterisation of chitosan obtained from shells of shrimp (Litopenaeus vannamei Boone). Marine Drugs, 15(5), 141. DOI 10.3390/md15050141. [Google Scholar] [CrossRef]
51. Hazarika, S. N., Gupta, K., Ahmed, N., Shamin, M. (2017). Green synthesis of silver nanoparticle and silverbased chitosan bionanocomposite using stem extract of Saccharum officinarum and assessment of its antibacterial activity. Advance in Nature Science: Nanoscience Nanotechnology, 8(3), 035019. DOI 10.1088/2043-6254/aa7232. [Google Scholar] [CrossRef]
52. Laaraibi, A., Moughaoui, F., Damiri, F., Ouakit, A., Charhouf, I. et al. (2018). Chitosan-clay based (CS-NaBNT) biodegradable nanocomposite films for potential utility in food and environment. In: Chitin-chitosan: Myriad functionalities in science and technology, pp. 46–69. London: IntechOpen. DOI 10.5772/intechopen.76498. [Google Scholar] [CrossRef]
53. Gbenebor, O. P., Adeosun, S. O., Adegbite, A. A., Akinwande, C. (2018). Organic and mineral acid demineralisations: Effects on crangon and Liocarcinus vernalis–sourced biopolymer yield and properties. Journal of Taibah University for Science, 12(6), 837–845. DOI 10.1080/16583655.2018.1525845. [Google Scholar] [CrossRef]
54. Kamba, A. S., Ismail, M., Tengku Ibrahim, T. A., Zakaria, Z. A. B. (2013). Synthesis and characterisation of calcium carbonate aragonite nanocrystals from cockle shell powder (Anadara granosa). Journal of Nanomaterials, 2013, 1–9. DOI 10.1155/2013/398357. [Google Scholar] [CrossRef]
55. Kumirska, J., Czerwicka, M., Kaczynski, Z., Bychowska, A., Brzozowski, K. et al. (2010). Application of spectroscopic methods for structural analysis of chitin and chitosan. Marine Drugs, 8(5), 1567–1636. DOI 10.3390/md8051567. [Google Scholar] [CrossRef]
56. Singh, A., Benjakul, S., Prodpran, T. (2019). Ultrasound-assisted extraction of chitosan from squid pen: Molecular characterization and fat binding capacity. Journal of Food Science, 84(2), 224–234. DOI 10.1111/1750-3841.14439. [Google Scholar] [CrossRef]
57. Abolghassem, S., Molaei, S., Javanshir, S. (2019). Preparation of α-chitin-based nanocomposite as an effective biocatalyst for microwave aided domino reaction. Heliyon, 5(7), e02036. DOI 10.1016/j.heliyon.2019.e02036. [Google Scholar] [CrossRef]
58. Mohan, K., Muralisankar, T., Jayakumar, R., Rajeevgandhi, C. (2021). A study on structural comparisons of α-chitin extracted from marine crustacean shell waste. Carbohydrate Polymer Technologies and Applications, 2, 100037. DOI 10.1016/j.carpta.2021.100037. [Google Scholar] [CrossRef]
59. Si Trung, T., Bao, H. N. D. (2015). Physicochemical properties and antioxidant activity of chitin and chitosan prepared from Pacific White Shrimp waste. International Journal of Carbohydrate Chemistry, 2015(1), 1–6. DOI 10.1155/2015/706259. [Google Scholar] [CrossRef]
60. Abdou, E. S., Nagy, K. S. A., Elsabee, M. Z. (2008). Extraction and characterization of chitin and chitosan from local sources. Bioresource Technology, 99(5), 1359–1367. DOI 10.1016/j.biortech.2007.01.051. [Google Scholar] [CrossRef]
61. Zhang, M., Haga, A., Sekiguchi, H., Hirano, S. (2000). Structure of insect chitin isolated from beetle larva cuticle and silkworm (Bombyx mori) pupa exuvia. International Journal of Biological Macromolecules, 27(1), 99–105. DOI 10.1016/S0141-8130(99)00123-3. [Google Scholar] [CrossRef]
Cite This Article
 Copyright © 2023 The Author(s). Published by Tech Science Press.
This work is licensed under a Creative Commons Attribution 4.0 International License , which permits unrestricted use, distribution, and reproduction in any medium, provided the original work is properly cited.
 Downloads
 Citation Tools