| Journal of Renewable Materials |
DOI: 10.32604/jrm.2022.018607
ARTICLE
Fluidity Influencing Factor Analysis and Ratio Optimization of New Filling Slurry Based on the Response Surface Method
State Key Laboratory of Mining Response and Disaster Prevention and Control in Deep Coal Mines, Anhui University of Science and Technology, Huainan, 232001, China
*Corresponding Author: Xinzhu Hua. Email: ah1999hn@126.com
Received: 05 August 2021; Accepted: 19 August 2021
Abstract: The filling mining method is important in realizing the green mining of mineral resources. Aiming at the problems of land resource occupation, environmental pollution, and rational utilization of coal-based solid wastes such as coal gangue, fly ash, and desulfurization gypsum, a new paste filling material was developed with coal gangue, fly ash, and desulfurization gypsum as raw materials. The microstructure of the raw materials was analyzed by XRD and SEM. Combined with the Box-Behnken experimental design, the effect of each component on the fluidity of the filling slurry was analyzed through the response surface analysis. The significance of each component on its bleeding and fluidity was determined, and the optimal ratio of the filling slurry was obtained. Experimental results show that the microcosmic morphology of coal gangue, desulfurization gypsum, and gasification slag presents an irregular block and rough particle surface; the microcosmic morphology of fly ash and bottom slag presents first out spherical or quasi spherical particles. Moreover, obvious sintering traces exist on the surface of the bottom slag. The main crystal mineral of coal gangue and fly ash is SiO2, the desulfurization gypsum is composed of Ca(SO4) (H2O) and Ca(CO3) crystal minerals, the gasification slag is composed of carbon and nitrogen compounds, and the main crystal mineral components in the bottom slag sample are SiO2 and AlxSiyOz compounds. The order of significance of each key factor on slurry fluidity is as follows: C (desulfurization gypsum) > D (gasification slag and bottom slag 1:1) > A (coal gangue) > B (fly ash). The order of the significance of each key factor on slurry bleeding is as follows: B (fly ash) > C (desulfurization gypsum) > D (gasification slag and bottom slag 1:1) > A (coal gangue). Considering the material preparation, field application, and other conditions, the mass percentage of each factor content of the new paste filling material is as follows: 49.5% coal gangue, 8.3% fly ash, 4.1% desulfurization gypsum, 6.2% gasification slag, and 6.2% bottom slag.
Keywords: Coal-based solid waste; filling slurry; flowability; proportion optimization; response surface method
Coal resources, as one of the main energy sources in China, play an irreplaceable role in China’s energy consumption structure. With the rapid development of the national economy, the demand for coal resources remains high. The process of coal resource mining and processing anticipates the production of a large number of solid wastes such as coal gangue, fly ash, desulfurization gypsum, gasification slag, and bottom slag. With the continuous improvement of national requirements for environmental protection and green mining, the problem of rational utilization of coal-based solid wastes requires urgent solutions [1−3]. Among the several mining methods, the filling mining method not only can consume a lot of solid wastes and reduce land occupation and pollution but also support the overlying roof of goaf and prevent surface subsidence to protect the ecological environment and make reasonable use of solid wastes [4–6]. Different filling materials and material ratios have a strong influence on the filling effect and filling cost [7–9].
Accordingly, experts and scholars have conducted substantial research on filling mining materials. In terms of utilization of solid waste: Zhang et al. [10,11] used the uniform test method to carry out the proportioning test of coal gangue, fly ash, and other mine solid wastes and examined the optimal proportioning and hydration reaction mechanism of paste filling materials. Yang et al. [12] studied the influence of slurry concentration and suspending agent on the performance of coal gangue-fly ash cemented filling material through the response surface method and established the prediction model of slump, segregation rate, and bleeding rate of coal gangue-fly ash slurry. Dai et al. [13] tested the optimum mix ratio of unclassified tailings on the basis of Box-Behnken, and the best mix ratio of cement slurry filling was obtained. Ren et al. [14] studied the mechanical activation law of steel slag sludge by XRD and FT-IR and developed a new solid waste filling material. Shi et al. [15] studied the influence of different mixing ratios of fly ash and carbide slag on the physical and mechanical properties of high water filling materials. Feng et al. [16] studied the influence of waste concrete fine and coarse aggregates on the flow performance and mechanical properties of filling materials and obtained the optimal proportion of gangue-waste concrete cemented filling materials through the response surface analysis.
In terms of filling material properties: Chen et al. [17] selected different activators and activation methods to investigate the properties of paste and high water filling materials. Guo et al. [18] obtained the bacillus pasteurii with special resistance by strain domestication and proposed a CG-based bio-mineralized underground backfilling material without using cement. Wang et al. [19] studied the hydration mechanism of the new paste filling materials by XRD and SEM and revealed the types of hydration products and microstructure of the filling materials with different ages. In the work of Qin Yaguang et al. [20], the effects of air entraining agent and curing time on the physical properties, pore structure, and AC impedance properties of filling materials were studied on the bases of high-density filling materials. Rong et al. [21] examined the properties of hemihydrate phosphogypsum-based filling materials and considered the feasibility of replacing cement with hemihydrate phosphogypsum as cementing material. Lan et al. [22,23] studied the influence of admixture dosage on the filling performance of the compound condensed water expansion filling material and proposed a new controllable low strength filling material. Xiao et al. [24] used the particle flow numerical simulation software to study the influence of particle size distribution and loading rate on the compaction characteristics and lateral pressure coefficient of broken gangue during the filling process. Yin et al. [25] studied the hydration heat release rate and heat release of filling materials and analyzed the variation characteristics of each stage of the hydration dynamic process.
Previous scholars have conducted substantial research on the development and application of filling materials and achieved fruitful results. The fluidity of filling slurry determines its difficulty in pipeline transportation and filling effect. In the above research results, the composition of filling materials is relatively single, and few reports are available on the research of coal gangue, fly ash, desulfurization gypsum, gasification slag, and furnace bottom slag. Therefore, on the basis of the analysis of the material composition and microstructure on the fluidity of filling slurry of filling materials by XRD and SEM, through the Box-Behnken experimental design, the response surface analysis method was used to analyze the significance of each component of multi-source coal-based solid waste filling slurry on its bleeding and fluidity, and the optimal ratio of filling slurry was obtained.
The raw materials used in the experiment include coal gangue, fly ash, desulfurization gypsum, gasification slag, and bottom slag. As shown in Fig. 1, ordinary portland cement (32.5) with 5% of the total dry material is added to each group of materials as cementitious material. After mixing with the raw materials according to the proportion scheme, the appropriate amount of tap water is added to prepare the filling slurry with a mass concentration of 78%.
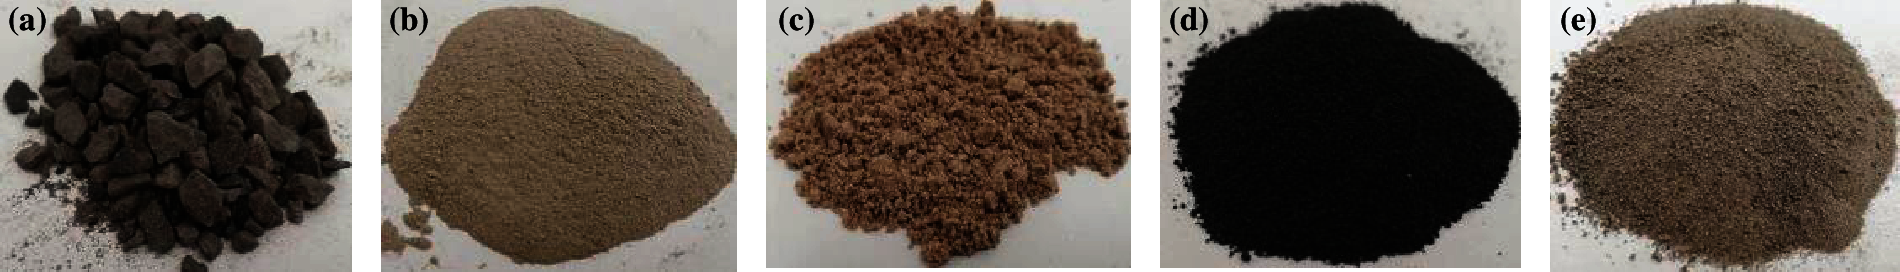
Figure 1: Experimental materials: (a) coal gangue (b) fly ash (c) desulfurization gypsum (d) gasification slag (e) bottom slag
2.2 Multi-Factor Experiment Scheme
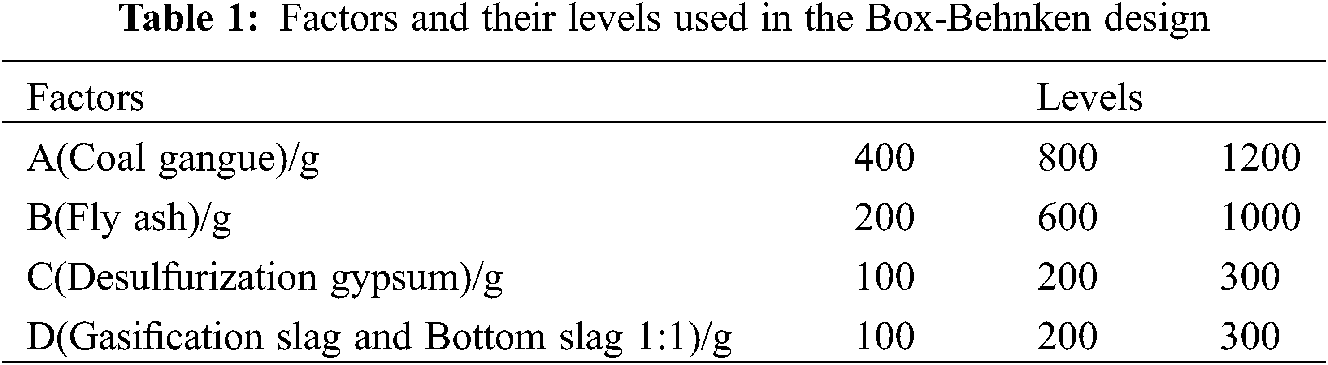
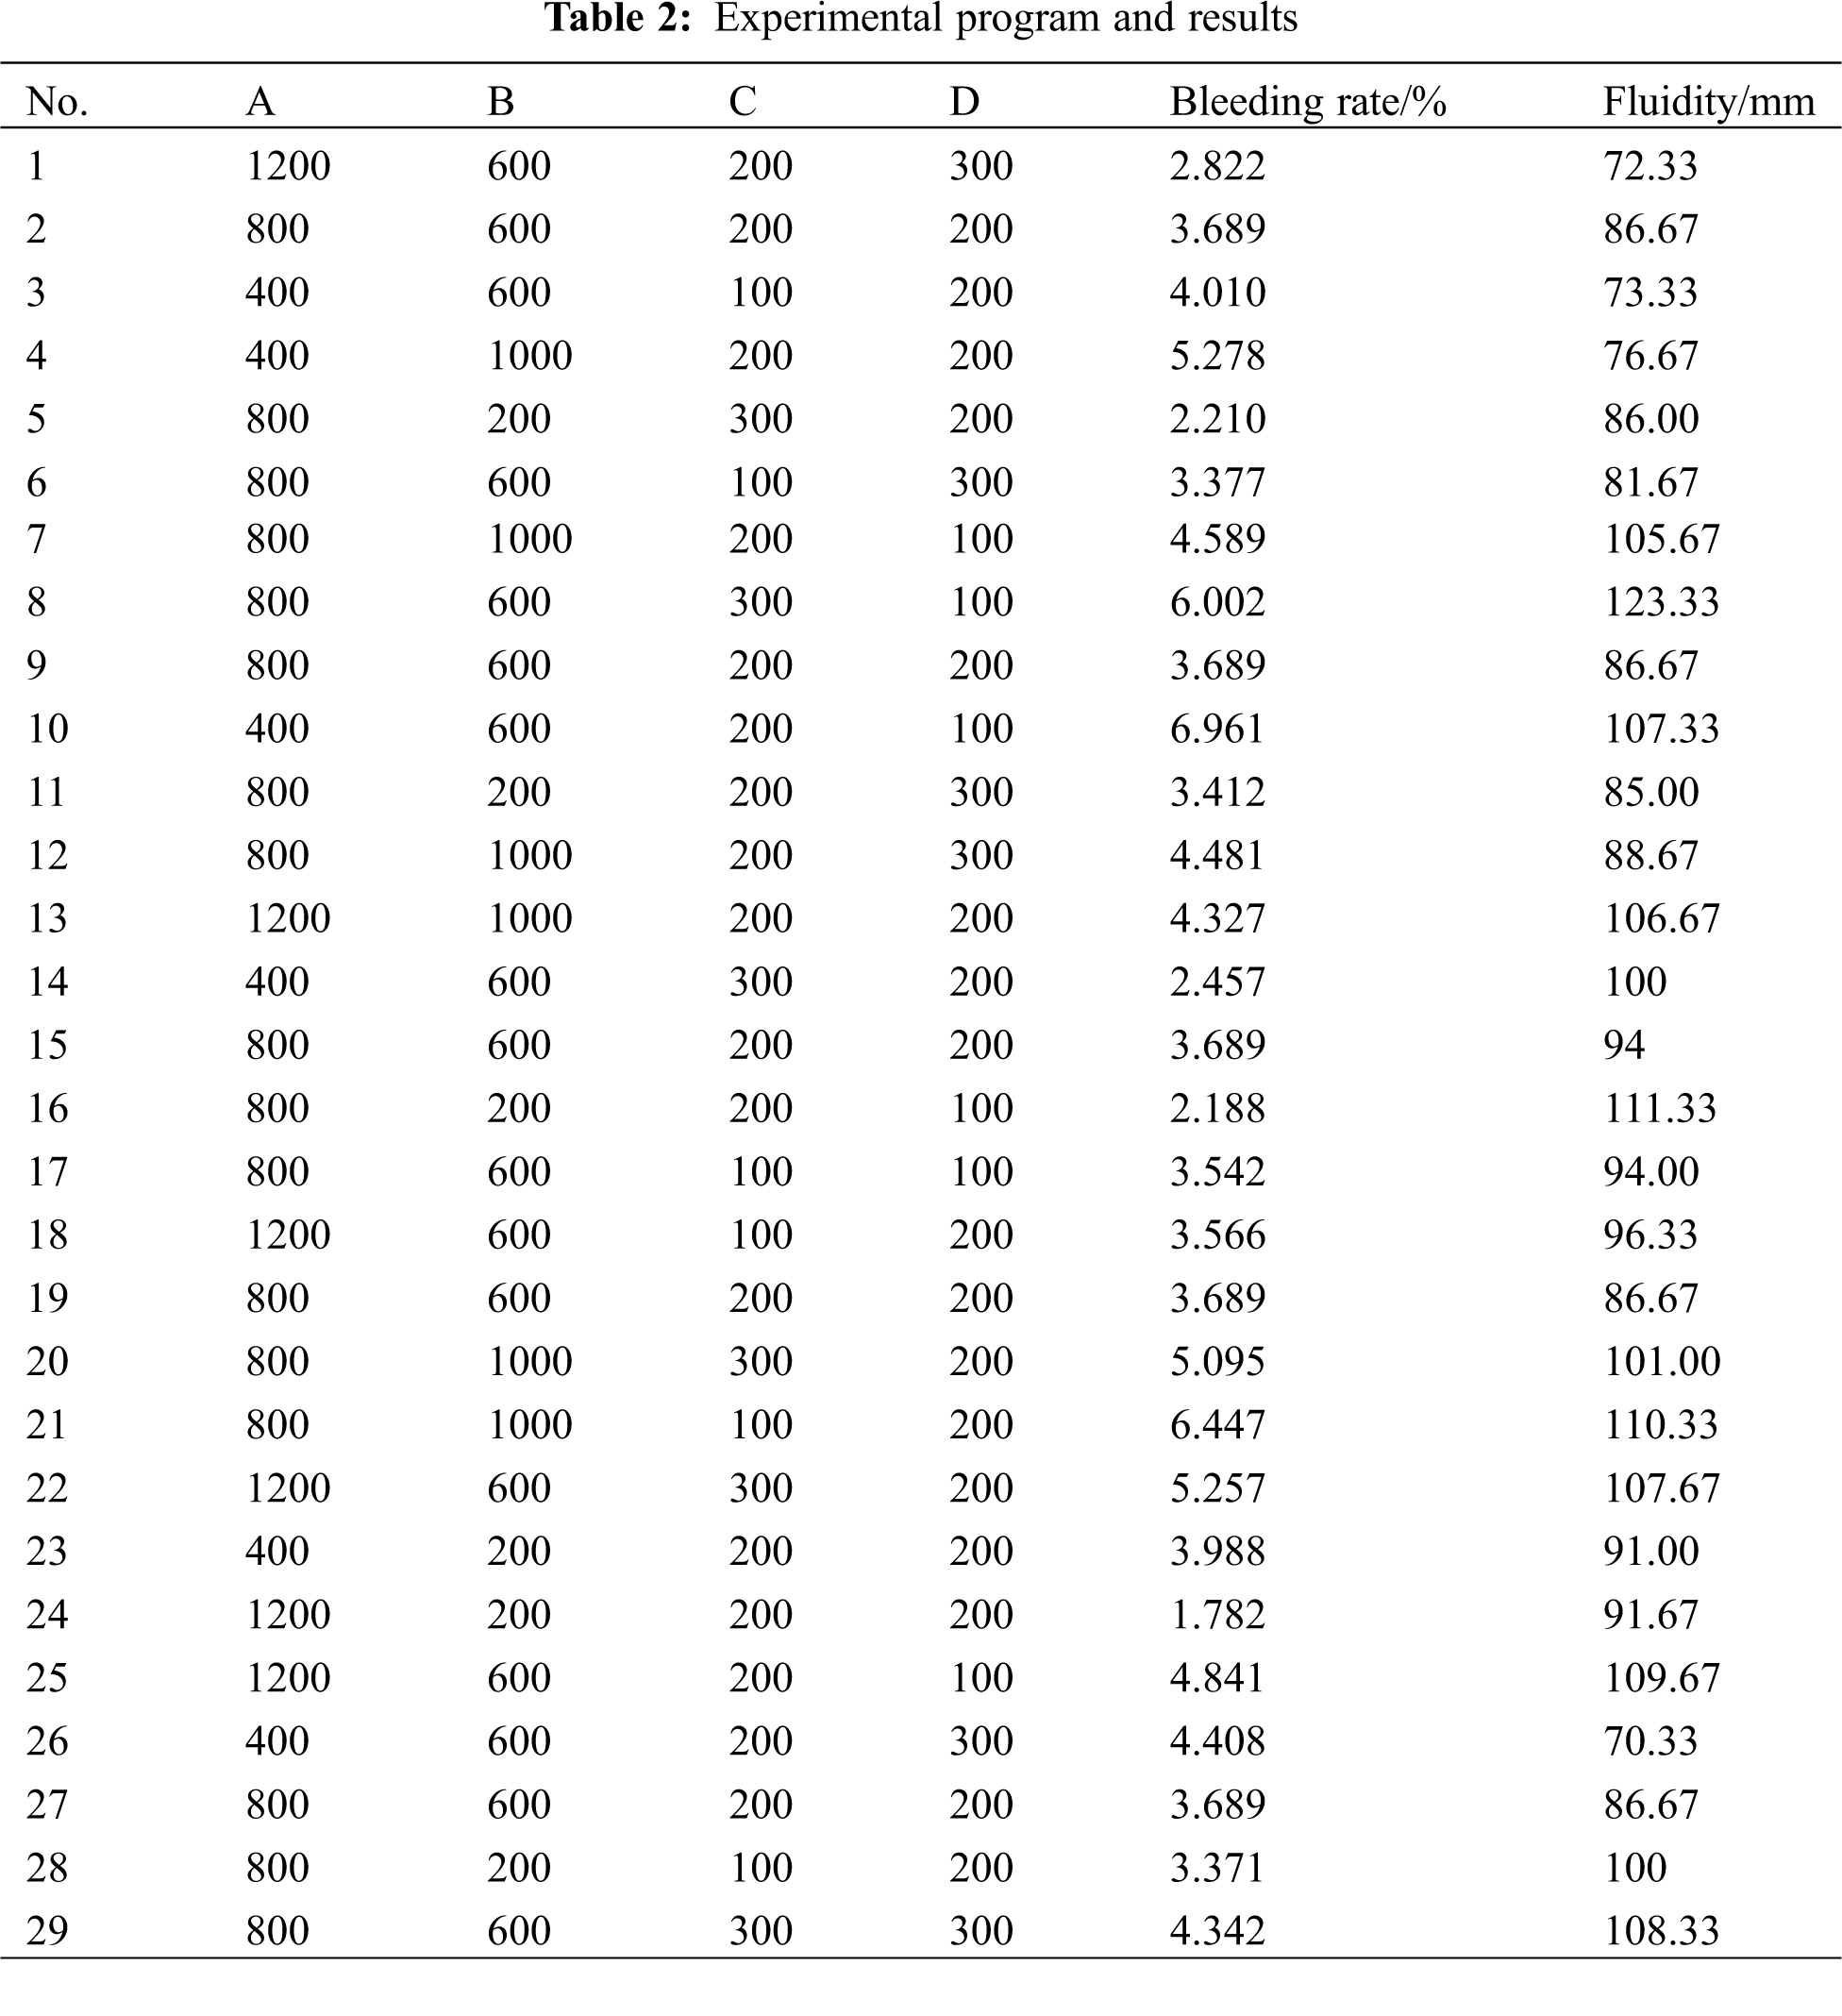
Five experimental materials were coal gangue, fly ash, desulfurization gypsum, gasification slag, and bottom slag. In the experiment, the trigeminy die (70.07 × 70.07 × 70.07) is used to make the test block. The bulk density of the mixed raw material is 1.6 t/m3. Thus, the total mass of slurry is 2,195 g, the ratios of 5 raw materials to total mass in the experiment are 20%, 40% and 60%, respectively. According to the bleeding characteristics of gasification slag and bottom slag, the mixture of gasification slag and bottom slag in the ratio of 1:1 is used as a factor in the experiment to obtain the experimental raw materials. Table 1 shows the experimental factors and levels. The Box-Behnken of Design Expert experiment design is applied to design 29 groups of experimental schemes with four factors and three levels. Table 2 shows the experimental results.
(1) Fluidity test
The mixed slurry is put into the pure slurry fluidity test mold, the upper surface of the test mold is scraped with a spade, the fluidity test mold is vertically lifted, and it is allowed to stand for 5 min. When the slurry does not diffuse, the expanded diameter of the slurry is measured with a steel ruler. During the measurement, the slurry diffusion diameter is measured in different directions, and their average value is taken as the measured value. The three experimental results of 29 groups of experiments are taken as representatives to show the experimental process (see Fig. 2).
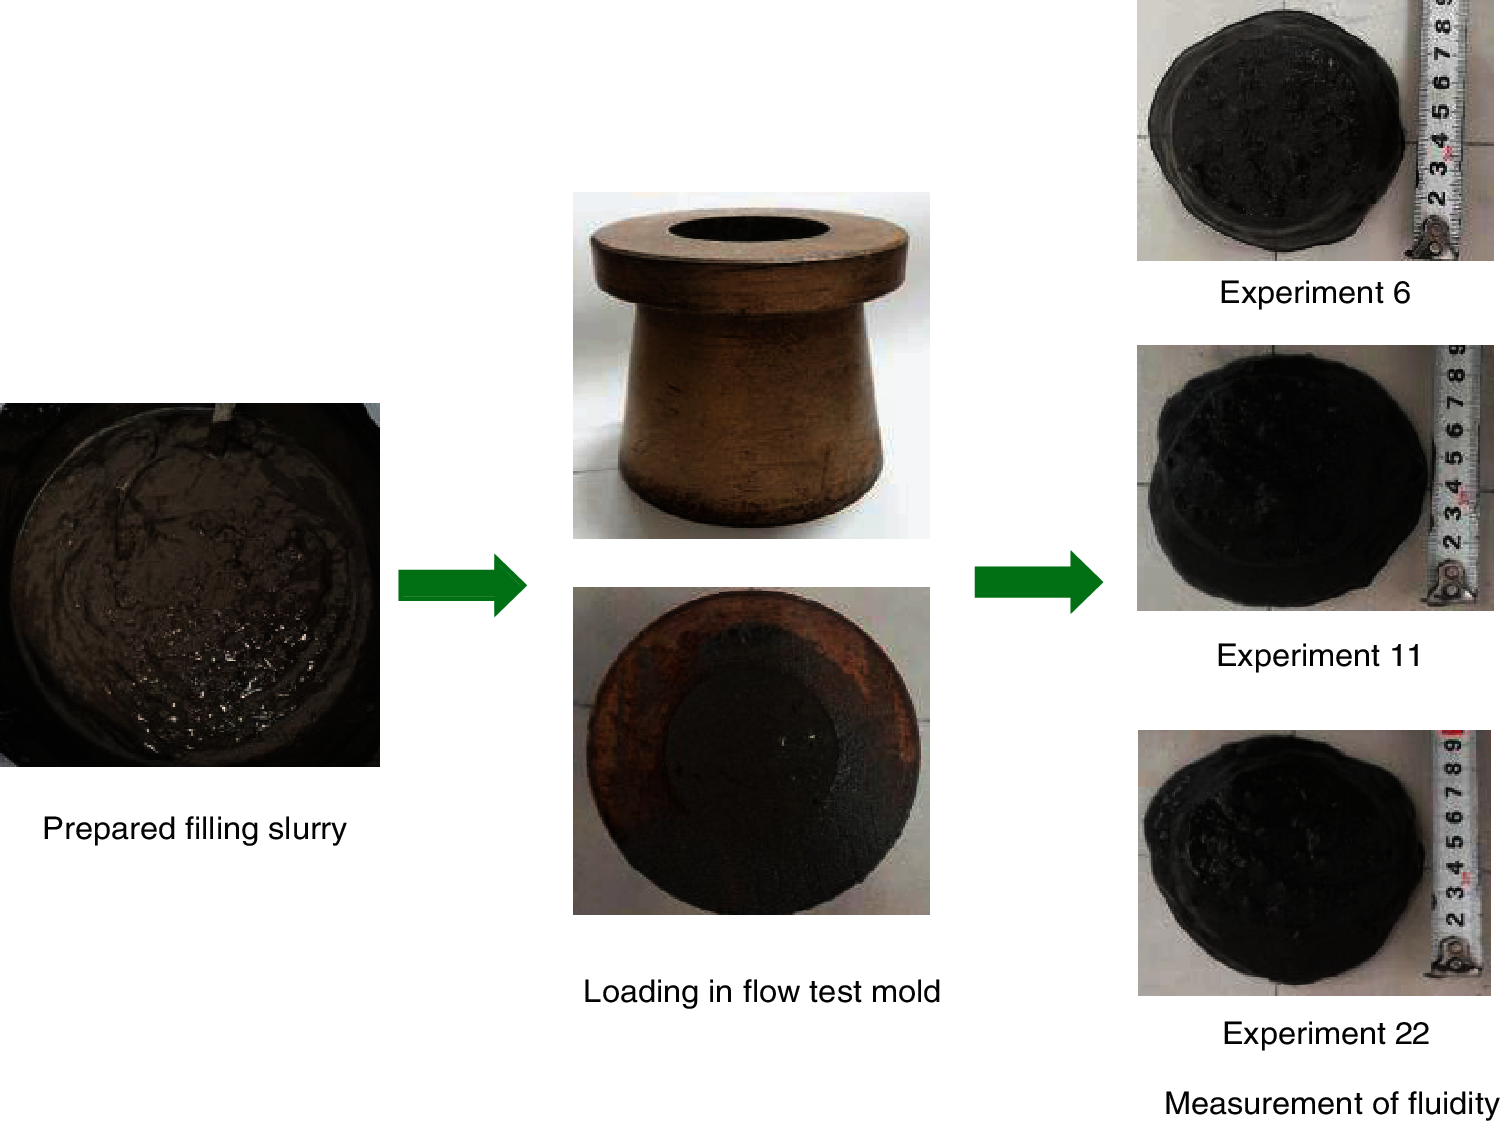
Figure 2: Fluidity test of filling slurry
(2) Bleeding rate test
The stirred filling slurry is poured into the measuring cylinder, and the inlet of the measuring cylinder is wrapped with a preservative film to prevent water evaporation. The five experimental results in the experiment are taken as the display as shown in Fig. 3 and horizontally left standing for 24 h. The total volume of slurry Vt and the volume of material Vm are read in the measuring cylinder for several times, their average value is taken as the measured value, and the bleeding rate B is calculated according to formula (1):
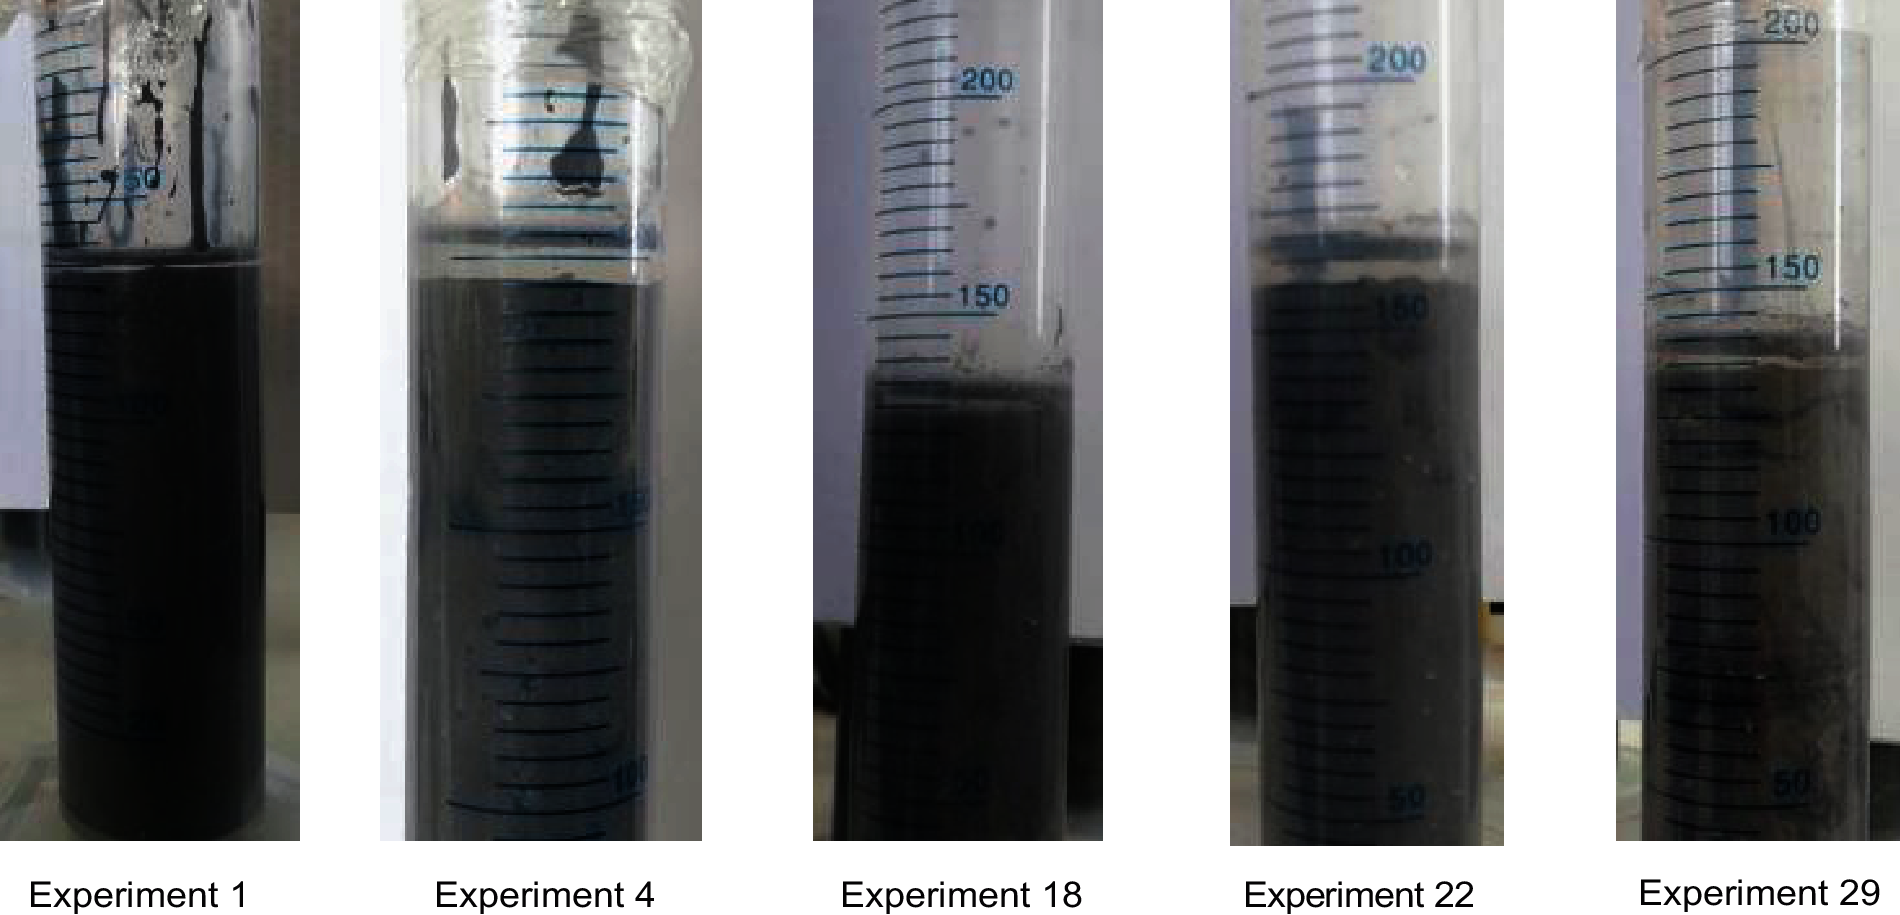
Figure 3: Test of the bleeding rate of filling slurry
3 Analysis of Microstructure and Composition of Filling Raw Materials
3.1 Microstructure of Raw Materials
The plastic viscosity of cement paste is related to the shape, size, and size distribution of particles in the paste system [26]. In view of the influence of raw material particle morphology on the bleeding and fluidity of filling slurry, the micro morphology of the experimental raw material was analyzed by SEM. Fig. 4 shows the test results. From Fig. 4, the micro morphology of coal gangue is observed to present an irregular morphology such as block and flake, which is relatively stable under static condition and is not conducive to flow. The micro morphology of gasification slag is regular, and the stable spherical particles are beneficial to its own flow. The micro morphology of desulfurization gypsum is irregular in size. The micro morphology of gasification slag is not uniform, and the surface is rough and irregular. The micro morphology of the bottom slag is irregular and massive. The trace of the surface after sintering is obvious, and the surface is smooth with small holes. This quality is not conducive to its own flow and has poor water absorption. The micro morphology of cement is an irregular block with rough surface.
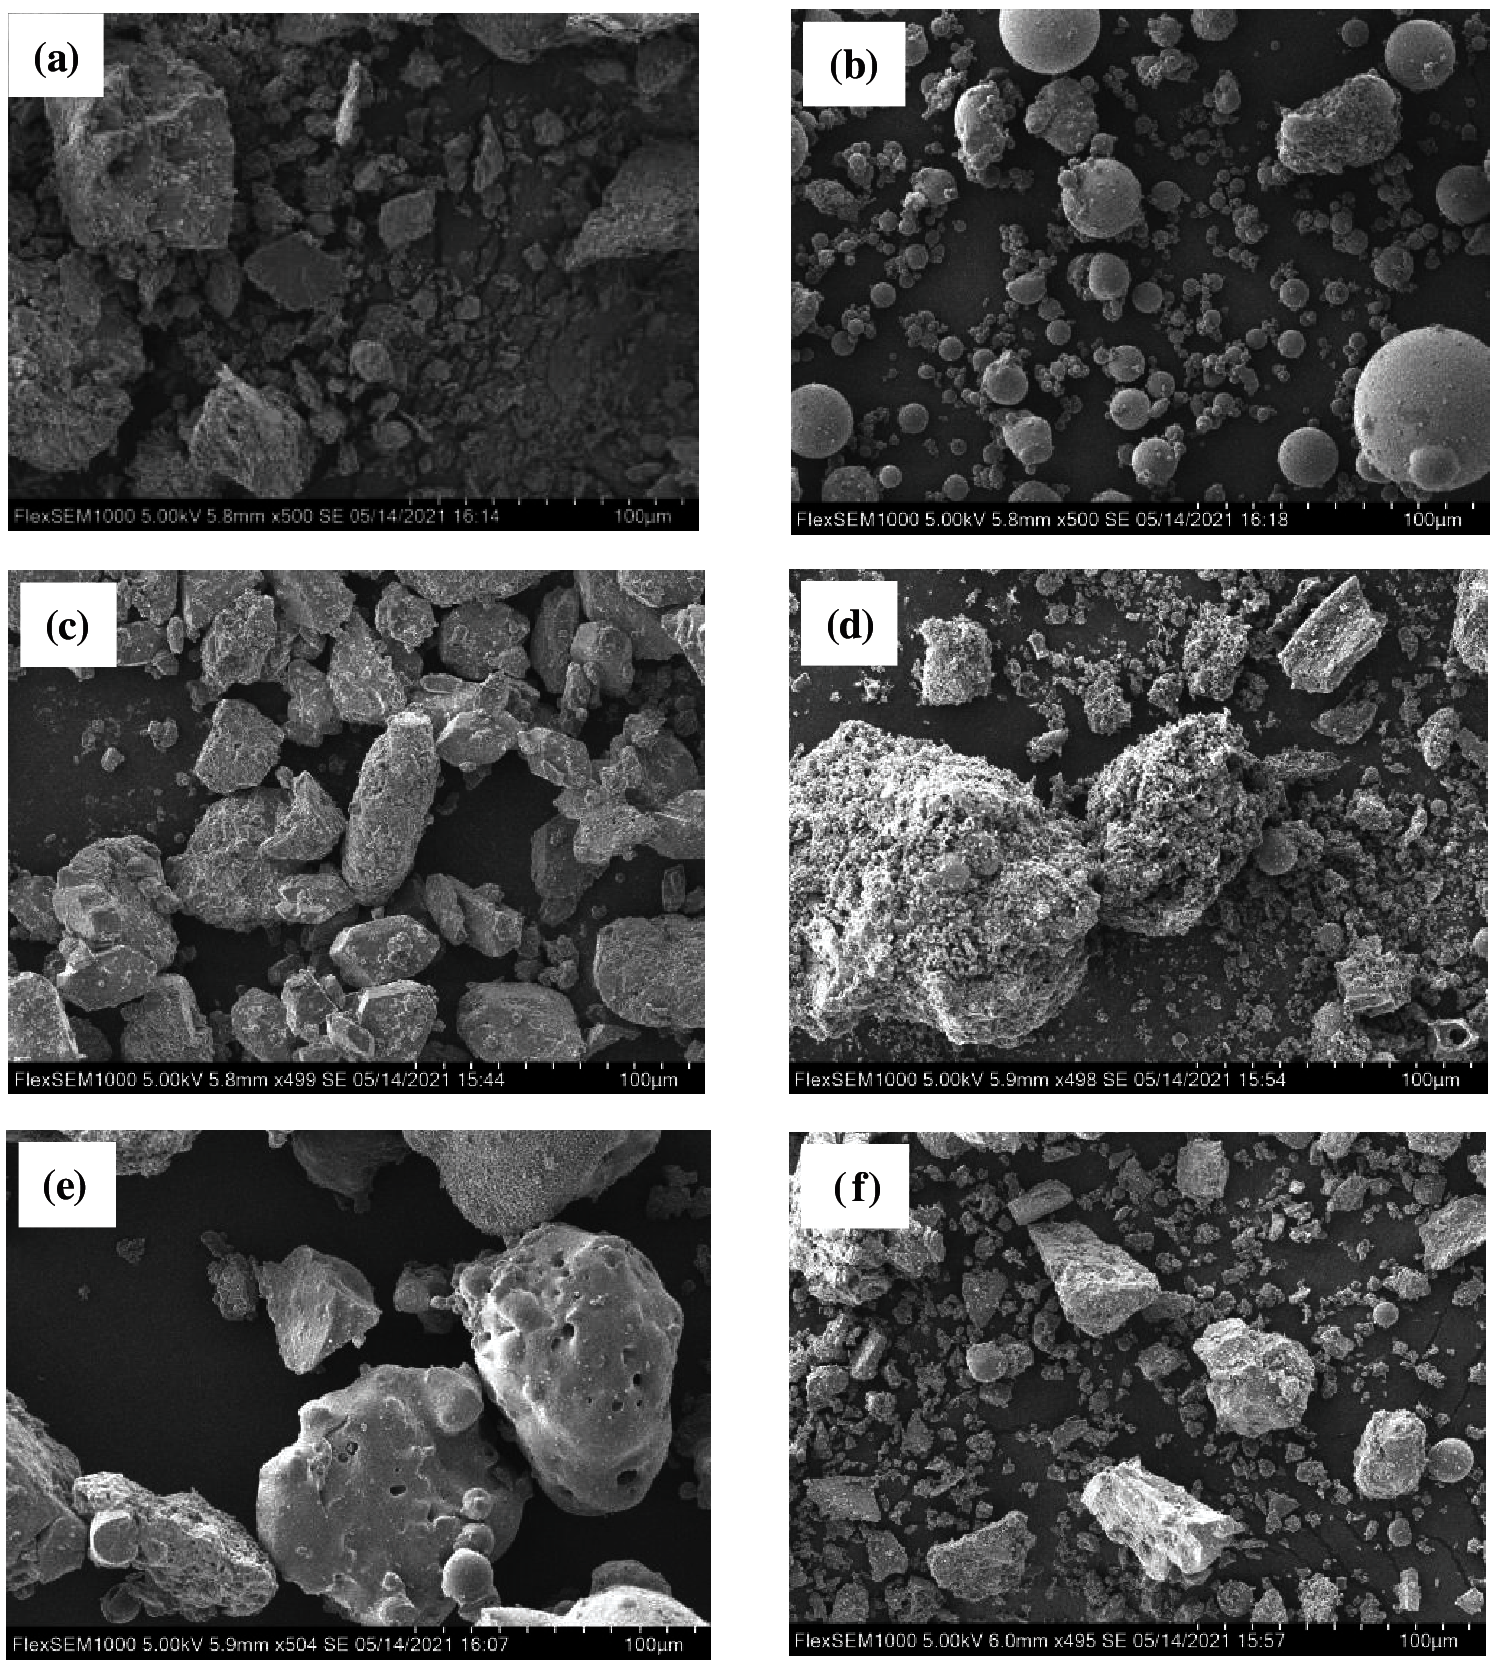
Figure 4: Micro particle state of experimental materials: (a) coal gangue (b) fly ash (c) desulfurization gypsum (d) gasification slag (e) bottom slag (f) cement
According to the SEM micro morphology of each component, the micro particle size of coal gangue and bottom slag is large, the micro particle size of desulfurization gypsum is moderate, and the particle size distribution is relatively uniform; the micro particle size of fly ash and cement is small, and the distribution is relatively uniform; and the particle size distribution of gasification slag is uneven; The interaction between different micro particles will form additional pores, and the pore characteristics of the microstructure will affect the fluidity of filling slurry [27]. After sufficient mixing of the filling material, interaction is expected between particles, which will promote the smaller particles to enter the larger pores and increase the bulk density of the mixture. Specifically, spherical particles are also limited by larger particles and cannot diffuse outward, which reduces the fluidity of filling slurry.
3.2 Composition of Raw Material
XRD was used to analyze the composition of the experimental materials. Fig. 5 shows the test results. From Fig. 5, the diffraction peaks at different angles are observed to be clear and not disordered, indicating less content of amorphous substances in raw material samples.
Apparently, the maximum diffraction peak appears between 20°–30° in the diffraction pattern of coal gangue sample. It shows that the main crystal mineral composition of coal gangue is SiO2. It contains a small amount of crystal minerals, namely, Al2Si2O5(OH)4.
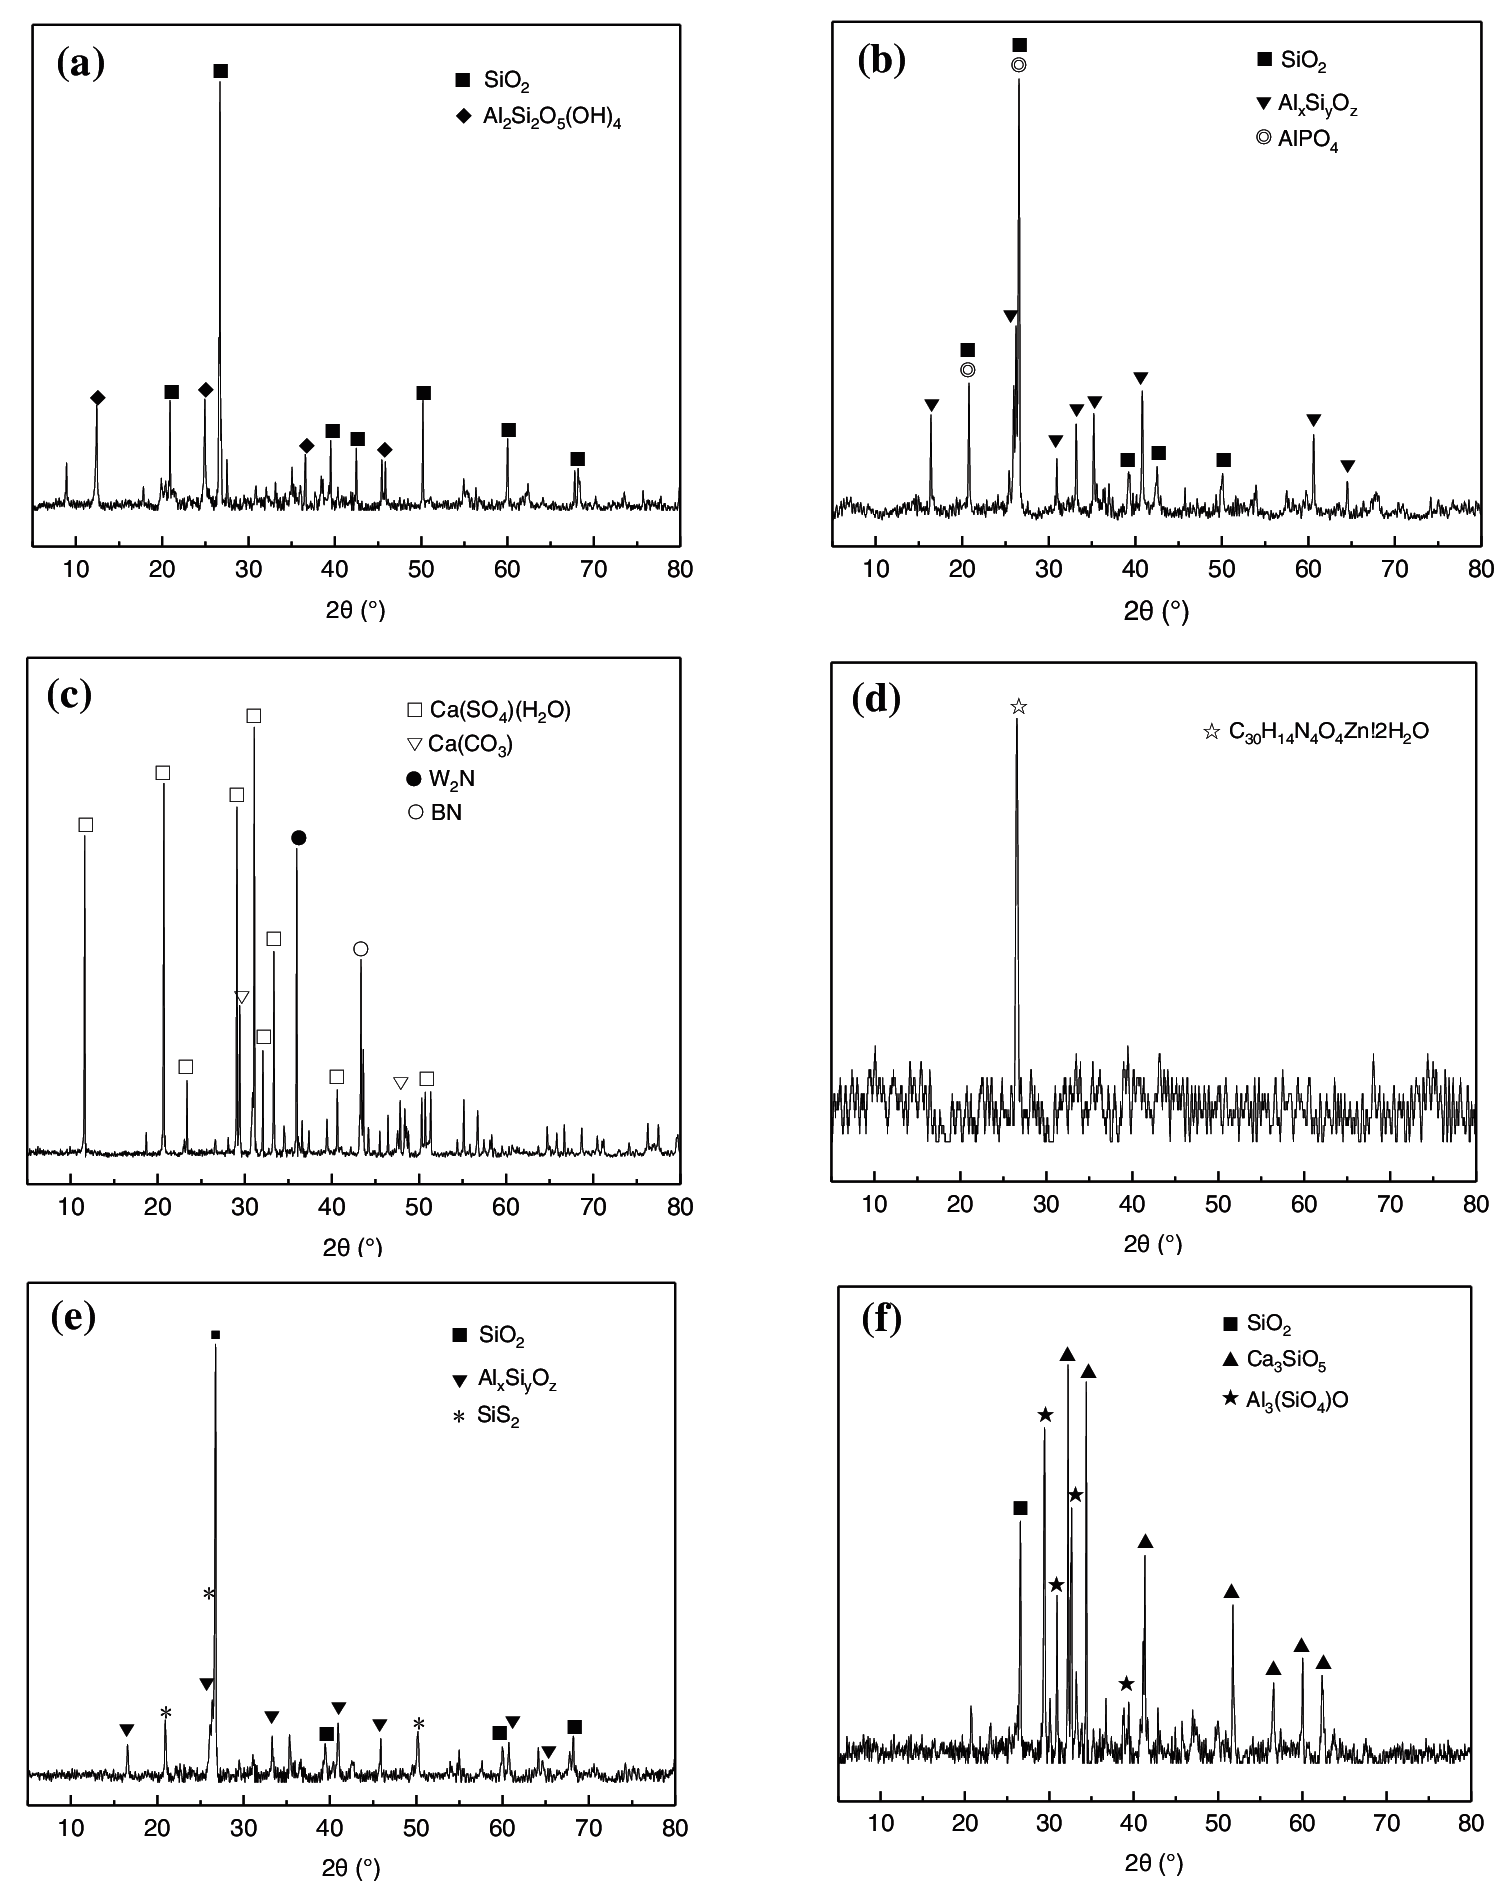
Figure 5: Composition of experimental materials: (a) coal gangue (b) fly ash (c) desulfurization gypsum (d) gasification slag (e) bottom slag (f) cement
Apparently, the maximum diffraction peak appears between 20°–30° in the diffraction pattern of coal gangue sample. It shows that the main crystal mineral composition of coal gangue is SiO2. It contains a small amount of crystal minerals, namely, Al2Si2O5(OH)4. The maximum diffraction peak appears between 20°–30° in the diffraction pattern of fly ash sample. Thus, the main crystal mineral composition of coal gangue is SiO2. It contains a small amount of compounds, namely, AlxSiyOz. Many diffraction peaks appear between 15°–50° in the diffraction pattern of the desulfurization gypsum sample. It shows that the main crystal mineral compositions of the desulfurization gypsum are Ca(SO4)(H2O) and Ca(CO3). Other components have less content. The maximum diffraction peak appears between 25°–30° in the diffraction pattern of the gasification slag sample. It shows that the crystal mineral composition in the sample of gasification slag is single, and the main crystal mineral composition of gasification slag is C30H14N4O4Zn·2H2O. From the diffraction patterns of the bottom slag sample, the main crystal minerals are SiO2 and AlxSiyOz. It contains a small amount of crystal minerals, namely, SiS2. The main crystal mineral compositions of cement are Ca3SO5 and Al3(SiO4)O. It contains a small amount of crystal minerals, namely, SiO2.
4 Results and Analysis of the Orthogonal Experiment
According to the experimental scheme of the four factors and three levels designed by Box-Behnken, the fluidity and bleeding of the filling slurry were obtained. Table 2 shows the experimental results.
According to the experimental results of multiple factors, the Design-Expert software is used for the comprehensive analysis of multiple models. Table 3 shows the results, and Table 4 shows the R2 analysis. According to the analysis in Tables 3 and 4, the linear model recommended by the Design-Expert software has the smallest deviation and is significantly higher than the other models. Therefore, the linear model is used to analyze the bleeding of filling slurry under the influence of multiple factors.
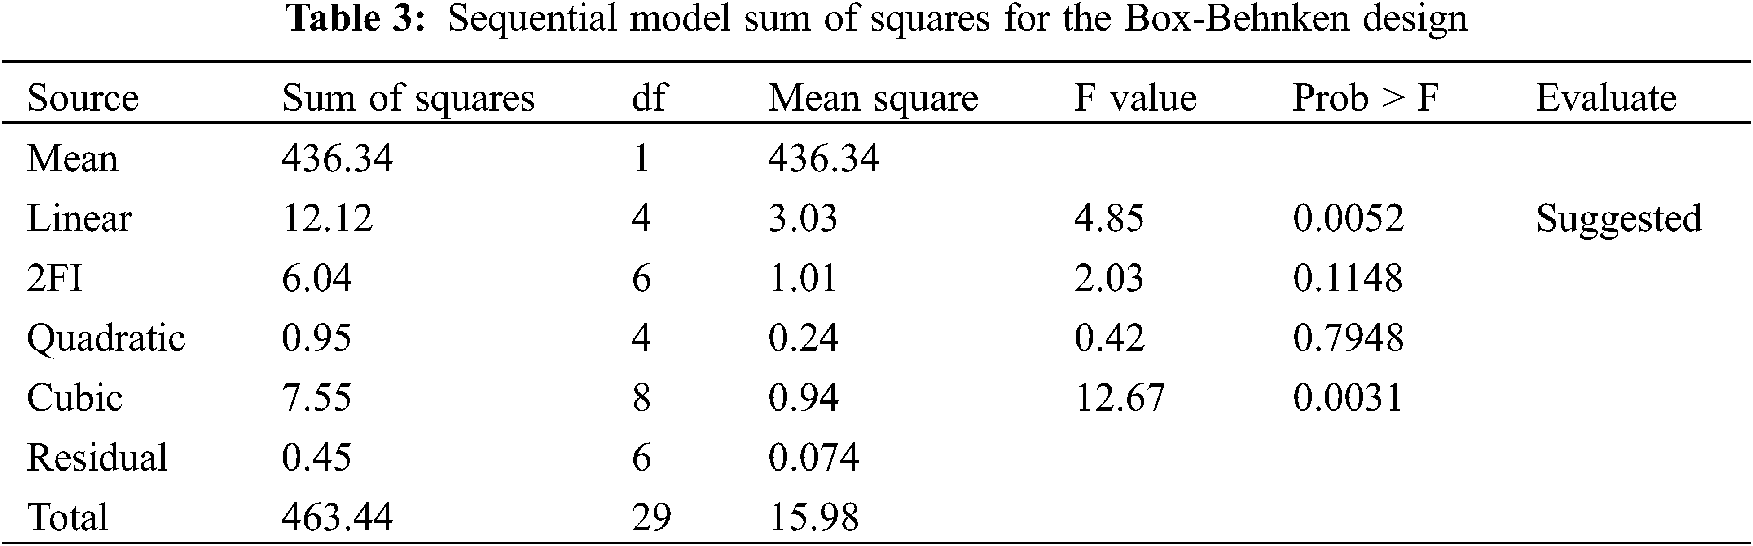
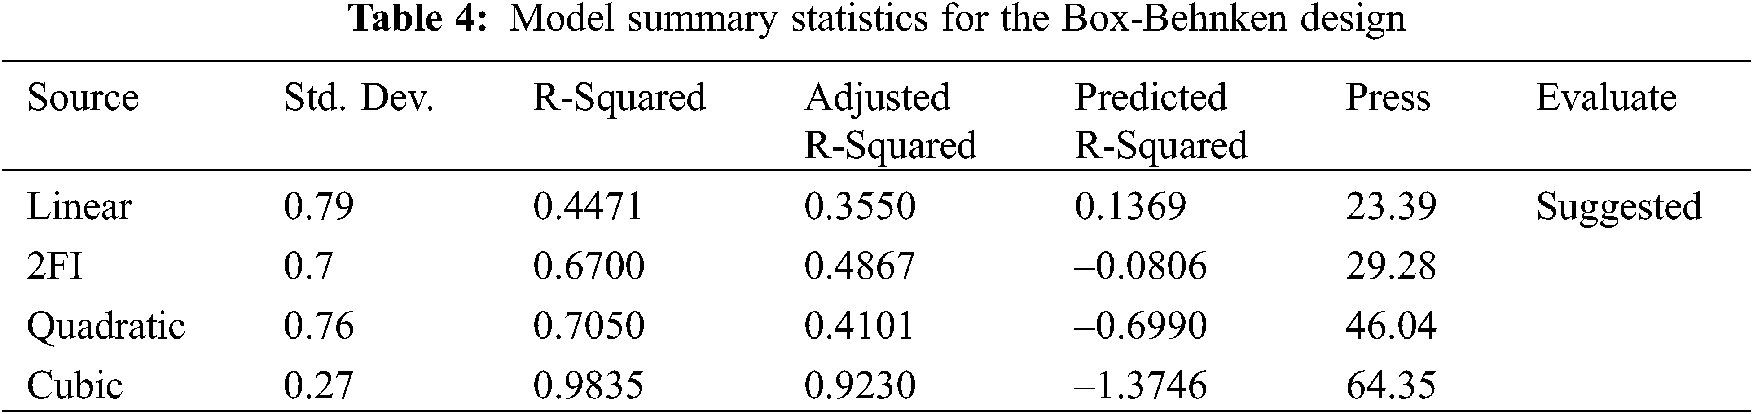
Fig. 6 shows the normal probability plot of residual, which is used to judge whether the observed values of the bleeding rate obtained from the experiment are reliable with the fitting degree of the model. From Fig. 6, the residual values are seen to be basically distributed on the same line, which shows that the fitting effect of the model is more accurate and reliable.
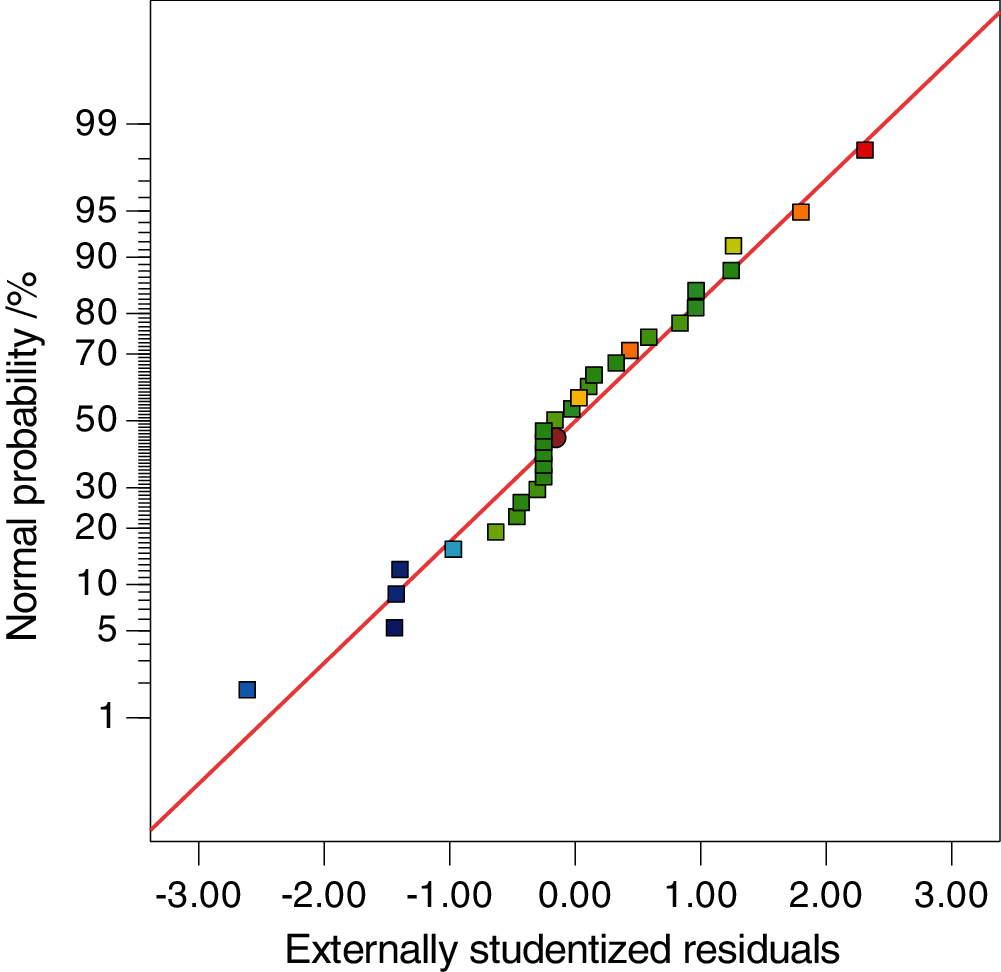
Figure 6: Normal probability plot of residual
According to the results of multi-factor experiment, Table 5 shows the results of the response surface linear model and analysis of variance of the bleeding rate. From Table 5, the F value of the model is 4.85, and the value of prob > F is less than 0.05. This finding indicates that the model has a good fit with the experimental data with a small experimental error.
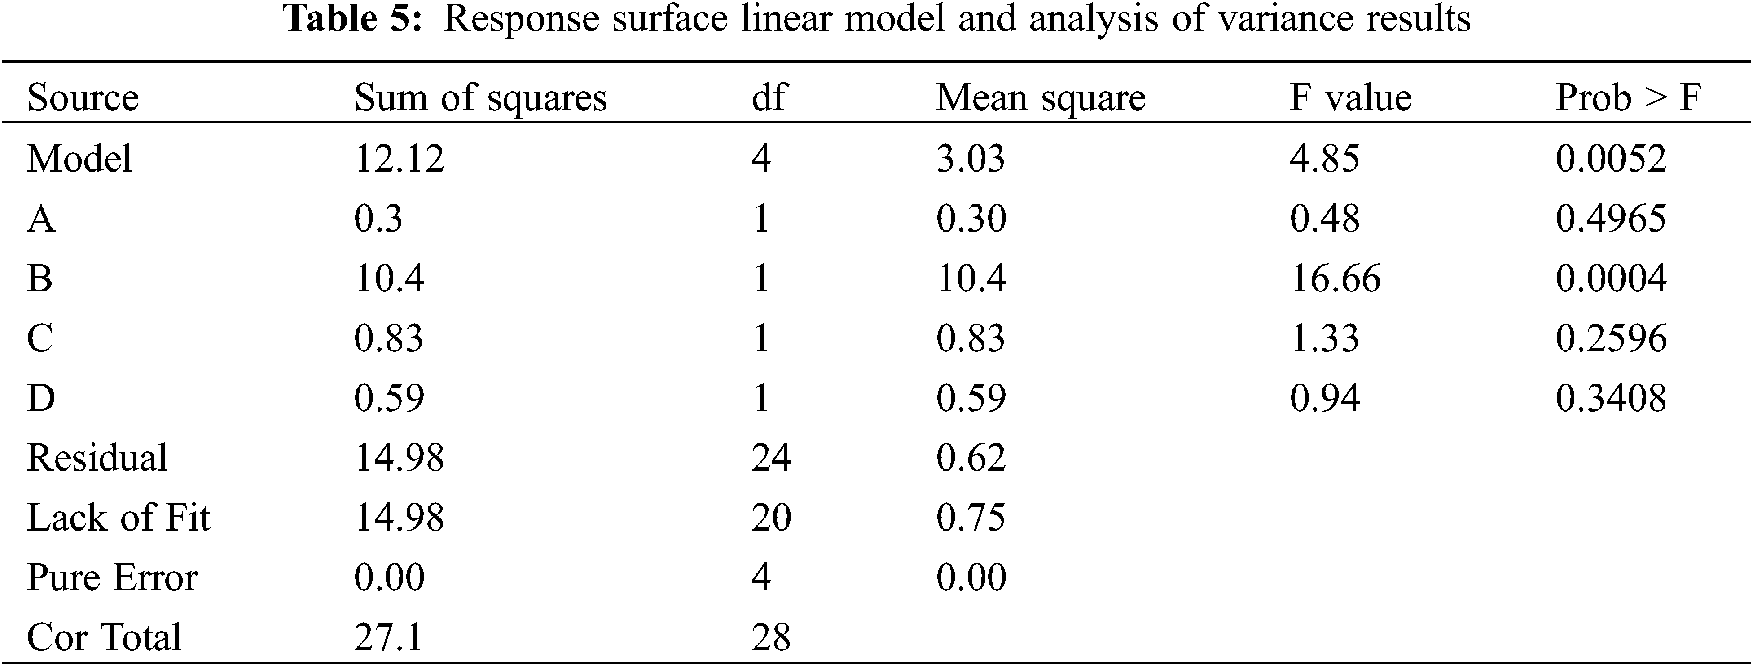
From the significance test, the order of significance of each factor is B (fly ash) > C (desulfurization gypsum) > D (reinforcement lag and bottom lag 1:1) > A (coal group). Among them, the P value of B (fly ash) factor is the smallest, which indicates that this index is the most significant, and the other three indexes are less significant.
Before analyzing the liquidity, a suitable model must be selected to fit the experimental results. First, the experimental results are input into the design software for model fitting analysis. Tables 6 and 7 present the statistical results of the multi-model comprehensive analysis. Apparently, adjR20.4377 of the linear model is less than 0.9433 of the cubic model, which indicates that the latter has a higher fitting degree and smaller deviation value. According to the analysis of the rack of fit in Table 7, the P value of the linear model is 0.0159, which is less than 0.5071 of the cubic model. This finding indicates a small proportion of abnormal error between the cubic model and the actual value, and it has a significant relationship with the regression equation.
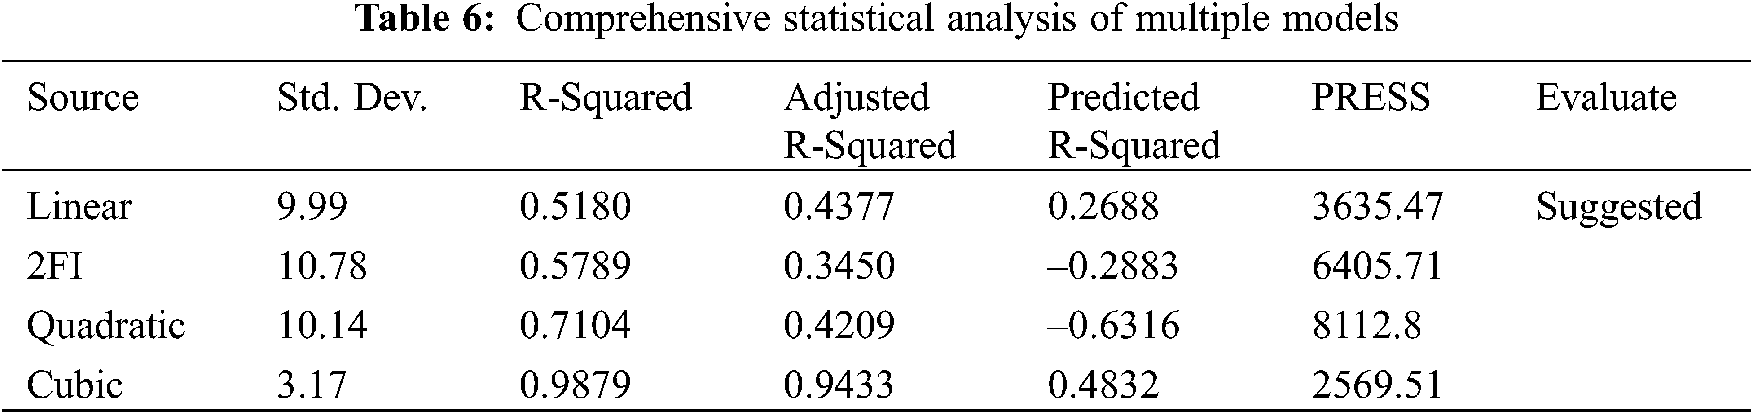
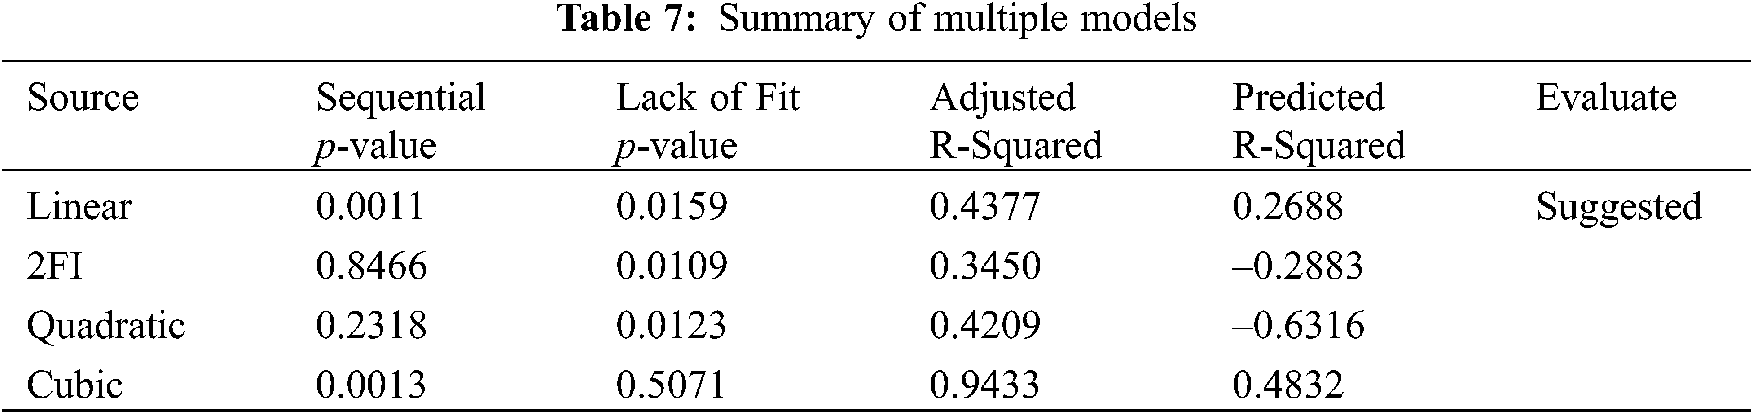
Fig. 7 shows the distribution of the residual and predicted values. The distribution of the numerical points in Fig. 7 is scattered and irregular, indicating that the model selected is more significant.
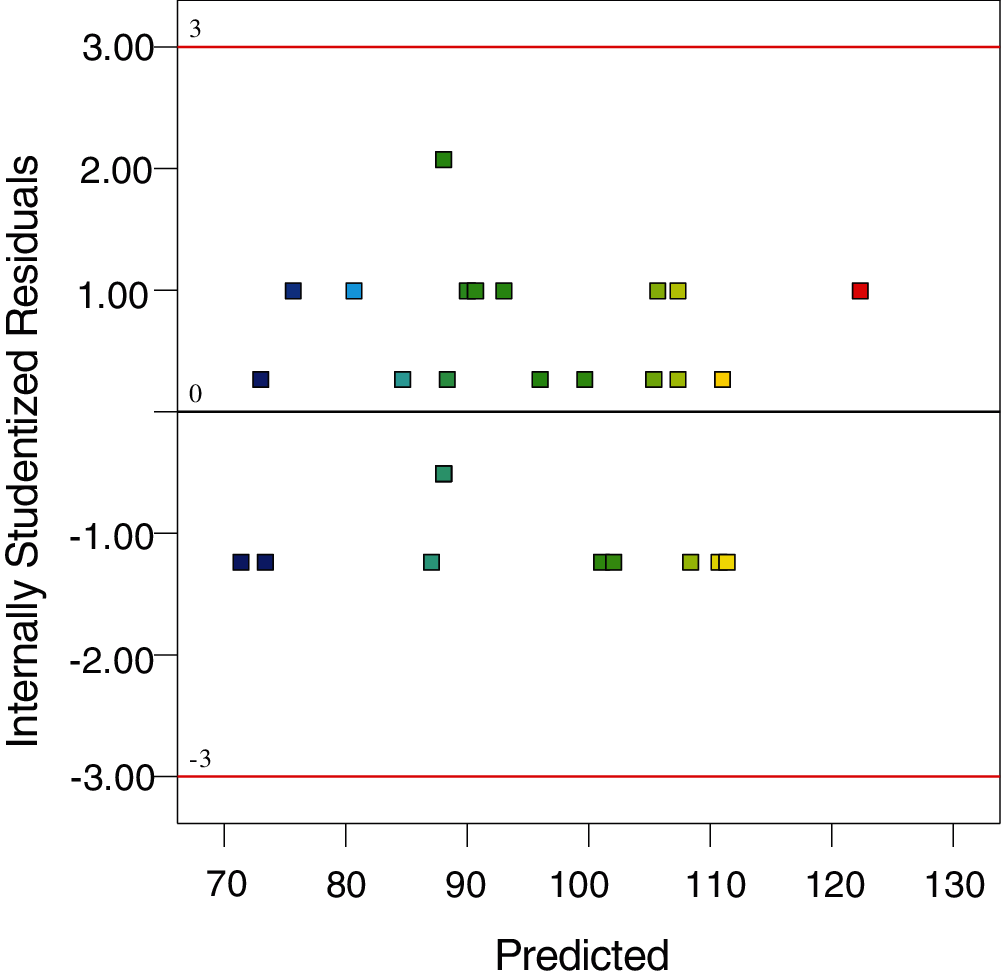
Figure 7: Distribution of residual values and predicted values
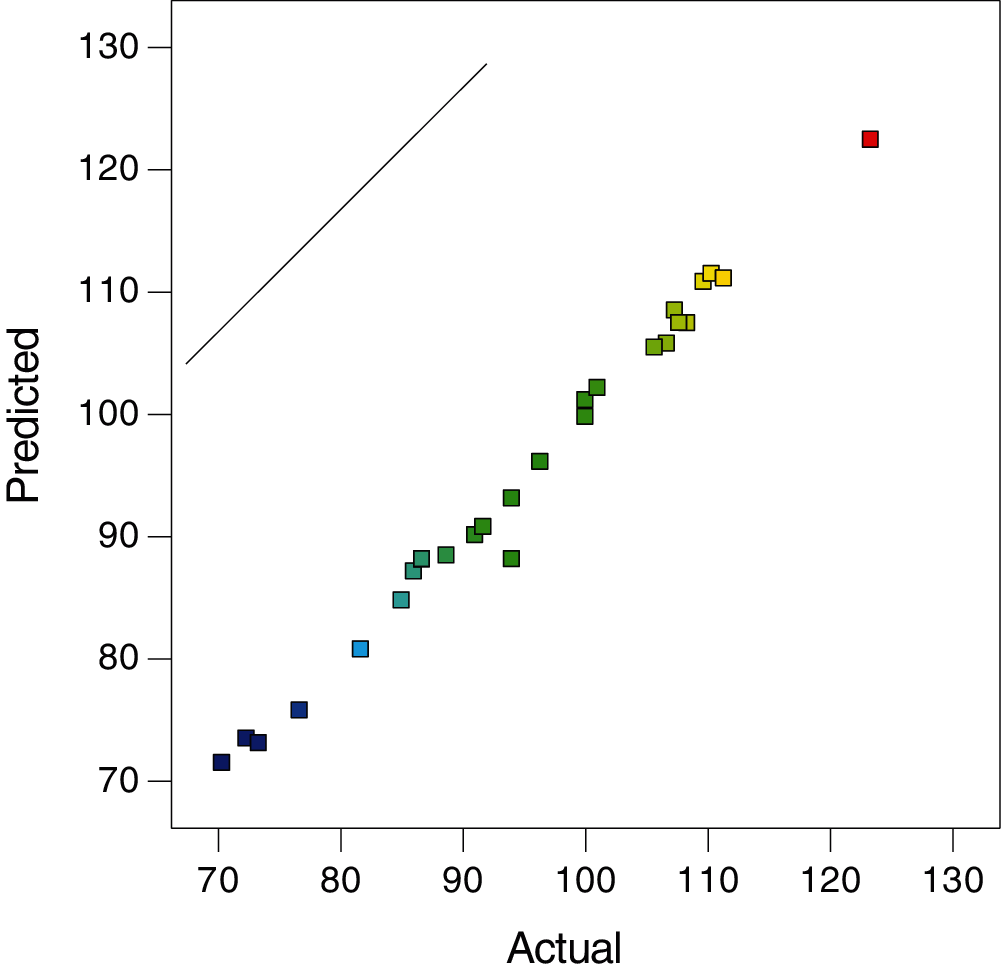
Figure 8: Predicted and actual values of internally studentized residuals
Fig. 8 shows the comparison between the residual predicted and actual values. From Fig. 8, the predicted values are basically distributed on the same straight line with good regularity, indicating and accurate and reliable fitting effect of the model. Moreover, the latter can be used to accurately analyze the fluidity of the filling slurry.
Table 8 presents the results of the response surface cubic model and variance analysis. From Table 8, the F value of the model is 22.19, and the value of Prob > F is less than 0.01, which indicates that the model has a good fit with the experimental data and a small experimental error. From the significance test, we can see that the order of significance of each factor is as follows: C (desulfurization gypsum) > D (gasification slag and bottom slag 1:1) > A (coal gangue) > B (fly ash). The order of significance of interaction among the different factors is as follows: AB (coal gangue, fly ash) > AC (coal gangue, desulfurization gypsum) > BD (fly ash, gasification slag, and bottom slag 1:1) > BC (fly ash, desulfurization gypsum) > CD (desulfurization gypsum, gasification slag, and bottom slag 1:1) > AD (coal gangue, gasification slag, and bottom slag 1:1). Among them, the P value of factor C is the smallest, which indicates that this index is the most significant, the interaction of AB is strong, and the significance is the best; the interaction of AD is the weakest, and the significance is the worst.
Through the analysis of regression fitting, response surface map, and isoline map, the corresponding response values of each factor level can be easily obtained. Based on the analysis of the response value, the optimal value of the predicted response and the corresponding experimental conditions can be found. The isoline map examines the influence of two variables on the dependent variable. The response surface map can directly see the influence of two variables on the dependent variable. Generally, the isoline map at the lower end is the projection of the corresponding response surface map, and the distortion degree of the response surface can reflect the significance and size of the interaction [28].
Fig. 9 shows the influence of the interaction between coal gangue and fly ash on the fluidity of filling slurry. As seen from Fig. 9, when one factor is a fixed value, the single step range of fluidity changing with the change in another factor is larger, which shows that the isolines are denser, and the change in response surface is steeper. This finding indicates that the interaction between coal gangue and fly ash has a strong influence on the response value. According to the macro and micro morphology of gangue and fly ash, that of gangue is similar and thus shows an irregular block. This finding is not conducive to the flow of filling slurry. Additionally, a huge void exists between particles. However, the macro morphology of fly ash is powder, and its micro morphology is spherical particles. Given that the spherical object itself has good rolling characteristics, diffusing the fly ash particles through the gap between the gangue particles is extremely easy, which verifies the significant interaction between gangue and fly ash.
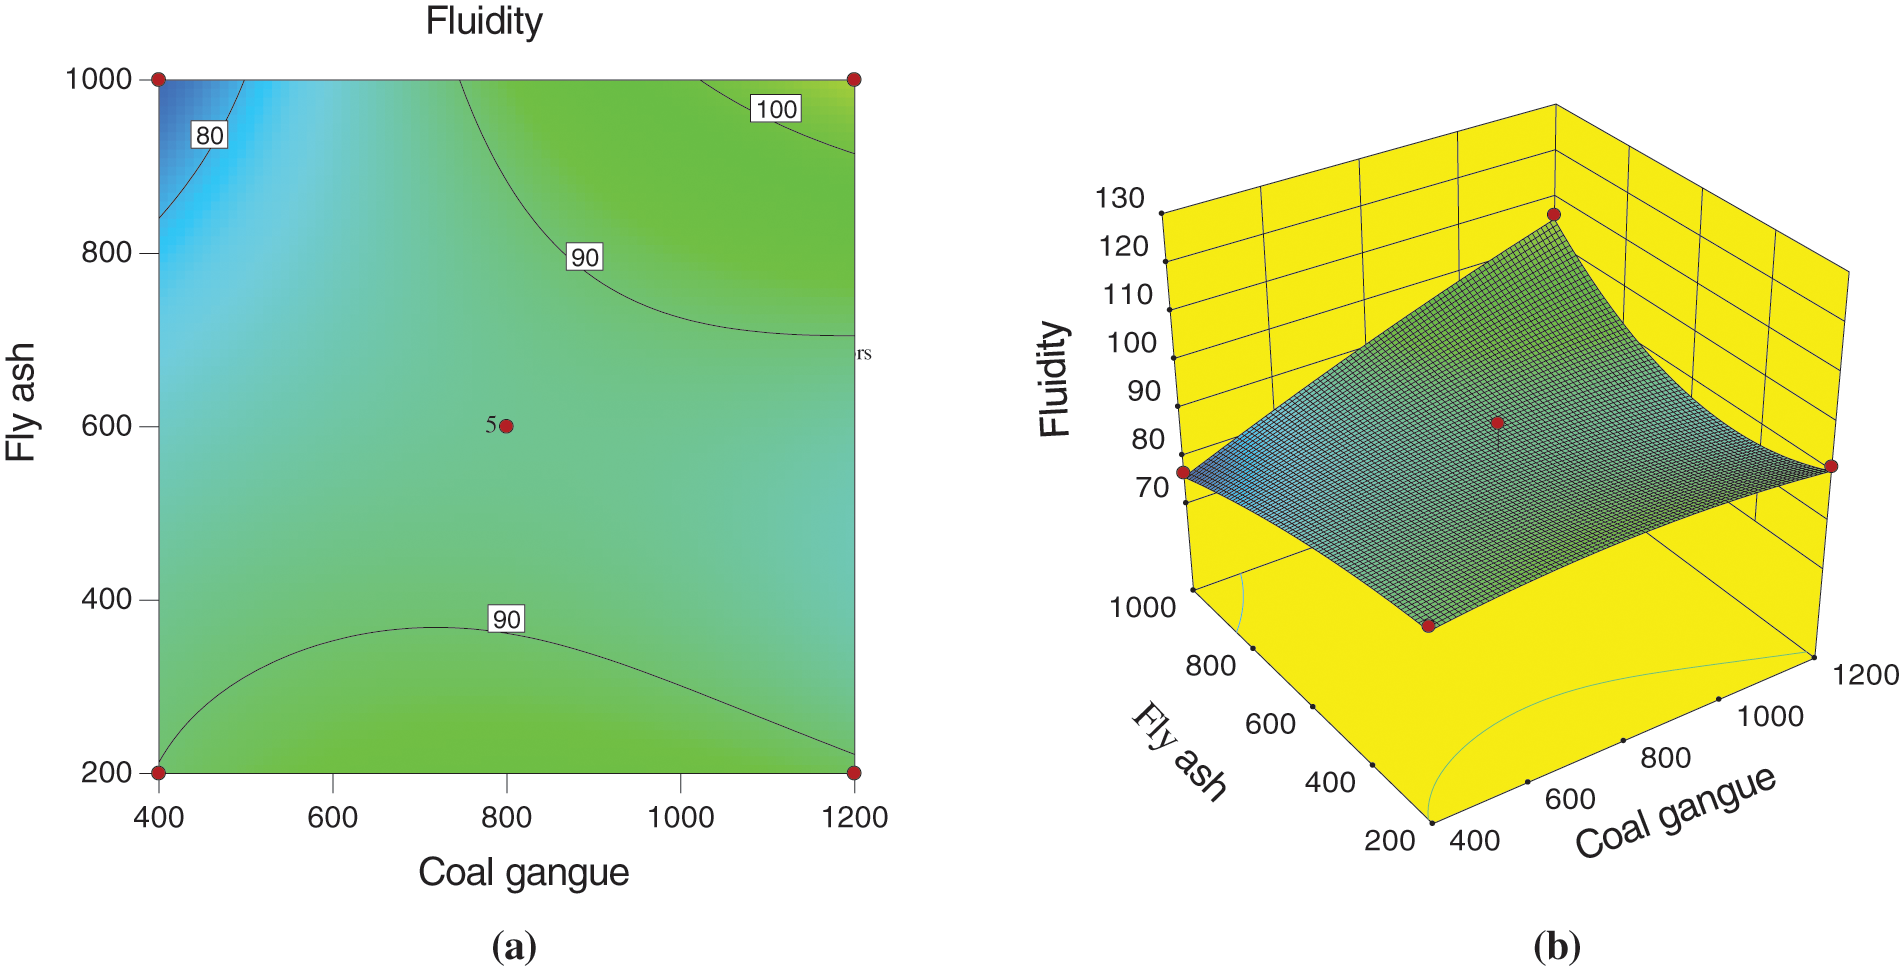
Figure 9: Effect of coal gangue and fly ash on fluidity (a) Optimized contours (b) Response surface
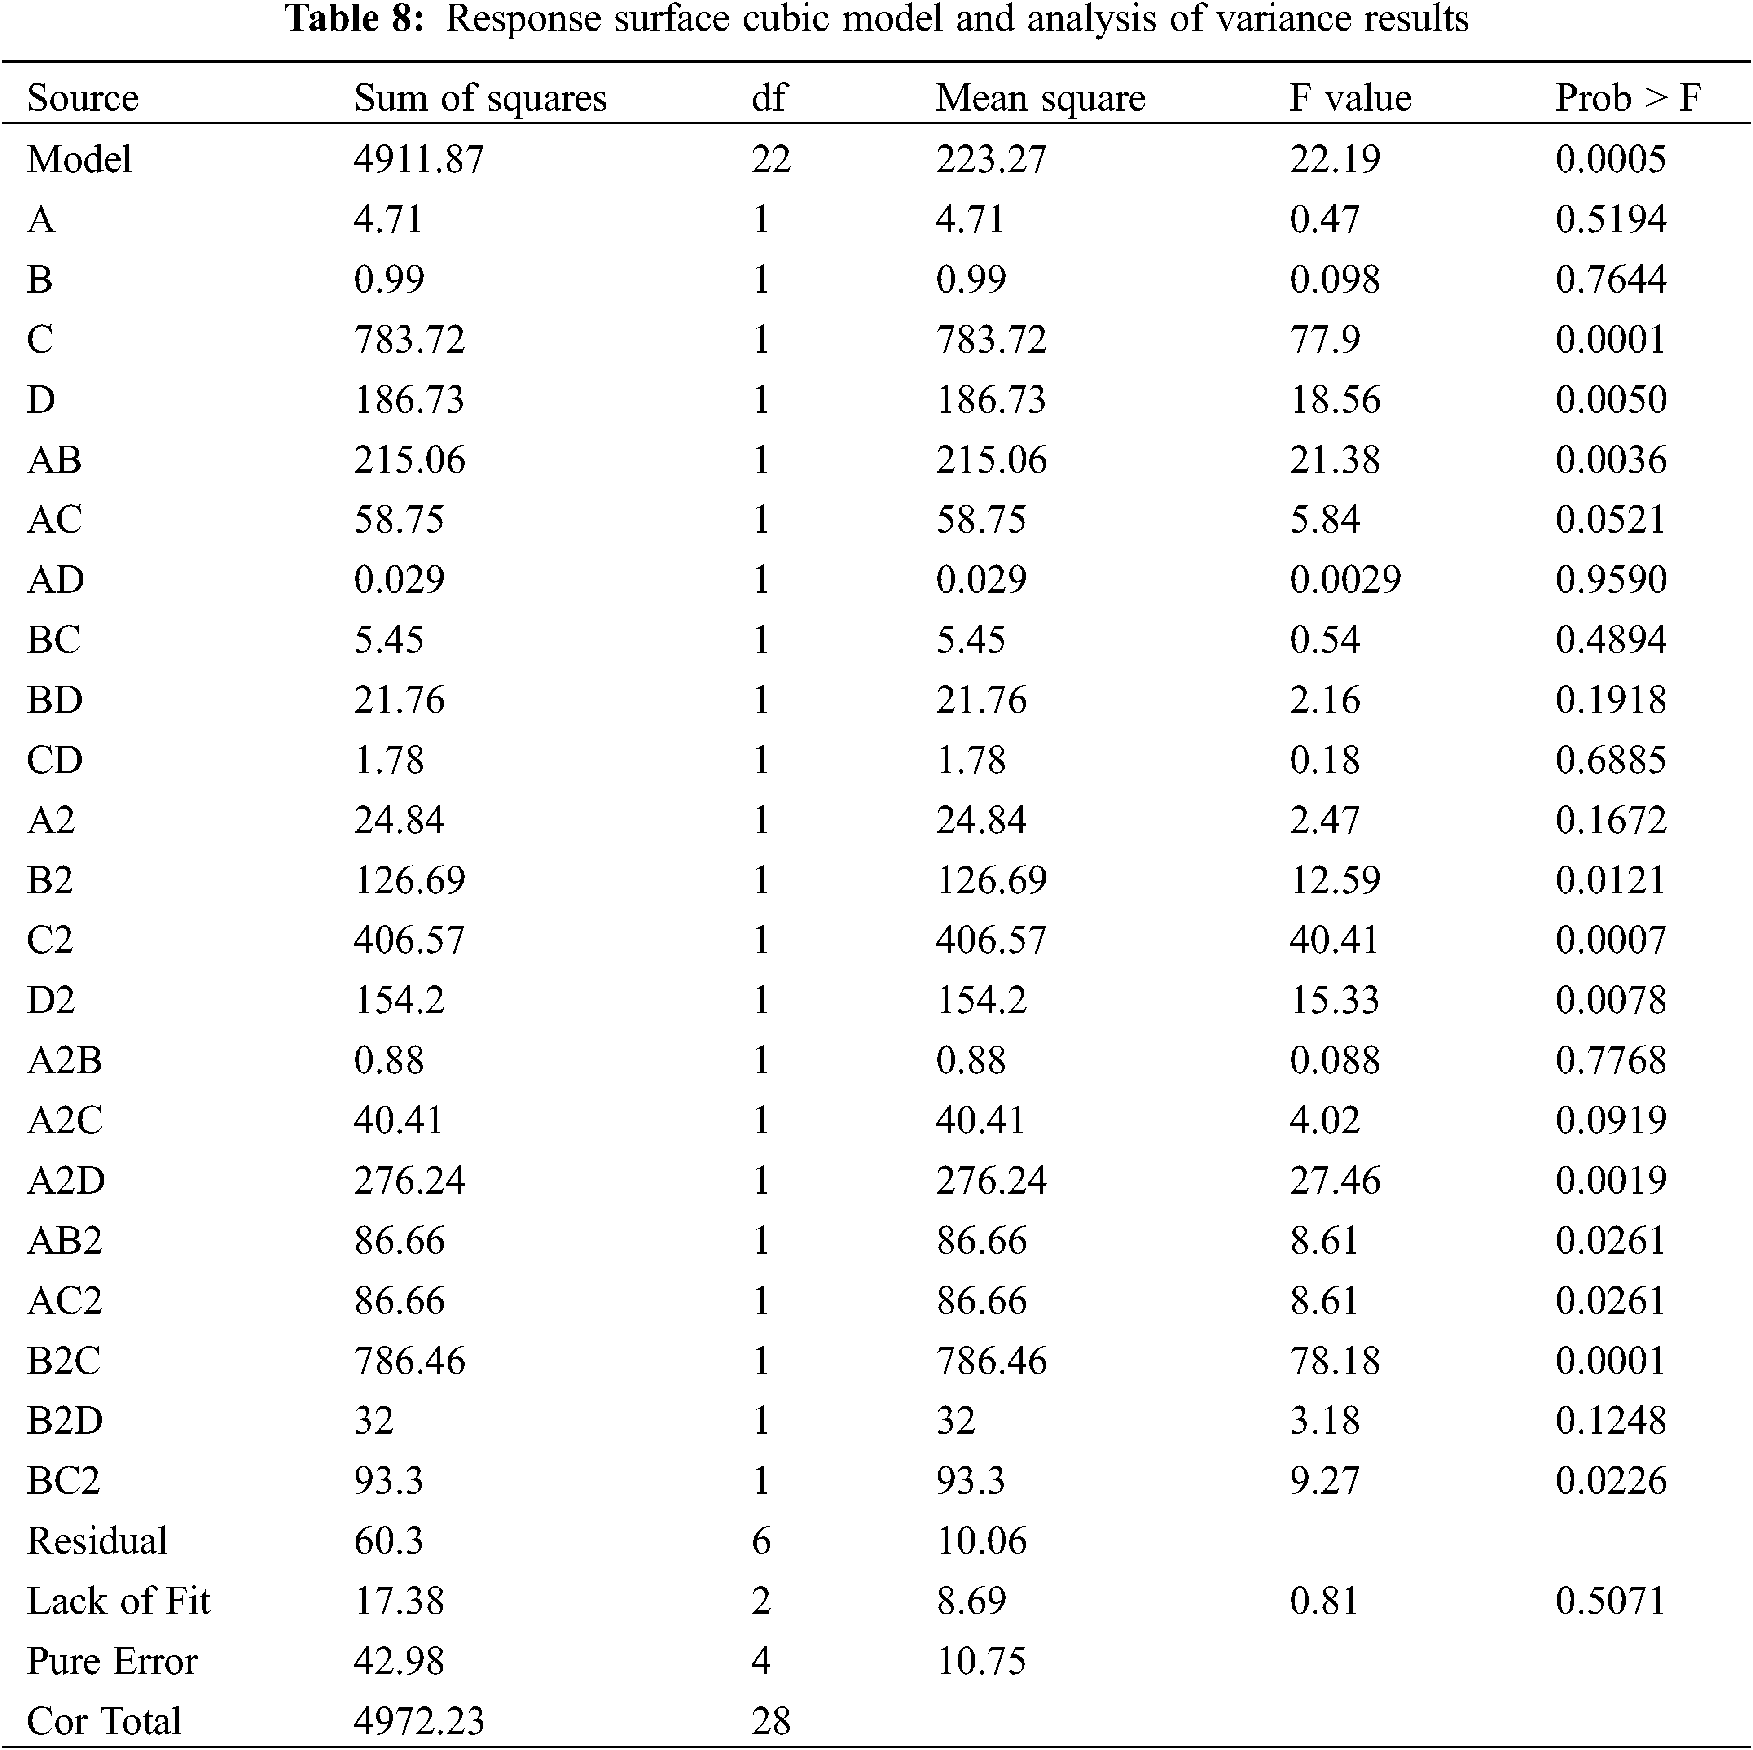
Fig. 10 shows the influence of the interaction between the coal gangue and desulfurization gypsum on the fluidity of filling slurry. From Fig. 10, the color of the optimized isoline map is seen to change rapidly, the fluidity remarkably changes, the isoline lines are dense, and the response surface map exhibits a steep change. Therefore, the interaction between the coal gangue and desulfurization gypsum has a remarkable influence on the response value. When the gangue is 400 g, the response surface map changes steeply. The content of the desulfurized gypsum has a remarkable influence on fluidity.
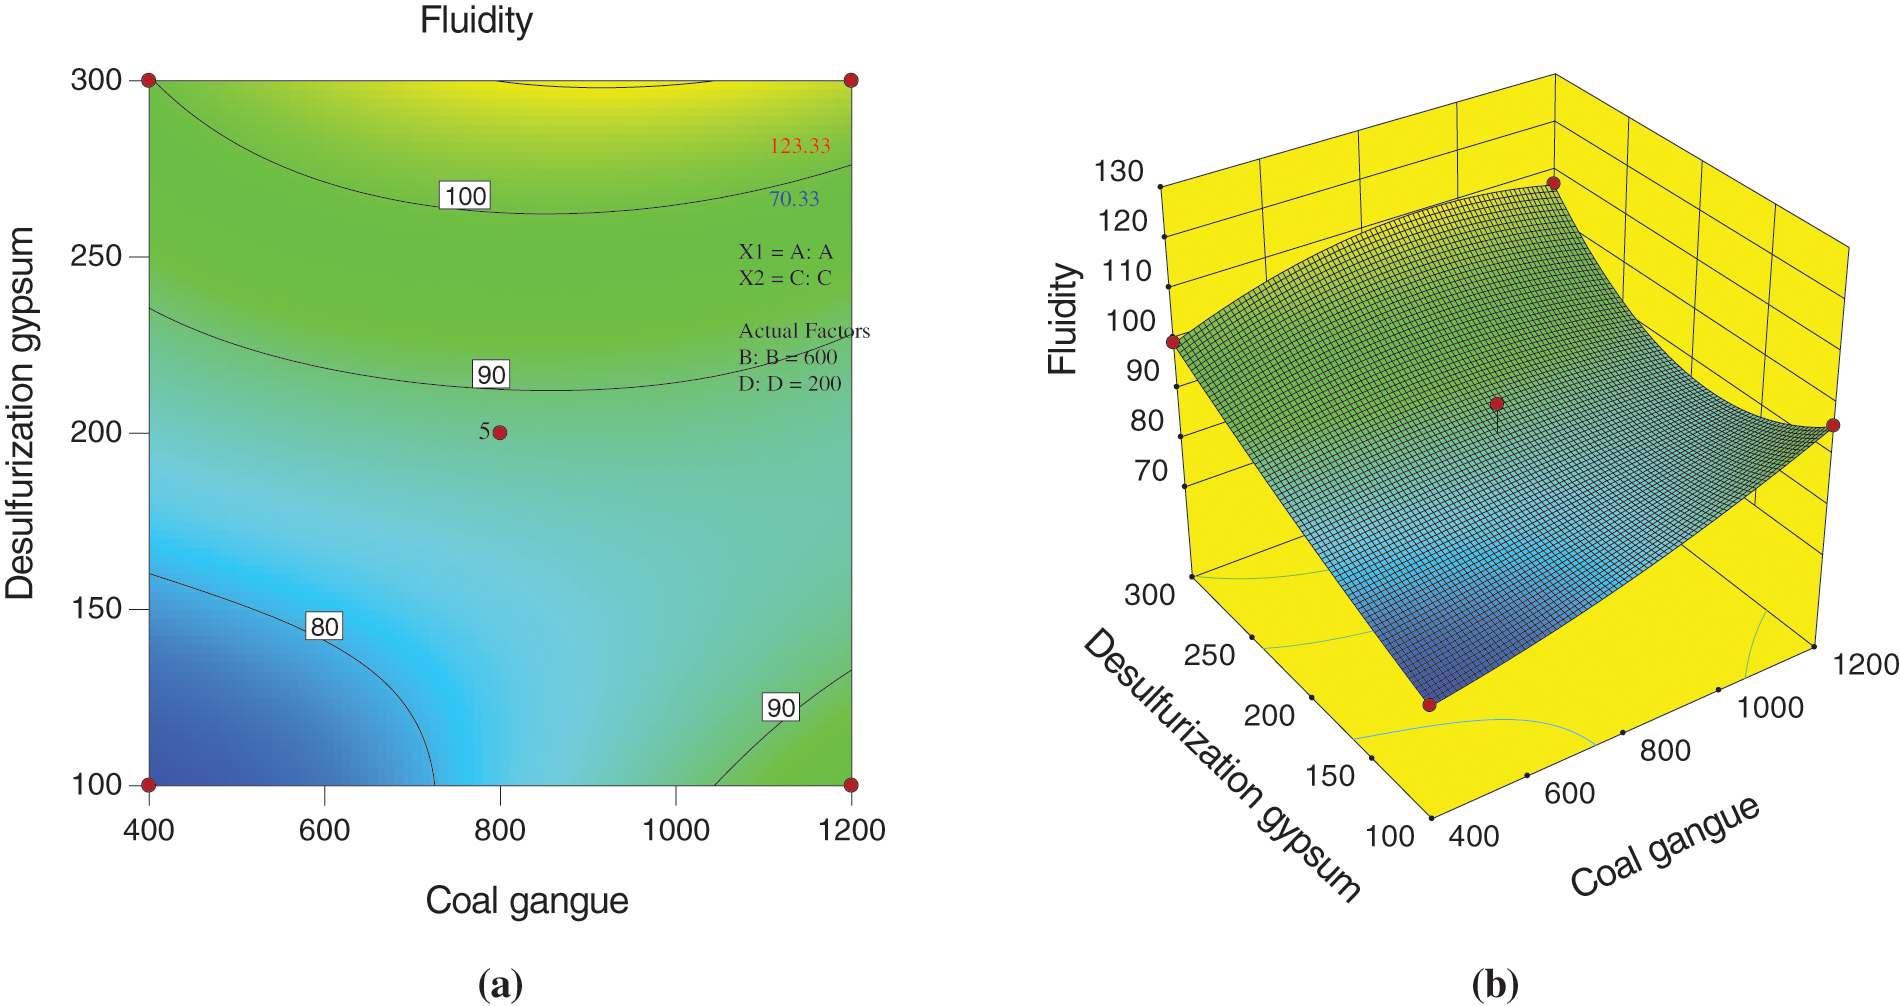
Figure 10: Effect of coal gangue and desulfurization gypsum on fluidity (a) Optimized contours (b) Response surface
According to the micro morphology of coal gangue and desulfurization gypsum, the particle size distribution of coal gangue is irregular, whereas the particle size distribution of desulfurization gypsum is relatively uniform. When the macro pores are filled with fine cement and fly ash particles, the larger desulfurization gypsum particles cannot enter the pores between coal gangue particles, and these particles can only be distributed outside the large particles. Thus, it is conducive to its own outward diffusion. The Ca(OH)2 [29] and AFT cement [30] generated by the action of cement and water are attached to the surface of particles, which merely increases the action relationship between particles and does not play a role in the bulk density of aggregates. Thus, it has little effect on the fluidity of filling slurry.
Fig. 11 shows the influence of the interaction of coal gangue, gasification slag, and bottom slag (1:1) on the fluidity of the filling slurry. From Fig. 11, the response surface map is seen to have a certain distortion, indicating that a certain interaction occurs among coal gangue, gasification slag, and bottom slag (1:1). However, this interaction has little influence on the fluidity. When the gangue content is less than 600 g or more than 1,000 g, the results show that the content of gasification slag and bottom slag (1:1) has a remarkable influence on the fluidity of slurry, the isoline is dense, and the color changes quickly in the isoline map.
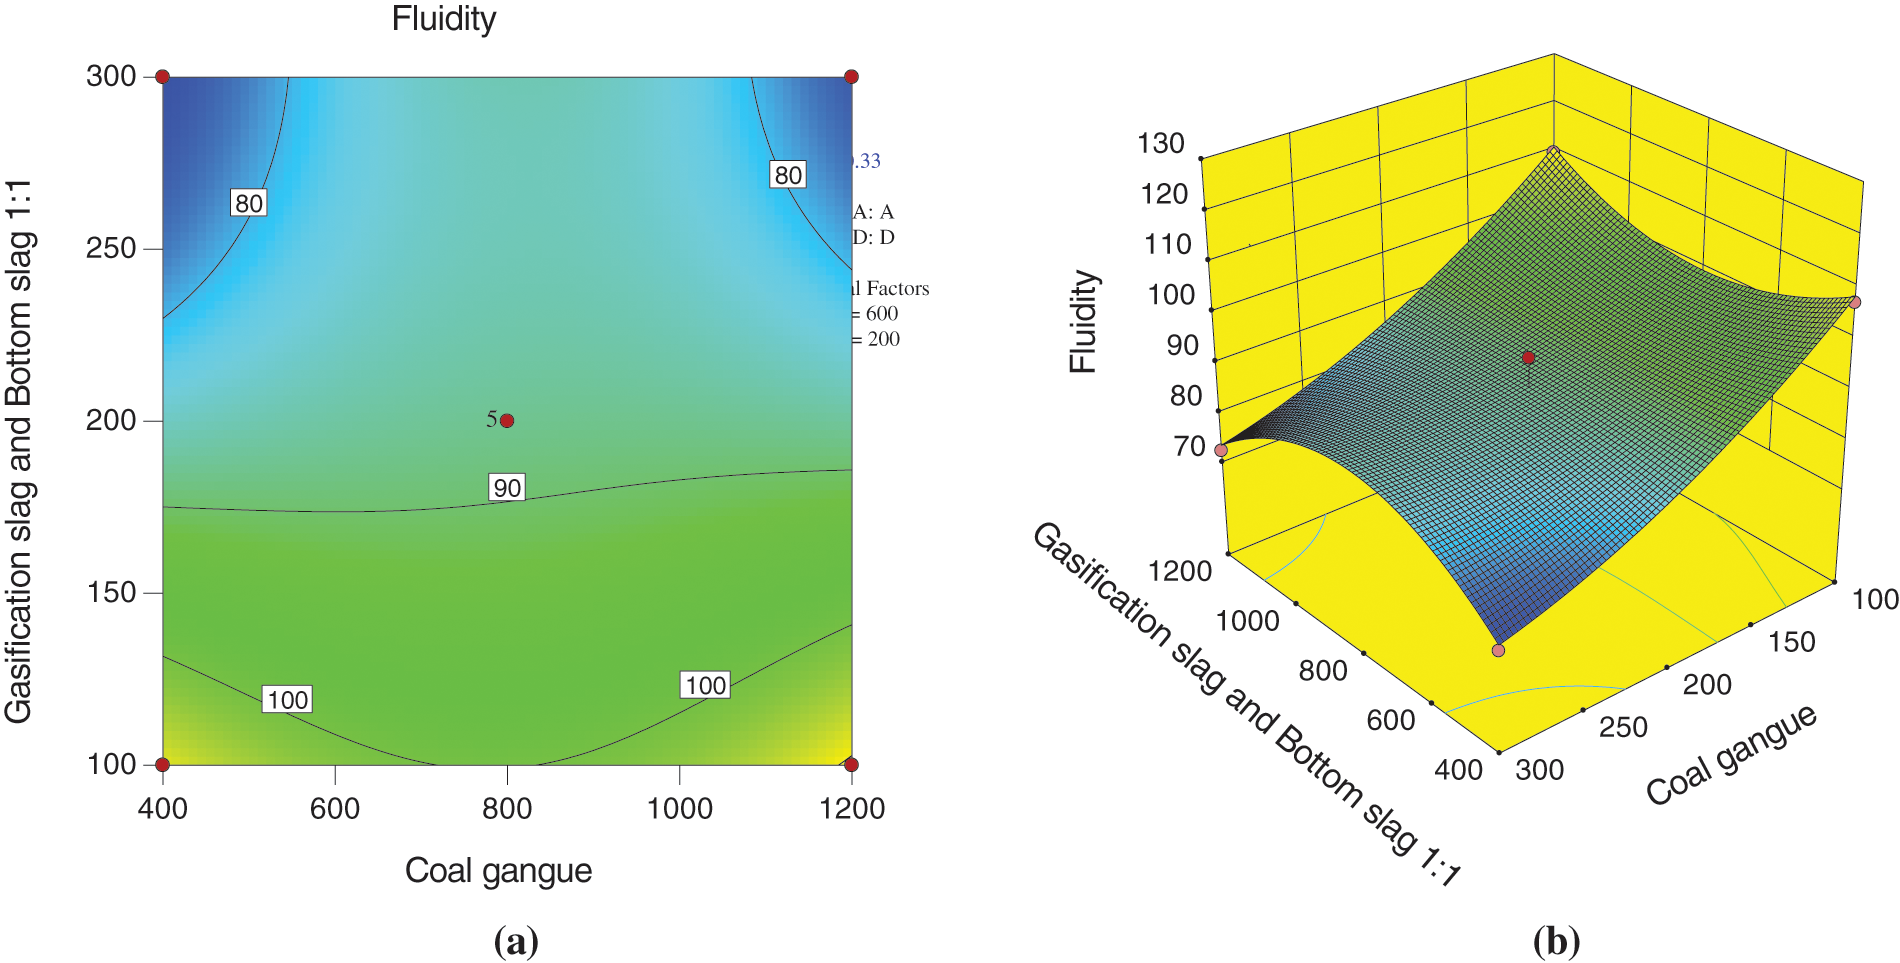
Figure 11: Effect of coal gangue and gasification slag and bottom slag (1:1) on fluidity (a) Optimized contours (b) Response surface
Fig. 12 shows the influence of the interaction between fly ash and desulfurized gypsum on the fluidity of filling slurry. From Fig. 12, the color change in the isoline map is not centralized, the isoline distribution is wide, and the response surface has some distortion and deformation. Thus, the interaction between fly ash and desulfurized gypsum has little influence on the response value. As seen from the micro morphology analysis of desulfurization gypsum, the micro particle state of the desulfurization gypsum is a polygon block, the distribution of micro particle size is more uniform, the accumulation is denser under natural conditions, and the gap between particles is smaller. Compared with gangue particles, it is more able to block the flow of fly ash particles, which may explain why the interaction between the fly ash and desulfurized gypsum is weaker.
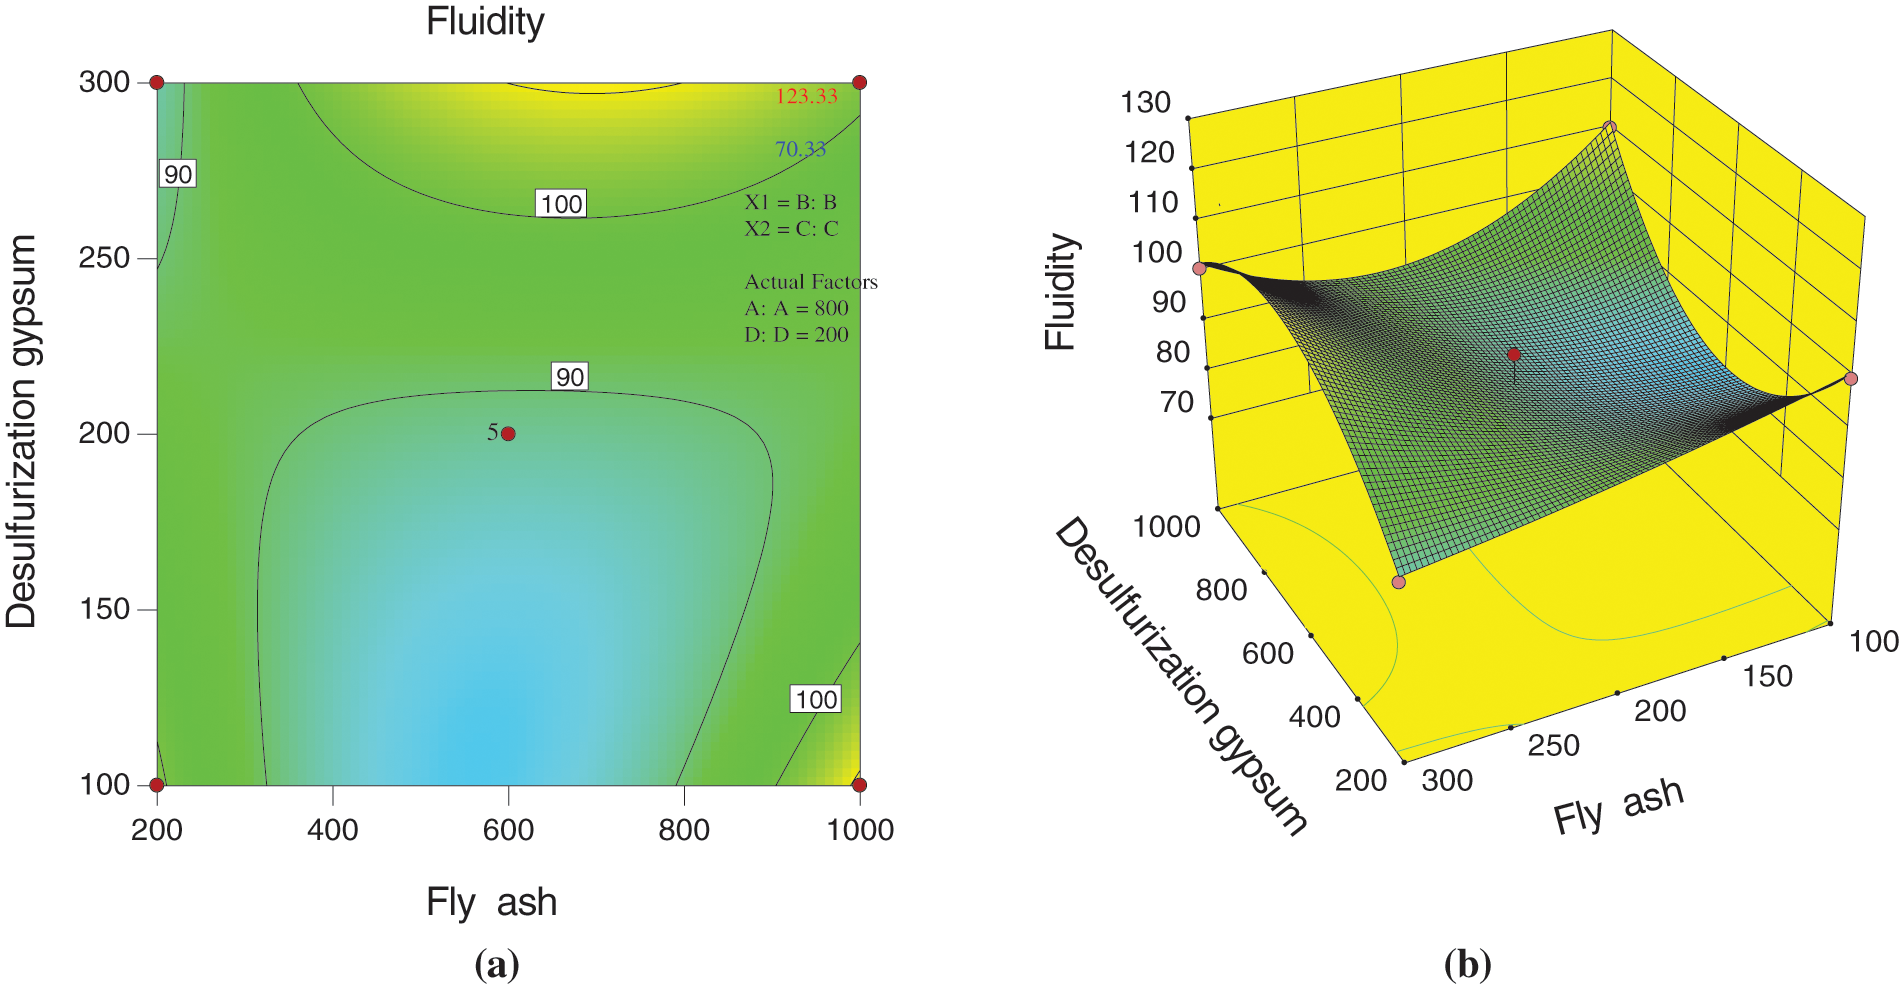
Figure 12: Effect of fly ash and desulfurization gypsum on fluidity (a) Optimized contours (b) Response surface
Fig. 13 shows the influence of the interaction of fly ash, gasification slag, and bottom slag (1:1) on the fluidity of filling slurry. From Fig. 13, the color is seen to change gently, and the isoline distribution is sparse in the optimized isoline map. This finding indicates that the interaction of fly ash, gasification slag, and bottom slag (1:1) has little influence on the response value, and the response surface map exhibits a gentle change. As seen from the isoline when the fluidity is 90 mm, the influence of the content of gasification slag and bottom slag (1:1) on fluidity is basically the same as that of fly ash on fluidity of filling slurry. The results of SEM and XRD show that the particles of gasification slag and bottom slag are large, and many pores appear on the surfaces of gasification slag and bottom slag. After full mixing, a large number of fly ashes with smaller particle size enter the pores formed by the accumulation of larger particles, which increases the bulk density of aggregate and limits the outward diffusion of smaller fly ash particles; conversely, Ca(OH)2 and AFT cements generated by the interaction between cement and water are attached to the surface of particles, resulting in bonding between particles, which increases the consistency of slurry and reduces the fluidity of filling slurry [31].
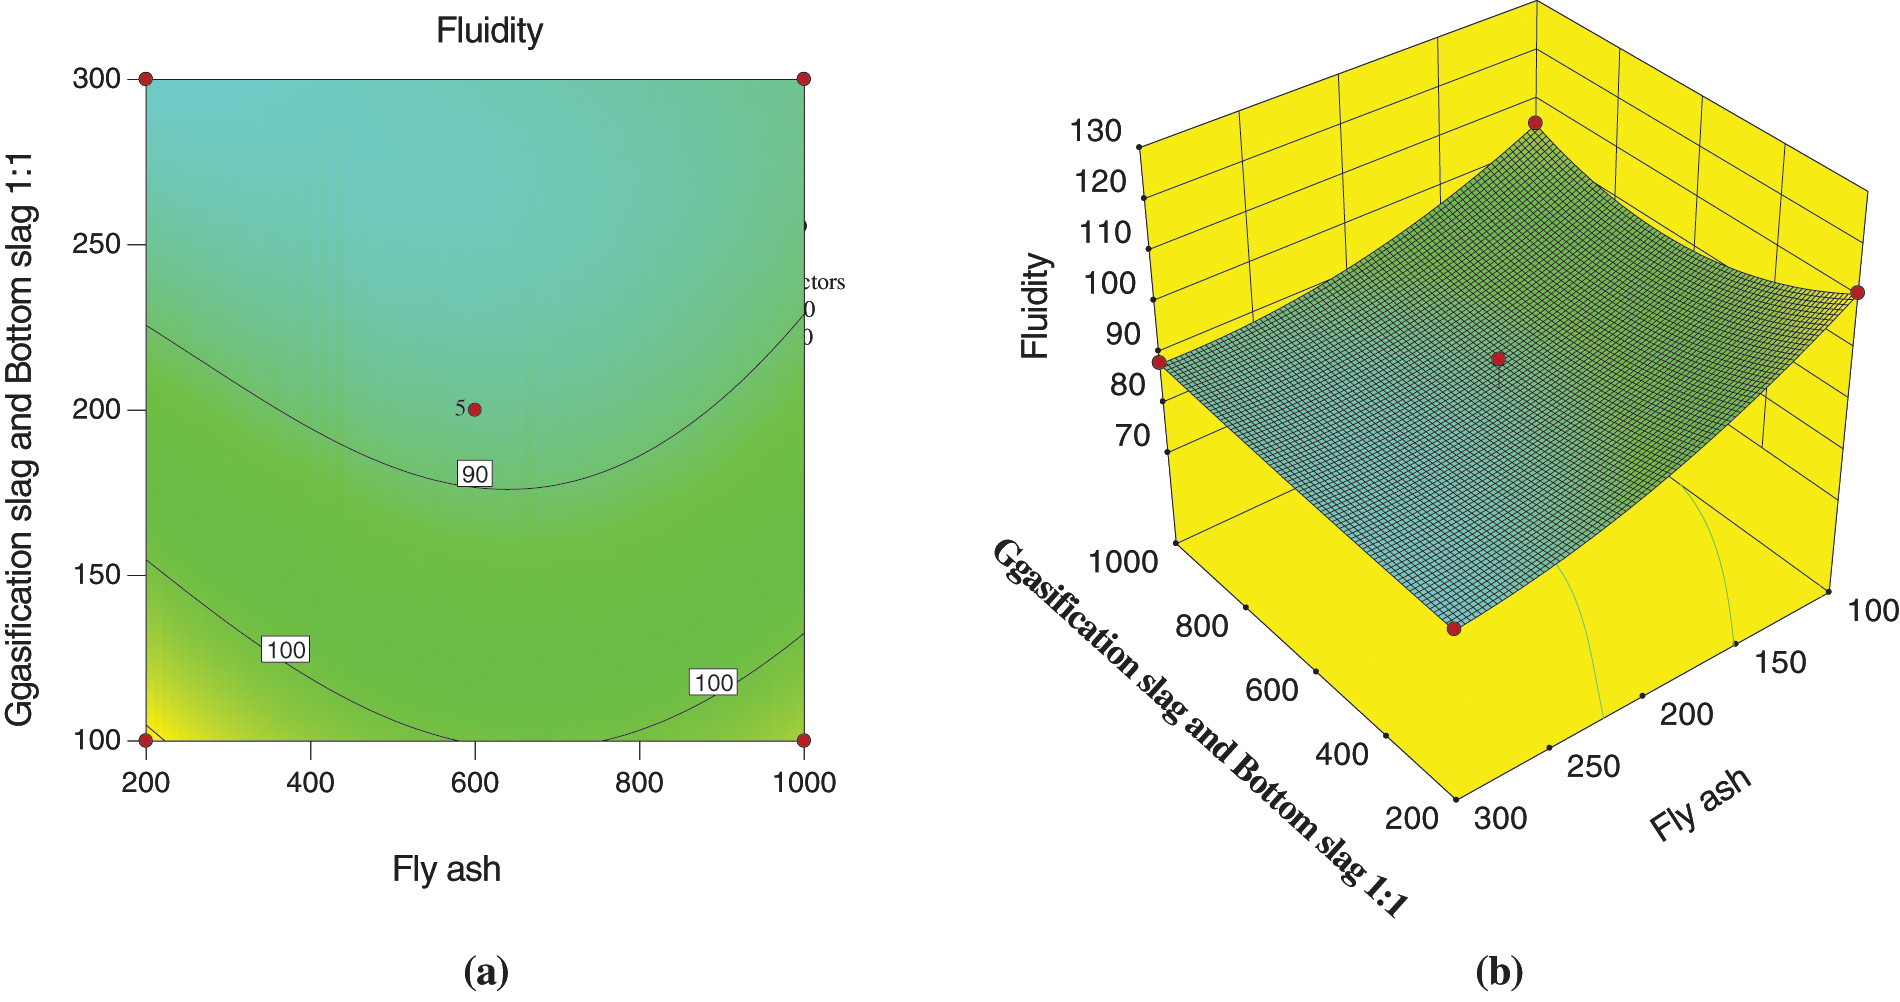
Figure 13: Effect of fly ash and gasification slag and bottom slag (1:1) on fluidity (a) Optimized contours (b) Response surface
Fig. 14 shows the influence of the interaction among desulfurization gypsum, gasification slag, and bottom slag (1:1) on the fluidity of filling slurry. From Fig. 14, the response surface is seen to have a certain distortion, indicating that a certain interaction occurs among desulfurization gypsum, gasification slag, and bottom slag (1:1), but the interaction is weak. The number of contour lines on abscissa and ordinate axis is less, which also shows that the two factors have the same influence on slurry fluidity.
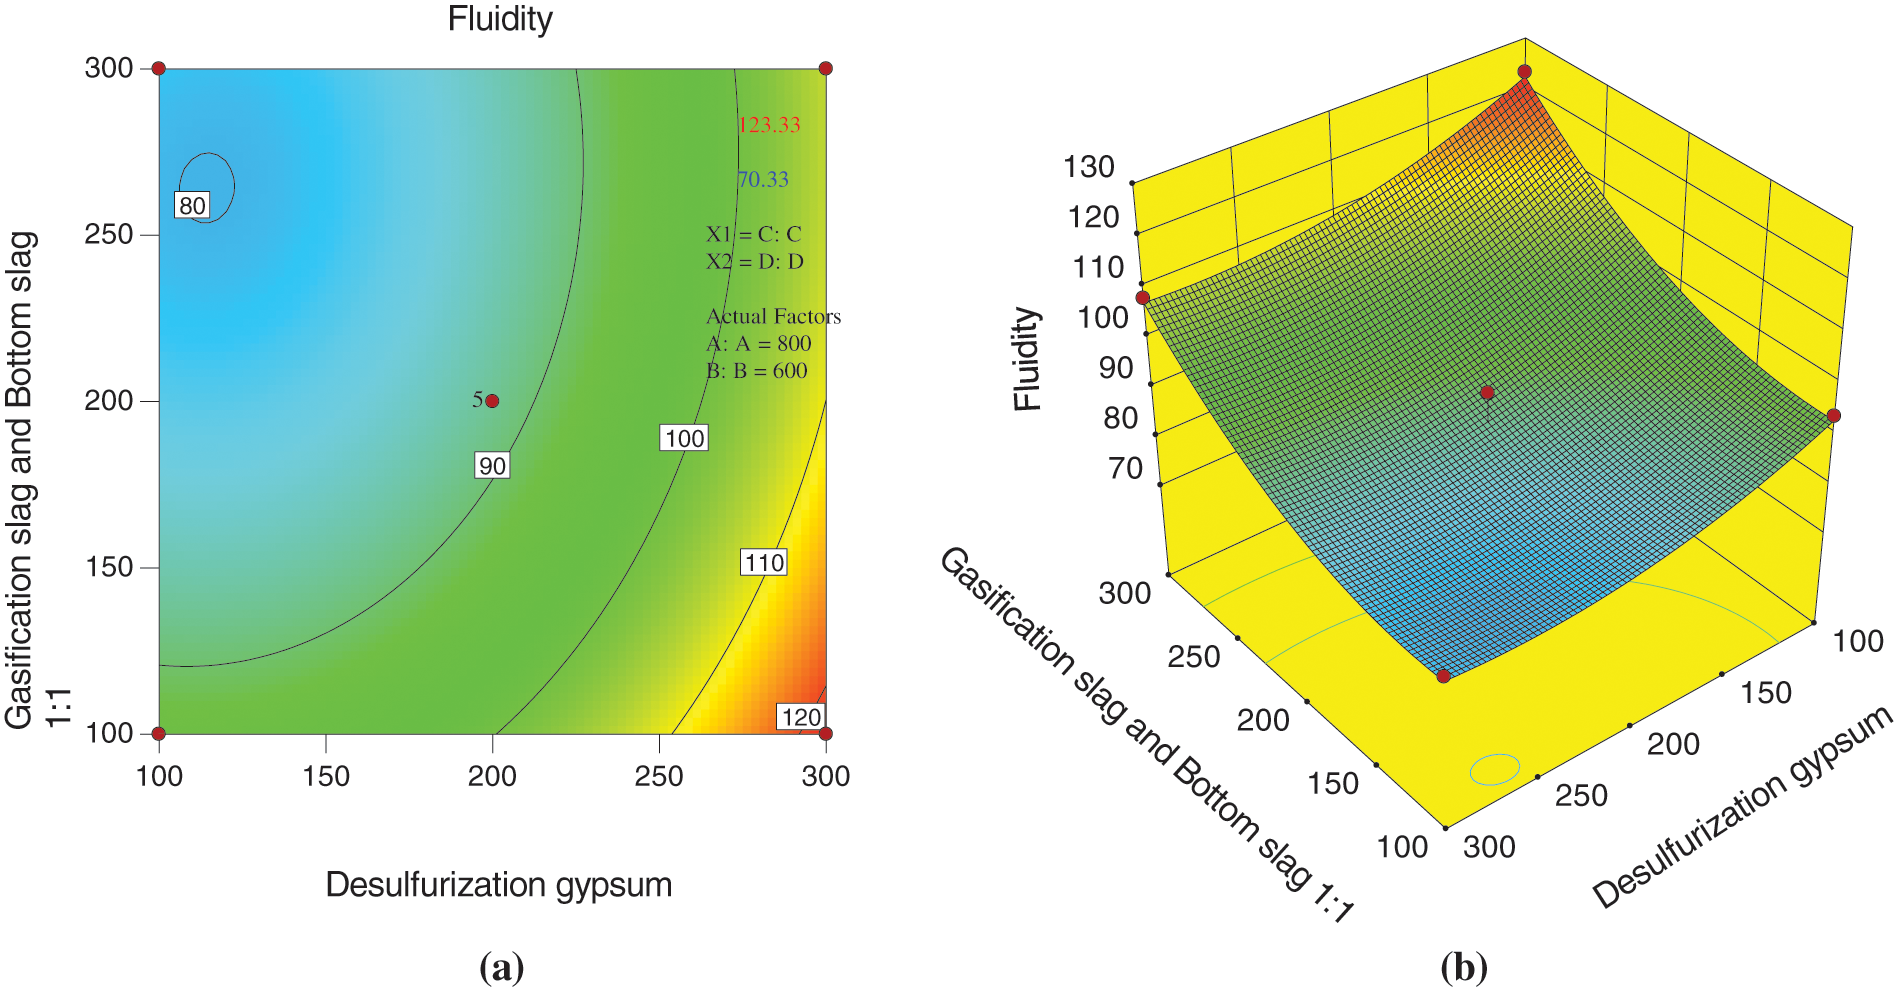
Figure 14: Effect of desulfurization gypsum and gasification slag and bottom slag (1:1) on fluidity (a) Optimized contours (b) Response surface
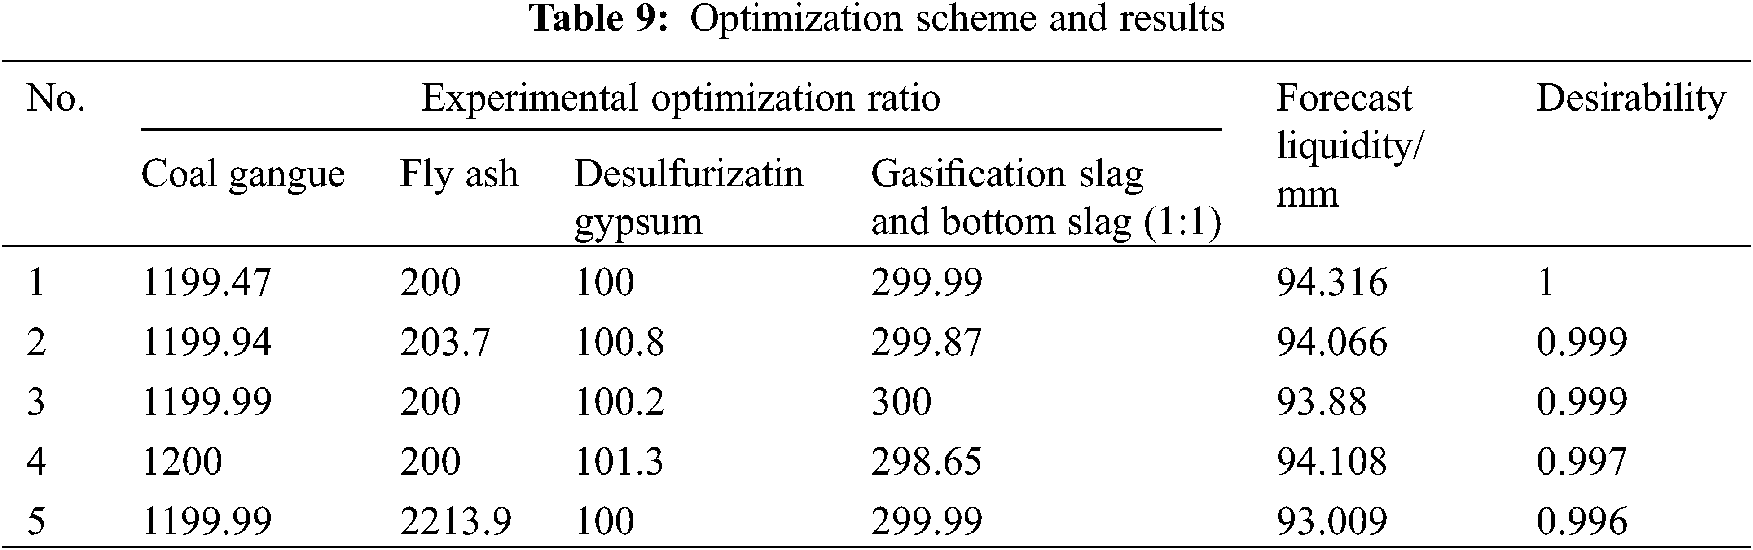
The experimental results undergo further analysis. Considering the transportation and performance of the filling slurry, the fluidity ranges from 90–100 mm. The optimized experimental scheme is obtained by using the design expert software. Five recommended experimental schemes are selected as shown in Table 9. From Table 9, considering the operability and simplicity of field filling, the proportion of the factors in the filling slurry is shown as follows: 49.5% coal gangue, 8.3% fly ash, 4.1% desulfurization gypsum, 6.2% gasification slag, and 6.2% bottom slag.
Response surface methodology is a method to determine the optimal solution according to the experimental conditions, which can solve the nonlinear data analysis problems. Through the regression fitting of the process and the drawing of response surface and contour lines, the response values of each factor level can be quickly obtained to identify the predicted optimal response value and the corresponding experimental scheme. In this paper, the bleeding and fluidity of the new filling slurry are analyzed by using the response surface method, and the significance of various factors on the two properties is obtained, respectively. Combined with the analysis results of fluidity method, the optimal experimental scheme is obtained.
In terms of bleeding, the significance test of fly ash shows that it has the most significant bleeding to the filling slurry, which may be due to the fact that the micro morphology of fly ash presents spherical particles and the surface is relatively smooth. By contrast, the activity of SiO2, which is the main crystal component of fly ash, is not strong and has poor interaction with water, resulting in the most significant bleeding to the filling slurry. Given that the particle surface of gangue is rough, a large amount of free water in the filling slurry enters the pores inside the gangue, which may explain its low bleeding to the filling slurry. The experiment has many influencing factors. For the response surface analysis results, conducting further experiments from the micro perspective is needed to reveal the bleeding mechanism of filling slurry.
In terms of fluidity, desulfurization gypsum has the most significant fluidity to the filling slurry, which may be due to the relatively uniform particle size distribution of desulfurization gypsum. Neither large and additional pores can be formed between particles nor can it effectively enter the pores between large particles, which is easier to diffuse around in the process of aggregate accumulation. The interaction between coal gangue and fly ash has the largest response value to the filling slurry, which may be due to the particle size of fly ash which is smaller than that of coal gangue. The latter is easier to diffuse outward from the pores between the particles stacked by coal gangue. Conversely, the main crystal mineral SiO2 of coal gangue and fly ash have poor interaction with water, and the particles are relatively dispersed. The latter increases the fluidity of filling slurry. The response surface method is used to explain the relative fluidity of the filling slurry. However, the filling slurry contains other components. The influence of new substances generated in the filling slurry on fluidity needs further exploration.
Using XRD and SEM micro observation techniques, the micro morphology of coal gangue, desulfurization gypsum, and gasification slag is obtained to present an irregular block with rough particle surface. The micro morphology of fly ash and bottom slag presents first out spherical or quasi spherical particles, and obvious sintering traces appear on the surface of bottom slag. The main crystal mineral of coal gangue and fly ash is SiO2, the desulfurization gypsum is composed of Ca(SO4) (H2O) and Ca(CO3) crystal minerals, the gasification slag is composed of carbon and nitrogen compounds, and the main crystal mineral components in the bottom slag sample are SiO2 and AlxSiyOz compounds. After the filling materials are fully mixed, a large number of particles with small particle size will enter the pores formed by the accumulation of larger particles, increasing the bulk density of the aggregate. The Ca(OH)2 and AFT cements generated by the interaction of cement and water adhere to the surface of the particles, increasing the consistency of the slurry and somewhat limiting the fluidity of the filling slurry.
Through the analysis of variance and significance, the experimental results show that the order of significance of each factor on the fluidity of filling slurry is as follows: C (desulfurization gypsum) > D (gasification slag and bottom slag 1:1) > A (coal gangue) > B (fly ash). The order of the significant factors for the bleeding of the filling pulp was as follows: B (fly ash) > C (desulfurization gypsum) > D (gasification slag and bottom slag 1:1) > A (coal gangue).
According to the response surface analysis, the order of the interaction between the experimental factors was obtained: AB (coal gangue, fly ash) > AC (coal gangue, desulfurization gypsum) > BD (fly ash, gasification slag and bottom slag 1:1) > BC (fly ash, desulfurization gypsum) > CD (desulfurization gypsum, gasification slag and bottom slag 1:1) > AD (coal gangue, gasification slag and bottom slag 1:1). Among them, the interaction between coal gangue and fly ash is the most significant, considering the bleeding and fluidity of filling slurry, the mass percentage of each factor in the filling slurry is obtained as follows: 49.5% coal gangue, 8.3% fly ash, 4.1% desulfurizatin gypsum, 6.2% gasification slag, and 6.2% bottom slag.
In this paper, the influence of each component on the fluidity of filling slurry is analyzed by using SEM and XRD micro test technology and response surface method. Given that the particle grading composition of raw materials is closely related to the fluidity of filling slurry and the performance of filling body, subsequent work needs to carry out a rigorous analysis on the fluidity of filling slurry in combination with the particle grading of raw materials.
Acknowledgement: We thank Xinzhu Hua for his guidance on the structure of the article, Chen Li and Enqian Wang for their help in the experiment, and other authors for their help in English translation and typesetting.
Funding Statement: We acknowledge the financial support for this work provided by the National Natural Science Foundation of China (Grant No. 51774010) and National Key R&D Program of China (Grant No. 2019YF1904304).
Conflicts of Interest: The authors declare that they have no conflicts of interest to report regarding the present study.
1. Song, Z. Q., Cui, Z. D., Xia, H. C., Tang, J. Q., Wen, Z. J. (2010). The fundemental theoretial and engineering research on the green safe no coal pillar mining model by mainly using coal gangue backfill. Journal of China Coal Society, 35(5), 705–710. DOI 10.13225/j.cnki.jccs.2010.05.017. [Google Scholar] [CrossRef]
2. Liu, J. G., Li, X. W., He, T. (2020). Application status and prospect of backfill mining in Chinese coal mines. Journal of China Coal Society, 45(1), 141–150. DOI 10.13225/j.cnki.jccs.YG19.1063. [Google Scholar] [CrossRef]
3. Wei, D. Y., Du, C. F., Li, Y. X., Zhang, L. F. (2019). Experiment on preparation of calcium silicate board based on a mixed gel system of carbide slag and coal-based solid waste. Chinese Journal of Engineering, 41(1), 53–59. DOI 10.13374/j.issn2095-9389.2019.01.005. [Google Scholar] [CrossRef]
4. Qian, M. G., Cao, S. G. (2007). Scientific technique and management in coal mining. Journal of Mining & Safety Engineering, 1, 1–7. [Google Scholar]
5. Li, X. B., Liu, B., Yao, J. R. (2018). Theory and practice of green mine backfill with whole phosphate waste. Chinese Journal of Nonferrous Metals, 28(9), 1845–1865. DOI 10.19476/j.ysxb.1004.0609.2018.09.16. [Google Scholar] [CrossRef]
6. Wang, J. H., Kang, H. P., Liu, J. Z., Chen, P. P., Fan, Z. Z. et al. (2018). Layout strategic research of green coal resource development in China. Journal of China University of Mining & Technology, 47(1), 15–20. DOI 10.13247/j.cnki.jcumt.000793. [Google Scholar] [CrossRef]
7. Fu, Z. G., Qiao, D. P., Guo, Z. L., Xie, J., Wang, J. et al. (2018). Experimental research on mix proportioning and strength of cemented hydraulic fill with waste rock and eolian sand based on RSM-BBD. Journal of China Coal Society, 43(3), 694–703. DOI 10.13225/j.cnki.jccs.2017.0806. [Google Scholar] [CrossRef]
8. Zhao, J. W., Su, T., Rong, T. L., Zhong, J. C., Liu, Z. L. et al. (2020). A constitutive model of superhigh-water filling material under confined compression. Journal of Mining & Safety Engineering, 37(2), 394–400. DOI 10.13545/j.cnki.jmse.2020.02.020. [Google Scholar] [CrossRef]
9. Gao, R. G., Zhou, K. P., Zhou, Y. L., Yang, C. (2020). Research on the fluid characteristics of cemented backfill pipeline transportation of mineral processing tailings. Alexandria Engineering Journal, 59(6), 4409–4426. DOI 10.1016/j.aej.2020.07.047. [Google Scholar] [CrossRef]
10. Zhang, X. G., Bai, J. W., Wang, H., Jiang, N. (2012). Study on proportioning test of coal solid waste paste filling material. Advanced Materials Research, 524–527, 1086–1091. DOI 10.4028/www.scientific.net/AMR.524-527.1086. [Google Scholar] [CrossRef]
11. Zhang, X. G., Jiang, N., Wang, H., Li, Y. Y. (2012). Study on basic experiment of coal waste paste filling material. Applied Mechanics and Materials, 174–177, 384–389. DOI 10.4028/www.scientific.net/AMM.174-177.384. [Google Scholar] [CrossRef]
12. Yang, B. G., Jin, J. Y., Yin, X. D., Wang, X. Y. (2021). Effect of concentration and suspension agent (HPMC) on properties of coal gangue and fly ash cemented filling material. Shock and Vibration, 2021(6), 1–13. DOI 10.1155/2021/7275334. [Google Scholar] [CrossRef]
13. Dai, C. Q., Wu, A. X., Qi, Y., Chen, Z. (2019). The optimization of mix proportions for cement paste backfill materials via Box-Behnken experimental method. Journal of the Institution of Engineers (IndiaSeries D, 100(2), 307–316. DOI 10.1007/s40033-019-00180-7. [Google Scholar] [CrossRef]
14. Ren, C., Li, K. Q., Ni, W., Zhang, S. (2019). Preparation of mine filling material from steel slag mud. Annales de Chimie-Science des Matériaux, 43(4), 217–224. DOI 10.18280/acsm.430404. [Google Scholar] [CrossRef]
15. Shi, S., Liu, C. W., Wu, H. K., Chen, K. L. (2021). Study on physical and mechanical properties of modified high water filling material with fly ash and calcium carbide slag. Materials Reports, 35(7), 7027–7032. DOI CNKI:SUN:CLDB.0.2021-07-004. [Google Scholar]
16. Feng, G. R., Jia, X. Q., Guo, Y. X., Qi, T. Y., Li, Z. et al. (2016). Study on mixture ratio of gangue-waste concrete cemented paste backfill. Journal of Mining & Safety Engineering, 33(6), 1072–1079. DOI 10.13545/j.cnki.jmse.2016.06.017. [Google Scholar] [CrossRef]
17. Chen, W. X., Li, F. Y., Guan, X. H., Chen, L. (2014). Research on mining water-rich fly-ash-based filling material. Advanced Materials Research, 988, 201–206. DOI 10.4028/www.scientific.net/AMR.988.201. [Google Scholar] [CrossRef]
18. Guo, S. J., Zhang, J. X., Li, M., Zhou, N., Song, W. J. et al. (2021). A preliminary study of solid-waste coal gangue based biomineralization as eco-friendly underground backfill material: Material preparation and macro-micro analyses. Science of the Total Environment, 770, 1–9. DOI 10.1016/J.SCITOTENV.2021.145241. [Google Scholar] [CrossRef]
19. Wang, Z., Yu, W. J., Liu, F. F. (2020). The materialization characteristics and ratio of a new soil paste filling material. Advances in Civil Engineering, 2020(3), 1–8. DOI 10.1155/2020/6645494. [Google Scholar] [CrossRef]
20. Qin, Y. G., Hu, J. H., Yang, D. J., Kuang, Y. (2020). Optimization of transport performance and strength of the filling slurry in tailings reservoir waste by adding air entraining agent. Minerals, 10(9), 730. DOI 10.3390/min10090730. [Google Scholar] [CrossRef]
21. Rong, K. W., Lan, W. T., Li, H. Y. (2020). Industrial experiment of goaf filling using the filling materials based on hemihydrate phosphogypsum. Minerals, 10(4), 324. DOI 10.3390/min10040324. [Google Scholar] [CrossRef]
22. Lan, W. T., Wu, A. X., Yu, P. (2020). Development of a new controlled low strength filling material from the activation of copper slag: Influencing factors and mechanism analysis. Journal of Cleaner Production, 246, 119060. DOI 10.1016/j.jclepro.2019.119060. [Google Scholar] [CrossRef]
23. Lan, W. T., Wu, A. X., Wang, Y. M. (2019). Experimental study on factors affecting the filling performance of composite condensate expansion materials. Advanced Engineering Sciences, 51(5), 192–198. DOI 10.15961/j.jsuese.201800502. [Google Scholar] [CrossRef]
24. Xiao, M., Ju, F., He, Z. Q., Li, K. Y., Wang, P. (2020). Experimental study on influence factors of the lateral pressure coefficient of gangue back-filling materials. Journal of Mining & Safety Engineering, 37(1), 73–80. DOI 10.13545/j.cnki.jmse.2020.01.008. [Google Scholar] [CrossRef]
25. Yin, B., Kang, T. H., Kang, J. T., Chen, Y., Wu, J. et al. (2018). The research of the hydration kinetics process and hydration mechanismof fly ash paste filling materials. Chinese Journal of Rock Mechanics and Engineering, 37(S2), 4384–4394. DOI 10.13722/j.cnki.jrme.2017.1325. [Google Scholar] [CrossRef]
26. Yahia, A. (2011). Shear-thickening behavior of high-performance cement grouts-Influence mix-design parameters. Cement and Concrete Research, 41(3), 230–235. DOI 10.1016/j.cemconres.2010.11.004. [Google Scholar] [CrossRef]
27. Gao, R. G., Zhou, K. P., Liu, W., Ren, Q. F. (2020). Correlation between the pore structure and water retention of cemented paste backfill using centrifugal and nuclear magnetic resonance methods. Minerals, 10(7), 610. DOI 10.3390/min10070610. [Google Scholar] [CrossRef]
28. Tao, Y. J., Zhu, X. G., Tao, D. P., Deng, M. R., Zhang, X. B. (2016). Optimization of triboelectrostatic decarbonization experiment of fly ash by Design-Expert. Journal of China Coal Society, 41(2), 475–482. DOI 10.13225/j.cnki.jccs.2015.0178. [Google Scholar] [CrossRef]
29. Feng, G. R., Ren, Y. F., Zhang, X. Y., Guo, Y. X., Kang, L. X. (2011). The activating experimental research of fly ash for mining filling material in Tashan Mine. Journal of China Coal Society, 36(5), 732–737. DOI 10.13225/j.cnki.jccs.2011.05.018. [Google Scholar] [CrossRef]
30. Guo, X., Xue, S., Zheng, C. S., Li, Y. B. (2021). Experimental research on performance of new gas drainage borehole sealing material with high fluidity. Advances in Materials Science and Engineering, 2021(1), 1–12. DOI 10.1155/2021/6645425. [Google Scholar] [CrossRef]
31. Guo, X., Xue, S., Li, Y. B., Zheng, C. S., Yang, G. G. (2021). Fluidity influencing factors analysis and ratio optimization of new sealing materials based on response surface method. Geofluids, 2021(1), 1–15. DOI 10.1155/2021/5538302. [Google Scholar] [CrossRef]
 | This work is licensed under a Creative Commons Attribution 4.0 International License, which permits unrestricted use, distribution, and reproduction in any medium, provided the original work is properly cited. |