| Journal of Renewable Materials |
DOI: 10.32604/jrm.2022.018018
ARTICLE
Effect of Loading Frequency on the High Cycle Fatigue Strength of Flax Fiber Reinforced Polymer Matrix Composites
Department of Mechanical Engineering, North Dakota State University, Fargo, USA
*Corresponding Author: Chad A. Ulven. Email: Chad.Ulven@ndsu.edu
Received: 23 June 2021; Accepted: 30 August 2021
Abstract: Among natural fibers, flax fiber reinforced polymer matrix composites show excellent dynamic/fatigue properties due to its excellent damping properties. Knowledge about fatigue limit and effect of loading frequency on fatigue limit is very crucial to know before being used a member as a structural component. Fatigue limit of fiber reinforced composite is measured through high cycle fatigue strength (HCFS). The effect of loading frequency on the HCFS of flax fiber reinforced polymer matrix composites was investigated using stabilized specimen surface temperature based thermographic and dissipated energy per cycle-based approaches. Specimens of unidirectional flax fiber reinforced thermoset composites were tested under cyclic loading at different percentages of applied stresses for the loading frequencies of 5, 7, 10, and 15 Hz in order to determine the stabilized surface temperature of the specimen and dissipated energy per fatigue cycle. Both approaches predicted similar fatigue limits (HCFS) which showed a good agreement with experimental results from Literature. HCFS of flax fiber reinforced composites decrease little with increasing loading frequency. Furthermore, effect of loading frequency on stabilized specimen temperature and dissipated energy per fatigue cycle was also investigated. Although specimen surface temperature increases with loading frequency, dissipated energy per-cycle does not change with loading frequency. Thermal degradation at higher loading frequencies may play a significant role in decreasing HCFS with increasing loading frequency.
Keywords: Fiber reinforced material; fatigue limit; fatigue modelling; loading frequency; life prediction
As fatigue is a frequently encountered loading condition on structural materials, the knowledge about the fatigue limit of a material is therefore crucial [1]. The stress level at which materials can survive more than 106 fatigue cycles is defined as the fatigue limit [2]. In order to use a material for real-life high-performance applications with fluctuating loading, it is essential to have knowledge about the fatigue limit as that material should be used at a stress level under the fatigue limit. To define the applicability of material under abrupt real-life vibrational loading, it is also important to know the effect of loading frequency on fatigue life. Although loading frequency does not have a significant effect on the fatigue life for metallic materials [3–5], composite materials exhibit some effect of loading frequency on the fatigue life [6–10]. Recently natural fiber-reinforced composites have received significant attention due to their unique mechanical properties along with renewability.
Flax is the strongest among natural fibers and has significant potential to substitute synthetic fiber due to its excellent mechanical and damping properties [11]. Those fiber-reinforced composites have been widely used in the sector of automotive, aerospace, and sports equipment’s due to their high specific strength and reduced weight [12]. Moreover, flax fiber reinforced composites show excellent properties under cyclic/fatigue loading [13]. However, natural fiber-reinforced composites do not show sharp fatigue-limit like metals [14]. Hence, the fatigue limit of natural fiber-reinforced composites is defined by the term High Cycle Fatigue Strength (HCFS). HCFS is defined as the maximum stress at which material can sustain up-to 106 to 108 fatigue cycles. The fatigue limit (HCFS) of flax fiber-reinforced composite was also reported in the literature [14–17] by performing the full fatigue test. The fatigue life of flax-epoxy composites was investigated by Liang et al. [18] experimentally for different fiber orientations at a loading frequency of 5 Hz. Experimental investigation shows that HCFS for unidirectional flax fiber-reinforced composites is about 45–48% load of the ultimate tensile strength (UTS) at a loading frequency of 5 Hz [15,19]. However, performing fatigue tests until 106 to 108 is very time-consuming. Therefore, models to predict fatigue life and fatigue limit are very helpful and needed. Progressive fatigue damage models (residual strength-based, residual strain-based, stiffness degradation-based [20]) were successfully used in literature to predict the fatigue life of laminated composite materials [21,22]. As unidirectional natural fiber-reinforced composites show around a 5% increase in stiffness during cyclic loading (no stiffness degradation), hence stiffness degradation-based models are not applicable for unidirectional natural fiber-reinforced composites [18,23]. Furthermore, instead of performing full fatigue tests, different fatigue limit prediction models such as thermographic and dissipated energy-based have been successfully demonstrated in the literature to simulate HCFS of fiber-reinforced composites and therefore are the focus of this study.
Due to high viscoelastic damping and lack of proper thermal conductivity, test specimens of polymer matrix composites heat up significantly under cyclic loading. For a fixed loading frequency (5 Hz), the pattern of temperature increase at different load levels under cyclic loading for flax fiber reinforced composites was reported by Sawi et al. [15]. For all load levels, specimen temperature reached a stable value after a certain number of cycles. However, there is a lack of research showing how these temperatures increase patterns change with increasing loading frequency. Furthermore, distribution of dissipated energy-per-cycle for flax fiber reinforced composites during cyclic loading at different load levels for a fixed loading frequency was presented in the literature by Islam et al. [19], but the effect of loading frequency on the distribution of dissipated energy per cycle has not been well established so far. It is worth mentioning that, like stabilized specimen temperature, for all load levels, dissipated energy also reaches a stable value after a certain number of cycles.
A stabilized specimen surface temperature-based thermographic approach and a stabilized dissipated energy-per-cycle based approach have both been successfully used in literature to define HCFS of both synthetic and natural fiber-reinforced composites. Both thermographic and dissipated energy-per-cycle-based approaches were used by Montesano et al. [24] to define HCFS of synthetic fiber-reinforced composites (i.e., carbon fiber reinforced composites). In the authors’ previous article, they defined the fatigue limit of flax fiber reinforced epoxy composites at a loading frequency of 5 Hz using thermographic and energy-based approaches [19]. The thermographic and dissipated energy-per-cycle-based approaches are rapid and timesaving in determining HCFS accurately. However, how these fatigue limits may change due to the change of loading frequencies was not clearly defined yet in the literature. Although some studies have exhibited the effect of loading frequency on fatigue life of flax fiber-reinforced composites [14], very few studies have been attempted to find the effect of loading frequency on the change of fatigue limit. Moreover, due to inherent variation in fatigue life between specimen to specimen [25], defining fatigue limit by conducting tests until failure requires tremendous prolonged experimental efforts. As the fatigue limit of metals remains unaffected due to change of loading frequency, therefore clear information about the effect of loading frequency on the fatigue limit of composite, such as flax fiber-reinforced composites, is paramount.
In this current study, fatigue testing of flax fiber-reinforced composite is performed at different load levels and different loading frequencies to capture the stabilized specimen surface temperature and stabilized dissipated energy-per-cycle. The effect of loading frequency on the temperature increase of the specimen and dissipated energy-per-cycle is investigated. The overall goal of this study is to define the effect of loading frequency on the fatigue limit of flax fiber-reinforced composites using stabilized specimen temperature-based thermographic approach and dissipated energy-per-cycle-based approach.
In order to make specimens for fatigue testing, a panel (30 cm × 30 cm) of unidirectional flax fiber-reinforced polymer matrix composites was manufactured using vacuum-assisted resin transfer molding (VARTM). Fabric of non-crimp unidirectional flax fiber (105 tex, weft thread = 1/cm, weight = 300 gm/m2) was purchased from BComp amplitex. The Infusion epoxy resin with amide hardener (mixed resin viscosity = 129 cP and density = 1138 kg/m3 at 22°C) was used as a matrix material and the cured resin have glass transition temperature (Tg) of 85°C. Twelve layers of unidirectional flax fiber fabric were used to prepare the specimen. Post-curing was accomplished for 3 days at room temperature and 8 h at 80°C. The volume fraction of unidirectional flax fiber in each composite panel was about 50% and the void fraction of the produced board was around 4.22%. The detailed properties of these manufactured composites were also discussed in the author’s previous publication [19].
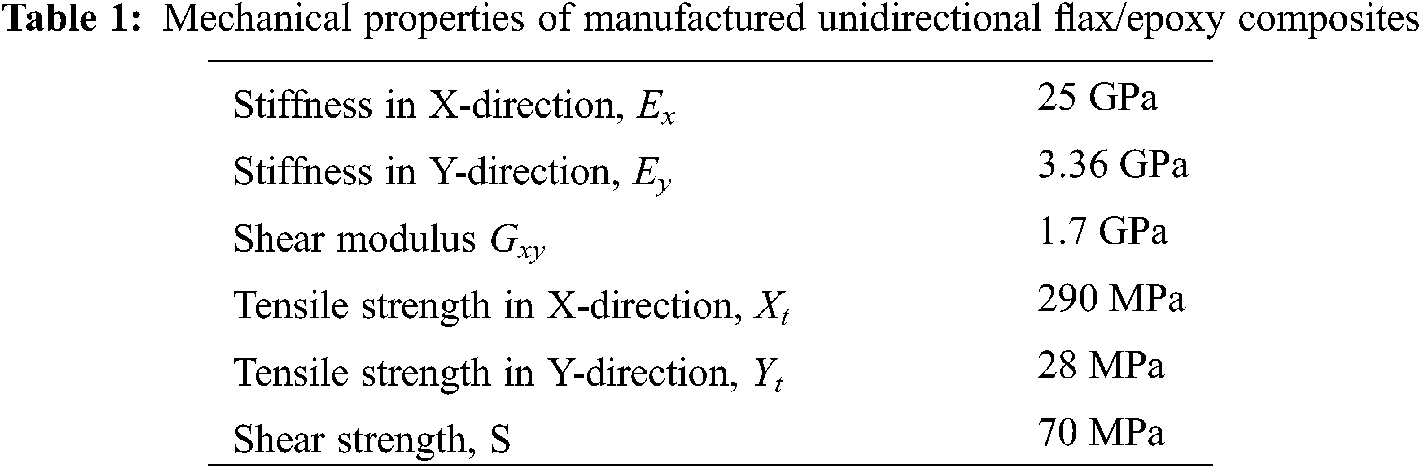
Test specimens were prepared from produced boards using a ceramic cutter according to the ASTM 3039. The specimen size was 25.4 cm (10 in.) long and 2.54 cm (1 in.) in width. Glass fiber tab of 5.71 cm (2.25 in.) long was inserted on each side of the specimen to ensure better load transfer. All tensile and fatigue tests were conducted using an MTS 250 kN servo-hydraulic load frame. Tensile tests were conducted to obtain information about the ultimate tensile strength (UTS) of the materials. Five specimens were tested under tension to determine an average strength. The average UTS of those composite was found to be 290 MPa. Moreover, different mechanical properties of these manufactured composites are listed in Table 1. Mechanical properties of similarly manufactured unidirectional flax/epoxy composites are reported by Sawi et al. [26]. Fatigue tests were conducted at different percentages of the ultimate tensile strength of the materials. Load variation during fatigue/cyclic loading was sinusoidal. Minimum applied stress during fatigue loading is 10% of the maximum applied stress, which is defined as loading ratio, R = 0.1.
To define the effect of loading frequency on the fatigue limit through high cycle fatigue strength (HCFS) of flax fiber-reinforced composites, fatigue tests were conducted at different percentages of applied stress for the loading frequencies of 5, 7, 10, and 15 Hz. All tensile and fatigue tests were conducted at room temperature (∼22°C) and under controlled humidity conditions. Due to the viscoelastic nature of natural fiber and resin, the specimen’s temperature increased significantly during cyclic loading. A thermal IR camera (FLIR C2, range: −10°C to 150°C, sensitivity: ±2°C) was used to capture the temperature distribution of each specimen during cyclic loading. Three specimens were tested under fatigue loading for each case to capture the temperature distribution during cyclic loading. The uniqueness in temperature increase pattern between specimen to specimen was reported in the authors’ previously published research article [19]. Thermal images of the specimens were captured after certain time intervals/cycle-completed using the software Research IR (FLIR Systems Inc., USA). Because the temperature of the specimen was not uniform throughout, the temperature at the center of each specimen (maximum temperature) was recorded for plotting the temperature distribution. Fig. 1 shows the experimental set-up for the fatigue test along with the temperature measurement system using IR camera. Both thermographic and energy dissipation per cycle-based approach were used to define HCFS of flax fiber-reinforced polymer matrix composites at those loading frequencies. To determine the dissipated energy per fatigue cycle force and elongation data was captured during cyclic loading with a data acquisition frequency that endures around 102 data points per fatigue cycle.
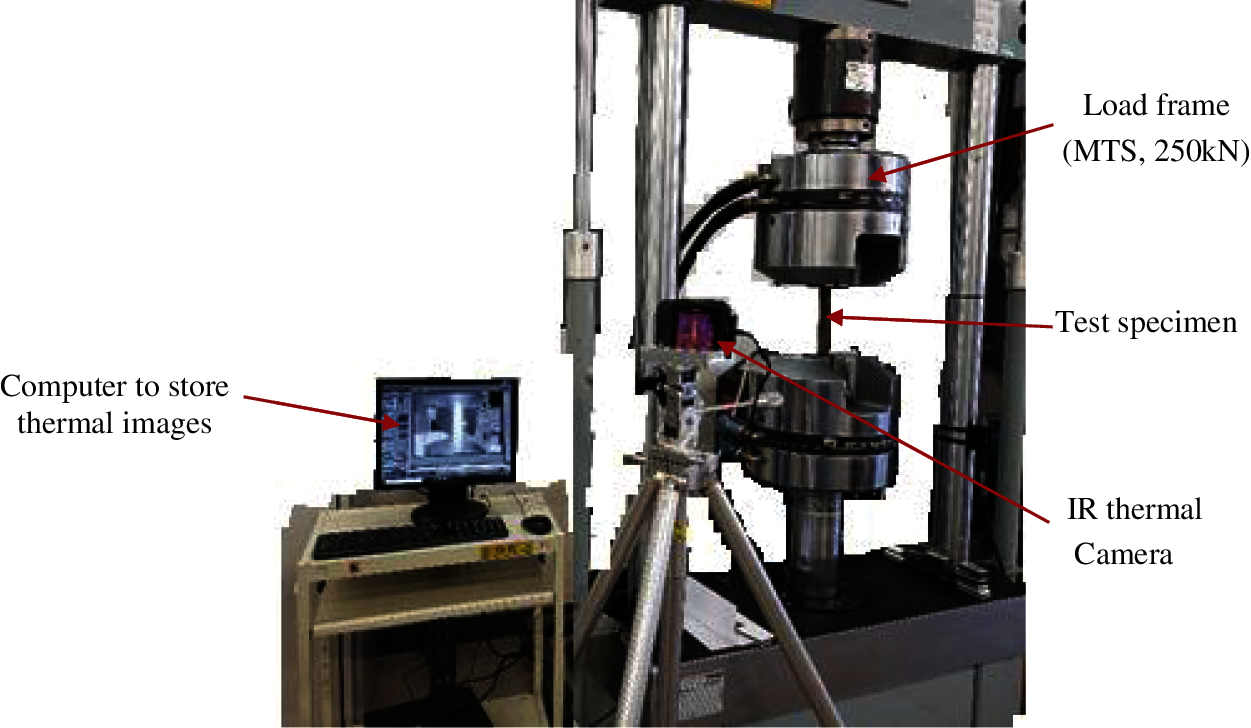
Figure 1: Experimental set-up of fatigue test with temperature measurement using thermal camera
Because of the sliding friction between fibers and matrix, the temperature of the specimen increases during cyclic loading. Fig. 2 shows the temperature distribution of the specimen during cycling loading for different percentages of applied stress at the loading frequencies of 5, 7, 10, and 15 Hz. In all cases, initially the temperature of the specimen increases rapidly, and the temperature of the specimen becomes stable after a certain number of cycles. As shown in Eq. (1), the temperature of the specimen become stabilized due to the thermal equilibrium between the generated heat during cyclic loading (Hgenerated, J/s) and heat transfer (by conduction, convection, and radiation) from the specimen to the surrounding (Htransferred, J/s). At higher percentages of applied stress, temperature shows a peak and then becomes stable afterward. Fig. 2 also depicts that, at higher percentages of applied stress, the specimen takes more time or cycles to reach a stable temperature. Those temperature peaks may correspond to a high damage rate during some initial fatigue cycles at a higher percentage of applied stress. Damage evolution during cyclic loading has a direct relation with temperature increase [27]. This trend was observed at all loading frequencies. During temperature stabilization, specimen temperature shows a small oscillatory variation due to the thermoelastic effect [27]. This thermoelastic effect/oscillatory temperature variation is very low at a lower percentage of applied stresses but comparatively high at a higher percentage of applied stresses.

Figure 2: Temperature distribution of the specimen tested under cyclic loading at 40%, 50%, and 60% load of UTS (a) at loading frequency = 5 Hz (b) at loading frequency = 7 Hz (c) at loading frequency = 10 Hz (d) at loading frequency= 15 Hz
Fig. 3 shows the effect of loading frequency on the stabilized temperature during cyclic loading, which was also shown in our previous research article [28]. For the same percentage of applied stress (i.e., 50% UTS), the specimen becomes stable at a significantly higher temperature at the higher loading frequency. This is may be attributed to the sliding friction between fiber and matrix. Suppose, heat energy generated in a single fatigue cycle = H1 Joule. The heat energy generated per unit time, Hgenerated = H1 × f J/sec, where f = loading frequency (cycles/second). Hence, Hgenerated increases with loading frequency. Furthermore, because of the application of sinusoidal force on the specimen, the specimen also oscillates sinusoidally during cyclic loading. Assume, x = range of the specimen oscillation during cyclic loading at a certain percentage of applied stress; hence, the velocity of the specimen oscillation during cyclic loading = 2xf, where f = loading frequency (cycles/second) during cyclic loading. Here, x only depends on applied stress (not on loading frequency). Therefore, for a certain percentage of applied stress, the velocity of oscillation increases linearly with loading frequency. Heat energy generation in a single fatigue cycle (H1) due to interlaminar sliding friction might increase with the increase of velocity of oscillation (Heat ∝ Velocity). Hence, H1 also increases with increasing loading frequency. On the other hand, heat energy transferred from the specimen to the surrounding (Htransferred) is proportional to the surface temperature of the specimen. As mentioned before, during the stabilized surface temperature of the specimen, Hgenerated must have to be equal to the Htransferred. As
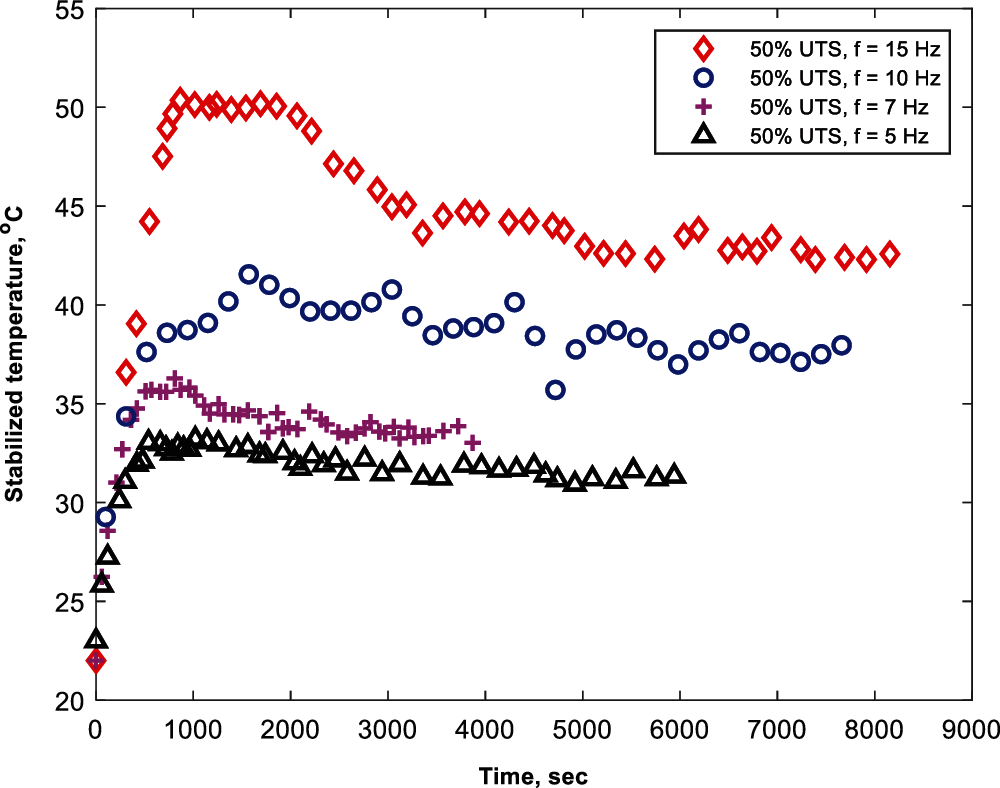
Figure 3: Temperature distribution of the specimen tested at loading frequency of 5, 7, 10, and 15 Hz for a fixed load level (50% load of UTS)
Fig. 3 also exhibits that, for the same percentages of applied stress with the increase of loading frequency, the specimen needs a greater number of cycles to reach stabilized temperature. It is worthy to mention that, in Fig. 3 temperature evolution is plotted with respect to time (cycle = time × f). As heat transfer (Htransferred) is a function of time, therefore at higher loading frequency material needs significantly a greater number of fatigue cycles to get stabilized temperature. At higher loading frequency the temperature peak was also observed at lower percentages of applied stress.
The force-displacement diagram of a single fatigue cycle consists of a loop having loading and an unloading portion. These loops are called Hysteresis-loop [29]. The area under the hysteresis loop represents the dissipated energy during one single fatigue cycle [30]. Fig. 4 shows the distribution of the dissipated energy per cycle during the cyclic loading at different percentages of applied stresses on the specimen (40%, 50%, 60% load of UTS) for the loading frequencies of 5, 7, 10, and 15 Hz. For all cases, dissipated energy per cycle exhibited a decrease during few initial fatigue cycles and then reduce to a stable value with some small oscillatory fluctuations. A Similar trend of dissipated energy per cycle for flax fiber reinforced thermoplastic composite was reported by Haggui et al. [30]. Development of many distributed micro-crack and the reorientation of elementary micro-fibrils happens within the specimen during some initial fatigue cycles. Stiffness of the flax fibers increases with the re-orientation of elementary microfibrils (cyclically harden). As material becomes cyclically harden (range of oscillation (x) will decrease during cyclic loading), dissipated energy per cycle therefore exhibited a decrease during some initial fatigue cycles.
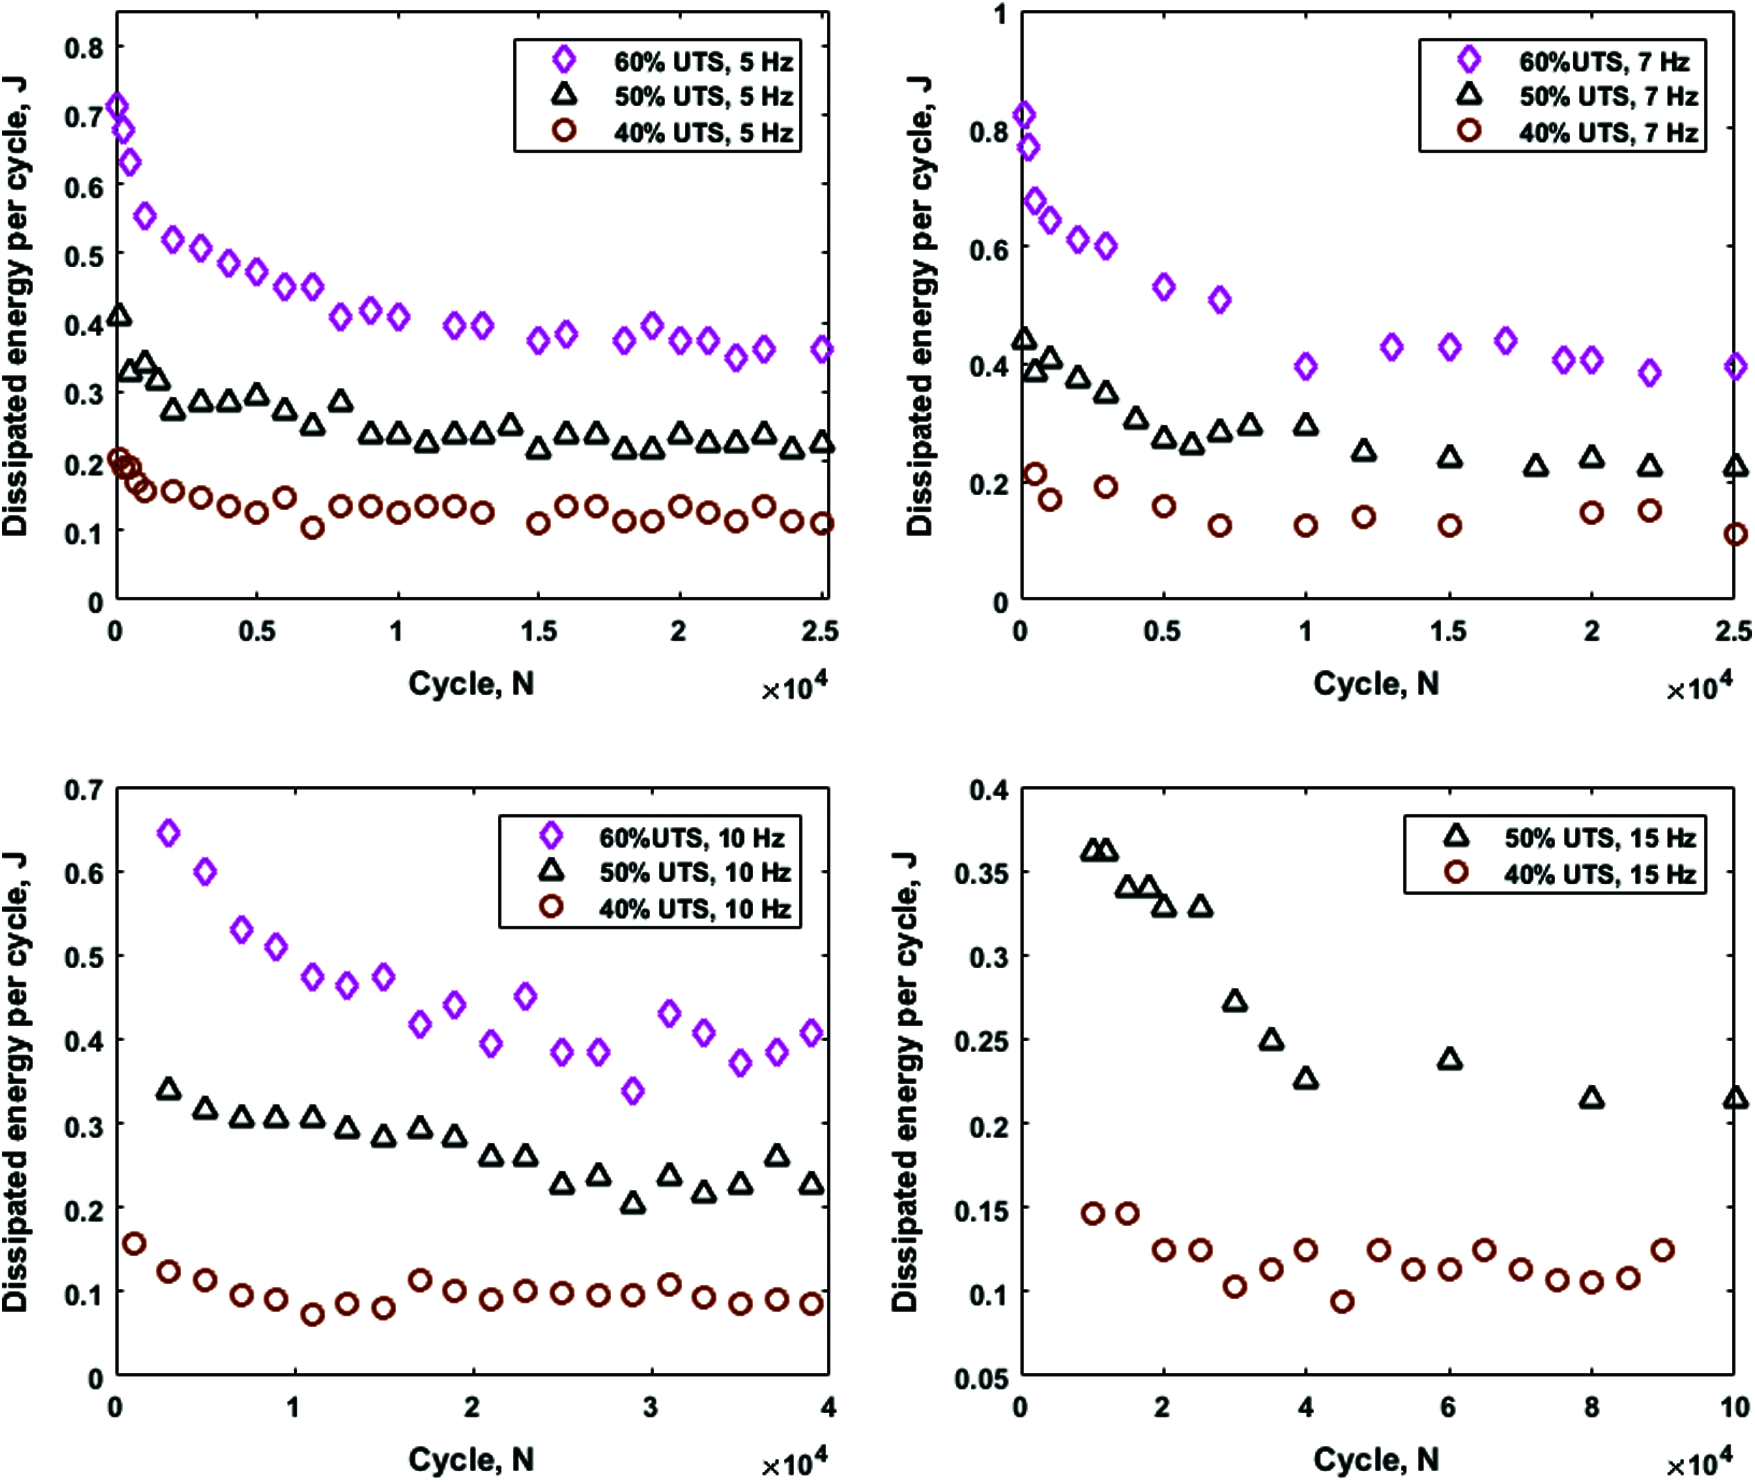
Figure 4: Distribution of dissipated energy per cycle at 40%, 50%, and 60% load of UTS (a) at loading frequency = 5 Hz, (b) at loading frequency = 7 Hz, (c) at loading frequency = 10 Hz, (d) at loading frequency = 15 Hz
Furthermore, Fig. 4 also exhibited, dissipated energy per cycle increases with the increase of the percentage of applied stress. Dissipated (intrinsic) energy-per-cycle consists of internal friction (generate heat) and microplastic deformation (crack formation). As mentioned before, internal friction increases with applied stresses. Although microplastic deformation is negligible at a stress level below the fatigue limit, but becomes significant at a stress level above the fatigue limit. At stress levels above the fatigue limit, microplastic deformation increases with applied stress [31]. Hence, the dissipated energy per cycle increases with applied stress.
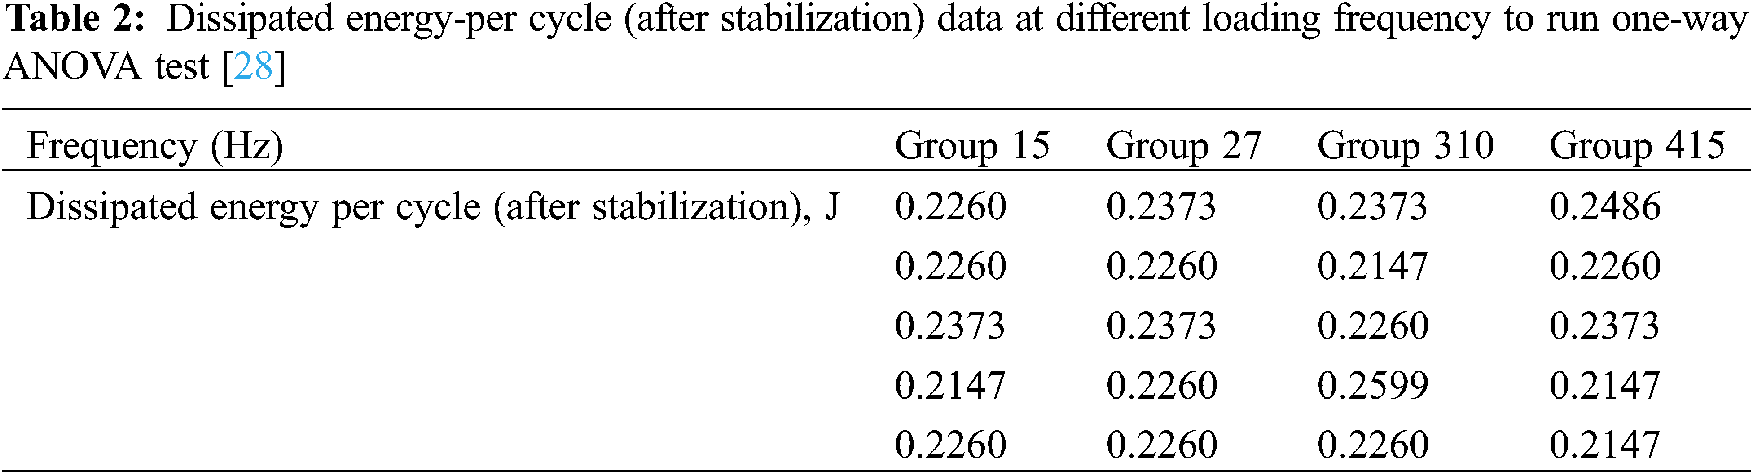
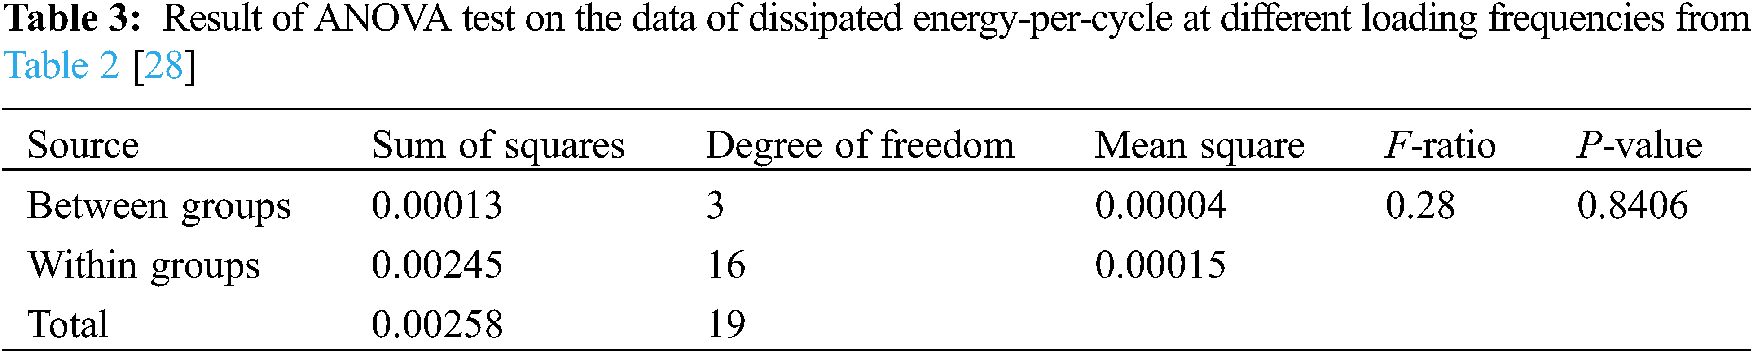
As shown in Fig. 5, at the same percentage of applied stress (e.g., 50% load of UTS), the dissipated energy per cycle does not change significantly due to the change of the loading frequency. For the 50% load of UTS, dissipated energy per cycle is almost the same at 5, 7, 10, 15 Hz of loading frequencies. Although stabilized temperature increases significantly with increasing loading frequency, dissipated energy per cycle during cyclic loading varies little with loading frequency. A one-way ANOVA test was conducted on the data of dissipated energy per cycle at different loading frequencies. Table 2 shows five data points of stabilized dissipated energy per cycle at each loading frequency, which was used for the one-way ANOVA test. Table 3 shows the results of ANOVA test. As p = 0.8406 ≫ 0.05, the null hypothesis (means are equal) is accepted at the 5% level of significance that, there is no significant difference between the mean of total dissipated energy-per-cycle at different loading frequencies. As discussed in Section 3.1, for a certain percentage of applied stress, the range of oscillation of the specimen (x) does not change with changing loading frequency. Because of the fixed range of oscillation, dissipated energy per cycle is not changing with the change of loading frequency.
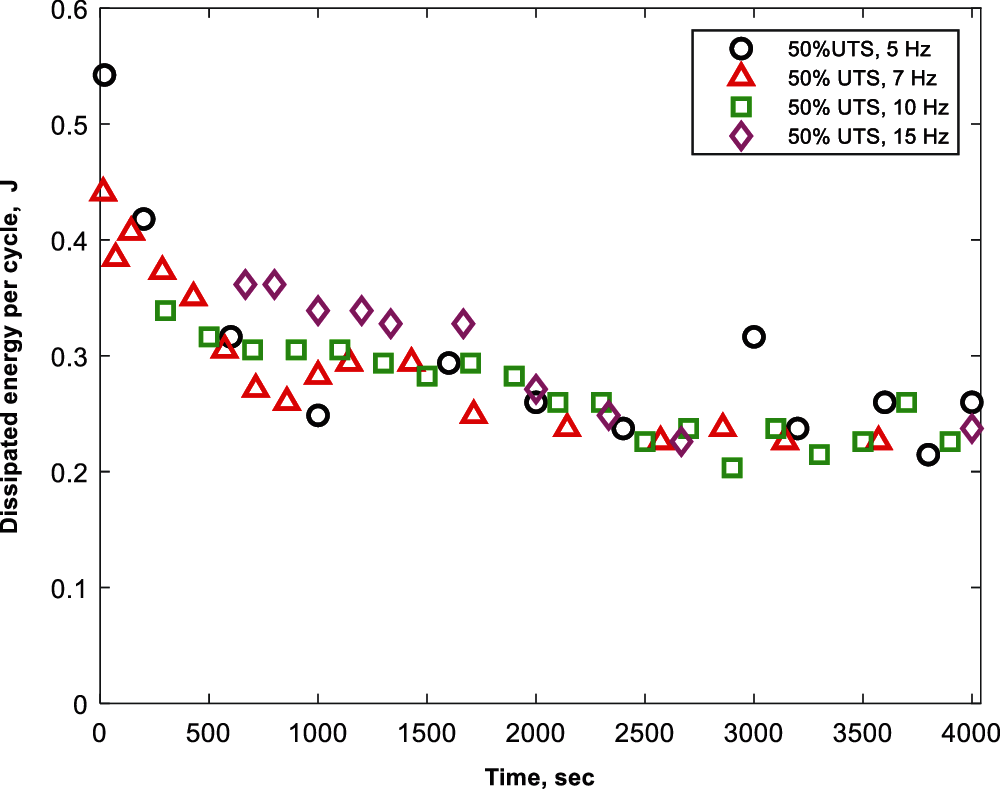
Figure 5: Distribution of dissipated energy-per-cycle for specimen tested at loading frequencies of 5, 7, 10, and 15 Hz under a fixed load level (50% load of UTS)
3.3 Thermographic Approach for HCFS
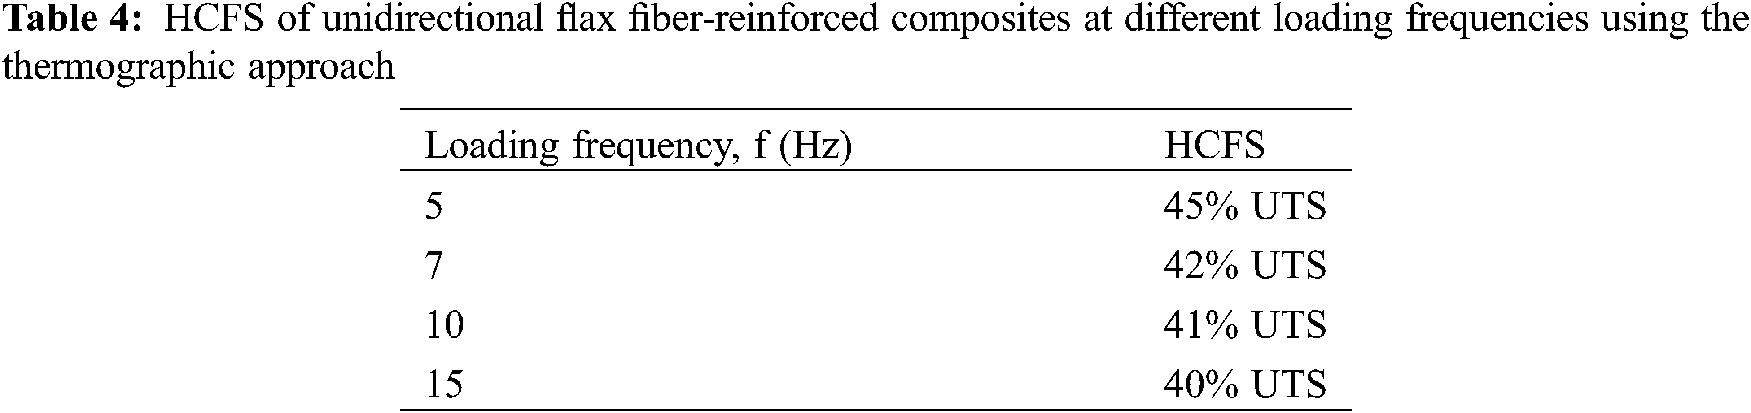
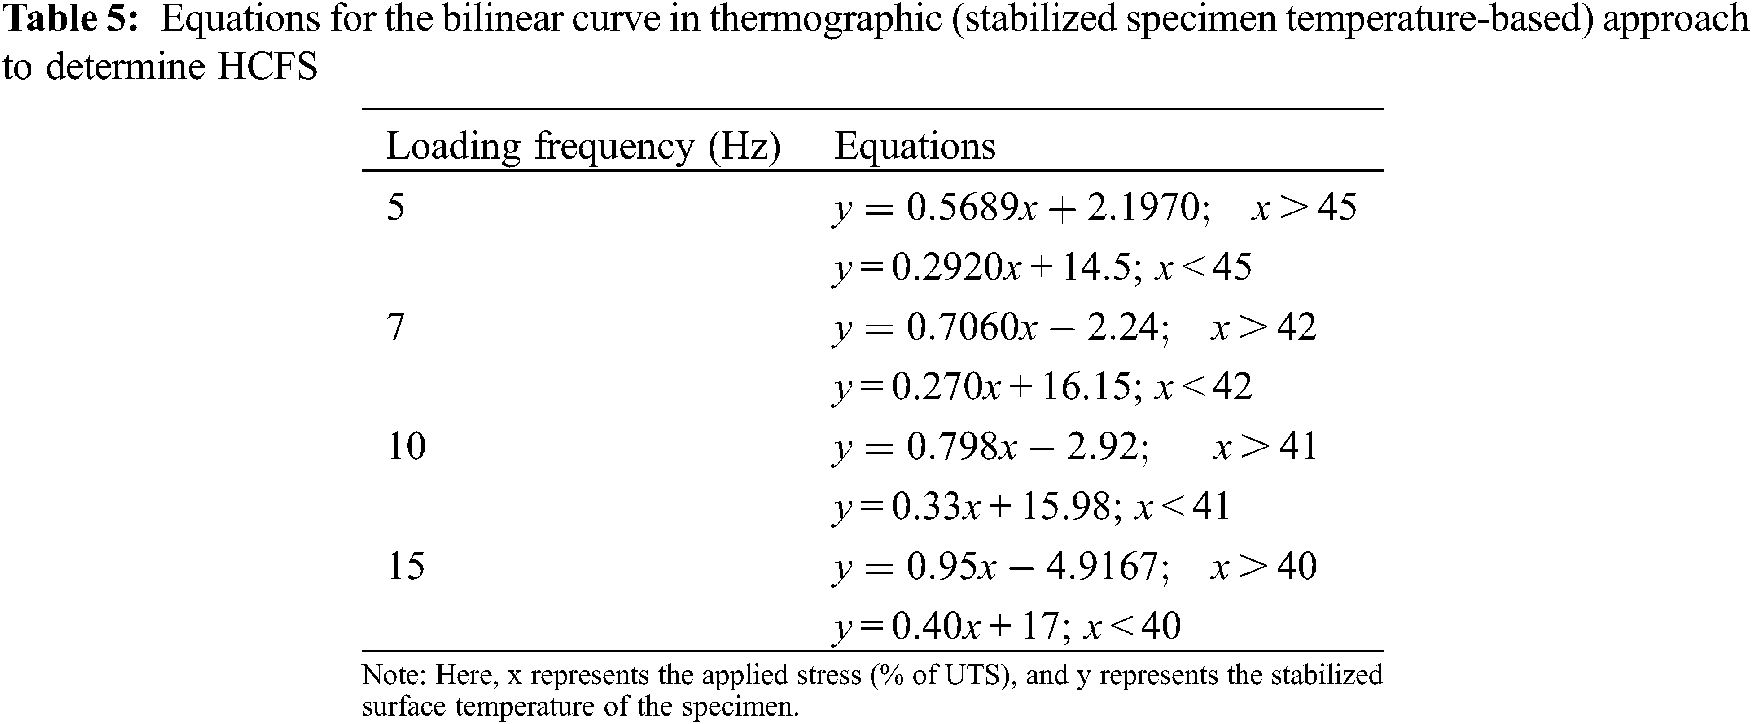
Fig. 6 compares the stabilized surface temperature of the specimen during cyclic loading with different percentages of applied stress for the loading frequencies of 5, 7, 10, and 15 Hz. For all the loading frequencies stabilized temperature shows a bilinear behavior with an inflection point. Those inflection points represent HCFS. Determination of HCFS from the inflection point of stabilized temperature was well established in the literature for both metals and composites materials [15,24,32]. Moreover, fatigue is a process of gradual cumulative damage evolution within the specimen. Damage evolution per cycle shows a jump at stress level above fatigue limit. As mentioned before, damage evolution during cyclic loading has a direct relation with temperature increase [27]. Hence, stabilized temperature also exhibited a rapid increase after the fatigue limit with showing an inflection point. It is clear from Fig. 6 that HCFS is decreasing slowly with increasing loading frequency. Table 4 also shows the HCFS of unidirectional flax fiber-reinforced composites using the thermographic approach for loading frequencies of 5, 7, 10, and 15 Hz. As the loading frequency changes from 5 to 15 Hz, HCFS changes from 45% load of UTS to 40% load of UTS. Furthermore, Table 5 shows the equation for the bilinear straight lines shown in Fig. 6. The slope of those straight lines is demonstrating an increasing trend with increasing loading frequency.

Figure 6: Thermographic approach to define fatigue limit (HCFS) at (a) loading frequency = 5 Hz, (b) loading frequency = 7 Hz, (c) loading frequency = 10 Hz, (d) loading frequency = 15 Hz
3.4 Dissipated Energy per Cycle-Based Approach for HCFS
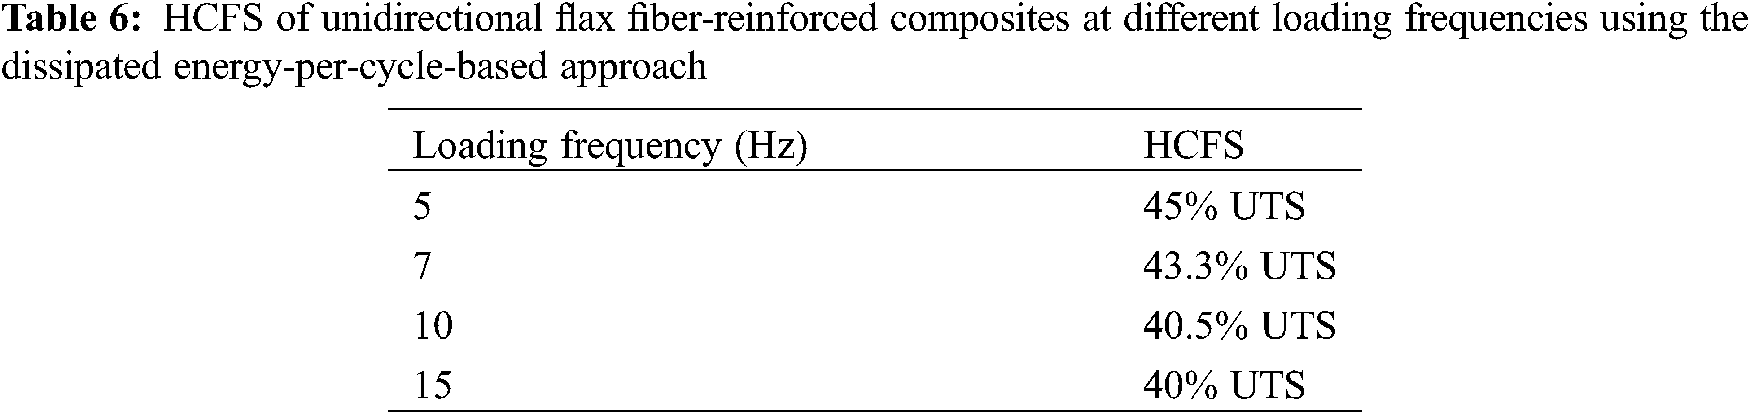
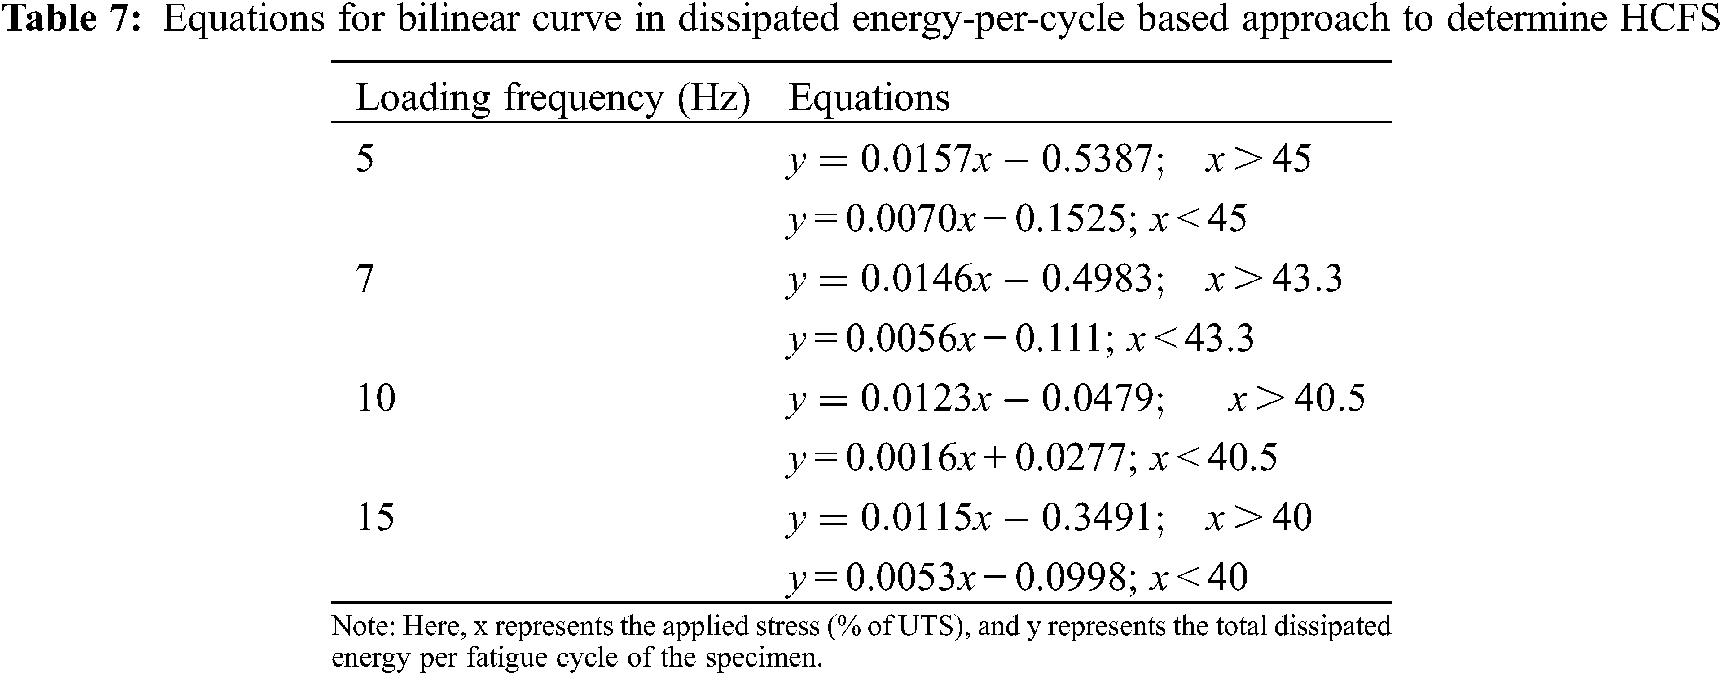
Fig. 7 compares the dissipated energy per cycle during cyclic loading with different percentages of applied stress for the loading frequencies of 5, 7, 10, and 15 Hz. Like stabilized temperature, those comparisons also indicate a bilinear behavior with an inflection point. These inflection points also represent the HCFS. This approach of determining HCFS from dissipated energy per cycle was also implemented before by Montesano et al. [24] for carbon fiber reinforced composites. As mentioned in Section 3.2, microplastic deformation increases rapidly after the fatigue limit. Hence, dissipated energy per cycle also exhibited a sharp increase after the fatigue limit. This dissipated energy-based approach also provides similar results to the HCFS like the stabilized temperature-based approach. Table 6 shows the HCFS at different loading frequencies using dissipated energy per cycle-based approach, which is almost similar to the HCFS using the thermographic approach shown in Table 4. Moreover, Table 7 exhibits the equations for those bilinear curves which may enable one to infer total dissipated energy per cycle at any arbitrary percentages of applied stress.

Figure 7: Dissipated energy per cycle (after stabilization) based approach to define fatigue limit (HCFS) at (a) loading frequency = 5 Hz, (b) loading frequency = 7 Hz, (c) loading frequency = 10 Hz, (d) loading frequency = 15 Hz
3.5 Linear Relation between Temperature and Dissipated Energy
Fig. 8 exhibits the linear relationship between stabilized temperature and dissipated energy per cycle for the loading frequencies of 5, 7, 10, and 15 Hz. As a linear relation exists between stabilized specimen temperature and dissipated energy-per-cycle during the cyclic loading, HCFS can therefore be determined by using either of them.
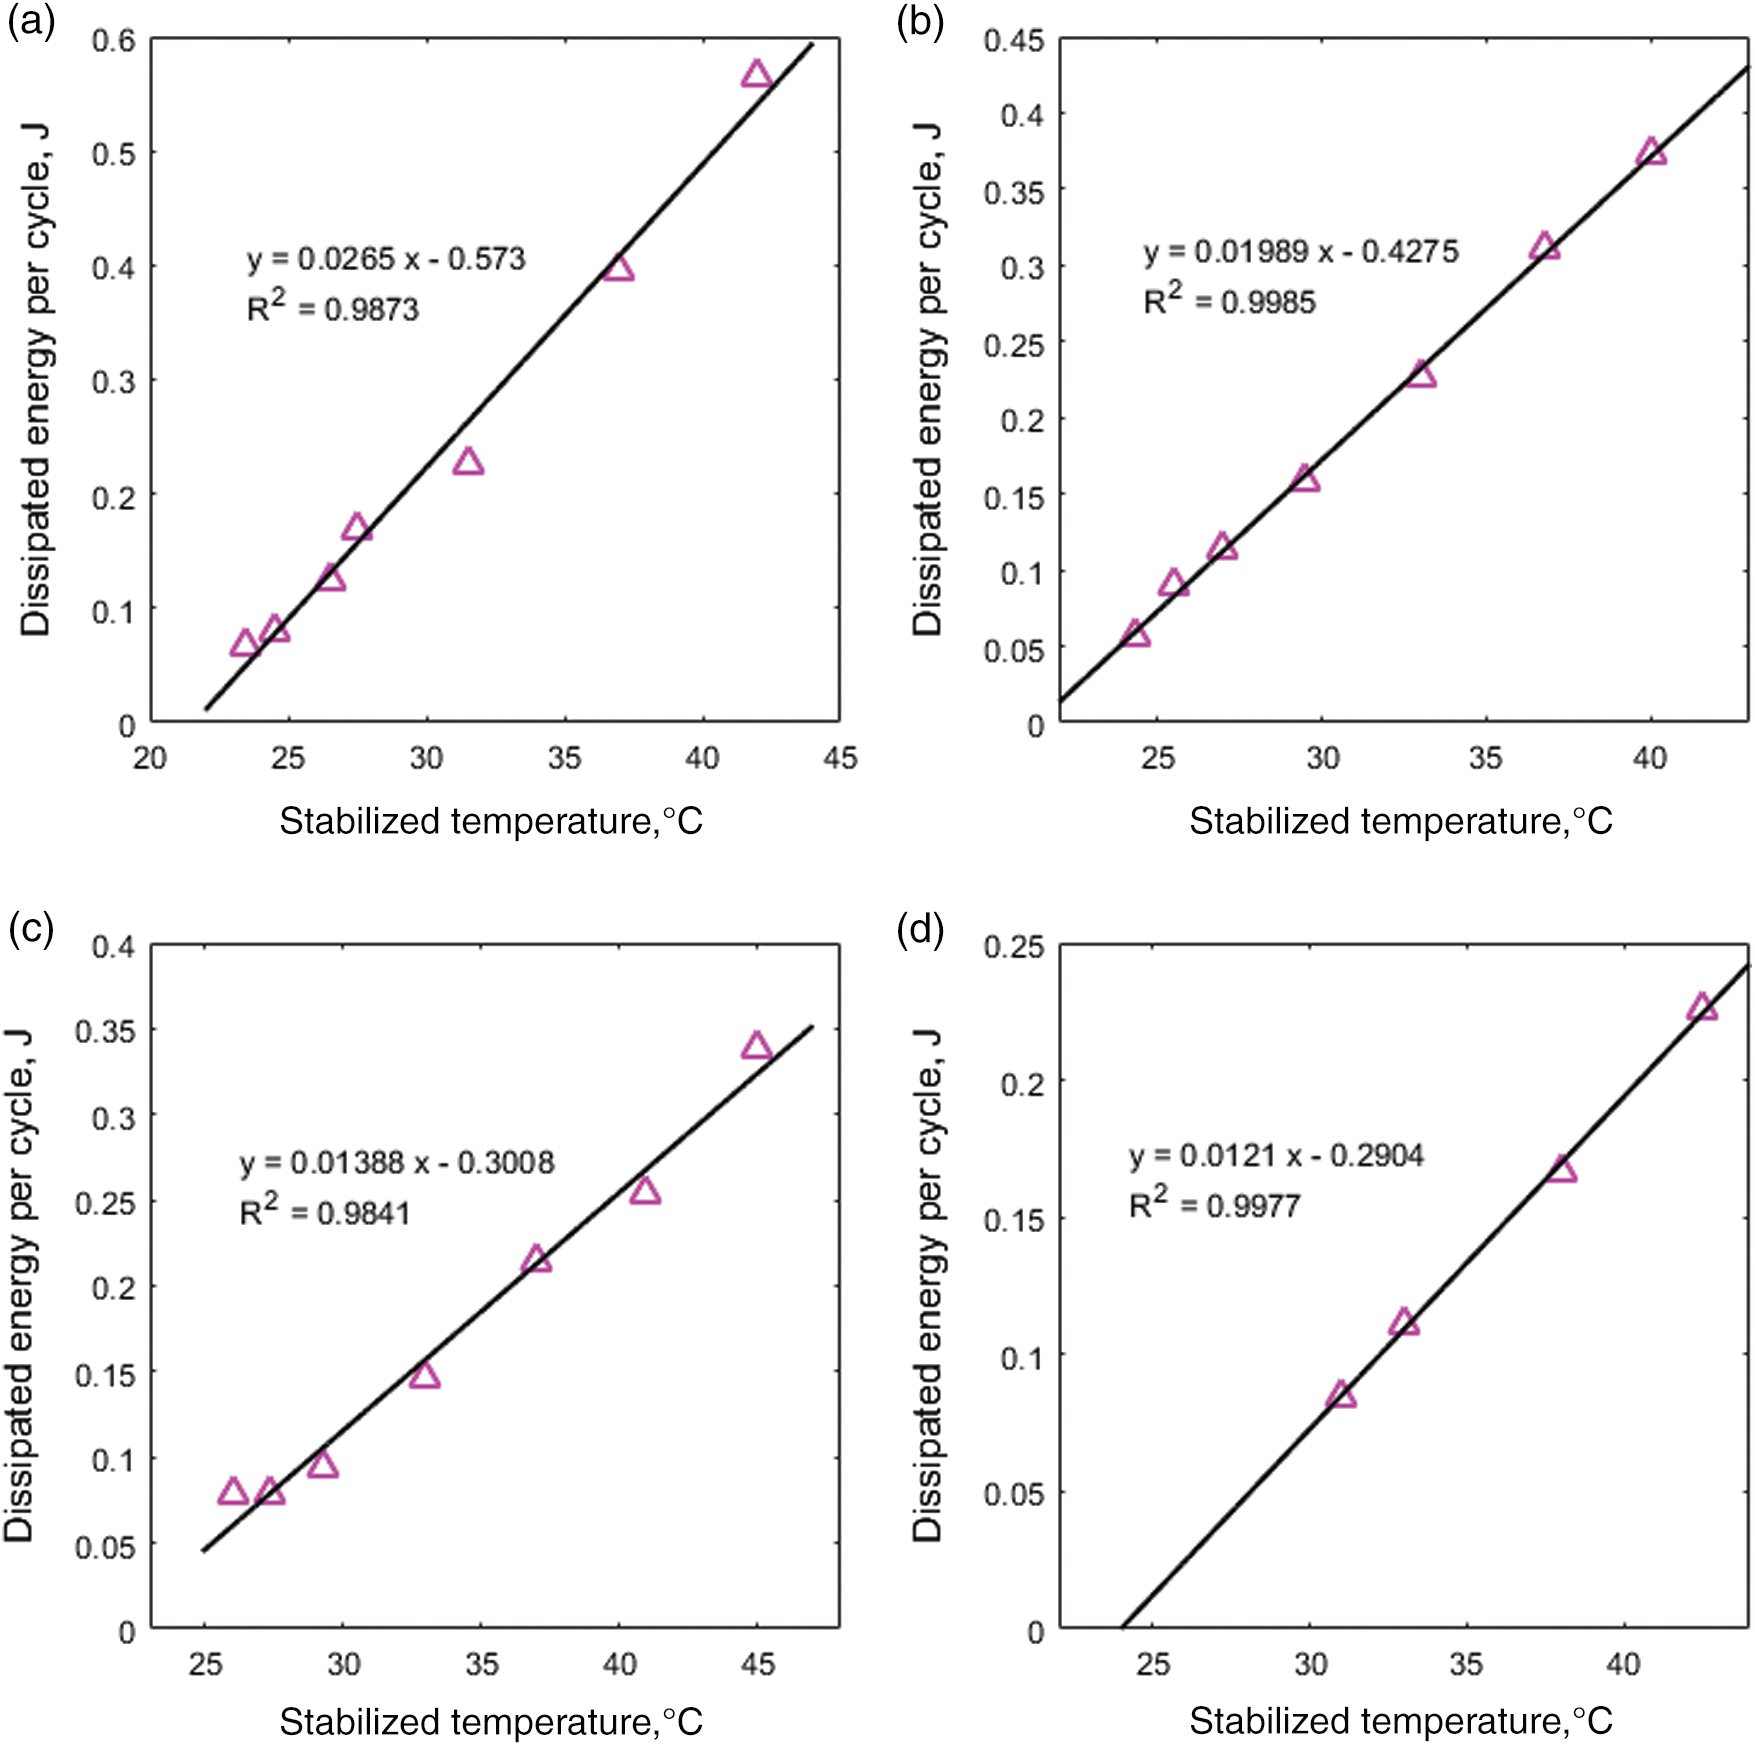
Figure 8: Linear relation between stabilized temperature and dissipated energy-per-cycle at (a) loading frequency = 5 Hz, (b) loading frequency = 7 Hz, (c) loading frequency = 10 Hz, (d) loading frequency = 15 Hz
3.6 General Relation between Loading Frequency and HCFS
In Sections 3.3 and 3.4, high cycle fatigue strength (HCFS) of unidirectional flax-fiber reinforced epoxy composites were calculated based on both thermographic and dissipated energy-based approaches at the loading frequency of 5, 7, 10, and 15 Hz. In this section, HCFS calculated in both approaches were compared with the loading frequencies (Fig. 9). A generalized power-law fitting curve (y = 53.24x−0.1118) is also proposed to exhibit the relation between loading frequency and HCFS for unidirectional flax fiber-reinforced thermoset composites. In the generalized power law equation, y = HCFS in the percentage of UTS, and x = Loading frequency in Hz. The accuracy of this power-law fit is also evaluated by measuring R2, which was determined to be equal to 0.8835.
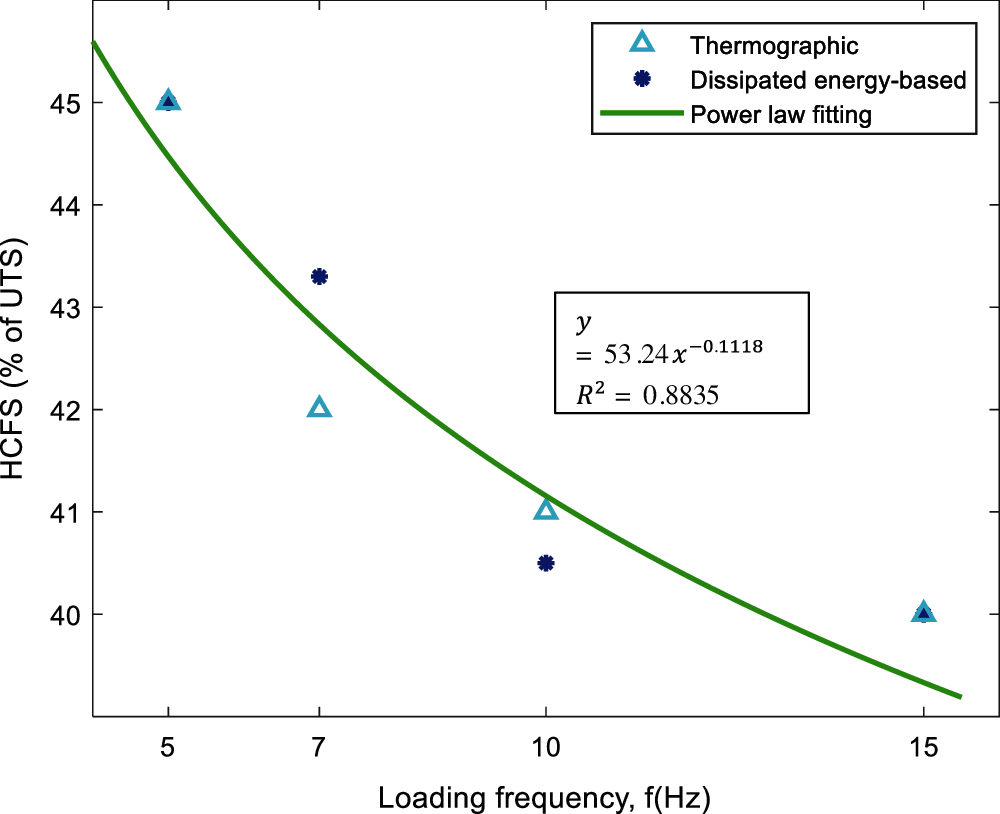
Figure 9: Power-law general relation between loading frequency and HCFS for unidirectional flax fiber-reinforced composites
The fatigue limit of unidirectional flax fiber reinforced epoxy composites decreases with increasing loading frequency. However, the surface temperature of the specimen tested at higher loading frequency was significantly higher than the specimens tested at lower loading frequency. Besides the effect of fatigue, this higher surface temperature also plays a role in reducing the fatigue limit. As shown in Eq. (2), total dissipated energy per unit time
Combining Eqs. (2) and (3), and considering
Both thermographic and dissipated energy-per-cycle-based approaches exhibited that the HCFS of unidirectional flax fiber-reinforced polymer matrix composites changes from 45% load of UTS to 40% load of UTS due to the change in loading frequency from 5 to 15 Hz. As expected, HCFS decreases with increasing loading frequency, but the amount of decrease is little compared to the change of loading frequency. Furthermore, for the same percentages of applied stresses, dissipated energy per cycle does not change with changing loading frequency. However, for the same percentages of applied stress, specimen surface temperature shows a significant increase with increasing loading frequency. These thermal degradations due to high specimen temperature at higher loading frequency may play a significant role in decreasing HCFS at higher loading frequency. Material that is not continuously loaded with higher loading frequency may not encounter thermal degradation in real-life applications. Therefore, the effect of loading frequency on HCFS would be more insignificant if the thermal degradation of the specimen could be separated from the fatigue damage. Knowledge about HCFS of flax fiber-reinforced composites at higher loading frequency may help to create a new era of using flax fiber-reinforced composites under high-frequency cyclic loading.
Funding Statement: This work was supported by the NSF ND EPSCoR [Award #IIA-1355466].
Conflicts of Interest: The authors declare that they have no conflicts of interest to report regarding the present study.
1. Sørensen, B. F., Goutianos, S. (2019). Micromechanical model for prediction of the fatigue limit for unidirectional fibre composites. Mechanics of Materials, 131, 169–187. DOI 10.1016/j.mechmat.2019.01.023. [Google Scholar] [CrossRef]
2. Sørensen, B. F., Goutianos, S. (2018). Prediction of fatigue limit for unidirectional carbon fibre/epoxy composites. IOP Conference Series: Materials Science and Engineering, Roskilde, pp. 12017. Denmark, IOP Publishing. DOI 10.1088/1757-899X/388/1/012017. [Google Scholar] [CrossRef]
3. Duan, Y., Griggs, J. A. (2018). Effect of loading frequency on cyclic fatigue lifetime of a standard-diameter implant with an internal abutment connection. Dental Materials, 34, 1711–1716. DOI 10.1016/j.dental.2018.09.001. [Google Scholar] [CrossRef]
4. Mayer, H., Papakyriacou, M., Pippan, R., Stanzl-Tschegg, S. (2001). Influence of loading frequency on the high cycle fatigue properties of AlZnMgCu1.5 aluminum alloy. Materials Science and Engineering: A, 314, 48–54. DOI 10.1016/S0921-5093(00)01913-4. [Google Scholar] [CrossRef]
5. Marines, I., Dominguez, G., Baudry, G., Vittori, J. F., Rathery, S. et al. (2003). Ultrasonic fatigue tests on bearing steel AISI-SAE 52100 at frequency of 20 and 30 kHz. International Journal of Fatigue, 25, 1037–1046. DOI 10.1016/S0142-1123(03)00161-0. [Google Scholar] [CrossRef]
6. Dally, J., Broutman, L. (1967). Frequency effects on the fatigue of glass reinforced plastics. Journal of Composite Materials, 1, 424–442. DOI 10.1177/002199836700100410. [Google Scholar] [CrossRef]
7. Curtis, D., Moore, D., Slater, B., Zahlan, N. (1987). Fatigue testing of multi-angle laminates of CF/PEEK. Composites, 19(6), 40–50. DOI 10.1016/0010-4361(88)90702-1. [Google Scholar]
8. Růžek, R., Kadlec, M., Petrusová, L. (2018). Effect of fatigue loading rate on lifespan and temperature of tailored blank C/PPS thermoplastic composite. International Journal of Fatigue, 113, 253–263. DOI 10.1016/j.ijfatigue.2018.04.023. [Google Scholar] [CrossRef]
9. de Moraes, D. V. O., Magnabosco, R., Donato, G. H. B., Bettini, S. H. P., Antunes, M. C. (2015). Influence of loading frequency on the fatigue behaviour of coir fibre reinforced PP composite. Polymer Testing, 41, 184–190. DOI 10.1016/j.polymertesting.2014.12.002. [Google Scholar] [CrossRef]
10. Sun, C., Chan, W. (1979). Frequency effect on the fatigue life of a laminated composite. Composite Materials: Testing and Design (Fifth Conference), ASTM International, STP 674, 418-430, New Orleans, LA, USA. [Google Scholar]
11. Gassan, J. (2002). A study of fibre and interface parameters affecting the fatigue behaviour of natural fibre composites. Composites Part A: Applied Science and Manufacturing, 33, 369–374. DOI 10.1016/S1359-835X(01)00116-6. [Google Scholar] [CrossRef]
12. Fallahi, H., Taheri-Behrooz, F., Asadi, A. (2020). Nonlinear mechanical response of polymer matrix composites: A review. Polymer Reviews, 60, 42–85. DOI 10.1080/15583724.2019.1656236. [Google Scholar] [CrossRef]
13. Liang, S., Gning, P. B., Guillaumat, L. (2012). A comparative study of fatigue behaviour of flax/epoxy and glass/epoxy composites. Composites Science and Technology, 72, 535–543. DOI 10.1016/j.compscitech.2012.01.011. [Google Scholar] [CrossRef]
14. Jeannin, T., Gabrion, X., Ramasso, E., Placet, V. (2019). About the fatigue endurance of unidirectional flax-epoxy composite laminates. Composites Part B: Engineering, 165, 690–701. DOI 10.1016/j.compositesb.2019.02.009. [Google Scholar] [CrossRef]
15. Sawi, E., Fawaz, I., Zitoune, Z., Bougherara, R. H. (2014). An investigation of the damage mechanisms and fatigue life diagrams of flax fiber-reinforced polymer laminates. Journal of Materials Science, 49, 2338–2346. DOI 10.1007/s10853-013-7934-0. [Google Scholar] [CrossRef]
16. Shah, D. U., Schubel, P. J., Clifford, M. J., Licence, P. (2013). Fatigue life evaluation of aligned plant fibre composites through S-N curves and constant-life diagrams. Composites Science and Technology, 74, 139–149. DOI 10.1016/j.compscitech.2012.10.015. [Google Scholar] [CrossRef]
17. Sodoke, F. K., Toubal, L., Laperrière, L. (2016). Hygrothermal effects on fatigue behavior of quasi-isotropic flax/epoxy composites using principal component analysis. Journal of Materials Science, 51, 10793–10805. DOI 10.1007/s10853-016-0291-z. [Google Scholar] [CrossRef]
18. Liang, S., Gning, P. B., Guillaumat, L. (2014). Properties evolution of flax/epoxy composites under fatigue loading. International Journal of Fatigue, 63, 36–45. DOI 10.1016/j.ijfatigue.2014.01.003. [Google Scholar] [CrossRef]
19. Islam, M. Z., Ulven, C. A. (2020). A thermographic and energy based approach to define high cycle fatigue strength of flax fiber reinforced thermoset composites. Composites Science and Technology, 196, 108233. DOI 10.1016/j.compscitech.2020.108233. [Google Scholar] [CrossRef]
20. Samareh-Mousavi, S. S., Taheri-Behrooz, F. (2020). A novel creep-fatigue stiffness degradation model for composite materials. Composite Structures, 237, 111955. DOI 10.1016/j.compstruct.2020.111955. [Google Scholar] [CrossRef]
21. Samareh-Mousavi, S. S., Mandegarian, S., Taheri-Behrooz, F. (2019). A nonlinear FE analysis to model progressive fatigue damage of cross-ply laminates under pin-loaded conditions. International Journal of Fatigue, 119, 290–301. DOI 10.1016/j.ijfatigue.2018.10.010. [Google Scholar] [CrossRef]
22. Mandegarian, S., Taheri-Behrooz, F. (2020). A general energy based fatigue failure criterion for the carbon epoxy composites. Composite Structures, 235, 111804. DOI 10.1016/j.compstruct.2019.111804. [Google Scholar] [CrossRef]
23. Shah, D. U. (2016). Damage in biocomposites: Stiffness evolution of aligned plant fibre composites during monotonic and cyclic fatigue loading. Composites Part A: Applied Science and Manufacturing, 83, 160–168. DOI 10.1016/j.compositesa.2015.09.008. [Google Scholar] [CrossRef]
24. Montesano, J., Fawaz, Z., Bougherara, H. (2013). Use of infrared thermography to investigate the fatigue behavior of a carbon fiber reinforced polymer composite. Composite Structures, 97, 76–83. DOI 10.1016/j.compstruct.2012.09.046. [Google Scholar] [CrossRef]
25. Zhao, X., Wang, X., Wu, Z., Keller, T., Vassilopoulos, A. P. (2018). Effect of stress ratios on tension-tension fatigue behavior and micro-damage evolution of basalt fiber-reinforced epoxy polymer composites. Journal of Materials Science, 53, 9545–9556. DOI 10.1007/s10853-018-2260-1. [Google Scholar] [CrossRef]
26. Sawi, I. E., Bougherara, H., Zitoune, R., Fawaz, Z. (2014). Influence of the manufacturing process on the mechanical properties of flax/epoxy composites. Journal of Biobased Materials and Bioenergy, 8, 69–76. DOI 10.1166/jbmb.2014.1410. [Google Scholar] [CrossRef]
27. Toubal, L., Karama, M., Lorrain, B. (2006). Damage evolution and infrared thermography in woven composite laminates under fatigue loading. International Journal of Fatigue, 28, 1867–1872. DOI 10.1016/j.ijfatigue.2006.01.013. [Google Scholar] [CrossRef]
28. Islam, M. Z., Ulven, C. A. (2020). Influence of loading frequency on thermal and micro-mechanical damage during fatigue of flax fiber reinforced composites. International Manufacturing Science and Engineering Conference. American Society of Mechanical Engineers, pp. V001T002A002. DOI 10.1115/MSEC2020-8301. [Google Scholar] [CrossRef]
29. Lahuerta, F., Nijssen, R. P. (2017). Energy dissipation in thermoset composites in mode I fatigue. Mechanics of Advanced Materials and Structures, 24, 168–175. DOI 10.1080/15376494.2015.1124950. [Google Scholar] [CrossRef]
30. Haggui, M., El Mahi, A., Jendli, Z., Akrout, A., Haddar, M. (2019). Static and fatigue characterization of flax fiber reinforced thermoplastic composites by acoustic emission. Applied Acoustics, 147, 100–110. DOI 10.1016/j.apacoust.2018.03.011. [Google Scholar] [CrossRef]
31. Guo, Q., Guo, X., Fan, J., Syed, R., Wu, C. (2015). An energy method for rapid evaluation of high-cycle fatigue parameters based on intrinsic dissipation. International Journal of Fatigue, 80, 136–144. DOI 10.1016/j.ijfatigue.2015.04.016. [Google Scholar] [CrossRef]
32. La Rosa, G., Risitano, A. (2000). Thermographic methodology for rapid determination of the fatigue limit of materials and mechanical components. International Journal of Fatigue, 22, 65–73. DOI 10.1016/S0142-1123(99)00088-2. [Google Scholar] [CrossRef]
 | This work is licensed under a Creative Commons Attribution 4.0 International License, which permits unrestricted use, distribution, and reproduction in any medium, provided the original work is properly cited. |