| Journal of Renewable Materials |
DOI: 10.32604/jrm.2022.017285
ARTICLE
Recycled Aggregate Pervious Concrete: Analysis of Influence of Water-Cement Ratio and Fly Ash under Single Action and Optimal Design of Mix Proportion
1School of Water Conservancy, North China University of Water Resources and Electric Power, Zhengzhou, 450045, China
2College of Water Resources, North China University of Water Resources and Electric Power, Zhengzhou, 450045, China
3College of Architecture, North China University of Water Resources and Electric Power, Zhengzhou, 450045, China
4Key Laboratory of Water Environment Simulation and Treatment of Henan Province, Zhengzhou, 450002, China
5Collaborative Innovation Center of Water Resources Efficient Utilization and Protection Engineering, Zhengzhou, 450045, China
6Water Conservancy and Electric Power Building Survey, Design and Research Institute of Chongqing, Chongqing, 401120, China
*Corresponding Authors: Lunyan Wang. Email: alexwangncwu@163.com; Mengdie Zhao. Email: zhaomengdie@ncwu.edu.cn
Received: 28 April 2021; Accepted: 09 July 2021
Abstract: Pervious concrete is recommended, which is of great benefit to the ecological environment and human living environment. In this paper, the influences of five water-cement ratios and four fly ash contents to replace the cement by mass with a water-cement ratio of 0.30 on the properties of Recycled Aggregate Pervious Concrete (RAPC) were studied. Following this, based on the Grey relational-Technique for Order Preference by Similarity to an Ideal Solution (TOPSIS) optimization method, the strength, permeability, abrasion loss rate, and material costs of RAPC were adopted as evaluation indices to establish a mix proportion optimization model. The results show that the increase of water-cement ratio and fly ash replacement level of RAPC leads to decreased compressive strength while an increase in the permeability and abrasion loss rate. According to test results based on the optimal model 0.30 was identified as the best mix proportion. In addition, ecological-economic analysis of RAPC raw materials was carried out by comparing different natural aggregates. The results of EE (embodied energy) and ECO2e (embodied CO2 emission) pointed out that the combination of recycled aggregate and fly ash leads to significant ecological and economic benefits.
Keywords: Recycled aggregate pervious concrete (RAPC); fly ash; optimal model; strength and permeability; ecological and economic benefits
With the rapid development of the world economy, the process of global urbanization is accelerating. However, the disadvantages are magnified gradually, and construction waste is seen as one of its products. The total amount of construction waste generated by the replacement and demolition of buildings is about 17 billion tons every year globally, which is expected to reach 25 billion tons by 2050 [1]. However, the construction waste treatment system is still not perfect at this stage. About 51% of construction wastes are waste concrete [2], recycled aggregate obtained after crushing, screening, and cleaning waste concrete can be used in concrete or pervious concrete instead of natural aggregate. This method makes the treatment of construction waste more rational, environmentally friendly and effective. As the main structure in the construction process of low-impact development rainwater systems, pervious concrete can significantly improve urban environmental problems such as sound, light, and heat, as well as rainwater infiltration [3] and regulate ecological balance effectively [4]. Combining recycled aggregate and pervious concrete to produce RAPC not only inherits the advantages of pervious concrete but also promotes green and sustainable development; therefore, RAPC has been widely applied to parks, parking lots, sidewalks and other areas. Meantime, the RAPC in this study has been applied to the park in Xuchang, China, the application of which is needs to be further promoted.
Nowadays, more and more attention has been paid to this kind of building material. Concrete mix proportion design is fundamental in the concrete research area. Reasonable mix proportion design is helpful to give full play to the concrete properties. At present, the methods used to determine the optimum concrete mix proportion mainly include: response surface method, Taguchi method, TOPSIS-Taguchi method, Taguchi-Grey relational analysis method, etc. Zhang et al. [5] explored the optimal mix proportion of RAPC from three aspects of IPT (Ideal paste thickness), ACT (actual coating thickness), and TVC (the void content) based on the response surface method. Joshaghani et al. [6] determined the optimal mix proportion of pervious concrete based on the Taguchi method. Şimşek et al. [7] put forward the method of TOPSIS-Taguchi to determine the optimum mix proportion of high strength self-compacting concrete; in addition, the optimum mix proportion of polymer concrete is determined based on this method. Narong et al. [8] used the TOPSIS-Taguchi method to determine the optimum mix proportion of cement mortar. Prusty et al. [9] used Taguchi-Grey relational analysis method to determine the optimum mix proportion of ground slag based geopolymer concrete. The above literature has provided different ideas for determining the optimum mix proportion of RAPC, which has enriched the research of RAPC mix proportion to some extent. However, the following situations still exist: For example, Yap et al. [3] studied the influence of different aggregate types on the properties of pervious concrete based on 0.35 water-cement ratio. Zhang et al. [10] studied the influence of crushing index of recycled aggregate on RAPC properties based on 0.34 water-cement ratio. Ngohpok et al. [11] studied the influence of recycled aggregate and coal ash aggregate instead of natural aggregate on pervious concrete based on 0.30 water-cement ratio. Güneyisi et al. [12] studied the application of recycled aggregate instead of natural aggregate in pervious concrete based on 0.27 and 0.32 water-cement ratios. This will lead some staff or researchers to get into trouble when selecting a reference, which is extremely unfavorable to a wider application of RAPC. In summary, the current research results of RAPC mix ratios are not quite consistent, so studying on mix design for recycled aggregate pervious concrete considering various water-cement ratios and fly ash contents is essential, which will provide reliable information to promote the application of RAPC.
Portland cement is the most widely used cementing material. Its production process produces CO2, dust, and other pollutants [13], bringing great pressure to environmental protection. Most scholars have researched on cement substitution to reduce environmental pressure while maintaining the characteristics of cement [14,15]. Among them, there are many studies on the replacement of cement by fly ash. Vieira et al. [16] used 10% fly ash instead of cement to study the application of recycled aggregate instead of natural aggregate in pervious concrete. The results showed that the compressive strength of specimens with fly ash was always lower than that of those without. Aoki et al. [17] studied the application of 0%, 20%, and 50% fly ash to replace cement in pervious concrete. They believed that 50% fly ash replacement level could meet the physical properties requirements of pervious concrete. Liu et al. [18] studied the application of 3%, 6%, 9%, and 12% replacement levels of fly ash in pervious concrete. They found that fly ash had no obvious influence on the modification of concrete of short age. Vázquez-Rivera et al. [19] replaced the cement with 15% fly ash and applied it to pervious concrete. Sherwani et al. [20] added artificial cold bonded fly ash aggregate to pervious concrete. The study found that the use of AFA can significantly improve the permeability of pervious concrete, but the strength will be reduced. The above literature shows that the research results on the replacement level of fly ash in pervious concrete are not consistent, and the application of fly ash in the RAPC field is rare relatively.
Based on the above limitations, five water-cement ratios (0.24,0.27, 0.30, 0.33 and 0.36), and four fly ash contents (5%, 10%, 15% and 20%) were selected to replace cement with water-cement ratio fixed at 0.30 to perform the experiments. The test results meet ACI’s [21] standards of the strength and porosity of permeable concrete, and the influences of water-cement ratio and fly ash on RAPC compressive strength, splitting tensile strength, porosity, permeability coefficient, and abrasion resistance are revealed. The optimal mix proportion of RAPC water-cement ratio and fly ash instead of cement were determined, respectively, through constructing the optimization model based on Grey relational analysis-TOPSIS method, and the ecological-economic benefits were analyzed. The results provide references for the determination of water-cement ratio and fly ash replacement level of RAPC and provide a new perspective for the determination of the optimal mix ratio of RAPC.
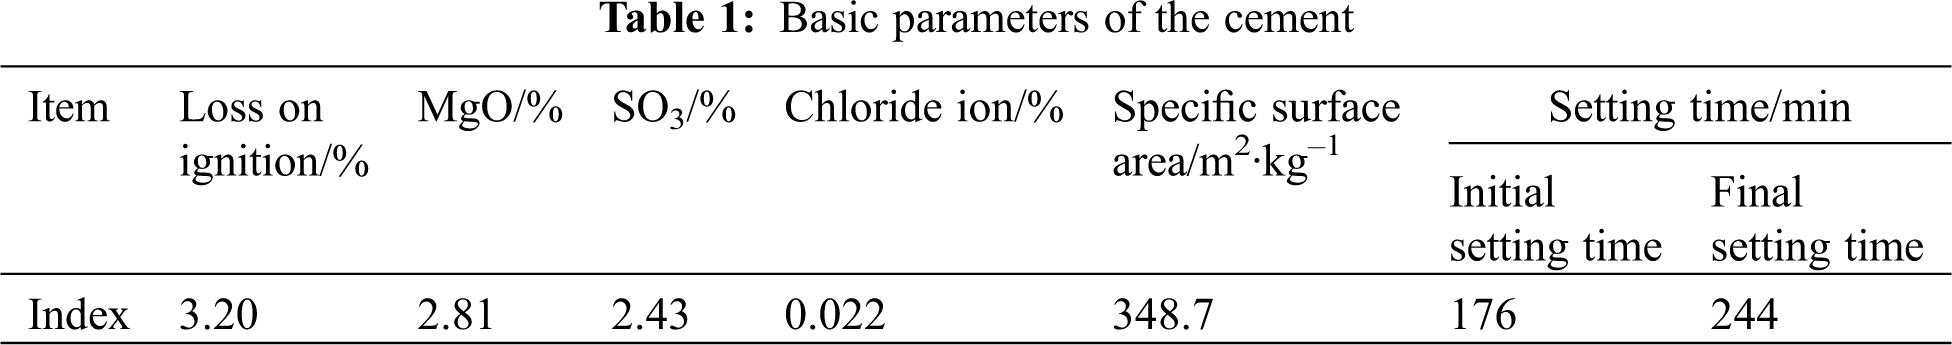
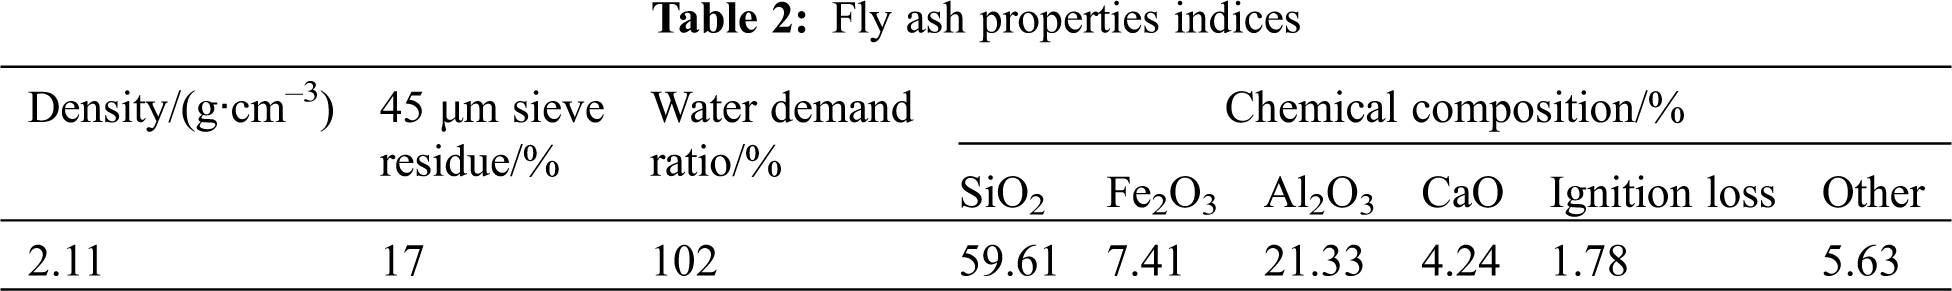
The cementing materials include: P·O 42.5 ordinary Portland cement, its parameters are shown in Tab. 1; fly ash: Level-II, which conforms to the requirements of ASTM C618, as shown in Tab. 2.
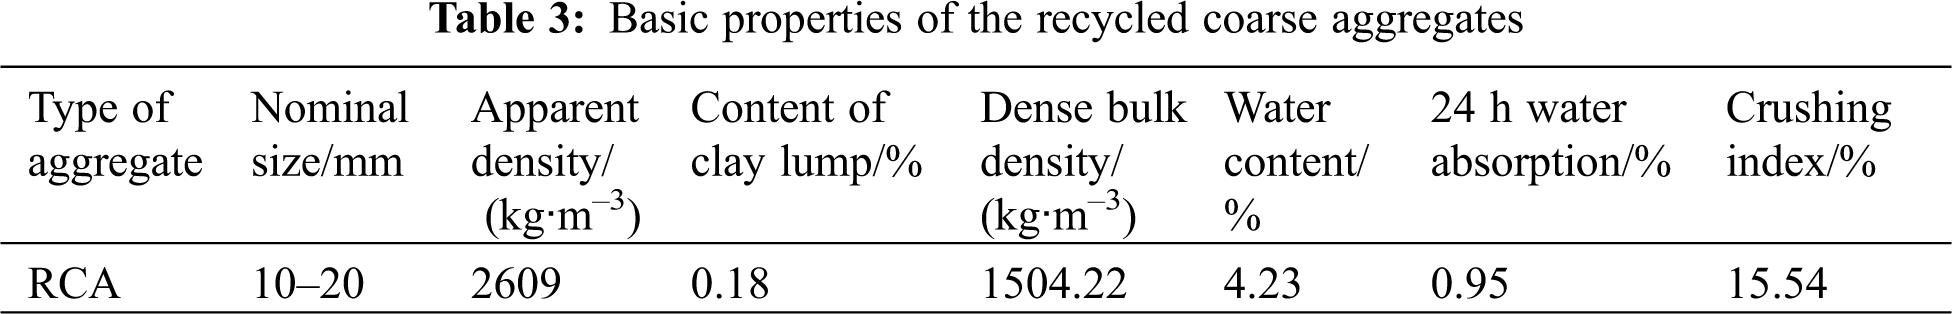
The recycled aggregate was obtained by screening with an XSZ-73 single and double layer vibrating screen after the waste concrete pavement (compressive strength is 30 MPa) was crushed by a crusher. The particle size is 10–20 mm. The basic properties indexes are shown in Tab. 3.
The mix proportion design is divided into two series in Tab. 4. The Series I is to determine RAPC properties under five water-cement ratios; the Series II, the water-cement ratio fixed at 0.30, fly ash is used to replace cement by mass, and the influence of fly ash with different replacement levels on RAPC properties is determined through experiments, and the measured data are obtained. The details are as follows:
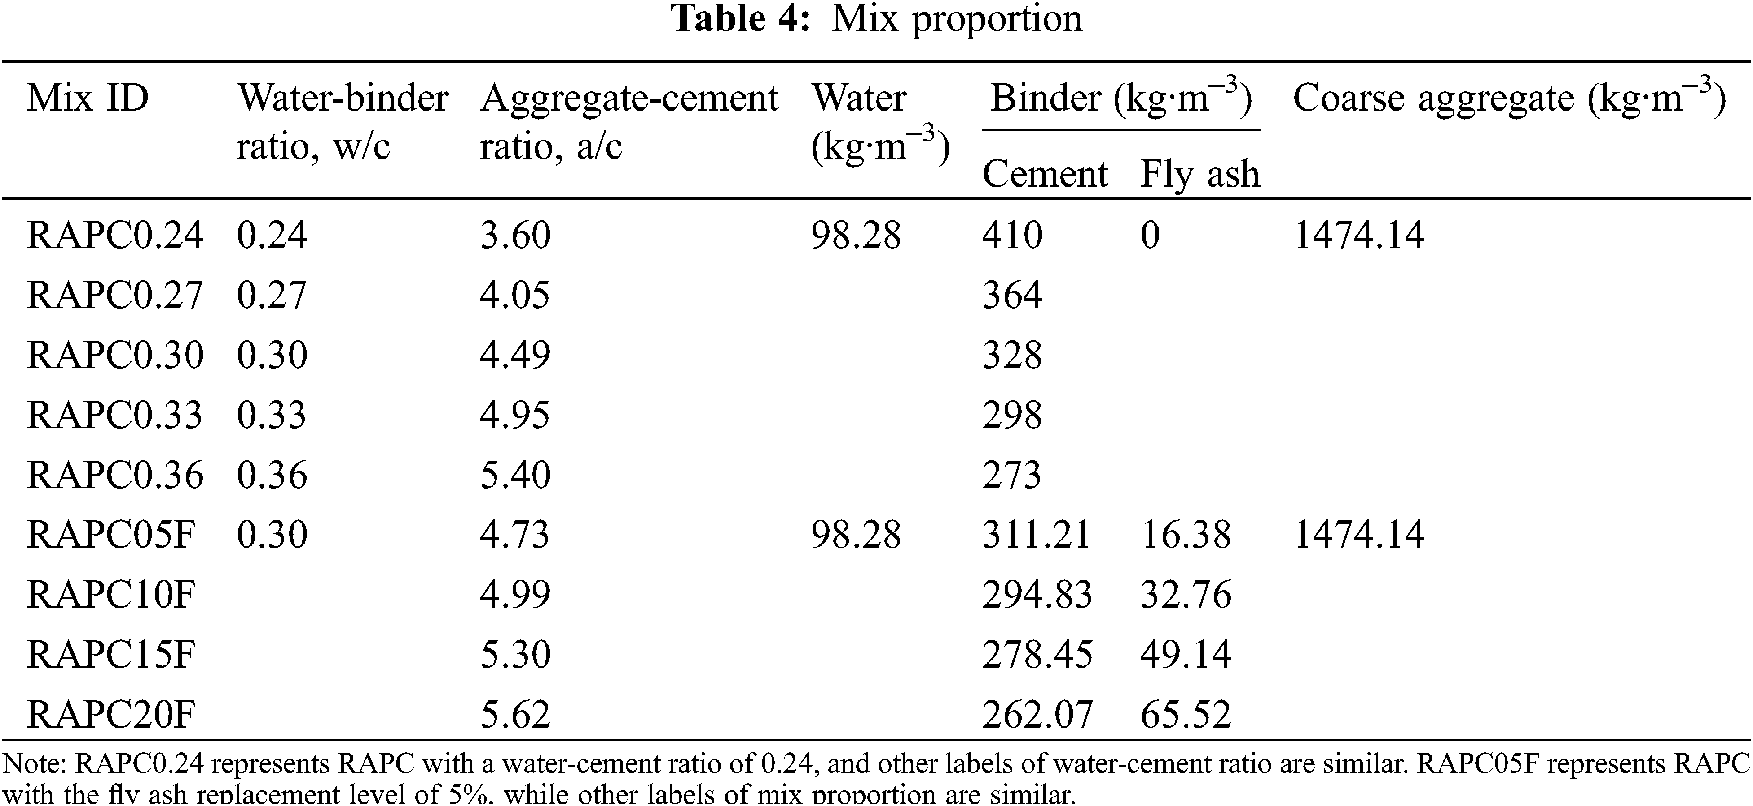
Series I: according to the reference range of water-cement ratio of pervious concrete given by ACI [21] and relevant literature [3], 20% was determined as the target porosity. Considering the constant amount of water and aggregate, five gradient water-cement ratio experiments were designed, namely, 0.24, 0.27, 0.30, 0.33, and 0.36. After testing, the measured values of RAPC compressive strength, splitting tensile strength, porosity, permeability coefficient, and abrasion loss rate were obtained.
Series II: According to the preliminary experiments of our research group, the RAPC with water-cement ratio of 0.30 had better properties. Therefore, based on 0.30 water-cement ratio, four kinds of fly ash replacement levels were designed, namely 5%, 10%, 15%, and 20%.
After testing, the measured values of RAPC compressive strength, splitting tensile strength, porosity, permeability coefficient, and abrasion loss rate of the two series were obtained.
The preparation technology of RAPC is divided into mixing method and forming process. HJW100 single-shaft horizontal forced concrete mixer was used for the mixing method, the rotational speed was 48 r/min, and the motor power was 2.2 kW. The forming process adopts the method of combining manual tamping and vibration Table. The process of RAPC specimen preparation is shown in Fig. 1. Firstly, the aggregate and half of the water were added into the mixer and stirred for 1 min. Secondly, the cement and fly ash were added and stirred for 1 min. Thirdly, the remaining water was added and stirred for 1 min. Then, the fresh concrete was poured, tamped, vibrated, and finished in the specimen moulds. Manual insertion and tamping are divided into two layers. Each layer is inserted and tamped 25 times, and the height of a single layer is about half of the size of the specimen. Finally, the specimens were cured for 28 days in the standard curing room. The process of RAPC specimens is shown in Fig. 1.
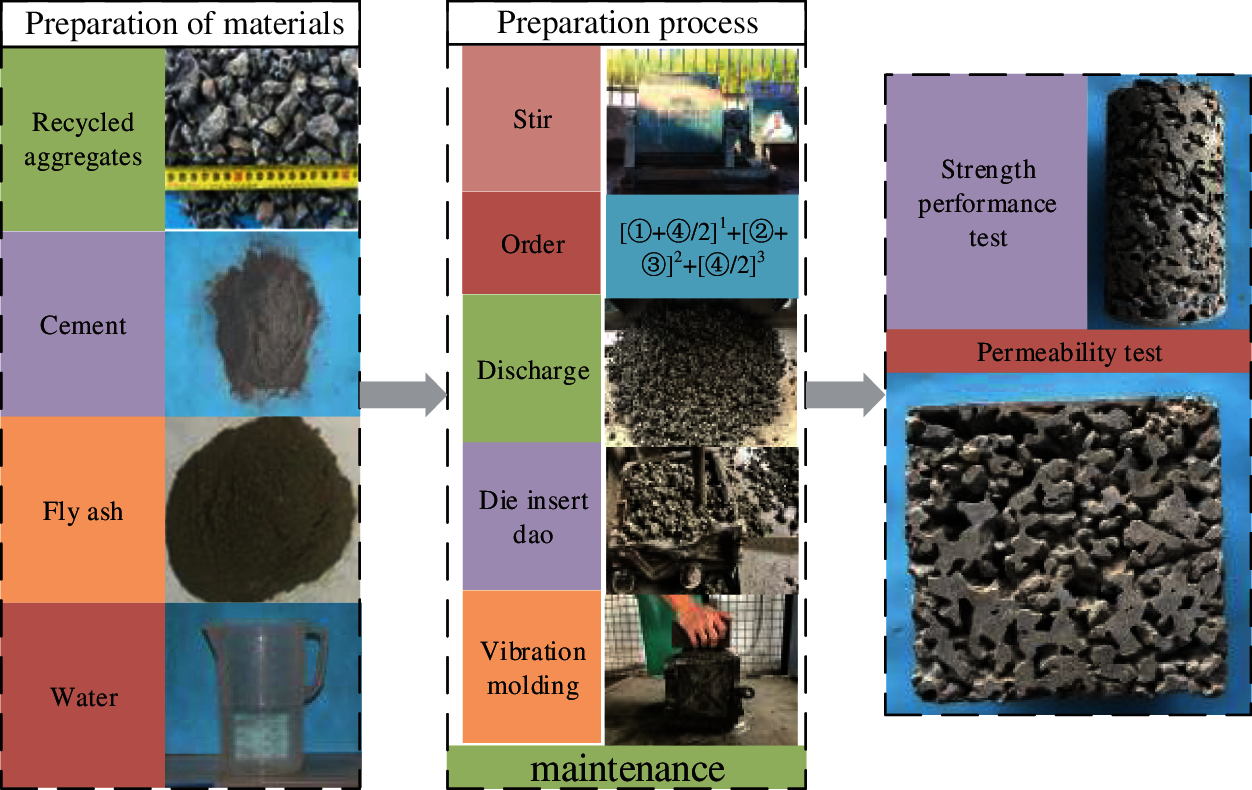
Figure 1: RAPC sample preparation process
The RAPC properties test includes strength, permeability, and abrasion resistance. The strength is divided into compressive strength and splitting tensile strength. The permeability property is divided into porosity and permeability coefficient.
The compressive strength and splitting tensile strength were carried out according to ASTM C39/C39m-2010 [22] and ASTM C496/C496M-2011 [23], respectively. The test specimen size was φ100 × 200 mm. There were three specimens in each test group, and the average value was taken as the test result. The test piece was completed by a WAW-1000 electro-hydraulic servo universal testing machine produced by Shanghai Hualong Testing Instrument Co., Ltd., Shanghai, China. The loading rate of compressive strength was 0.2 MPa/s, and the loading rate of splitting tensile strength was 0.02 MPa/s. The specific test process is shown in Fig. 2.
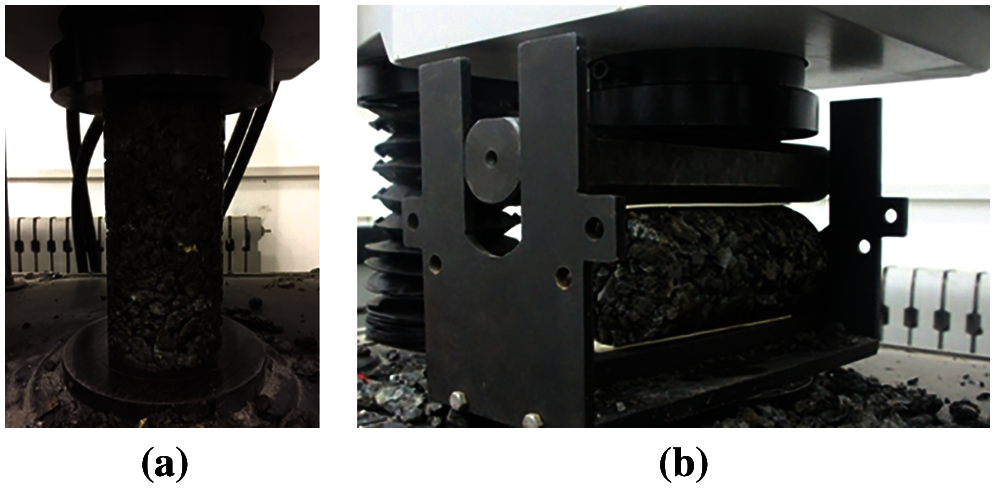
Figure 2: Compression and splitting strength test of RAPC (a) compressive strength test (b) splitting tensile strength test
The size of the RAPC specimens used for the permeability coefficient and porosity test were 150 × 150 × 150 mm cubes. RAPC porosity test refers to ASTM C1754 [24]. Porosity in this test specifically refers to continuous porosity, which is the percentage of the open pore volume present in pervious concrete and the volume of pervious concrete. The calculation formula is as follows:
where: Cvoid-continuous porosity (accurate to 0.1%); m1-the weight of the specimen in water (g); m2- the weight of the specimen after drying in an oven for 24 h (g); ρ-density of water (g/cm3); and V-specimen volume (cm3).
The permeability coefficient tests were carried out by ASTM C1701 [25] and measured by a self-developed pervious device (Fig. 3). The test was carried out with a fixed head height of 200 mm, and the permeability coefficient of RAPC was calculated according to Eq. (2). The gap between the specimen and the device is filled with silly putty to ensure the accuracy of the test.
where: KT is the water permeability coefficient of the specimen (mm/s); Q is the water quantity exuded in t seconds (mm3); L is the height of the specimen (mm); A is the upper surface area of the specimen (mm2); H is the water level difference (mm), in this test, H = 200 mm; and t is the permeation time (s), select 25 s.
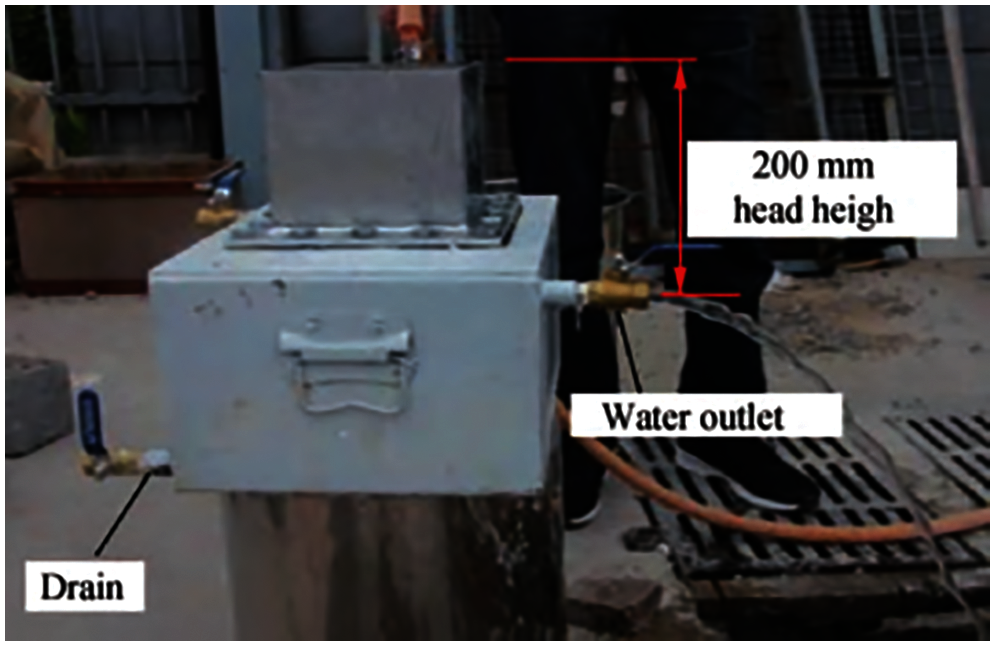
Figure 3: Diagram of the test apparatus for permeability coefficient
The abrasion resistance of RAPC is implemented by ASTM C1747 standard [26]. The test is completed by MH-II Los Angeles Abrasion Testing Machine. The test machine is shown in Fig. 4. The cylinder inner diameter of the tester is 710 ± 5 mm, the inner length is 510 ± 5 mm, the rotational speed is 30–33 r/min, and the main engine power is 2.2 kW. The test piece is a cylinder of φ100 × 200 mm, and each test group has 3 test pieces. The specific test steps are: 1) Take the test specimen out of the standard curing room and air dry for 24 h, weigh the initial mass G1; 2) Place three test specimens with the same mix ratio in the abrasion testing machine at the same time. No steel balls were added during this test. Turn to 500 r and stop it [27]; 3) Take out the remaining test specimen and pass it through a standard sieve with a round hole of φ25 mm. The sieve residue is recorded as G2; 4) The formula for calculating the mass loss percentage of the test specimen is as follows:
where: El denotes the percentage of mass loss of the test specimen (%); G1 is the initial mass of the test specimen (g); G2 is the sieve residue of the test specimen (g).
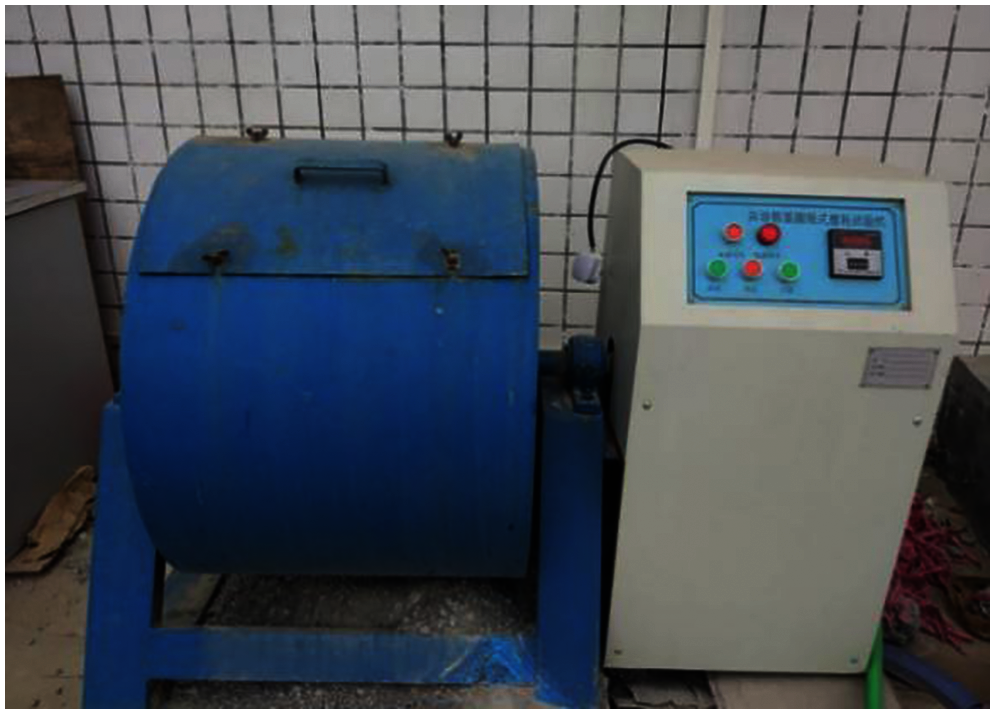
Figure 4: Los Angeles abrasion testing machine
3 Grey Relational Analysis-TOPSIS Optimization Model
Grey relational analysis (GRA) is a multi-factor statistical analysis method [28]. GRA not only can be used to analyze the influence of various factors on the results but also solve problems such as comprehensive evaluation. However, it also has certain application limitations. For example, it can only evaluate the relevance of the same factors of each scheme and compare the degree of relevance of each scheme to the same reference sequence according to the proximity of the factors [29]. Therefore, it is not comprehensive to make the optimal decision-making of the project by the GRA method.
TOPSIS method is a multi-objective decision-making analysis method, which has been applied in many fields such as land utilization planning, material selection evaluation, project investment, medical and health [30], etc. However, TOPSIS also has limitations, The position of the perpendicular bisector between the optimal value [31] and the worst value in the traditional TOPSIS method cannot be determined accurately [32] so that the quality of the model cannot be evaluated; when the Euclidean Distance is used as a measurement standard, there are different to the actual results, and it cannot reflect the positional relationship of the evaluation scheme. Based on this, this paper combines the GRA with the TOPSIS method, and the weighted Grey relational degrees were calculated to replace the Euclidean Distance, which can better solve the above problems. The specific steps are as follows:
Step 1: Since each evaluation index has different dimensions, data processing should be carried out first.
Benefit index:
Cost index:
where: Pij is the processed index, xi is the sample data. According to the properties of RAPC, compressive strength, splitting tensile strength, porosity, and permeability coefficient are all benefit indexes, namely, the bigger, the better. Abrasion loss rate and material costs are cost indices, namely, the smaller, the better.
Step 2: Building a decision-making matrix. Suppose there are m schemes for the mix proportion of RAPC, and each scheme has n evaluation indexes of RAPC properties. Mij is the value of the j-th index of the i-th RAPC mix proportion. In this paper, i = 1, 2, …, m, which are density, compressive strength, splitting tensile strength, porosity, permeability coefficient, abrasion loss rate, and material costs. Then Get the decision-making matrix M = [Mij]n×m.
Step 3: Determining the weight of the evaluation index. The methods for determining weight generally include the subjective weight determination method, objective weight determination method, and combination weighting method. The traditional TOPSIS method mainly adopts the subjective weight determination method [33]. The subjective weight determination method is to make decisions based on the decision makers’ conditions, so there will be differences in the experience of different decision-makers, which also limits the universality of the TOPSIS method. Although the objective determination method has a relatively objective determination weight to a certain extent, it is usually applied to situations where the rationality and accuracy of the data source are guaranteed. The combination weighting method combines the subjective weight determination method and the objective weight determination method so that the determined weight coefficient reflects subjective and objective information simultaneously. Still, it has the characteristics of a large amount of calculation and error-prone, and the current research is not systematic enough.
The evaluation indexes in this paper are the compressive strength, splitting tensile strength, porosity, water permeability coefficient, and material costs of RAPC. The properties of RAPC were measured through experiments and the material costs are calculated based on the current material market price. Therefore, the data is authentic and complete. Based on this, this paper decides to adapt the CRITIC method of the objective weight determination method to determine the weight of the GRA-TOPSIS method. This method is often used in multi-attribute decision-making problems, mainly to comprehensively measure the objective weight of indexes based on the contrast intensity of evaluation indexes and the conflict between evaluation indexes [34]. The contrast intensity refers to the difference in the value of the same evaluation index between different evaluation schemes; the conflict is measured by the correlation between the indexes, representing the correlation between the indexes. The calculation formula is as follows:
where: Di is the conflict between the evaluation indexes, σi is the standard deviation, Rij is the correlation coefficient between the evaluation indexes, Ci is the information contained in the evaluation index and Wi* is the objective weight of the index.
It can be seen from the above formulas: 1) The standard deviation of each evaluation index should be adopted in the CRITIC method, but the dimensions of each evaluation index are different; 2) The correlation coefficient between the indexes may be negative, and the conflict of the indexes obtained will be bigger, which is inconsistent with the actual situation. At the same time, the Pearson correlation coefficient is used in this method, which has certain requirements for the evaluation indexes: the data should be continuous and consistent with normal distribution and linear relationships [35]. However, it is difficult for the selected evaluation indexes to meet this requirement, so it is necessary to improve the CRITIC method. Therefore, the Gini coefficient is used as the measurement index of contrast intensity, and Kendall’s coefficient of concordance is used as the measurement index of conflict [36]. Gini coefficient is mainly used to represent the difference in economic income. Here, it is used to quantitatively measure the difference between evaluation indexes [37]. The calculation formula is as follows:
where: αj is the Gini coefficient of the jth index. When αj = 1, the contrast intensity of this index is the maximum; when αj = 0, it reaches the minimum.
Kendall coefficient of concordance is a method used to measure the correlation of multiple variables in statistics [38], which is used to quantitatively measure the correlation between evaluation indexes. The calculation formula is as follows:
where: N is the number of indexes; E = n(n-1)/2; Kz and Kx represent the number of pairs of variables with equal sorting values and the number of pairs of variables with different sorting values in Pr, ni and nj represent the number of variables Xm and Xt that have the same value. βmt is the Kendall coefficient between index m and index t, m is the number of indexes. When βm = 1, it means that the two indexes have a strong correlation; when βm = 0, it means that there is no correlation between the two indexes.
Combined with the Gini coefficient of the m index and the Kendall coefficient of totality, the weight is obtained as follows:
Step 4: Constructing a weighted normalized decision-making matrix. Combining the decision-making matrix with the weight of each index, the weighted normalized matrix V and its element vij of RAPC properties evaluation are obtained:
Step 5: Determining the optimal and worst values. The optimal value is the most satisfactory value of RAPC properties in the ideal state, that is, when the compressive strength, splitting tensile strength, porosity, and permeability coefficient are the maximum, while the abrasion loss rate and material costs are the minimum, they are represented by v+; when the compressive strength, splitting tensile strength, porosity and permeability coefficient are the minimum, while the abrasion loss rate and material costs are the maximum, they are represented by v-.
where: I1 represents the benefit index and I2 represents the cost index.
Step 6: Calculate the weighted Grey correlation coefficient:
where:
Step 7: Calculating the relative closeness ηi.
The range of ηi is between 0 and 1, when ηi is close to 1, it means that the closer to the optimal value, the farthest from the worst value, the best at this time, and the worst on the contrary.
4.1 Influence of Water-Cement Ratio on the Properties of RAPC
Water-cement ratio is one of the main factors affecting the mechanical properties of RAPC. Choosing a suitable water-cement ratio can give full play to the properties of RAPC. Fig. 6 shows the strength properties (compressive strength and splitting tensile strength) and permeability (porosity and permeability coefficient) of RAPC under different water-cement ratios. It can be seen from Fig. 5(a) that the compressive strength of RAPC decreases gradually with the increase of water-cement ratio. When the water-cement ratio is 0.24, the compressive strength reaches the maximum value of 10.70 MPa; when the water-cement ratio increases to 0.27 and 0.30, the compressive strength decreases to 9.10 and 9.06 MPa, respectively; when the water-cement ratio increases to 0.36, the compressive strength decreases to the minimum, which is 5.67 MPa. Compared with the maximum, the strength was decreased by 88.82%. This is similar to the results in Lian et al. [39]. The splitting tensile strength of RAPC decreases nonlinearly with the increase of water-cement ratio. The splitting tensile strength reaches the maximum value of 2.10 MPa when the water-cement ratio is 0.27; when the water-cement ratio is 0.36, the splitting tensile strength is lowest, which is the 1.44 MPa. In general, the compressive strength, and splitting tensile strength of RAPC are similar and the splitting tensile strength/compressive strength ratio range is 0.18–0.26, which meets the requirements of ACI [21]. Both compressive strength and splitting tensile strength decrease with the increase of water-cement ratio. As the water-cement ratio increases, the slump of RAPC increases, while the cement slurry cohesion decreases, resulting in a decrease in the compactness of the concrete structure, which reduces the strength level. On the other hand, the thickness of the cement paste on the surface of the coarse aggregate has a significant impact on the compressive strength of the concrete. Most of the concrete strength failure occurs at the bonding surface of the old stones of the recycled aggregate or interface of the old mortar and the new mortar. The weak area and the force-bearing capacity between the new and the old interface are mainly affected by the water-cement ratio. When the water-cement ratio increases, the cement slurry becomes thinner, and the interface between the new mortar and the recycled aggregate old mortar becomes unstable. Under this circumstance, the transition zone of the interface cannot withstand greater pressure, and the interface between the new and old is prone to damage when under pressure, which will reduce the strength level of RAPC.
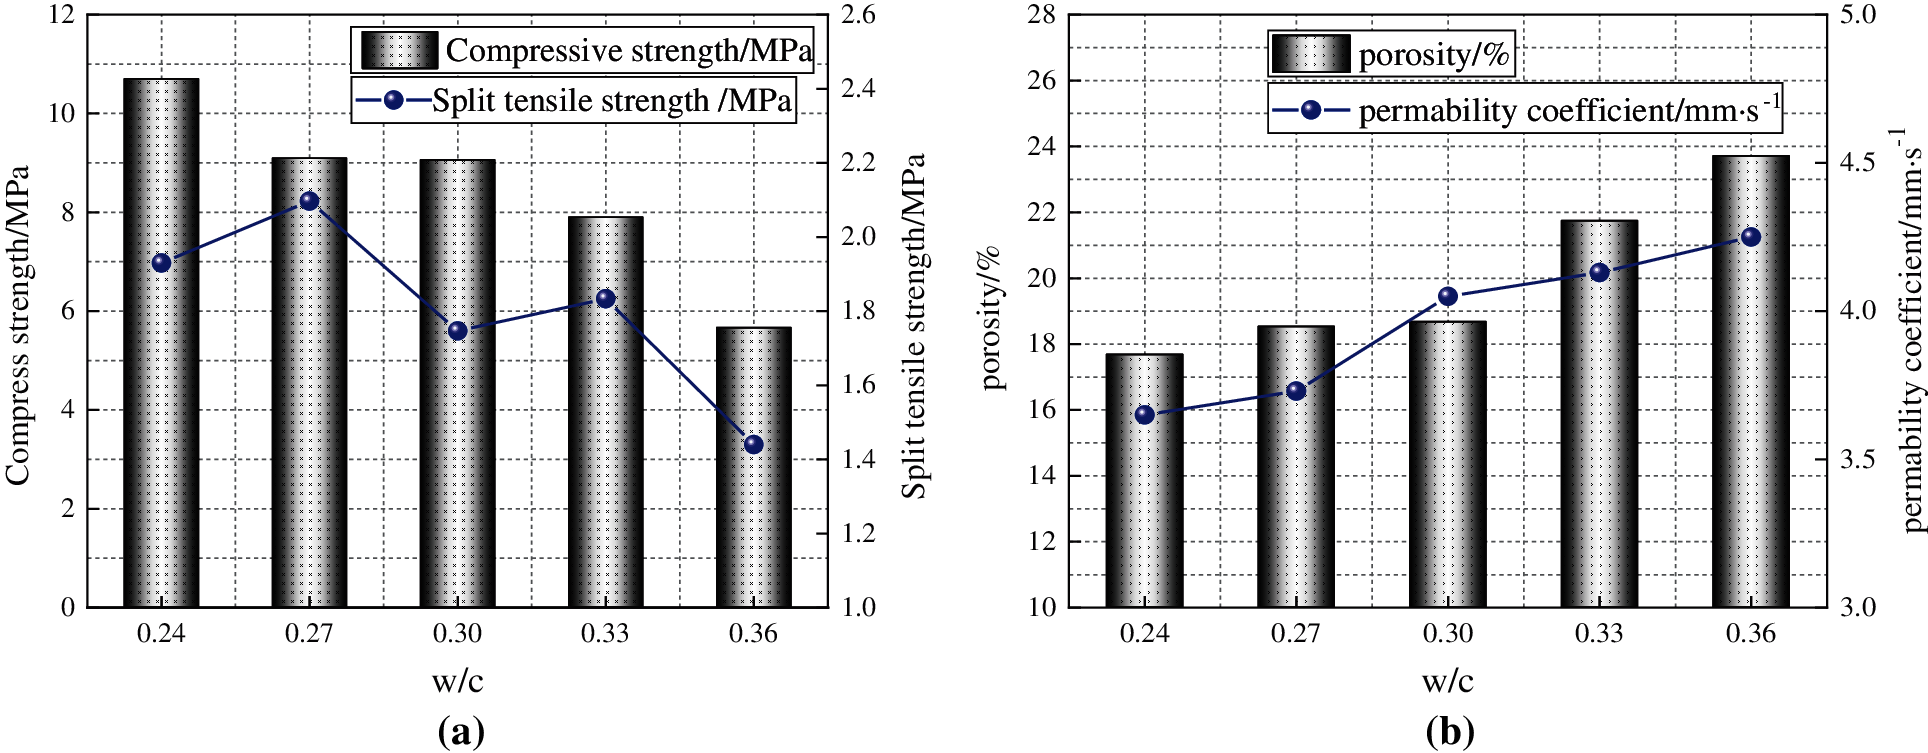
Figure 5: Influence of different water-cement ratio on the performance of RAPC (a) Influence of water-cement ratio on strength properties (b) Influence of water-cement ratio on permeability properties
Fig. 5b shows the variation trend of RAPC’s permeability property. It can be seen from it that the porosity of RAPC increases with the increase of water-cement ratio, and its range is 17.68%~23.71%, which meets the reference standard given by ACI [21]. The RAPC permeability coefficient first increases and then approaches a stable state. When the water-cement ratio is 0.24, the permeability coefficient is at the minimum value of 3.65 mm/s; when the water-cement ratio is 0.36, the permeability coefficient reaches the maximum value of 4.25 mm/s. On the whole, the permeability property of RAPC increases with the increase of water-cement ratio. Combining with the strength performance graph, it can be found that there is an inverse correlation between the two, which is consistent with the current research results [3]. With the increase in water-cement ratio or bone-ash ratio, concrete porosity and permeability coefficient increase synchronously, which have a positive correlation. Because the size of the bone ash ratio directly determines the thickness of the cement paste layer on the surface of the aggregate, the bonding area and the bone.
Fig. 6 shows the property of RAPC’s abrasion resistance under different water-cement ratios. It can be seen that as the water-cement ratio increases, the abrasion loss rate of RAPC shows an upward trend, and the increase in the abrasion loss rate indicates worse durability of the specimen. When the water-cement ratio is 0.36, the abrasion loss rate is up to 44.94%, which meets the level 4 pavement requirements specified by BSEN 1338 [3], but the pavement quality is low. Therefore, it is not recommended to use a higher water-cement ratio under actual application conditions. In conjunction with Fig. 5a, it shows that a higher the RAPC strength corresponds to a lower abrasion loss rate, revealing the relationship between them.
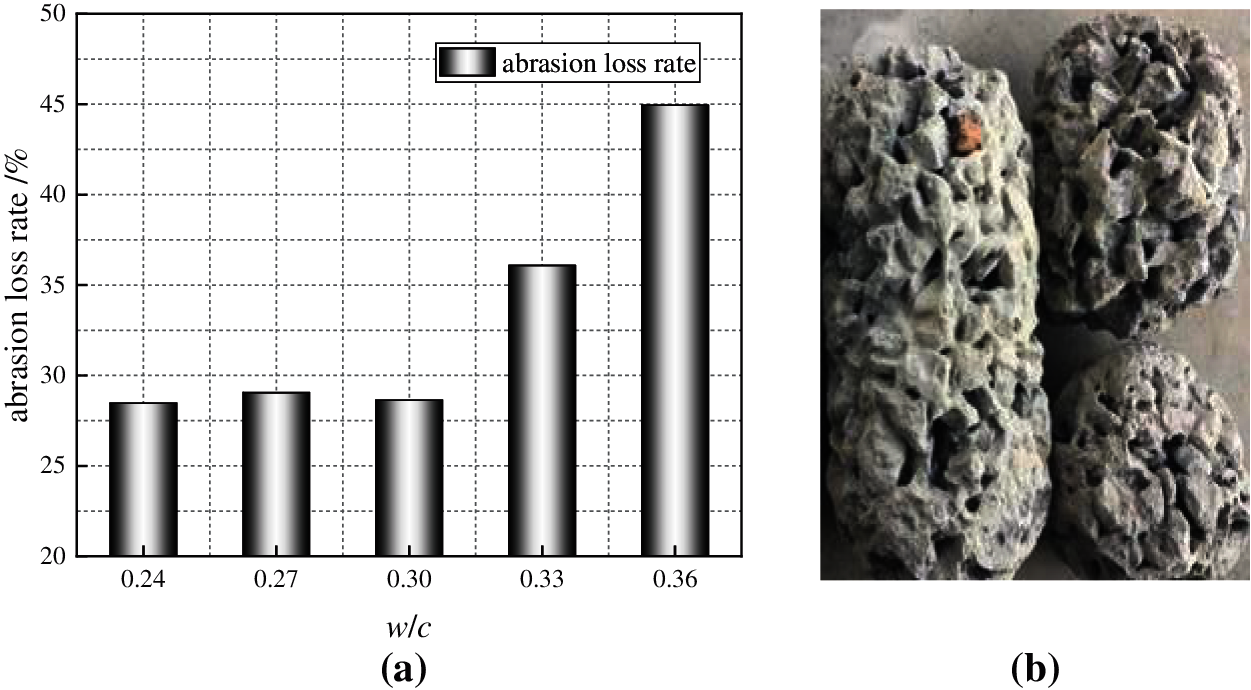
Figure 6: The relationship between water-cement ratio and abrasion loss rate and the picture of RAPC test specimens (a) The relationship between water-cement ratio and abrasion loss rate (b) The picture of RAPC test specimens
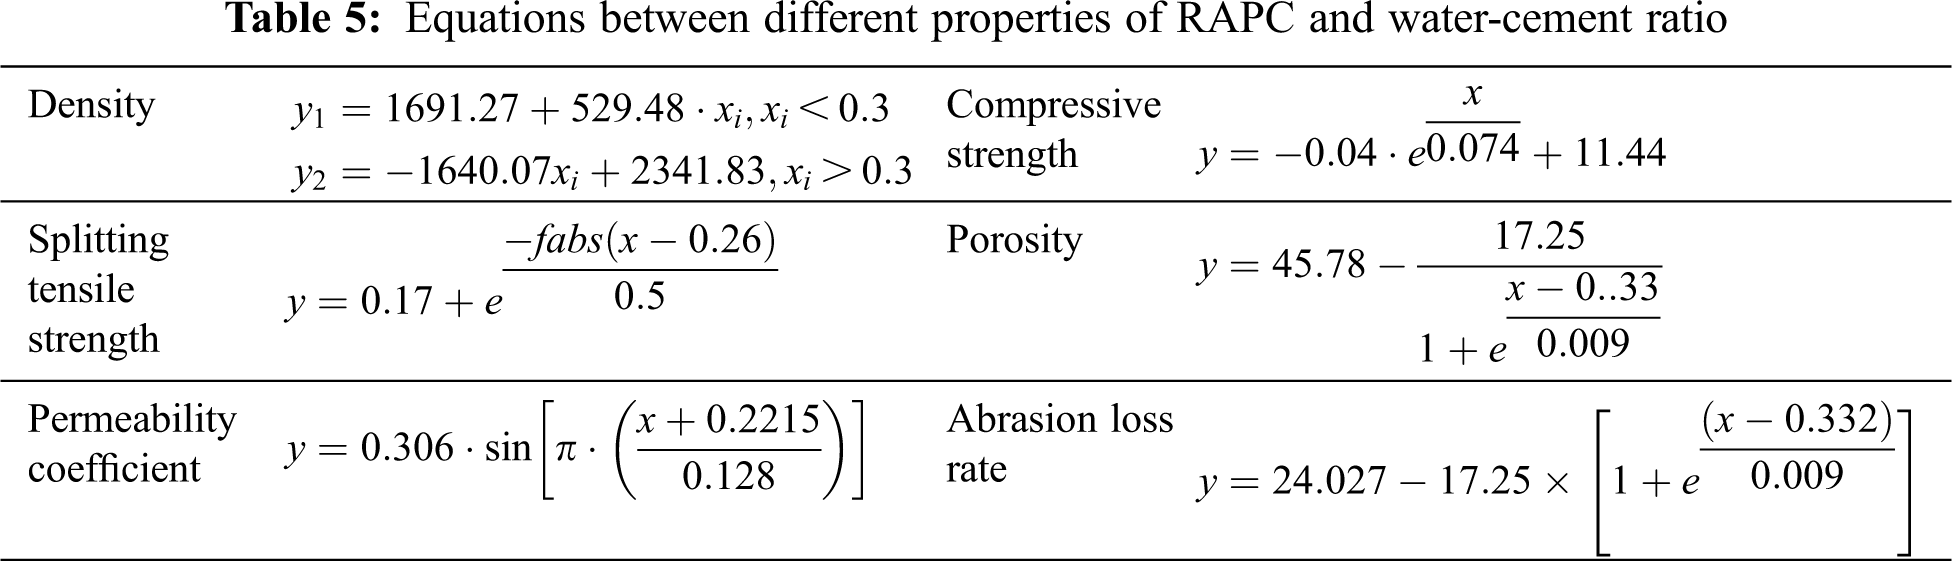
Fig. 7 is the regression analysis graph between RAPC’s density, compressive strength, splitting tensile strength, abrasion loss rate, permeability coefficient, porosity and water-cement ratio. It can be seen that the range of R2 is 0.82–0.99, indicating that the six variables of RAPC porosity, abrasion loss rate, density, compressive strength, permeability and splitting tensile strength have a strong correlation with the water-cement ratio. It can be seen from Tab. 5 that there is a linear relationship between RAPC density and water-cement ratio and the relationship between permeability coefficient and water-cement ratio is sinusoidal. The relationship between compressive strength, splitting tensile strength, porosity, abrasion loss rate and water-cement ratio is exponential.
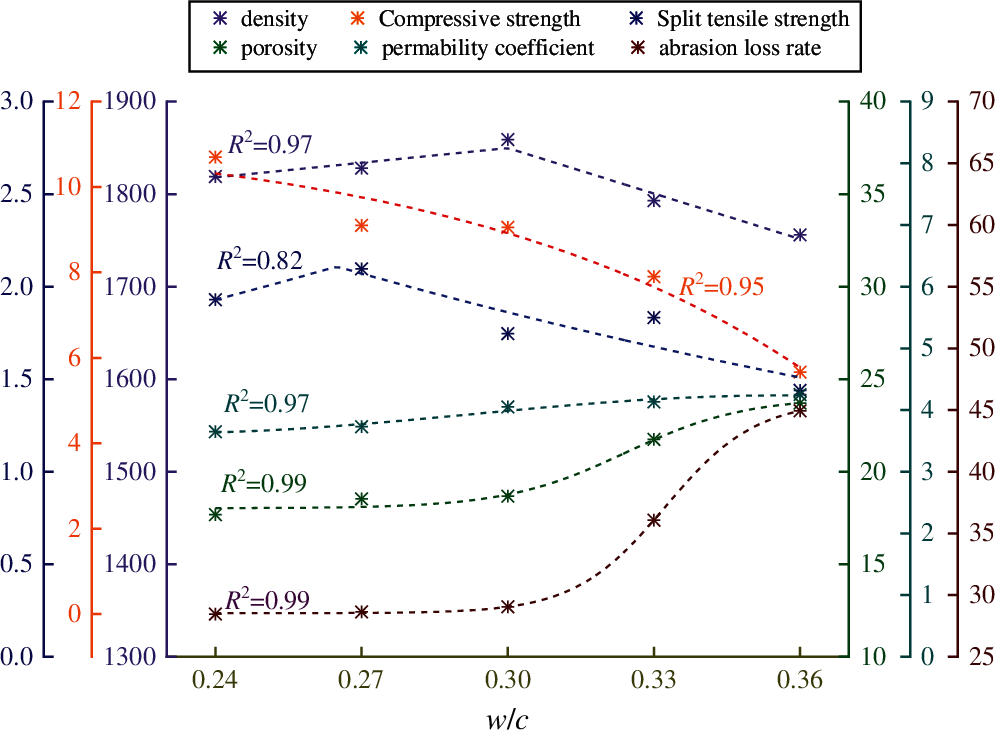
Figure 7: Regression analysis of different properties of RAPC and water-cement ratio
4.2 Influence of Fly Ash on the Properties of RAPC
Fig. 8 shows that the influence of fly ash content of 0%, 5%, 10%, 15%, and 20% on the performance of RAPC under 0.30 water-cement ratio. It can be seen from Fig. 9a that, compared with the test group without fly ash (0%, compressive strength is 9.06 MPa), the compressive strength of the specimens with fly ash has decreased, among them, when the fly ash content is 20%, the compressive strength value drops most significantly, which is 4.57 MPa, and it is about 49.56% lower than the 0% group. Splitting tensile strength and compressive strength of RAPC have the same changing trend. The reason is that the hydration rate of fly ash is lower than that of cement so that the produce of C-S-H gel is slower. As a result, RAPC presents a trend that the strength decreased with the increase of replacement level of fly ash during the 28 d age [40]. RAPC’s splitting tensile strength and compressive strength have the same variation trend. Meantime, the same amount of fly ash is added to replace cement, and the amount of cement decreases as the amount of fly ash increases. The strength value enhanced by the pozzolanic effect on fly ash is much smaller than the value of strength loss caused by the decrease in the amount of cement. In terms of the strength, it is recommended that the ratio of fly ash content should not exceed 10%.
In general, fly ash can increase the compactness of RAPC [41], resulting in a decrease in its permeability. However, it can be seen from Fig. 8b that with the increase of fly ash content, the porosity of RAPC shows an overall upward trend. This due to that when the content of fly ash is 5–15%, the activity of fly ash is lower than that of cement, so in the early stage of adding fly ash, its “activity effect” cannot be completely played. In addition, fly ash particles are smaller than cement, and it is difficult to uniformly disperse during the mixing process, and it is easy to form agglomerates. Therefore, the addition of fly ash leads to an increase in porosity and an increase in permeability coefficient. But when 20% fly ash is mixed, the porosity of RAPC only increases by 11.88% (porosity 20.89%) and the permeability coefficient is 3.99 mm/s, which is reduced when the ratio of water to cement is 0.30 without fly ash. This is due to the filling effect of the micro-aggregate effect of fly ash, which changes the pore structure of the pervious concrete [42], reduces the pore size and reduces the porosity. With the increase of the fly ash content, the RAPC porosity and permeability coefficient are reduced accordingly.
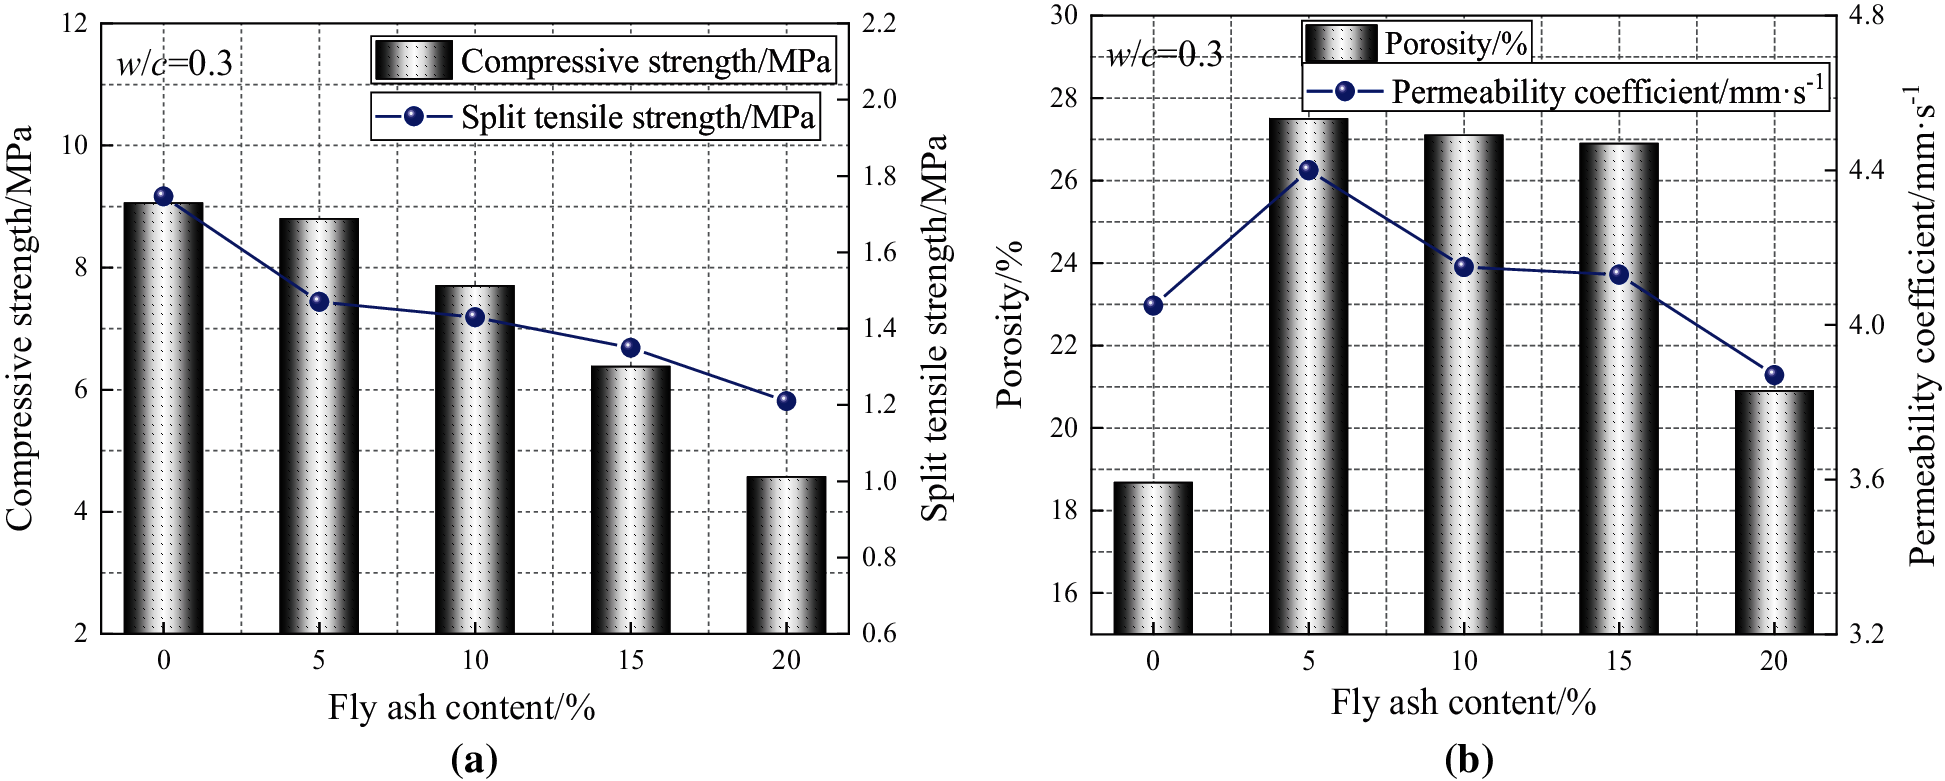
Figure 8: Influence of fly ash content on RAPC properties under 0.30 water-cement ratio (a) The influence of fly ash content on compressive strength (b) The influence of fly ash content on permeability coefficient
Fig. 9 shows the variation trend of abrasion resistance of RAPC under the influence of different fly ash content at 0.30 water-cement ratio. It can be seen that with the increase of fly ash content, the abrasion loss rate of RAPC shows a tendency of continuous rise. When the fly ash content is 15%, the abrasion loss rate of RAPC reaches the maximum value of 35.2%, which is 21.17% higher than that of 0% group (29.05%).This shows that fly ash has a negative influence on improving the abrasion resistance of RAPC.
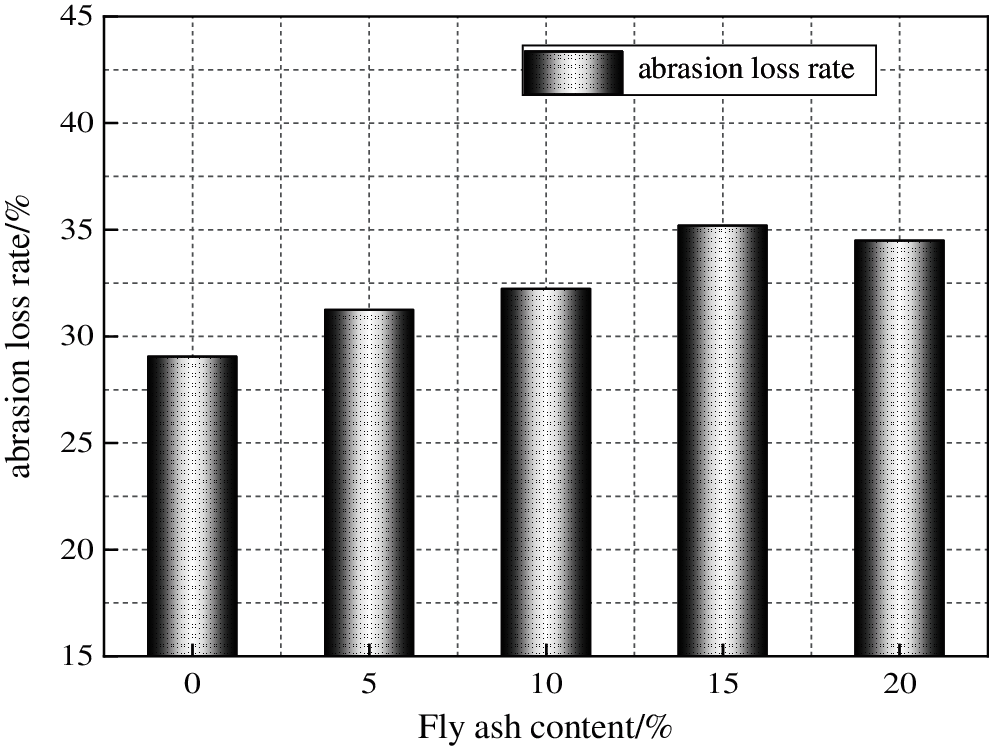
Figure 9: Influence of fly ash content under 0.30 water-cement ratio on RAPC abrasion loss rate
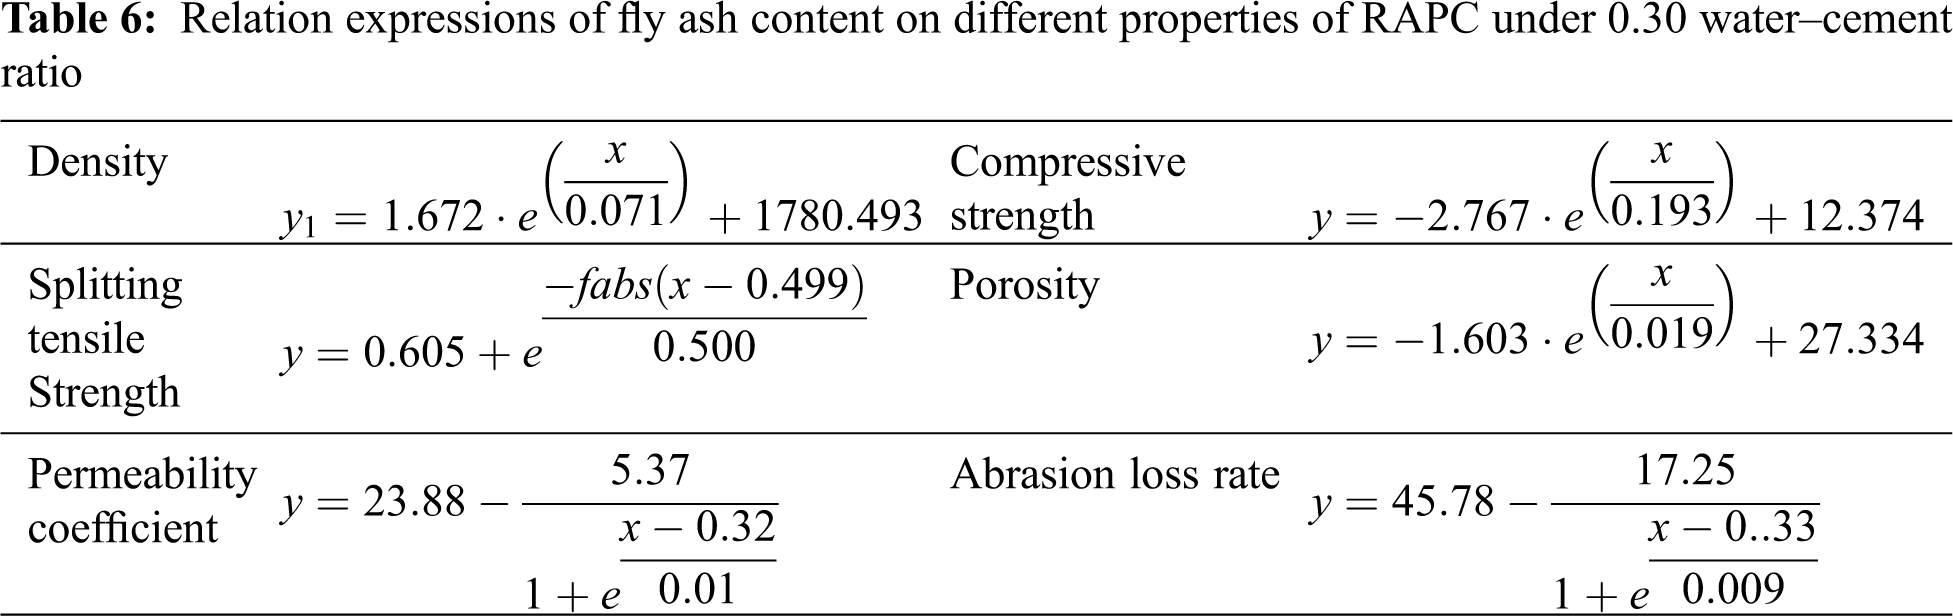
Fig. 10 shows the regression analysis diagram of RAPC density, compressive strength, splitting tensile strength, permeability coefficient, porosity, and abrasion loss rate at 0.30 water-cement ratio with different fly ash content. It can be seen that the R2 is 0.99, 0.99, 0.99, 0.99, 0.94 and 0.87, and the corresponding RAPC properties are density, compressive strength, compressive strength, splitting tensile strength, porosity, water permeability coefficient, abrasion loss rate, respectively. It can be seen from Tab. 6 that four fly ash replacement levels are in an exponential relationship with RAPC density, compressive strength, splitting tensile strength, porosity, permeability coefficient, and abrasion loss rate under 0.30 water-cement ratio.
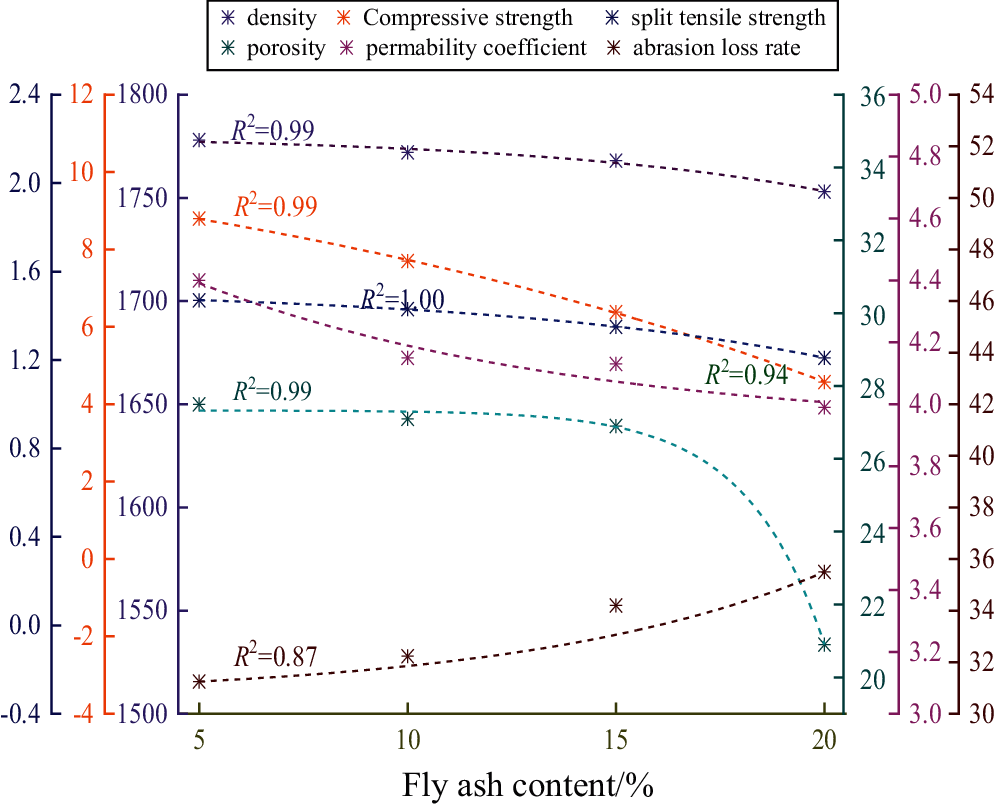
Figure 10: Regression analysis of fly ash content on different properties of RAPC under 0.30 water-cement ratio
4.3 Analysis of Optimal Results
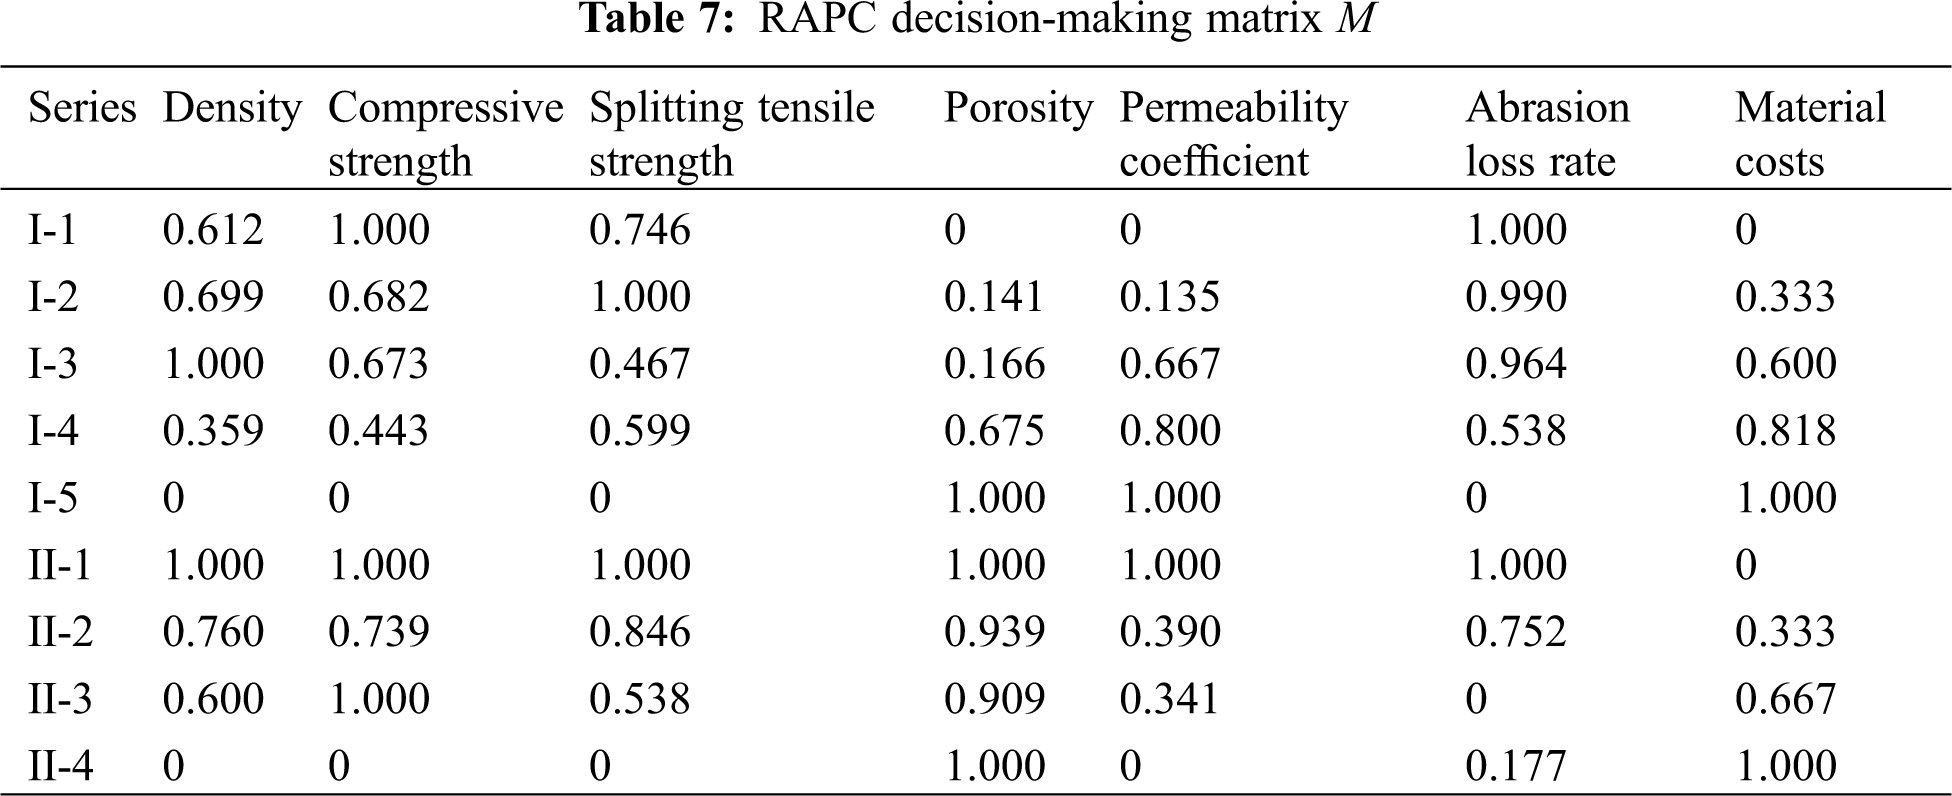
According to the modeling steps in Section 3, the decision-making matrix M is obtained, as shown in Tab. 7. The density, compressive strength, splitting tensile strength, porosity and permeability coefficient of RAPC are measured by tests and belong to the benefit type index. They are calculated according to Eq. (4). The abrasion loss rate and material costs belong to the cost type index. They are calculated according to Eq. (5). The prices of materials are all based on the current market price, and the price of recycled aggregate is calculated according to the actual utilization.
According to Eqs. (8)–(11), the weights w1 and w2 are calculated, as shown below:
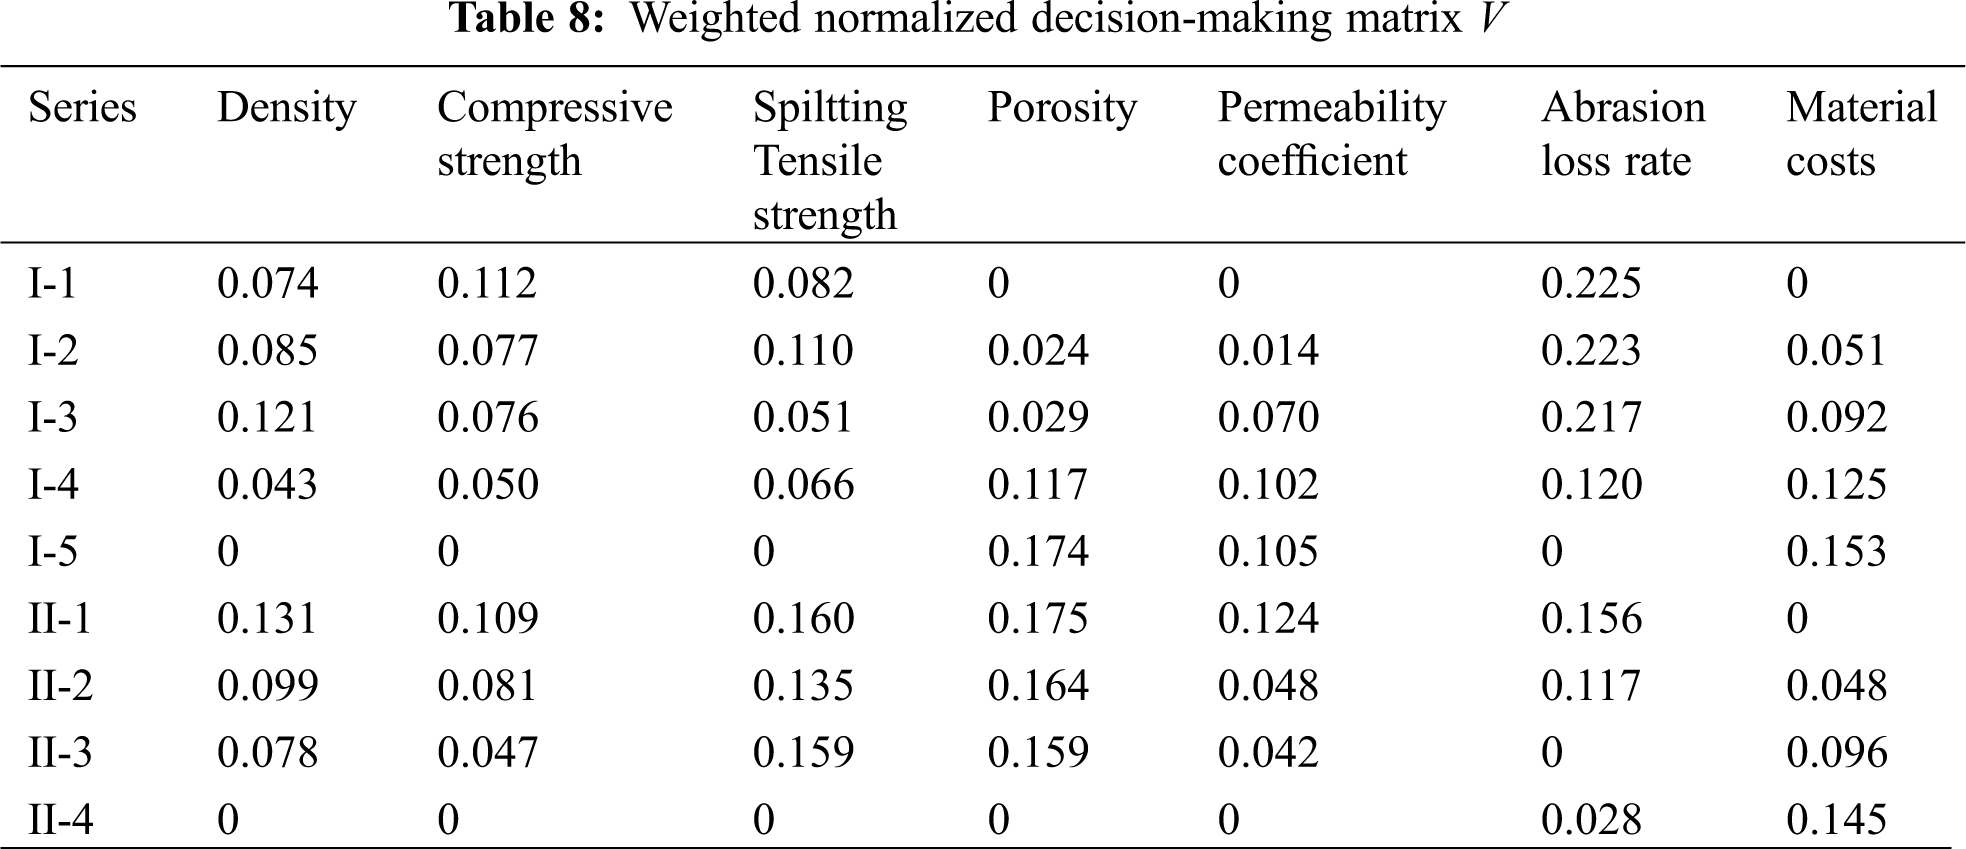
Then, according to Eq. (12), the weighted normalized decision-making matrix is obtained, as shown in Tab. 8.
The calculated optimal value and worst value are as follows:
The calculated optimal grey correlation degree, worst grey correlation degree and relative closeness are shown in Fig. 11.
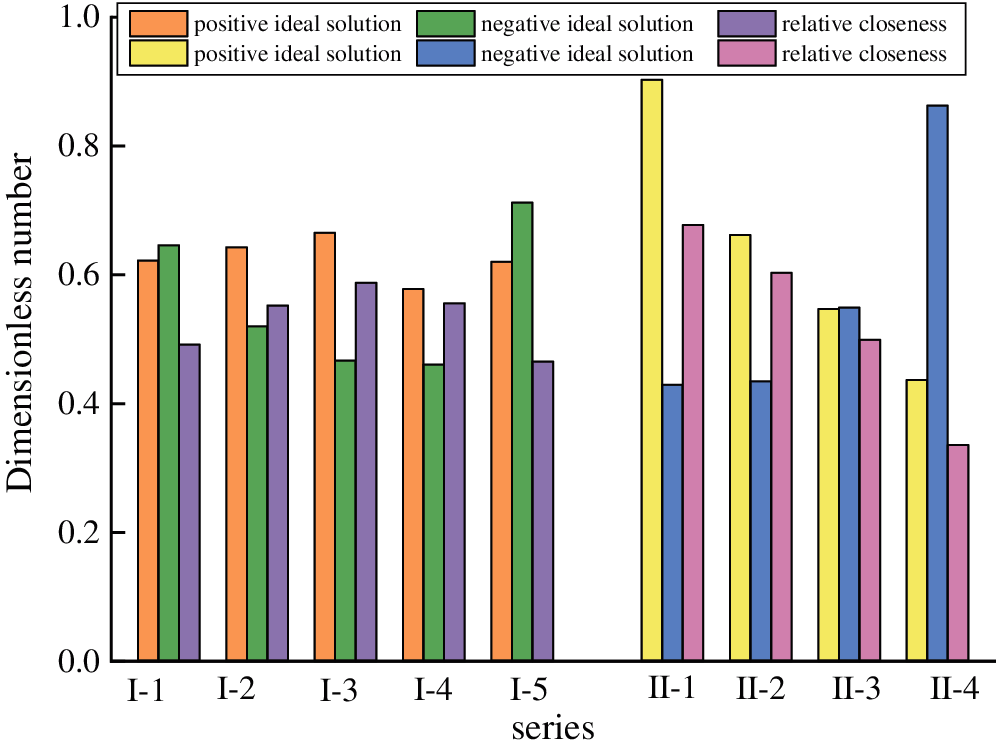
Figure 11: The ideal solution and relative closeness of the two series of RAPC
Fig. 11 shows that the optimal value (positive ideal solution value) and relative closeness of Series I-3 (water-cement ratio of 0.30) reach the maximum of 0.665 and 0.587, respectively, which indicate that under the water-cement ratio of 0.30, Combined with the evaluation indexes of RAPC compressive strength, splitting tensile strength, porosity, permeability coefficient, abrasion loss rate and material costs to judge the comprehensive optimal scheme. The worst value (negative ideal solution value) of Series I-5 is the biggest and the relative closeness is the smallest, respectively 0.712 and 0.466, indicating that the mix proportion is relatively unfavorable for the RAPC evaluation index selected this time. The optimal value and relative closeness of Series II-1 (Fly ash content of 5%) reach the maximum value of 0.903 and 0.678 in Series II, which indicate that 5% fly ash content leads to the best performance, and Series II-2, Series II-3, and Series II-4 respectively follow behind Series II-1.
4.4 Ecological and Economic Analysis on the Mix Proportion of RAPC
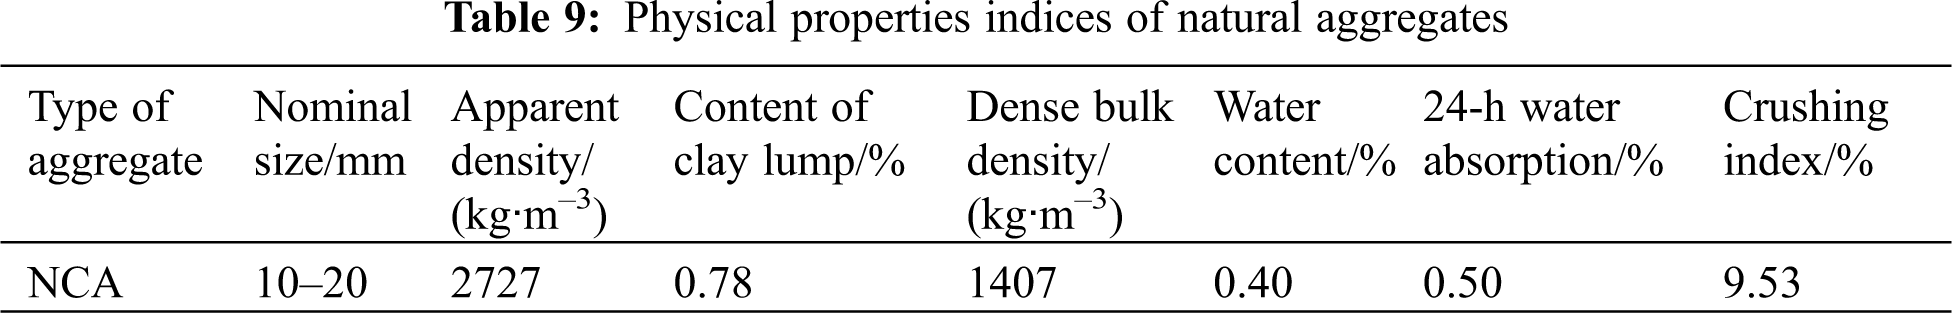
One of the core values of RAPC is its ability to bring considerable ecological and economic benefits. The ecological benefits in this article use the calculated values of EE and ECO2e as the final recommendation [43]. Economic benefits are calculated using the most direct market unit price. Natural aggregates with the same particle size (10–20 mm) as the recycled aggregate were selected for comparison for more a complete comparison. The physical performance index of natural aggregate is shown in Tab. 9. The ecological calculation of concrete raw materials is shown in Tab. 10.
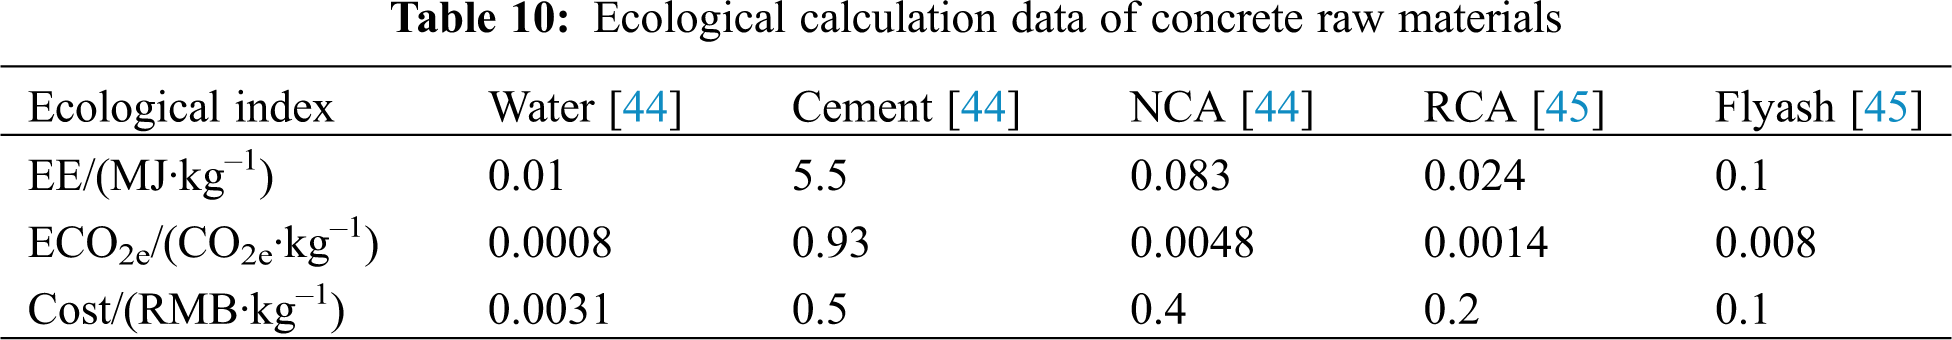
Tab. 10 shows the ecological calculation data of concrete raw materials. Since this experiment was completed in the laboratory, the ecological indexes of the production process were not considered. It can be seen that the EE and ECO2e of cement are both the biggest, indicating that the ecological benefits of the specimens with low water-cement ratio are relatively low [45]. Fig. 12 shows the diagram of ecological and economic calculations taking into account natural aggregates and Series I and Series II. In this Figure, N-0.30 represents the natural aggregate pervious concrete with a water-cement ratio of 0.30. It can be seen that the EE and ECO2e of the pervious concrete show a downward tendency with the increase of the water-cement ratio in the natural aggregates series and Series-I and the variation tendencies of them are the same. Comparing N-0.30 with Series I-3 (water-cement ratio of 0.30), it is found that EE and ECO2e increased by 4.73% and 1.63% in natural aggregate compared with recycled aggregate, indicating that recycled aggregate has ecological benefits [45]. The regulars of Series II and Series I is similar, both EE and ECO2e decrease with the cement content decreases. Combining the results in Section 4.3, it can be found that there is not much difference between Series I-3 and Series II-1 in the optimal results, but there remains a difference in EE and ECO2e. The difference is 5.06% and 6.9%, respectively. The ecological benefits of Series II-1 are more obvious. In the aspect of economics, the economic benefits of natural aggregates far exceed recycled aggregates, the production costs of N-0.30 increased by 64.24% compared with Series I-3 and increased by 66.62% compared with Series II-1. The production costs of Series I-3 increased by 1.45% compared with Series II-1, which indicates that the economic benefits of recycled aggregate and fly ash are significant. The ecological and economic benefits of the combination of them are most obvious.
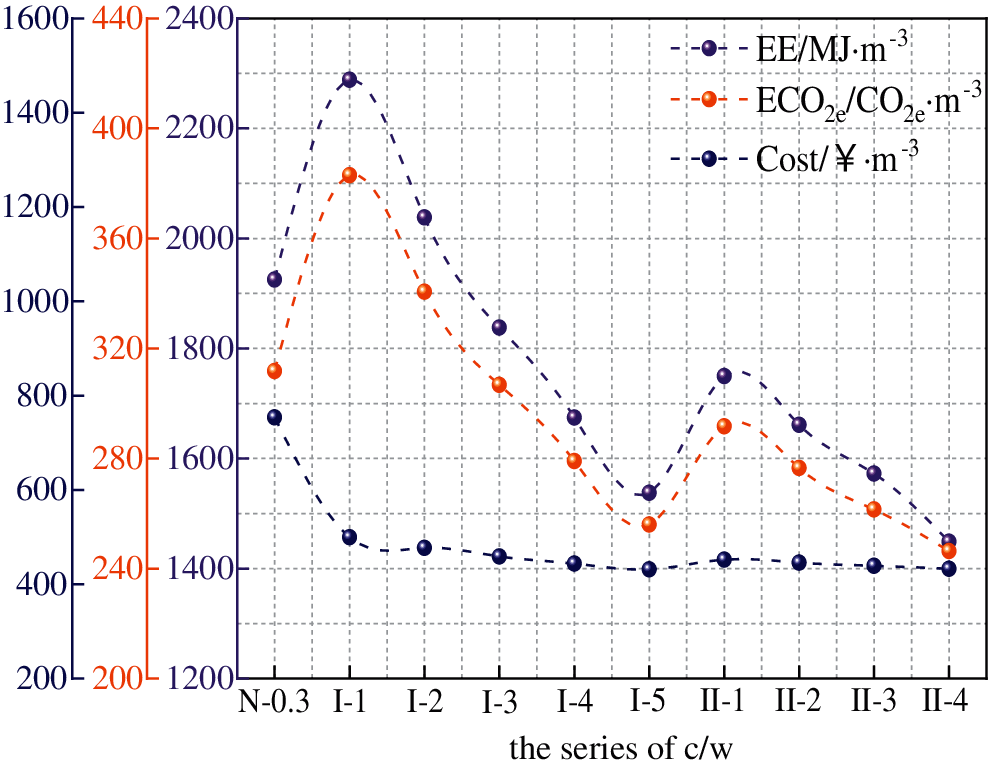
Figure 12: Ecological and economic calculation diagram
(1) Through a series of tests, RAPC meeting the standard of ACI [21] for pervious concrete was prepared, Meantime, Reducing the amount of cement resulted in a significant decrease in the strength of RAPC. Low cement content also has a negative influence on abrasion resistance. Hence, the RAPC of high water-cement ratio is not suggested to be used in actual projects. There is a positive impact on the permeability of RAPC with a high water-cement ratio. For areas with a high demand for water permeability properties, the water-cement ratio of RAPC can be appropriately increased to meet the requirements.
(2) The influence of replacing cement with fly ash on the properties of RAPC (28 days) is not substantial, but there are significant ecological and economic benefits. Compared with natural aggregate pervious concrete, the combined use of recycled aggregate and fly ash in pervious concrete can decrease CO2 emission by 6.9%–26.55% and material costs by 66.62%–74.19% per cubic meter.
(3) By establishing an optimal model based on the GRA-TOPSIS method, the optimal mix ratio of 0.30 water-cement ratio, 0.30 water-cement ratio with 5% fly ash replacement level of RAPC were determined, respectively. The research of this model has enriched the methods for determining the optimal mix proportion of RAPC and the research results are helpful to establish a standardized, systematic research and application system of RAPC.
Acknowledgement: Thank the Key Laboratory of water conservancy projects of Henan Province and the Key Laboratory of Water Environment Simulation and Treatment of Henan Province for providing test equipment and the help of all partners.
Funding Statement: This work was supported by the National Natural Science Foundation of China (No. 52009045) and National Key Research and Development Program of China (No. 2018YFC0406902).
Conflicts of Interest: The authors declare that they have no conflicts of interest to report regarding the present study.
1. Karak, T., Bhagat, R. M., Bhattacharyya, P. (2013). Municipal solid waste generation, composition, and management: The world scenario. Critical Reviews in Environmental Science and Technology, 43(2), 215. DOI 10.1080/10643389.2013.770353. [Google Scholar] [CrossRef]
2. Tsoumani, A. A., Barkoula, N. M., Matikas, T. E. (2015). Recycled aggregate as structural material. Waste and Biomass Valorization, 6(5), 883–890. DOI 10.1007/s12649-015-9385-0. [Google Scholar] [CrossRef]
3. Yap, S. P., Chen, P. Z. C., Goh, Y., Ibrahim, H. A., Mo, K. H. et al. (2018). Characterization of pervious concrete with blended natural aggregate and recycled concrete aggregates. Journal of Cleaner Production, 181, 155–165. DOI 10.1016/j.jclepro.2018.01.205. [Google Scholar] [CrossRef]
4. Bhutta, M. A. R., Tsuruta, K., Mirza, J. (2012). Evaluation of high-performance porous concrete properties. Construction and Building Materials, 31(3), 67–73. DOI 10.1016/j.conbuildmat.2011.12.024. [Google Scholar] [CrossRef]
5. Zhang, Q., Feng, X., Chen, X., Lu, K. (2020). Mix design for recycled aggregate pervious concrete based on response surface methodology. Construction and Building Materials, 259, 119776. DOI 10.1016/J.CONBUILDMAT.2020.119776. [Google Scholar] [CrossRef]
6. Joshaghani, A., Ramezanianpour, A. A., Ataei, O., Golroo, A. (2015). Optimizing pervious concrete pavement mixture design by using the Taguchi method. Construction and Building Materials, 101(5), 317–325. DOI 10.1016/j.conbuildmat.2015.10.094. [Google Scholar] [CrossRef]
7. Şimşek, B., İç, Y. T., Şimşek, E. H. (2013). A TOPSIS-based Taguchi optimization to determine optimal mixture proportions of the high strength self-compacting concrete. Chemometrics and Intelligent Laboratory Systems, 125(2), 18–32. DOI 10.1016/j.chemolab.2013.03.012. [Google Scholar] [CrossRef]
8. Narong, O. L. C., Sia, C. K., Yee, S. K., Ong, P., Zainudin, A. et al. (2018). Optimisation of EMI shielding effectiveness: Mechanical and physical performance of mortar containing POFA for plaster work using Taguchi Grey method. Construction and Building Materials, 176, 509–518. DOI 10.1016/j.conbuildmat.2018.05.025. [Google Scholar] [CrossRef]
9. Prusty, J. K., Pradhan, B. (2020). Multi-response optimization using Taguchi-Grey relational analysis for composition of fly ash-ground granulated blast furnace slag based geopolymer concrete. Construction and Building Materials, 241(32), 118049. DOI 10.1016/j.conbuildmat.2020.118049. [Google Scholar] [CrossRef]
10. Zhang, Z., Zhang, Y., Yan, C., Liu, Y. (2017). Influence of crushing index on properties of recycled aggregates pervious concrete. Construction and Building Materials, 135(5), 112–118. DOI 10.1016/j.conbuildmat.2016.12.203. [Google Scholar] [CrossRef]
11. Ngohpok, C., Sata, V., Satiennam, T., Klungboonkrong, P., Chindaprasirt, P. (2018). Mechanical properties, thermal conductivity, and sound absorption of pervious concrete containing recycled concrete and bottom ash aggregates. KSCE Journal of Civil Engineering, 22(4), 1369–1376. DOI 10.1007/s12205-017-0144-6. [Google Scholar] [CrossRef]
12. Güneyisi, E., Gesoğlu, M., Kareem, Q., İpek, S. (2014). Effect of different substitution of natural aggregate by recycled aggregate on performance characteristics of pervious concrete. Materials and Structures, 49(1–2), 521–536. DOI 10.1617/s11527-014-0517-y. [Google Scholar] [CrossRef]
13. Ali, M. B., Saidur, R., Hossain, M. S. (2011). A review on emission analysis in cement industries. Renewable and Sustainable Energy Reviews, 15(5), 2252–2261. DOI 10.1016/j.rser.2011.02.014. [Google Scholar] [CrossRef]
14. Ortega, J. M., Letelier, V., Solas, C., Moriconi, G., Climent, M. Á. et al. (2018). Long-term effects of waste brick powder addition in the microstructure and service properties of mortars. Construction and Building Materials, 182, 691–702. DOI 10.1016/j.conbuildmat.2018.06.161. [Google Scholar] [CrossRef]
15. Letelier, V., Ortega, J. M., Tremiño, R. M., Henriquéz-Jara, B. I., Fustos, I. et al. (2020). The use of volcanic powder as a cement replacement for the development of sustainable mortars. Applied Sciences, 10(4), 1460. DOI 10.3390/app10041460. [Google Scholar] [CrossRef]
16. Vieira, G. L., Schiavon, J. Z., Borges, P. M., da Silva, S. R.,de Oliveira Andrade, J. J. (2020). Influence of recycled aggregate replacement and fly ash content in performance of pervious concrete mixtures. Journal of Cleaner Production, 271(3), 122665. DOI 10.1016/j.jclepro.2020.122665. [Google Scholar] [CrossRef]
17. Aoki, Y., Sri Ravindrarajah, R., Khabbaz, H. (2012). Properties of pervious concrete containing fly ash. Road Materials and Pavement Design, 13(1), 1–11. DOI 10.1080/14680629.2011.651834. [Google Scholar] [CrossRef]
18. Liu, H., Luo, G., Wang, L., Gong, Y. (2018). Strength time-varying and freeze-thaw durability of sustainable pervious concrete pavement material containing waste fly ash. Sustainability, 11(1), 176. DOI 10.3390/su11010176. [Google Scholar] [CrossRef]
19. Vázquez-Rivera, N. I., Soto-Pérez, L., St John, J. N., Molina-Bas, O. I., Hwang, S. S. (2015). Optimization of pervious concrete containing fly ash and iron oxide nanoparticles and its application for phosphorus removal. Construction and Building Materials, 93(12), 22–28. DOI 10.1016/j.conbuildmat.2015.05.110. [Google Scholar] [CrossRef]
20. Sherwani, A. F. H., Faraj, R., Younis, K. H., Daraei, A. (2021). Strength, abrasion resistance and permeability of artificial fly-ash aggregate pervious concrete. Case Studies in Construction Materials, 14, e00502. DOI 10.1016/j.cscm.2021.e00502. [Google Scholar] [CrossRef]
21. ACI 522R-10 (2010). Pervious concrete. Farmington Hills: American Concrete Institute Committee. [Google Scholar]
22. ASTM C39/C39M (2010). Standard test method for compressive strength of cylindrical concrete specimens. West Conshohocken, Pennsylvania, US: ASTM Committee on Standards. Annual Book of ASTM Standard. [Google Scholar]
23. ASTM C496/C496M (2011). Standard test method for splitting tensile strength of cylindrical. West Conshohocken, Pennsylvania, US: ASTM Committee on Standards. Annual Book of ASTM Standard. [Google Scholar]
24. ASTM C1754/C1754M (2012). Standard test method for density and void content of hardened pervious concrete specimens. West Conshohocken, Pennsylvania, US: ASTM Committee on Standards. Annual Book of ASTM Standard. [Google Scholar]
25. ASTM C1701/C1701M (2017). Standard test method for infiltration rate of in place pervious concrete. West Conshohocken, Pennsylvania, US: ASTM Committee on Standards. Annual Book of ASTM Standard. [Google Scholar]
26. ASTM C1747/C1747M-13 (2013Standard test method for determining potential resistance to degradation of pervious concrete by impact and abrasion. West Conshohocken, Pennsylvania, US: ASTM Committee on Standards. Annual Book of ASTM Standard. [Google Scholar]
27. El-Hassan, H., Kianmehr, P., Zouaoui, S. (2019). Properties of pervious concrete incorporating recycled concrete aggregates and slag. Construction and Building Materials, 212(5), 164–175. DOI 10.1016/j.conbuildmat.2019.03.325. [Google Scholar] [CrossRef]
28. Geum, Y., Cho, Y., Park, Y. (2011). A systematic approach for diagnosing service failure: Service-specific FMEA and grey relational analysis approach. Mathematical and Computer Modelling, 54(11–12), 3126–3142. DOI 10.1016/j.mcm.2011.07.042. [Google Scholar] [CrossRef]
29. Kalyon, A., Günay, M., Özyürek, D. (2018). Application of grey relational analysis based on Taguchi method for optimizing machining parameters in hard turning of high chrome cast iron. Advances in Manufacturing, 6(4), 419–429. DOI 10.1007/s40436-018-0231-z. [Google Scholar] [CrossRef]
30. Behzadian, M., Khanmohammadi Otaghsara, S., Yazdani, M., Ignatius, J. (2012). A state-of the-art survey of TOPSIS applications. Expert Systems with Applications, 39(17), 13051–13069. DOI 10.1016/j.eswa.2012.05.056. [Google Scholar] [CrossRef]
31. Zhoul, W., Jiang, W. (2010). Two-phase TOPSIS of uncertain multi-attribute group decision-making. Journal of Systems Engineering and Electronics, 21(3), 423–430. DOI 10.3969/j.issn.1004-4132.2010.03.012. [Google Scholar] [CrossRef]
32. Hu, Y., Wu, L., Shi, C., Wang, Y., Zhu, F. (2019). Research on optimal decision-making of cloud manufacturing service provider based on grey correlation analysis and TOPSIS. International Journal of Production Research, 58(3), 748–757. DOI 10.1080/00207543.2019.1600760. [Google Scholar] [CrossRef]
33. Büyüközkan, G., Çifçi, G. (2012). A novel hybrid MCDM approach based on fuzzy DEMATEL, fuzzy ANP and fuzzy TOPSIS to evaluate green suppliers. Expert Systems with Applications, 39(3), 3000–3011. DOI 10.1016/j.eswa.2011.08.162. [Google Scholar] [CrossRef]
34. Lin, Z., Wen, F., Wang, H., Lin, G., Mo, T. et al. (2018). CRITIC-based node importance evaluation in skeleton-network reconfiguration of power grids. IEEE Transactions on Circuits and Systems II: Express Briefs, 65(2), 206–210. DOI 10.1109/TCSII.2017.2703989. [Google Scholar] [CrossRef]
35. Xu, H., Deng, Y. (2018). Dependent evidence combination based on Shearman coefficient and Pearson coefficient. IEEE Access, 6, 11634–11640. DOI 10.1109/ACCESS.2017.2783320. [Google Scholar] [CrossRef]
36. Lu, M. (2020). Node importance evaluation based on neighborhood structure hole and improved TOPSIS. Computer Networks, 178, 107336. DOI 10.1016/j.comnet.2020.107336. [Google Scholar] [CrossRef]
37. Fan, W. L., Hu, P., Liu, Z. G. (2016). Multi-attribute node importance evaluation method based on Gini-coefficient in complex power grids. IET Generation, Transmission & Distribution, 10(9), 2027–2034. DOI 10.1049/iet-gtd.2015.0803. [Google Scholar] [CrossRef]
38. Gearhart, A., Booth, D. T., Sedivec, K., Schauer, C. (2013). Use of Kendall’s coefficient of concordance to assess agreement among observers of very high resolution imagery. Geocarto International, 28(6), 517–526. DOI 10.1080/10106049.2012.725775. [Google Scholar] [CrossRef]
39. Lian, C., Zhuge, Y. (2010). Optimum mix design of enhanced permeable concrete—An experimental investigation. Construction and Building Materials, 24(12), 2664–2671. DOI 10.1016/j.conbuildmat.2010.04.057. [Google Scholar] [CrossRef]
40. Wang, X. Y. (2018). Analysis of hydration and strength optimization of cement-fly ash-limestone ternary blended concrete. Construction and Building Materials, 166, 130–140. DOI 10.1016/j.conbuildmat.2018.01.058. [Google Scholar] [CrossRef]
41. Muthaiyan, U. M., Thirumalai, S., Hussain, R. R. (2017). Studies on the properties of pervious fly ash-cement concrete as a pavement material. Cogent Engineering, 4(1), 1318802. DOI 10.1080/23311916.2017.1318802. [Google Scholar] [CrossRef]
42. Wang, H., Li, H., Liang, X., Zhou, H., Xie, N. et al. (2019). Investigation on the mechanical properties and environmental impacts of pervious concrete containing fly ash based on the cement-aggregate ratio. Construction and Building Materials, 202, 387–395. DOI 10.1016/j.conbuildmat.2019.01.044. [Google Scholar] [CrossRef]
43. Palankar, N., Ravi Shankar, A. U., Mithun, B. M. (2016). Durability studies on eco-friendly concrete mixes incorporating steel slag as coarse aggregates. Journal of Cleaner Production, 129(3), 437–448. DOI 10.1016/j.jclepro.2016.04.033. [Google Scholar] [CrossRef]
44. Rajamane, N. P., Nataraja, M. C., Jeyalakshmi, R., Nithiyanantham, S. (2015). Greener durable concretes through geopolymerisation of blast furnace slag. Materials Research Express, 2(5), 55502. DOI 10.1088/2053-1591/2/5/055502. [Google Scholar] [CrossRef]
45. Visintin, P., Xie, T., Bennett, B. (2020). A large-scale life-cycle assessment of recycled aggregate concrete: The influence of functional unit, emissions allocation and carbon dioxide uptake. Journal of Cleaner Production, 248(12), 119243. DOI 10.1016/j.jclepro.2019.119243. [Google Scholar] [CrossRef]
 | This work is licensed under a Creative Commons Attribution 4.0 International License, which permits unrestricted use, distribution, and reproduction in any medium, provided the original work is properly cited. |