| Journal of Renewable Materials |
DOI: 10.32604/jrm.2022.017230
ARTICLE
Drag Reduction Characteristics of Microstructure Inspired by the Cross Section of Barchan Dunes under High Speed Flow Condition
College of Materials Science and Technology, Nanjing University of Aeronautics and Astronautics, Nanjing, 210016, China
*Corresponding Authors: Yizhou Shen. Email: shenyizhou@nuaa.edu.cn; Jie Tao. Email: taojie@nuaa.edu.cn
Received: 23 April 2021; Accepted: 07 July 2021
Abstract: A new type of microstructure inspired by the cross section of barchan dunes was proposed to reduce windage, which was considered as a passive drag reduction technology in aerospace manufacturing field. Computational fluid dynamics method was carried out to discuss the effect of the microstructure on the skin friction reduction under high velocity flow condition. Different microstructure heights were employed to survey the reduction of drag. The results illustrated that the appearance of microstructure led to a generation of pressure drag in non-smooth model (with microstructures inspired by cross section of barchan dune) in contrast to smooth model. However, the microstructure significantly increased the thickness of the low-speed fluid by 11.4% in the near-wall flow field, causing the low-speed fluid to rise and decreasing the velocity gradient near the wall, thereby reducing viscous resistance. In addition, high-speed fluid flowed above the microstructure units instead of along the inner side of the units due to the influence of micro-vortex, resulting in a reduction of friction near the surface. Furthermore, micro-vortex was considered to be the significant internal factor to achieve turbulent drag reduction since it could not only reduce the viscous resistance by promoting the fluid flow above the microstructure but also provide a reverse thrust force. The understanding of the mechanism of drag reduction provides theoretical guidance for further fabrication of drag reduction coatings using renewable materials.
Keywords: Barchan dunes; microstructure; high-speed flow; micro-vortex
In recent years, the proportion of air transport in the transportation industry is becoming larger with the development of economy. Due to the severe challenges posed by climate change, modern aviation technology developments are driven by the requirement of energy conservation and environmental protection. The need for greatly reduced greenhouse gases such as carbon dioxide and nitrogen oxides, will establish a new criterion in aeronautical material design. It is worth noting that emissions can be significantly reduced by curtailing fuel consumption, which can be achieved by reducing the drag generated during flight. Therefore, it is important to reduce skin friction, a major element of the overall drag, for the purpose of fuel consumption during flight. It has been reported that almost half of total drag is due to the viscous drag, which is directly related to the friction drag of the aircraft [1]. Meanwhile, viscous drag can be further reduced more than 40% through flow-control technologies, which is equivalent to about 15% of the total drag [2]. With the exploration of drag reduction technologies, a variety of viscous drag reduction methods have been proposed and developed, such as plasma method [3], periodic perturbation method [4], push-pull airflow method [5], and separation suppression method [6], which can be roughly ranged to active drag reduction methods. However, extra applying control devices and additional energy consumption are required to implement these methods for drag reduction, leading to the limitations in industrial applications. In contrast, passive drag reduction methods, such as surface coating methods [7], flexible wall methods [8], and bionic non-smooth surface methods [9], can effectively reduce viscous drag by adjusting configuration or constructing surface texture without extra energy consumption, attracting extensive attentions in aerospace manufacturing field.
As a typical type of passive drag reduction methods, bionic non-smooth surface methods have been raised in early 1970s [10]. Significantly drag resistance phenomenon reveals that non-smooth surface achieves higher drag reduction than traditional smooth surface. Subsequently, riblet structures inspired by the shapes of shark skin were fabricated on an aluminum test plate at National Aeronautics and Space Administration (NASA) Lang-ley Research Centre, yielding a turbulent drag reduction of 8% [11,12]. Moreover, a maximum drag reduction of 26% was achieved at 4900 Re (Reynolds number) by constructing continuous blades structures in closed channel air flow test [13]. Further researches indicated that the riblets exhibited greater drag reduction effectiveness in the turbulent boundary layer region than in the laminar sublayer [14]. Additionally, similar work suggested that riblets could weaken turbulence intensity and reduce Reynolds shear stresses in the near-wall region [15]. Mechanism analysis showed that drag reduction was attributed to the function of riblets to lift and pin streamwise vortices in the turbulent sublayer [14]. Lifting reduces shear stresses by decreasing contact area between surfaces and riblets tips while reducing the flow velocity between riblets [16]. Likewise, pinning of streamwise vortices can reduce momentum transfer dissipates from vortex interaction in the turbulent sublayer significantly [16,17]. Through evolution, secondary vortex theory [18] and protrusion height theory [19] have been proposed and widely accepted under streamwise condition. Furthermore, 2% reduction in the total drag force was estimated on Airbus 320 during flight tests, with riblet structures covering over 70% of surface [20]. This indicated that bionic riblet structures have been successfully applied to drag reduction not only in the laboratory but also in aviation industrial applications.
However, traditional riblet structures inspired by shark skin are more suitable for hydrodynamic drag reduction than aerodynamic drag reduction, owing to the limitations of shark’s living environment [21,22]. Attention also needs to be focused on special non-smooth structures inspired of objects which are affected by airflow environment. Notably, the barchan dunes provide a new method to reduce the air resistance based on their characteristics of maintaining morphological stability in the wind field [23]. Since barchan dunes are composed of a large number of individual movable grit, the stable geometry shape should withstand minimal aerodynamic resistance. Unlike the conventional passive drag reduction method, the flow direction is parallel to the arrangement of barchan dunes instead of perpendicular to the arrangement of riblets inspired by shark skin. Recent research indicated that the secondary vortex structure is the key factor to drag reduction on such surface [24]. Simulations were carried out to obtain drag reduction characteristics for the structures inspired by barchan dunes, which proved a significant skin friction reduction effect, with a certain cross-section parameter and a maximum drag reduction of 33.63% at a fluid speed of 30 m/s [25].
Although structures inspired by cross section of barchan dunes exhibit excellent drag reduction in the aerodynamic field, nevertheless, previous researches are mainly limited to the drag variations caused by large-size (millimeter range) structure under the condition of low-speed air flow. Obviously, uncertainties still exist in extrapolating outcomes from low speed to high speed, High-Reynolds-number flows. Moreover, the interactions between inner and outer wall mechanisms and the role of the structural scale in the increasing speed have not yet been reported in detail. In this work, the effectiveness of micro-structure inspired by cross section of barchan dune on drag reduction performance was studied using computational fluid dynamics (CFD) methods under high-speed flow condition. Pressure distribution and velocity analysis were mainly used to characterize the variation of flow field. Furthermore, the drag reduction mechanism was also analyzed to provide theoretical guidance for the design and optimization of microstructures in aeronautical applications, thereby providing technical support for further fabrication of drag reduction coatings using renewable materials.
2 Numerical Simulation Approach
2.1 The Establishment of Physical Model
The microstructure units are based on the nature barchan dunes, which are shaped by blowing in the same direction [26], as shown in Fig. 1. A stable geometric structure is produced by the distinctive windward side and slip face of barchan dunes, leading to a strong ability to maintain geometric shapes [27–29].
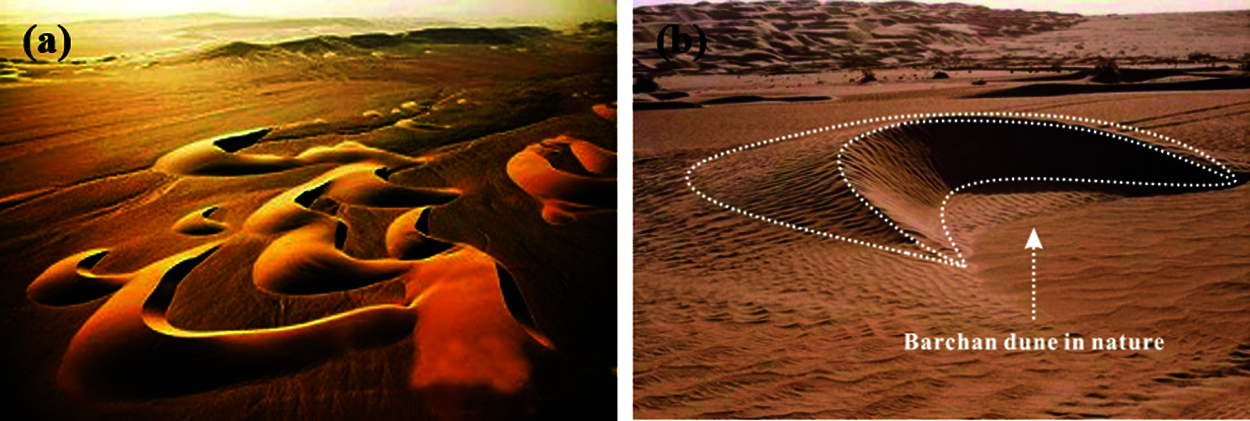
Figure 1: Barchan dune topography, (a) Barchan cluster, (b) A single barchan dune
A typical model of the barchan dune is constructed as a simple geometric shape consisting of the symmetrical windward side and slip face, as presented in Fig. 2a. The typical cross-sections were extracted from the model in order to simplify the calculation process. Subsequently, microstructure unit inspired by typical cross-sections is constructed to right triangle configuration, as observed in Fig. 2b.
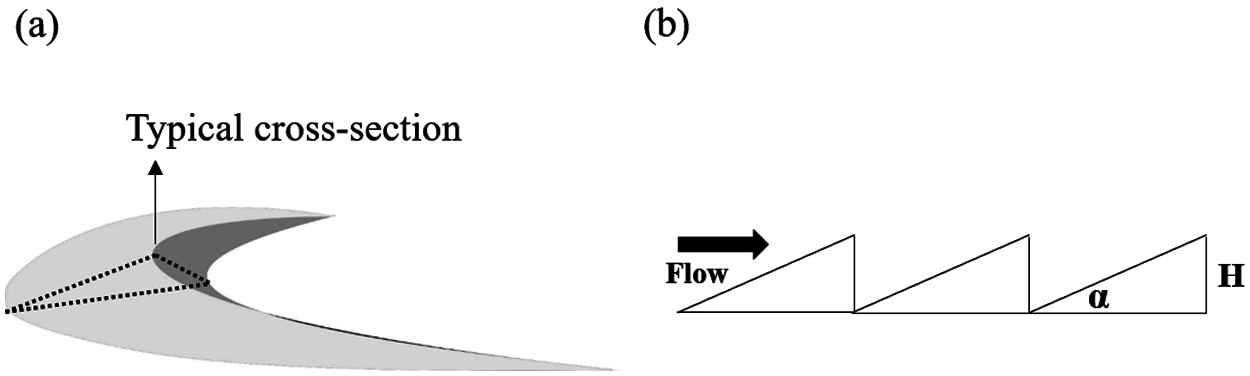
Figure 2: Typical model and cross-section parameters of a structural unit, (a) A single model of barchan dune, (b) Typical cross-section of the model
To investigate the drag reduction effect by the geometrical parameters of microstructure, the height of microstructure (H) and the angle of repose (α) were introduced, which represented the main parameters of the microstructure unit.
2.2 Calculation Domain Selection
A rectangle field was adopted as the computational domain with a length of 400 mm. To avoid the interaction between the top and bottom wall of the calculation model, the height of the rectangle field was defined to be 250 mm. In addition, microstructure with total length of 80 mm was arranged at the middle of the underside of the computational domain. Furthermore, two flat regions were placed in the front and back of the microstructure region with identical length of 60 mm. These regions were created to ensure a steady flow field when the fluid flowed through the microstructure. In view of the compressible flow condition, extra 100 mm lengths were reserved at the inlet and outlet boundary respectively, increasing the precision of the calculation results as shown in Fig. 3. The calculation model was constructed using the software WorkBench 19.2.
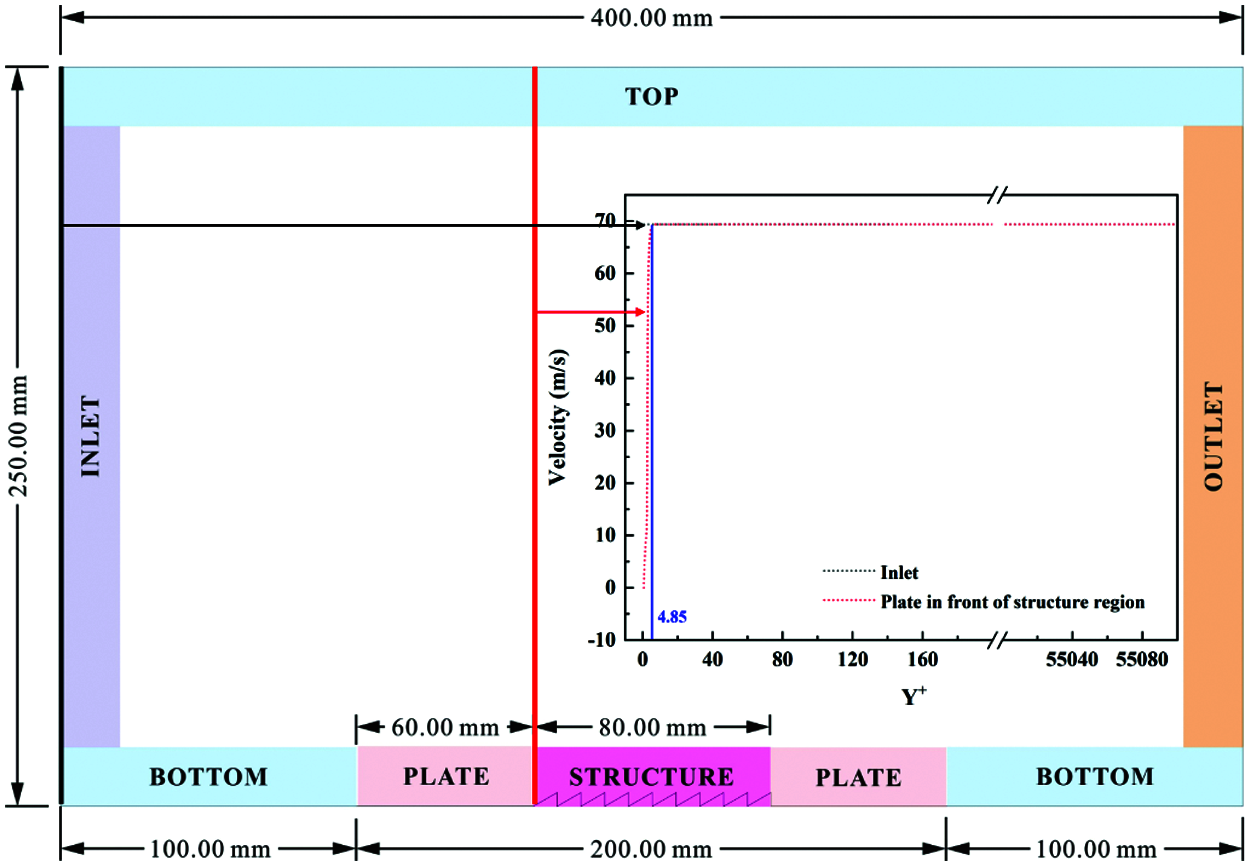
Figure 3: Numerical simulation domain of microstructure surface
For the same geometric structure, the physical model can be changed when the geometric parameter of structure transforms significantly. Thus, it is essential to reconsider the continuity of the physical model due to the fact that the size of structure unit reaches the micron scale. The mean molecular free path of air is 69 nm [30]. Considering the Knudsen’s requirement, it can be assumed that the flow is identified in a continuous region when the size of microstructure is large than 0.69 μm.
Considering applications in aviation field, the flow velocity (U∞) was defined as 250 km/h. The calculation equation of the Reynolds number of a plate is shown below:
where L is the distance from the calculation location to the front of flow field, U∞ is the fluid flowing velocity, and ν is the coefficient of kinematic viscosity.
The coefficient of kinematic viscosity of air is 1.4607 × 10⁻⁵ m2/s. The corresponding ReL is 9.50 × 10⁵, revealing a turbulent state in flow field. The velocity distribution of the inlet part and the front of structure area is inset in Fig. 3. In the direction of altitude, the velocity at the inlet part is always 69.4 m/s. For the velocity distribution in front of the structure region, a low-speed region appears near the wall due to the fluid flows through the wall. The dimensionless height of this region is only 4.85, so it can be considered that this region completely exists in the viscous layer. It can be considered that the plate region has little influence on the velocity distribution of the flow field. In order to ensure that the microstructure can affect the turbulent boundary layer, the turbulent boundary layer thickness (δL) and the allowable roughness values (kadm) at different speeds need to be determined by following equations:
Realizing the influence of microstructure on boundary layer fluid is an important method to reduce drag. Therefore, the height of microstructure unit should be smaller than the thickness of the turbulent boundary layer, which is calculated to 4.72 mm. In addition, when the height of the microstructure is less than the allowable roughness value, the structure demonstrates a few disturbances to the flow field, which can be considered as a smooth surface. According to the flow velocity used in this work, the allowable roughness value was defined as 21.65 μm. Moreover, the dimensionless roughness k+ was described as following:
where k is the actual roughness, l* is characteristic length. Therein,
According to the flow velocity, the corresponding l* is 4.36 × 10⁻⁶. When the height of the structure is set as 30 μm, the corresponding k+is 6.87. When k+ is less than 5, the structure is considered to be completely located in the viscous zone, revealing a smooth state in dynamic. As the height increases, the structures graduallyxtrude to the turbulent region, which means that the roughness makes an impact on the flow field. Thus, to investigate the drag reduction effect caused by the microstructure, different heights were set as 40, 50, 60, 80, 100, 120 and 140 μm, respectively. On account of the angle (α) processed a typical value around 31° in nature, the angle parameter was defined as 30°.
2.3 Calculation Mathematical Model
The calculation model was analyzed by both incompressible and compressible model. N–S equations were employed as governing equations, simultaneously, the RANS method was introduced to approach the equations and calculate the physical quantity in flow field. Previous researches indicated that the realizable k-ε model was appropriate for describing the boundary layer with precise predictions of boundary layer thickness [31,32]. Additionally, sufficient agreement was achieved using the realizable k-ε model during the comparison of experimental and numerical simulation results [33]. Therefore, the realizable k-ε model was adopted to investigate the effect of microstructure on drag reduction performance.
The equations for turbulent kinetic energy k and rate of energy dissipation ε are described as follows:
where
For ideal gas, the turbulent viscosity coefficient is expressed as following:
The enhanced wall treatment, which was suitable for complex flow in a high-Reynolds-number turbulence model, was used for the near-wall treatment. More specific parameters of above equations can be referred to previous literatures [32,34].
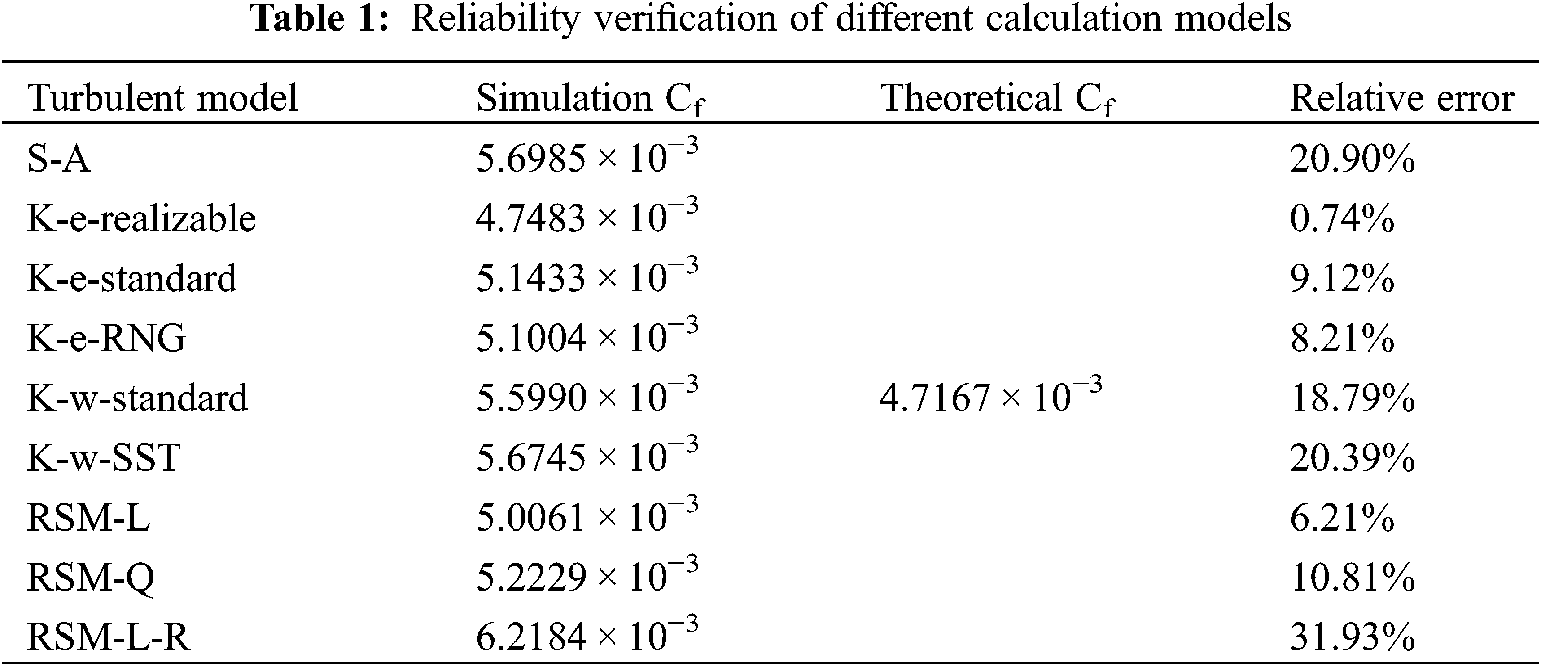
To verify the reliability of realizable k-ε model, different turbulent models were computed in a smooth model with a plate instead of the structural region in comparison with the theoretical value under a certain flowing velocity of 250 km/h, as listed in Tab. 1. Skin friction coefficient (Cf) was used as an evidence for judgement, which was expressed as
Fluent 19.2 was used for numerical simulation. The TOP and BOTTOM regions were defined as symmetry boundary in order to prevent sidewall interference. The detail condition was set as follows:
Moreover, PLATE and STRUCTURE regions were set as stationary walls. Since the fluid is incompressible, the wall temperature is set to a default value of 300 K and the effect of temperature on density is ignored. The no-slip boundary condition was set as follows:
For incompressible flow, the INLET and OUTLET were defined as velocity inlet boundary and pressure outlet boundary, respectively. The inlet velocity was set as follows:
Moreover, the flow is assumed to be fully developed, and the pressure outlet boundary was set as follows:
The grid of the calculation model was established by ICEM 19.2. Inflation layers were adopted on the downside of the computational domain in order to satisfy the computation requirement near the wall. The number of inflation layers was defined as 10, and the growth rate was set as 1.2, as shown in Fig. 4. The calculation formulas for initial height are defined as following:
where τω is the wall shear stress, ρ is the fluid density of 1.225, U∞ is the fluid flowing velocity, Uτ is the velocity calculated by the wall shear stress, y is the initial height, y+ is a non-dimensional parameter that expresses the distance to the wall and μ is the dynamic viscosity. Therefore, the initial height was defined as 1 × 10⁻⁶ mm, which guarantees y+ about 1.
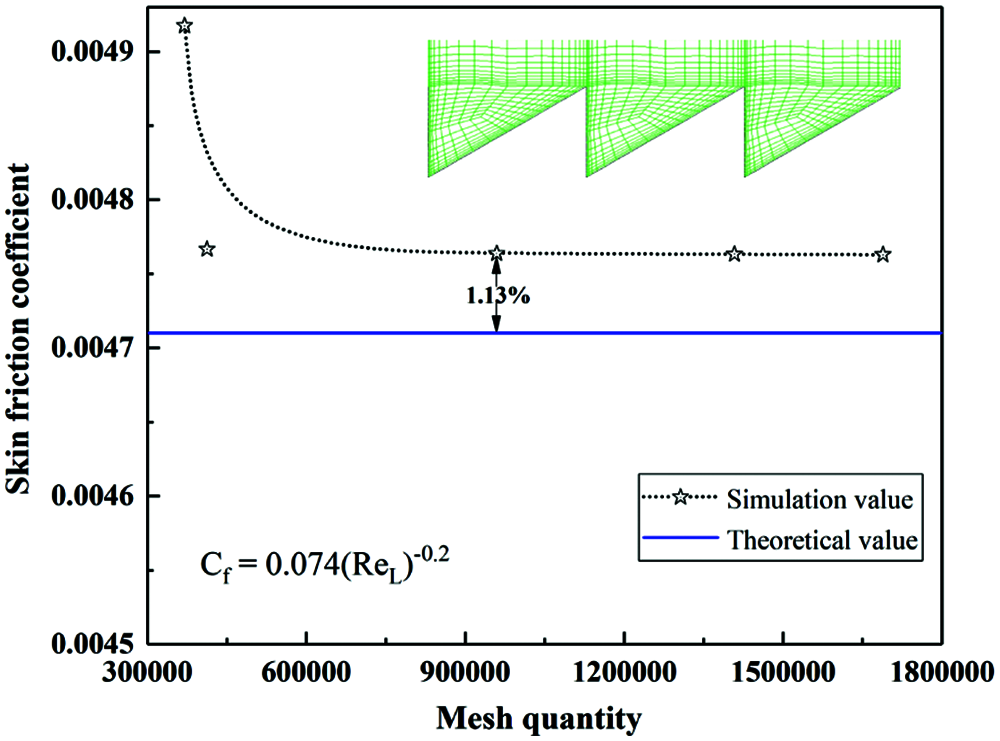
Figure 4: Validation of the grid independence
To implement the verification of grid independence, the inlet velocity is defined as 250 km/h (Re = 9.50 × 10⁵), and the skin friction coefficient of the plate is calculated under five grids with different densities, as shown in Fig. 4. The calculatioresults show that when the grid quantity reaches 412500, the calculated value remains approximately the same. The maximum relative error between the simulation and theoretical results is less than 1.15%. Hence, the above parameters were adopted during the subsequent computing grid.
2.6 Other Preprocessing Settings
The pressure-based solver was selected for incompressible flow condition. A second-order upwind format with higher precision was employed to analyses the dissociation of the momentum, turbulent kinetic energy, and turbulent dissipation rate. The SIMPLEC algorithm was adopted to facilitate a rapid convergence of the calculation under stable conditions. A Green-Gauss node based discrete format was used for the gradient of spatial discretization. All the residual values for determining convergence were set to be less than 10−6. The stability of the import and export flows was also monitored to further ensure the veracity of convergence.
Different flow velocities were selected for simulation calculation and theoretical skin friction coefficient values were compared with simulation results in order to further verify the accuracy of the calculation model. As depicted in Fig. 5, it can be seen that the theoretical skin friction coefficient value is reduced from 4.713 × 10⁻³ to 4.106 × 10⁻³ with the increase of flow velocity. Otherwise, simulation results demonstrate the same tendency with theoretical values. The maximum relative error between the simulation and theoretical results is 6.99%, indicating the reliability of calculation model used in this work. Moreover, the accuracy of the computation was also validated by comparing turbulent flow characteristics over the microstructure surface with previous research results [25]. Optimum drag reduction of up to 32.41% has been achieved, which was slightly lower than the 33.63% obtained by Song et al. [25], revealing the reliability of the model applied in this study.
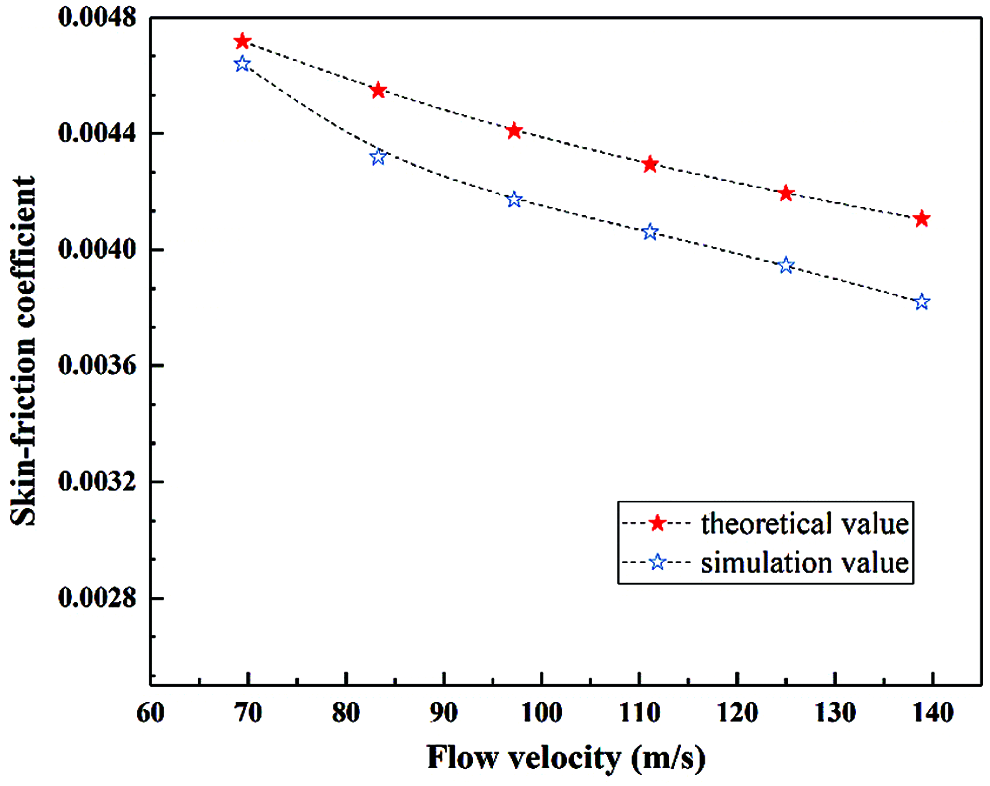
Figure 5: Comparison between calculated values and theoretical values
Drag reduction ratio (RD) is usually used to evaluate drag reduction performance of non-smooth surfaces. The drag reduction rate is calculated using the following equation:
where Fnon-smooth and Fsmooth are the total drag (consist of skin-friction drag and pressure drag) of a model with and without microstructures region in the middle of the calculation domain.
A series of microstructures with different height were adopted to explore the variation of drag reduction under a certain flow velocity of 250 km/h. In contrast, a smooth model was calculated in the same condition. The detailed data of drag variation is listed in Tab. 2. As the smooth model without the microstructure region, the total drag of 2.98 N is entirely composed of viscous resistance. Nevertheless, for the non-smooth model, the microstructure brings a component of pressure drag. Even though the surface area of non-smooth model is larger than that of the flat plate, it is worth noting that the viscous drag of non-smooth model is always lower than that of the plate. As the height increases, the viscous resistance eventually decreases. Additionally, with the increase of the microstructure height, the projected area of the microstructure in the flow direction augments, thereby improving the pressure drag. It is indicated that the viscous drag is dominant in the section with drag reduction effect. It is clearly that the non-smooth model with microstructure height of 50 μm processes an excellent drag reduction ratio of 4.23% due to an appropriate viscous resistance and pressure drag. Thus, drag reduction performance is further explored by adopting this certain microstructure.
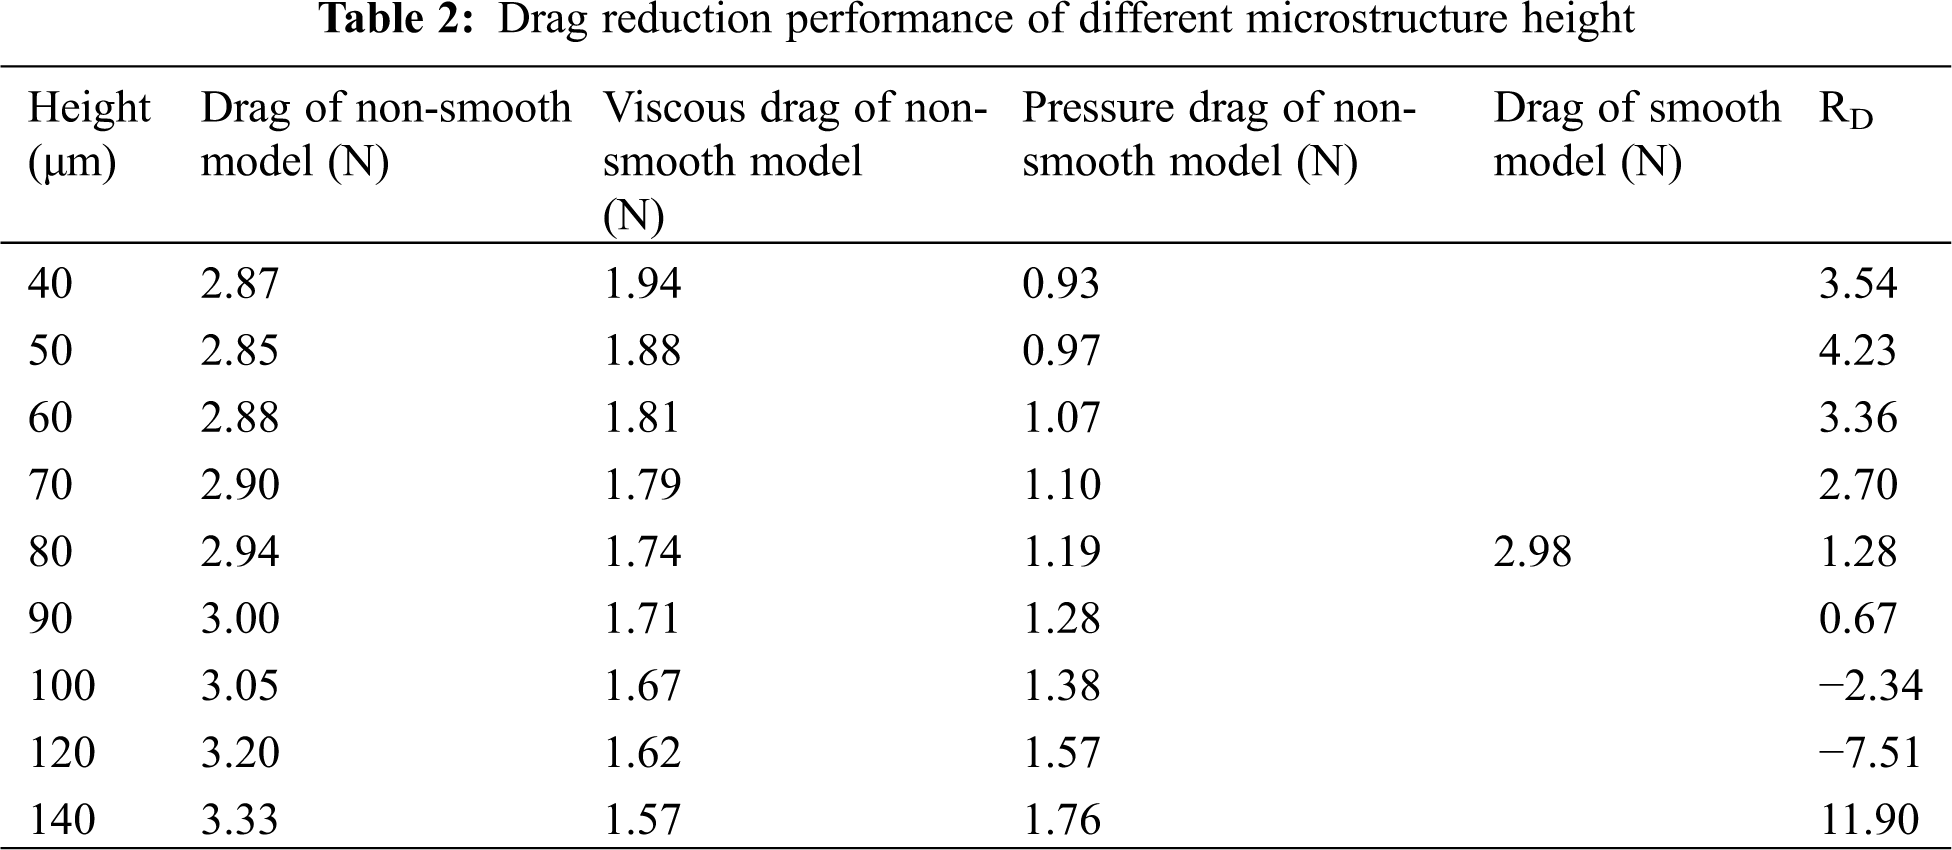
Fig. 6 shows the differences of static pressure between smooth and non-smooth model. It can be seen that a high-pressure region appears in both smooth and non-smooth mode when fluid flow through the surface. Unlike the smooth model where the high-pressure region is limited to near-wall areas, the non-smooth model is significantly affected by the microstructures, which make the high-pressure region occupy the entire flow field in the vertical direction, as illustrated in Fig. 6b. Meanwhile, it is noteworthy that the existence of microstructures divides the flow field into two different pressure regions obviously, leading to the emergence of large areas of low-pressure region. In addition, compared to smooth model with a maximum pressure of 169 Pa, the non-smooth model achieves a higher maximum pressure of 234 Pa, which indicates that the microstructures cause a sudden increase of pressure in local regions.
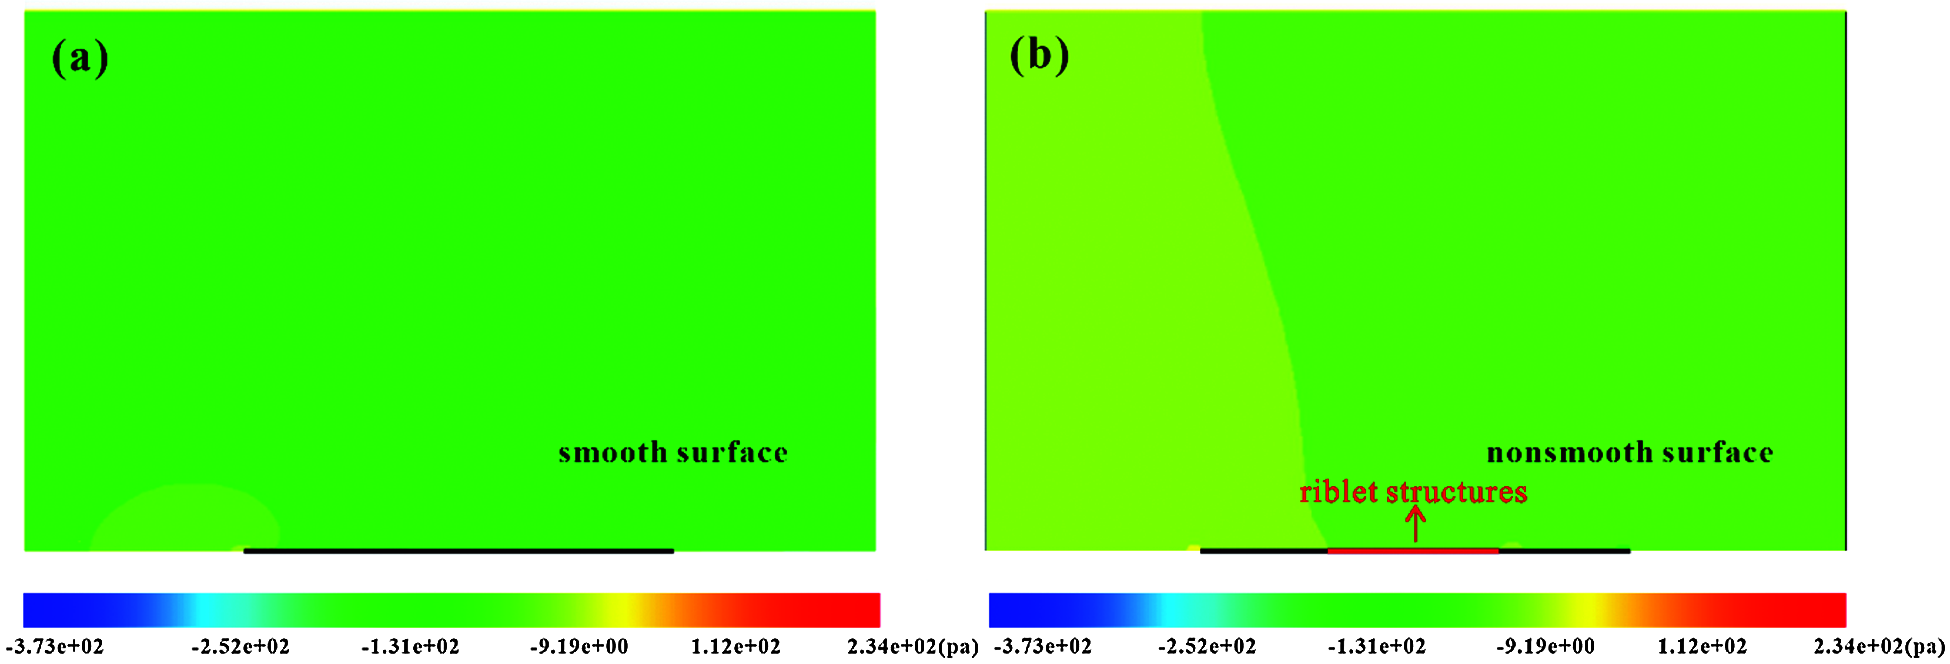
Figure 6: Pressure contour of the flow field. (a) Smooth surface, (b) Non-smooth surface
In order to further investigate the influence of microstructures on the pressure distribution, three positions were selected to observe at 160 mm (initial of structure), 200 mm (middle of structure) and 240 mm (terminal of structure) from the entrance, respectively. Local details are presented and enlarged in the upper right corner, as shown in Fig. 7. As observed in Fig. 7a, it can be seen that when the high-speed fluid flow through the first microstructure, a large amount of fluid is gathered in the upper area of the windward surface of the microstructure, causing the increase of pressure sharply in this area. Meanwhile, in the corresponding area on the leeward side, a negative pressure zone (the pressure less than 0) is formed on account of the inability of fluid to recover quickly. With the further development of the fluid, the flow field basically stabilizes at the middle position of the structure, as exhibited in Fig. 7b. Not only the corresponding high- and low-pressure areas but also the absolute values of pressure are much smaller than those presented in the initial of structure region. Furthermore, when the fluid flows through the end of the structure region, a significant negative pressure zone in a small area behind the structure is appearing, as illustrated in the enlarged area in Fig. 7c. Due to the lack of resistance from microstructures, the speed of the fluid increases suddenly, creating the more significant negative pressure area. Nevertheless, with the high-speed fluid accumulates further, the pressure in the area away from the rear of the microstructures becomes greater, leading to the appearance of another high-pressure region. In general, in contrast to smooth model, the non-smooth model demonstrates an obvious pressure drag caused by microstructures.
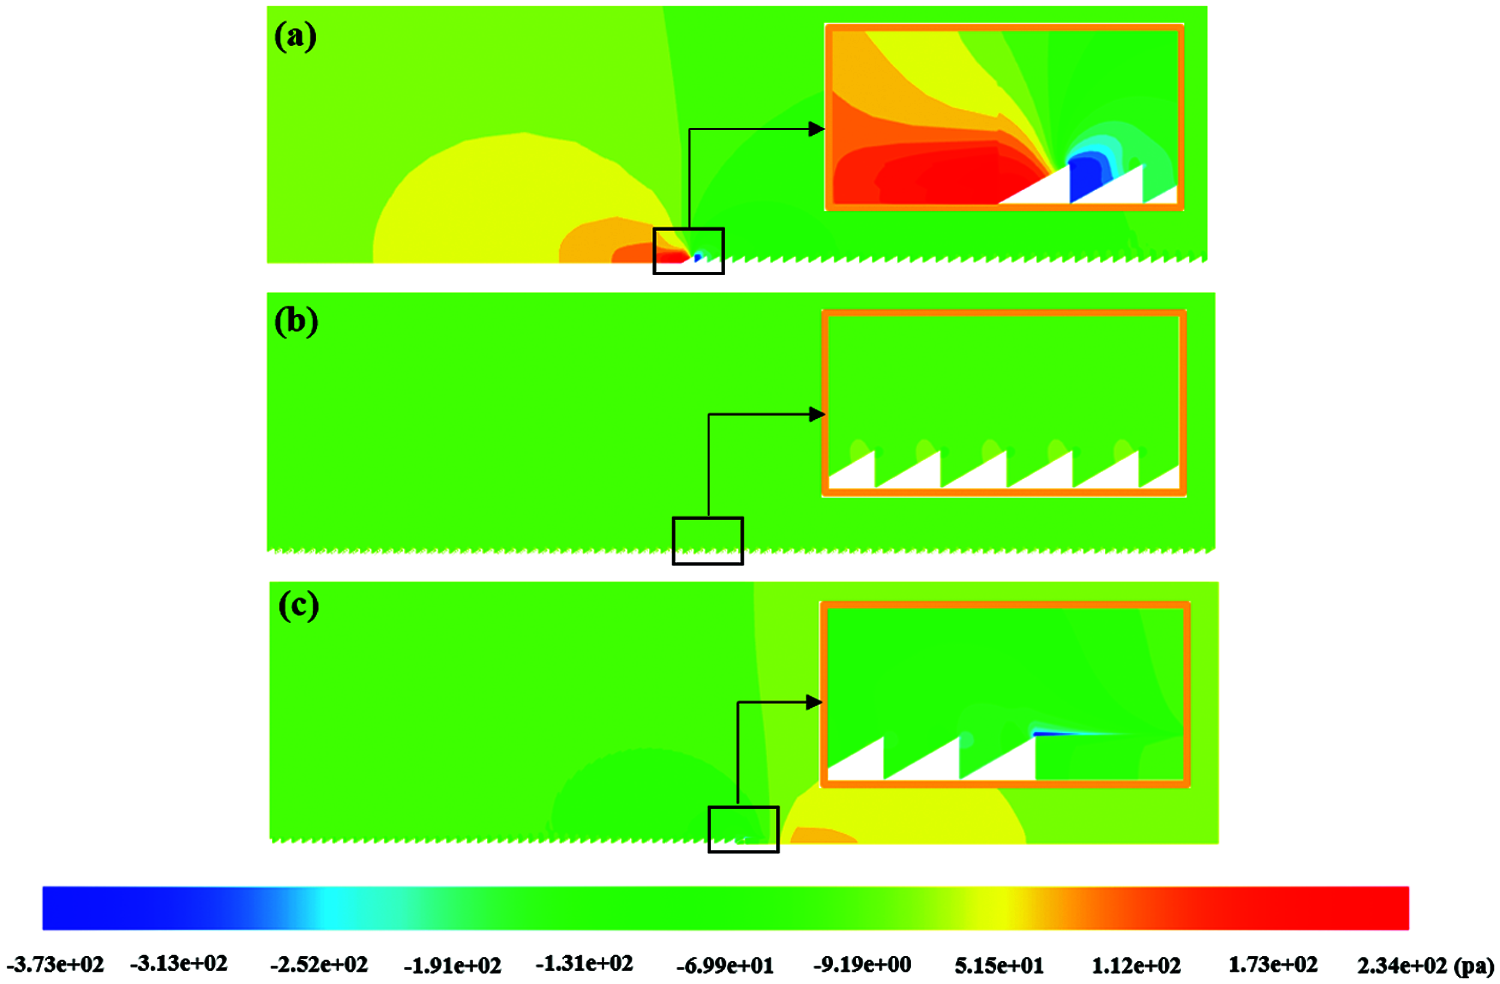
Figure 7: Detailed pressure nephogram of non-smooth model with different positions in the flow direction. (a) 160 mm, (b) 200 mm, (c) 240 mm
For purpose of surveying the influence of the microstructure on the velocity distribution in the flow field, the smooth and non-smooth models are calculated for comparison, as shown in Figs. 8a and 8b. As can be seen from Fig. 8b, despite of the existence of microstructures, the overall distribution of velocity in the non-smooth model shows nearly the same as that in the smooth model. This means that the influence of the microstructures on the velocity distribution is limited to the near-wall region. In order to further explore the influence of the microstructures on the velocity distribution mechanism near the wall, two regions are selected for comparison and analysis at the middle position (200 mm) of the two models, which are marked in blue areas in Figs. 8a and 8b. These regions are enlarged and presented in Figs. 8c and 8d, respectively. It is obvious that the microstructures significantly increase the thickness of the low-speed fluid by 11.4% in the near-wall flow field, causing the low-speed fluid to rise, thereby reducing wall friction resistance. Additionally, the enlarged areas in Figs. 8c and 8d show that a large amount of low-speed fluid is stored inside the microstructures, which can reduce the velocity gradient near the wall more effectively.
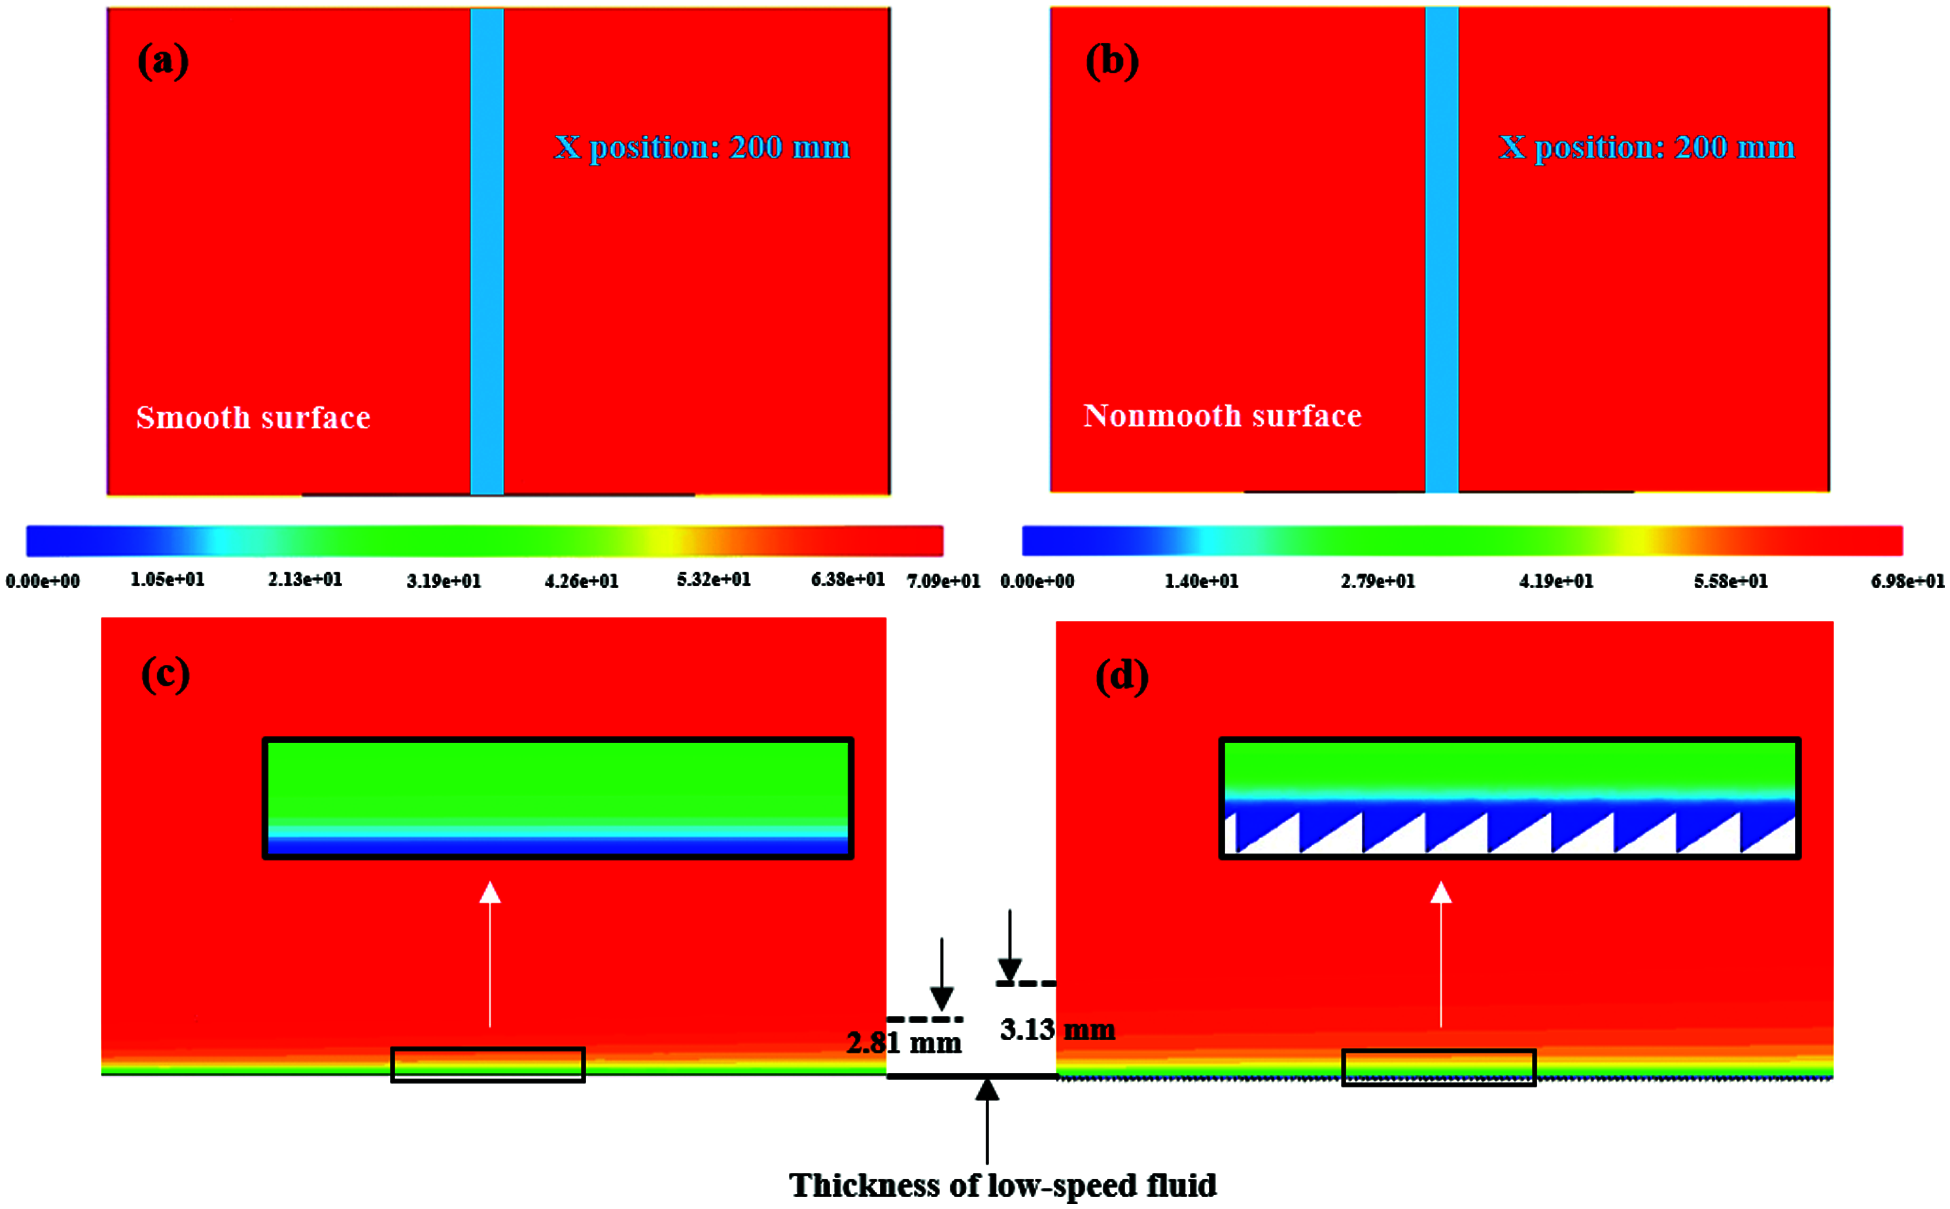
Figure 8: Velocity contour of the flow field. (a) Smooth surface, (b) Non-smooth surface, (c) An amplifying version of the blue region in (a), (d) An amplifying version of the blue region in (b)
A velocity vector graph of the flow field along the middle of microstructures area is extracted in Fig. 9. The enlargement of two microstructures is inserted in the lower side. It is obvious that the low-speed fluid is absorbed by the microstructures which is corresponding to the result obtained from velocity contour. Notably, the velocity component perpendicular to the microstructures is produced when fluid flows through the non-smooth surface. The consistent flow located in the turbulent boundary layer can be considered as a coherent structure which can significantly preserve the low-speed fluid and reduce the turbulent burst strength, as verified by Robinson through experiments [35]. Meanwhile, coherent structure can also enhance the motion stability of the boundary layer fluid. Subsequently, the momentum exchange within the boundary layer is receded, resulting in a reduction of skin friction.
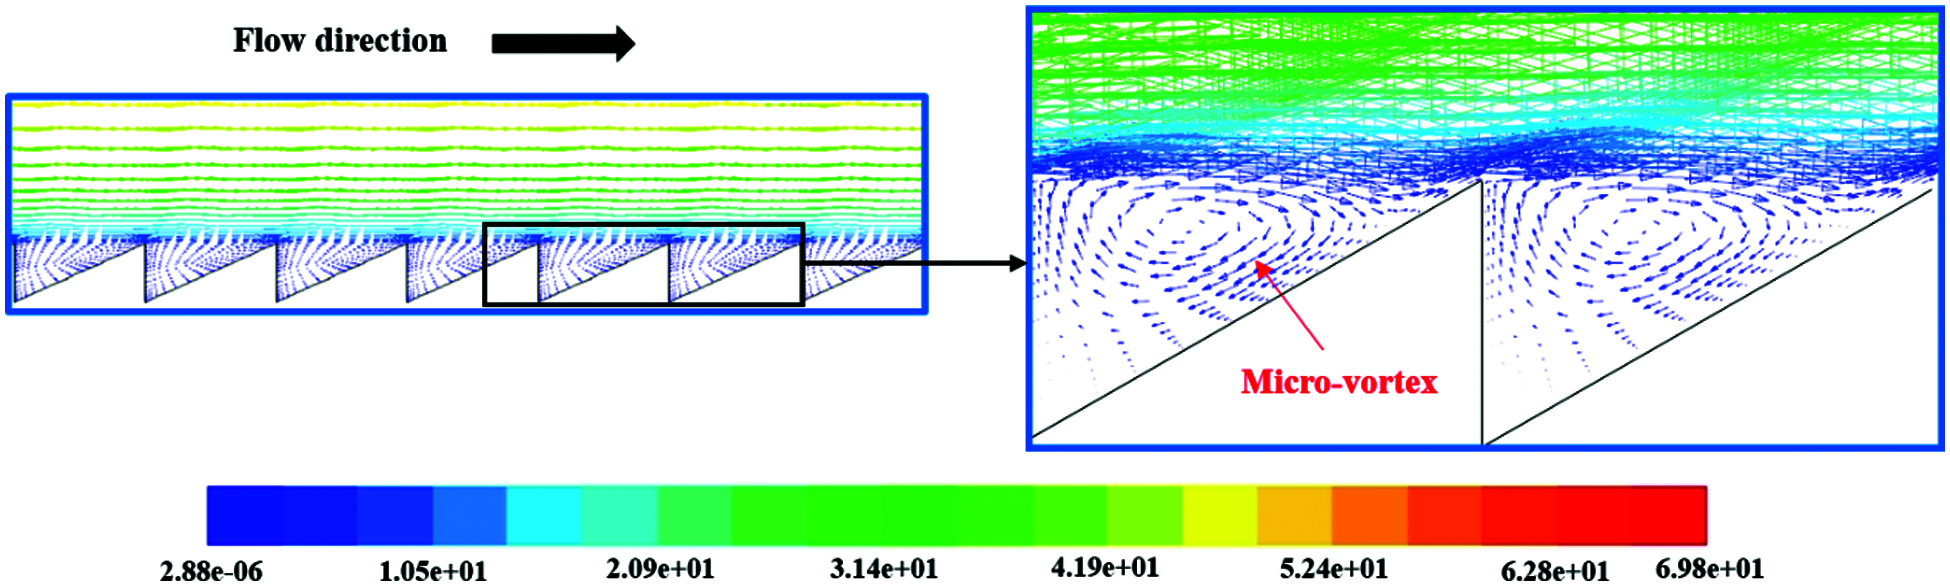
Figure 9: Velocity vector of the flow field
Moreover, the low-speed micro-vortexes are formed within the microstructure units, and each micro-vortex has an extremely similar shape. It is clear that the rotation direction of the bottom of the micro-vortex is opposite to the fluid direction giving rise to the negative velocity in local area, as observed in the enlarged area in Fig. 9. Furthermore, the contact form of the fluid in near wall is transformed when the fluid flows through the microstructure region, on account of the emergence of vortices. High-speed fluid flows above the microstructure units instead of along the inner side of the microstructure, which is similar to the transformation from sliding friction to rolling friction, resulting in a reduction in friction near the surface. This conclusion is consistent with the results depicted in the previous literature [25]. Unlike the rotation direction at the bottom of the micro-vortex, the fluid direction at the top of the micro-vortex is consistent with the flow direction, which also promotes the fluid flow above the microstructure, resulting in a further reduction of the velocity gradient near the surface.
To quantitatively analyze the influence of the microstructure on the horizontal velocity distribution of the flow field, a straight line perpendicular to the bottom surface is selected from the middle position of microstructures region where the flow field is relatively stable and can better reveal the effect of structure on flow field distribution. Meanwhile, the horizontal velocity values along the same line are also extracted. For comparison, the smooth model is also analyzed under the same conditions. As presented in Fig. 10, the distribution of the Reynolds number (Re) with the dimensionless height (Y+) in the two models is revealed. In particular, the low-speed region marked by the blue dotted frame is enlarged and displayed in the upper left corner. In order to show the velocity distribution at the boundary layer clearly, the velocity data in partial high-speed areas are hidden, on account of the extreme similarity of velocity values among the two models.
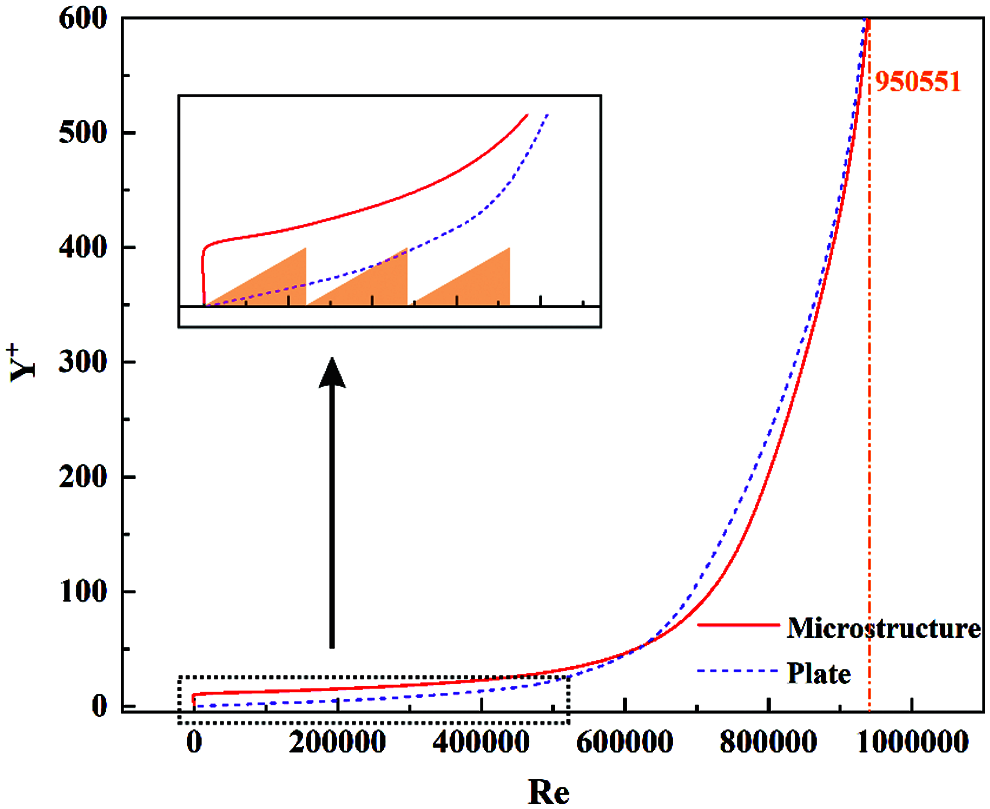
Figure 10: Velocity profile diagram of horizontal direction at the middle of the fluid field
It can be seen that the existence of the microstructure changes the velocity profile at the bottom of the boundary layer. Comparing with the velocity curve of the smooth model, the curve of the non-smooth model is shifted to the left. This indicates that the appearance of microstructure significantly reduces flow velocity near the wall, thereby reducing the viscous resistance. Simultaneously, as observed in the enlarged area, the velocity profile diagram shows that the velocity of the non-smooth model is much smaller than that of the smooth model under the height of microstructure unit. It means that the microstructure retains a large amount of low-speed fluid, increasing the thickness of the low-velocity fluid and reducing the viscous resistance. This is consistent with the results of the velocity clouds. In addition, due to the appearance of micro-vortexes within the microstructures, reverse velocity even appears near the wall, as shown in the enlarged area. The reverse fluid in the microstructure provides an extra opposing thrust, which contributes to drag reduction. This also validates the analysis of the velocity vector diagram. Moreover, when the Y+ is higher than 160, the velocity profile curves under the two models show a high degree of consistency, which proves once again that the microstructure only changes the flow field at the bottom of the boundary layer without causing interference to the external flow field.
3.3 Viscous Resistance and Drag Reduction Mechanism
The wall friction resistance is closely related to the wall shear stress. The direction along fluid flow is defined as the X direction. The wall shear stress of the front, the end and the middle of the microstructure area in X direction is illustrated in Fig. 11, respectively. Figs. 11a and 11b show that the wall shear stresses at the two terminals of the microstructure regions are significantly greater than that near the middle of the microstructure areas. The maximum values of wall shear stress at both two sides are 99.7 Pa and 57.1 Pa, respectively, which are 6.2 and 3.5 times of the shear stress at the middle position. Additionally, the higher wall shear stress region on both sides is much smaller than that in middle area which is dominant to drag reduction. As the fluid passes through, the wall shear stress at the two positions decreases and increases in a fluctuating form, respectively. Comparing with the wall shear stress curve of the smooth model in the same position, as showed by the blue dotted line in Figs. 11a and 11b, the wall shear stress curve of the non-smooth model demonstrates a drastic fluctuation which is considered to be induced by the microstructure. It is worth noting that the wall shear stress at the front of the microstructure region is greater than that at the back of the region. This may be due to the impact of eddy current, which can also cause pressure distribution changes at different positions, as mentioned in pressure analysis.
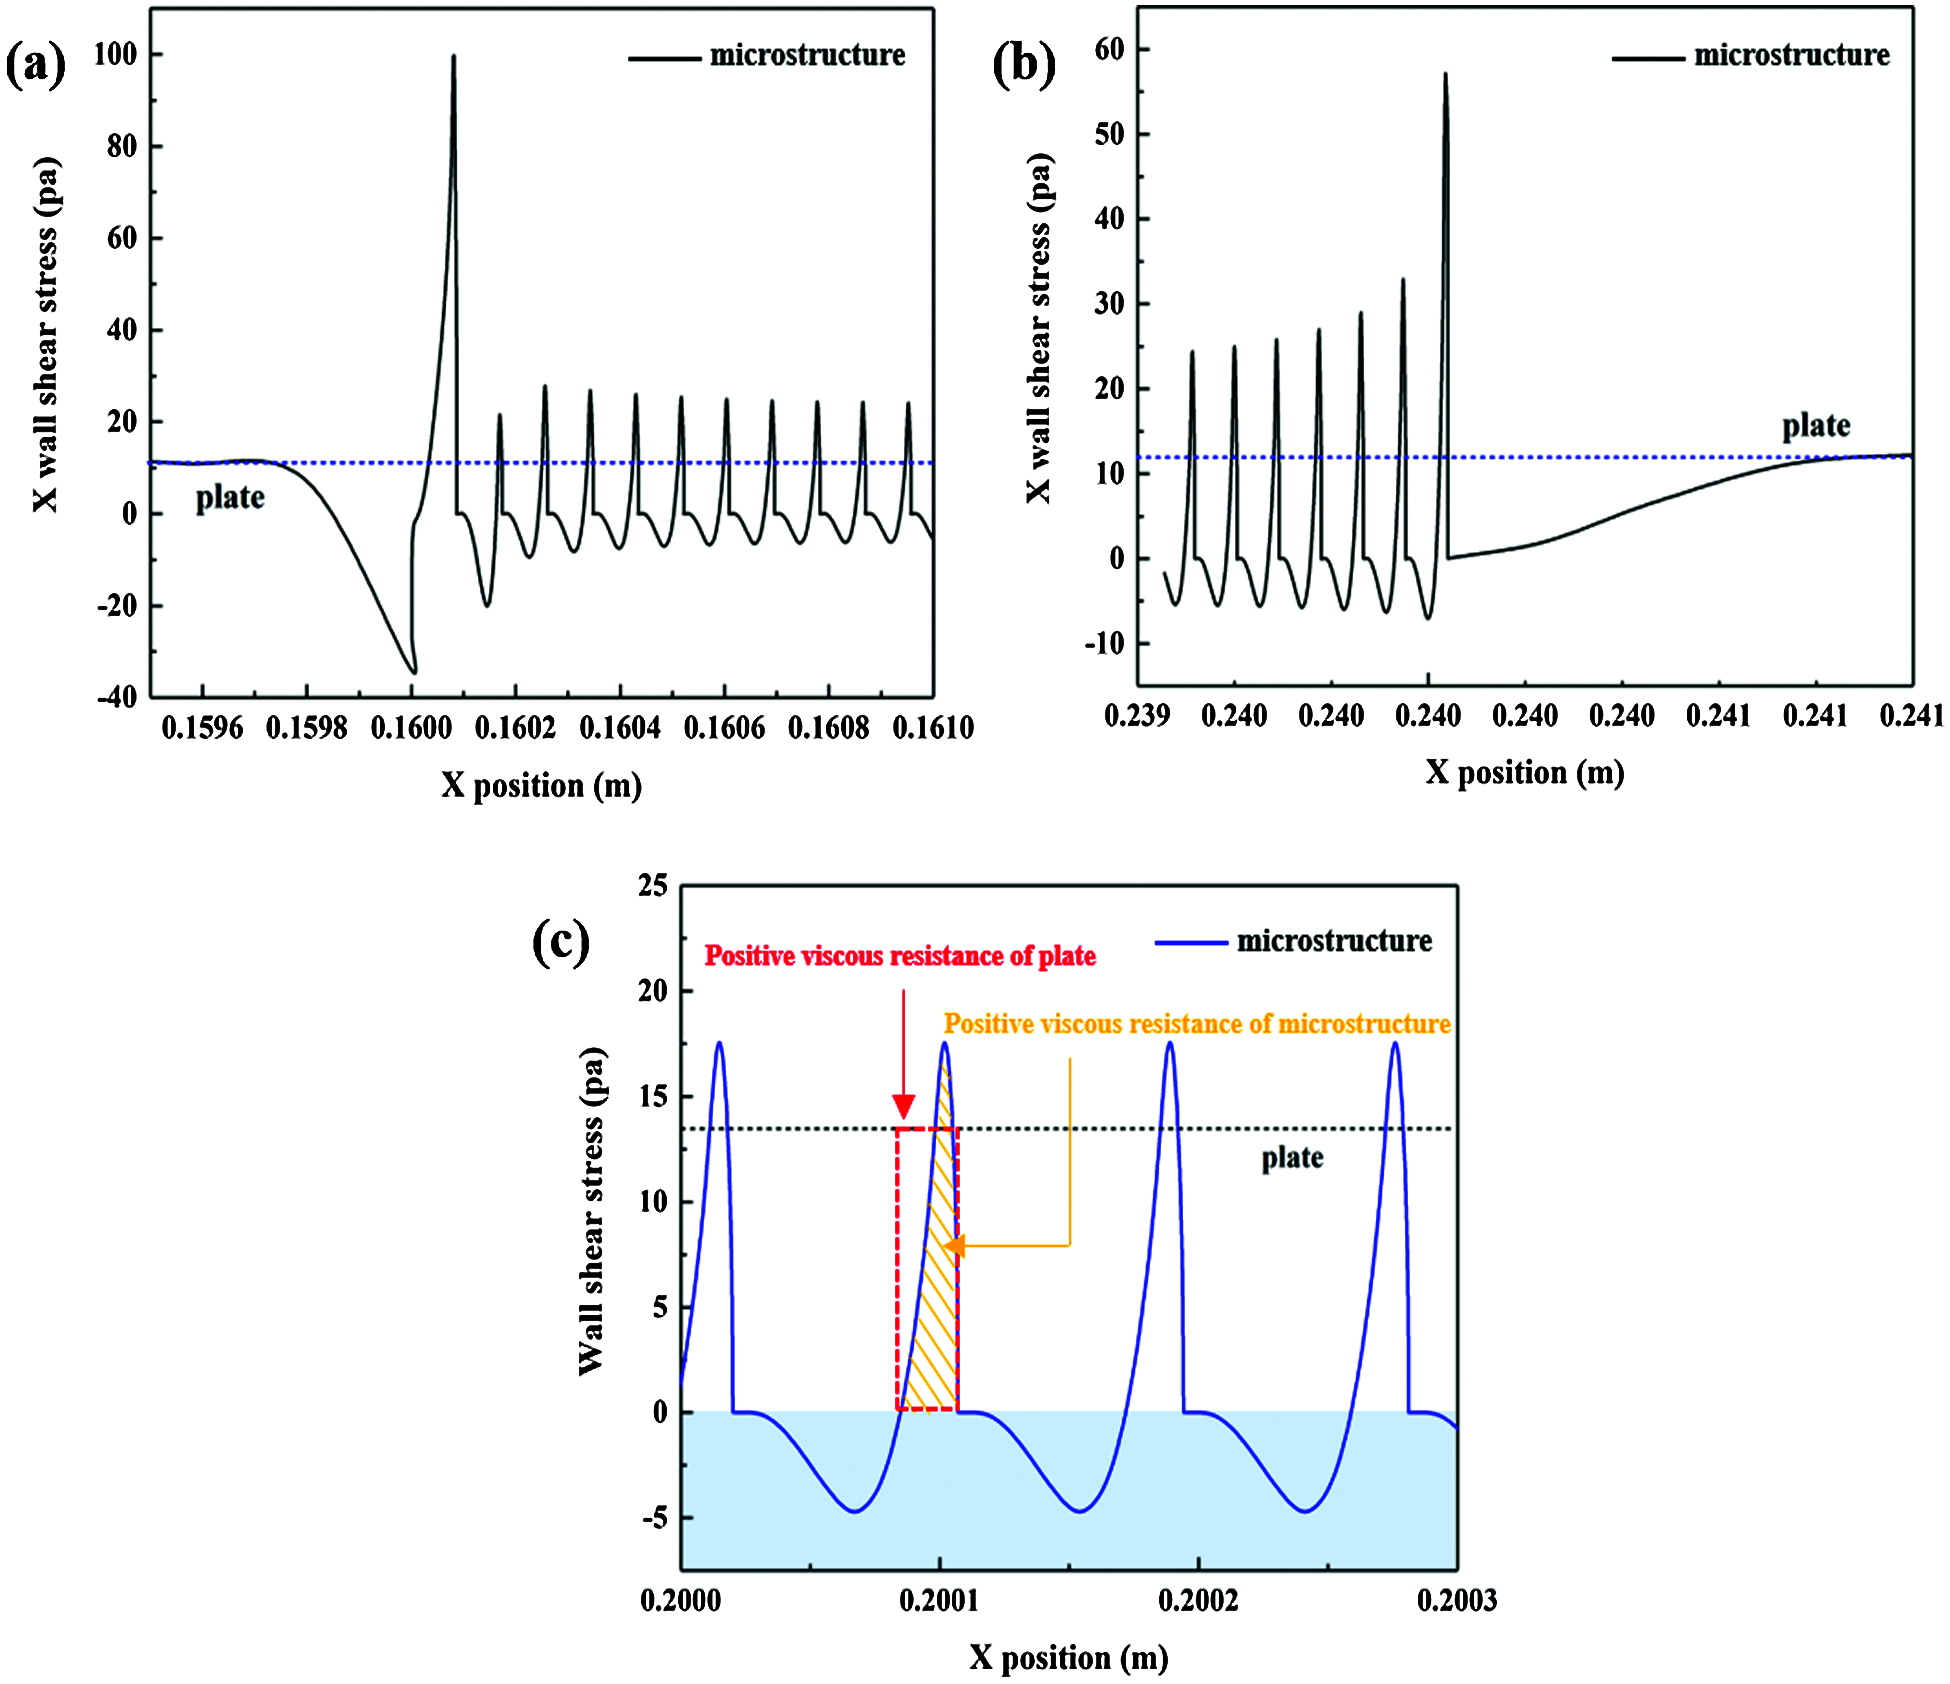
Figure 11: Wall shear stress of different positions in X direction, (a) The front of microstructure region, (b) The end of microstructure region, (c) The middle of microstructure region
In addition, the wall shear stress of the microstructure is smaller than that of the smooth surface in a large number of regions, which is displayed by the black dotted line. Moreover, the wall shear stress value in the local area is even less than 0, resulting in the appearance of a reverse friction which can be called “viscous thrust”. Fig. 11c reveals a large amount of stable “viscous thrust” regions in the middle of the microstructure region, as marked by blue. Therefore, it can be considered that the reverse fluid at the bottom of the micro-vortex brings a forward friction force to the wall, which counteracts the friction of fluids on the wall, thereby reducing the viscous resistance. Although the local wall shear stress in microstructure is higher than it in plate, the integral of the positive wall shear stress indicates that the total positive viscous resistance of microstructure (marked by the yellow slash in Fig. 11c) is less than that of the plate (indicated by the red dotted box in Fig. 11c), indicating in a further reduction in viscous resistance.
Despite of the pressure drag, it is believed that the decrease of viscous resistance still plays a major role in the change of total drag. Fig. 12 illustrates one possible explanation for the influence mechanism of microstructure on the flow field with high flow velocity. It is evident that microstructure significantly increases the thickness of boundary layer, thereby reducing velocity gradient. Moreover, the creation of micro-vortex can achieve turbulent drag reduction since it can not only reduce the viscous resistance by promoting the fluid flow above the microstructure but also provide a reverse thrust force. Simultaneously, the friction type is transformed to rolling friction by the rotation micro-vortex, which further reduces the friction between fluid and surface. However, owing to the influence of micro-vortex, the fluid gets in touch with microstructure in a tiny region after a micro-vortex, leading to a burst increment of wall shear stress. This is consistent with the phenomenon shown in Fig. 11c. Subsequently, it can be inferred that the fluid has to flow through the whole structure surface when the micro-vortexes gradually decrease or even disappear, which is equivalent to increasing the contact area, resulting in a greater friction resistance than the smooth surface without microstructure. Based on this design, renewable materials can be used to fabricate coatings with drag reduction function in the future, thereby realizing energy conservation and emission reduction in the service process of aircraft.
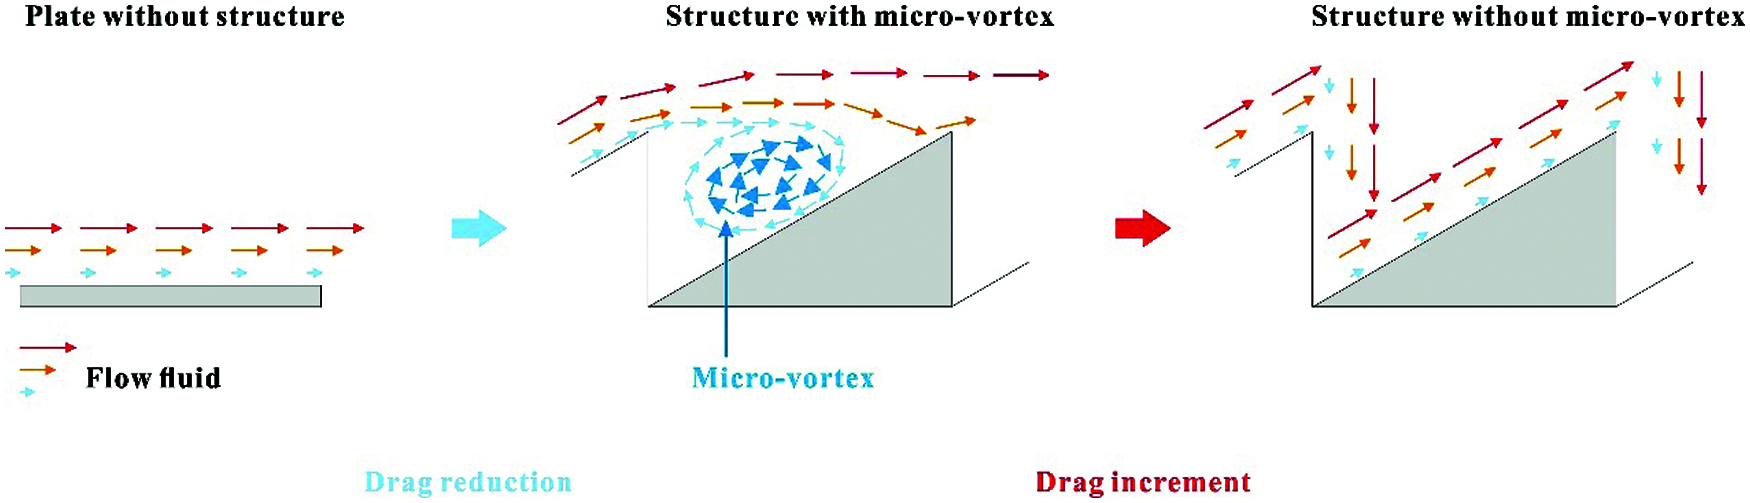
Figure 12: The mechanism of drag variation under high flow velocity condition
A bionic microstructure inspired by the shape of cross section of barchan dune has been proposed in this study. A series of tests were employed to reveal the influence of microstructure on the drag reduction under high flow velocity condition. Numerical simulation results indicated that the microstructure with a height of 50 μm had a significant effect on drag reduction, with a maximum value of 4.23% at a flow speed of 250 km/h.
In contrast to smooth model, the non-smooth model demonstrated an obvious pressure drag caused by microstructures. However, the microstructure significantly increased the thickness of the low-speed fluid by 11.4% in the near-wall flow field, causing the low-speed fluid to rise and decreasing the velocity gradient near the wall, thereby reducing viscous resistance. In addition, high-speed fluid flowed above the microstructure units instead of along the inner side of the units due to the influence of micro-vortex, leading to a reduction of friction near the surface. Furthermore, the existence of micro-vortexes could be considered to be the significant internal factor to achieve turbulent drag reduction since it could not only reduce the viscous resistance by promoting the fluid flow above the microstructure but also provide a reverse thrust force. The understanding of the mechanism of drag reduction provides theoretical guidance for further preparation of drag reduction coatings using renewable materials.
Funding Statement: This work was supported by the National Natural Science Foundation of China (Nos. 52075246 and U1937206), the Project Funded by China Postdoctoral Science Foundation (No. 2019M661826), Open Fund of Key Laboratory of Icing and Anti/De-icing (No. IADL20190202), the Project Funded by the Priority Academic Program Development of Jiangsu Higher Education Institutions (KYCX19_0181).
Conflicts of Interest: The authors declare that they have no conflicts of interest to report regarding the present study.
1. Abbas, A., Bugeda, G., Ferrer, E., Fu, S., Periaux, J. et al. (2017). Drag reduction via turbulent boundary layer flow control. Science China-Technological Sciences, 60(9), 1281–1290. DOI 10.1007/s11431-016-9013-6. [Google Scholar] [CrossRef]
2. Quadrio, M., Ricco, P. (2004). Critical assessment of turbulent drag reduction through spanwise wall oscillations. Journal of Fluid Mechanics, 521, 251–271. DOI 10.1017/S0022112004001855. [Google Scholar] [CrossRef]
3. Appartaim, R., Mezonlin, E. D., Johnson, J. A. (2002). Turbulence in plasma-induced hypersonic drag reduction. AIAA Journal, 40(10), 1979–1983. DOI 10.2514/2.1559. [Google Scholar] [CrossRef]
4. Wang, G. H., Jiang, N. (2007). Influence of periodic disturbance on statistic character of turbulent boundary layer. Journal of Aerospace Power, 22(9), 1505–1511. DOI 10.1016/S1874-8651(08)60032-0. [Google Scholar] [CrossRef]
5. Gouder, K., Potter, M., Morrison, J. F. (2013). Turbulent friction drag reduction using electroactive polymer and electromagnetically driven surfaces. Experiments in Fluids, 54(1), 1441. DOI 10.1007/s00348-012-1441-y. [Google Scholar] [CrossRef]
6. Aubrun, S., McNally, J., Alvi, F., Kourta, A. (2011). Separation flow control on a generic ground vehicle using steady microjet arrays. Experiments in Fluids, 51(5), 1177–1187. DOI 10.1007/s00348-011-1132-0. [Google Scholar] [CrossRef]
7. Yao, Y., Luo, J., Liu, H., Zhu, K. (2015). Water tunnel experimental investigation on drag reduction of coating surface wall. Procedia Engineering, 126, 247–253. DOI 10.1016/j.proeng.2015.11.235. [Google Scholar] [CrossRef]
8. Shirtcliffe, N. J., McHale, G., Newton, M. I., Zhang, Y. (2009). Superhydrophobic copper tubes with possible flow enhancement and drag reduction. ACS Applied Materials & Interfaces, 1(6), 1316–1323. DOI 10.1021/am9001937. [Google Scholar] [CrossRef]
9. Oeffner, J., Lauder, G. V. (2012). The hydrodynamic function of shark skin and two biomimetic applications. Journal of Experimental Biology, 215(5), 785–795. DOI 10.1242/jeb.063040. [Google Scholar] [CrossRef]
10. Walsh, M. J. (1990). Viscous drag reduction in boundary layers. Progress in Astronautics & Aeronautics, 123, 203–261. DOI 10.2514/5.9781600865978.0000.0000. [Google Scholar]
11. Walsh, M. J., Weinstein, L. M. (1979). Drag and heat-transfer characteristics of small longitudinally ribbed surfaces. AIAA Journal, 17(7), 770–771. DOI 10.2514/3.61216. [Google Scholar] [CrossRef]
12. Walsh, M. J. (1983). Riblets as a viscous drag reduction technique. AIAA Journal, 21(4), 485–486. DOI 10.2514/3.60126. [Google Scholar] [CrossRef]
13. Bixler, G. D., Bhushan, B. (2013). Shark skin inspired low-drag microstructured surfaces in closed channel flow. Journal of Colloid and Interface Science, 393, 384–396. DOI 10.1016/j.jcis.2012.10.061. [Google Scholar] [CrossRef]
14. Jung, Y. C., Bhushan, B. (2009). Biomimetic structures for fluid drag reduction in laminar and turbulent flows. Journal of Physics-Condensed Matter, 22(3), 035104. DOI 10.1088/0953-8984/22/3/035104. [Google Scholar] [CrossRef]
15. Duan, L., Choudhari, M. (2012). Effects of riblets on skin friction and heat transfer in high-speed turbulent boundary layers. 50th AIAA Aerospace Sciences Meeting Including the New Horizons Forum and Aerospace Exposition, pp. 1108. Nashville, Tennessee. DOI 10.2514/MASM12. [Google Scholar] [CrossRef]
16. Dean, B. D. (2011). The effect of shark skin inspired riblet geometries on drag in rectangular duct flow. The Ohio State University, 2011, 1–73. http://rave.ohiolink.edu/etdc/view?acc_num=osu1311874211. [Google Scholar]
17. Bechert, D. W., Bruse, M., Hage, W., van der Hoeven, J. G. T., Hoppe, G. (1997). Experiments on drag-reducing surfaces and their optimization with an adjustable geometry. Journal of Fluid Mechanics, 338, 59–87. DOI 10.1017/S0022112096004673. [Google Scholar] [CrossRef]
18. Lee, S. J., Lee, S. H. (2001). Flow field analysis of a turbulent boundary layer over a riblet surface. Experiments in Fluids, 30(2), 153–166. DOI 10.1007/s003480000150. [Google Scholar] [CrossRef]
19. Luchini, P., Manzo, F., Pozzi, A. (1991). Resistance of a grooved surface to parallel flow and cross-flow. Journal of Fluid Mechanics, 228, 87–109. DOI 10.1017/S0022112091002641. [Google Scholar] [CrossRef]
20. Szodruch, J. (1991). Viscous drag reduction on transport aircraft. 29th Aerospace Sciences Meeting, vol. 91, no. 685. DOI 10.2514/MASM91. [Google Scholar] [CrossRef]
21. Bixler, G. D., Bhushan, B. (2013). Shark skin inspired low-drag microstructured surfaces in closed channel flow. Journal of Colloid and Interface Science, 393, 384–396. DOI 10.1016/j.jcis.2012.10.061. [Google Scholar] [CrossRef]
22. Ao, M. R., Wang, M. C., Zhu, F. L. (2021). Investigation of the turbulent drag reduction mechanism of a kind of microstructure on riblet surface. Micromachines, 12(1), 59. DOI 10.3390/mi12010059. [Google Scholar] [CrossRef]
23. Khosronejad, A., Sotiropoulos, F. (2017). On the genesis and evolution of barchan dunes: Morphodynamics. Journal of Fluid Mechanics, 815, 117–148. DOI 10.1017/jfm.2016.880. [Google Scholar] [CrossRef]
24. Wang, L. Y., Wang, C., Wang, S. Y., Sun, G., You, B. (2021). Design and analysis of micro-nano scale nested-grooved surface structure for drag reduction based on ‘Vortex-driven design’. European Journal of Mechanics B-Fluids, 85, 335–350. DOI 10.1016/j.euromechflu.2020.10.007. [Google Scholar] [CrossRef]
25. Song, X., Zhang, M., Lin, P. (2017). Skin friction reduction characteristics of nonsmooth surfaces inspired by the shapes of barchan dunes. Mathematical Problems in Engineering, 2017, 1–12. DOI 10.1155/2017/6212605. [Google Scholar] [CrossRef]
26. Sauermann, G., Andrade Jr, J. S., Maia, L. P., Costa, U. M. S., Araujo, A. D. et al. (2003). Wind velocity and sand transport on a barchan dune. Geomorphology, 54(3–4), 245–255. DOI 10.1016/S0169-555X(02)00359-8. [Google Scholar] [CrossRef]
27. Bishop, M. A. (2007). Point pattern analysis of north polar crescentic dunes, Mars: A geography of dune self-organization. Icarus, 191(1), 151–157. DOI 10.1016/j.icarus.2007.04.027. [Google Scholar] [CrossRef]
28. Durán, O., Claudin, P., Andreotti, B. (2011). On aeolian transport: Grain-scale interactions, dynamical mechanisms and scaling laws. Aeolian Research, 3(3), 243–270. DOI 10.1016/j.aeolia.2011.07.006. [Google Scholar] [CrossRef]
29. Douady, S. (2011). Equilibrium versus disequilibrium of barchan dunes. Geomorphology, 125(4), 558–568. DOI 10.1016/j.geomorph.2010.10.025. [Google Scholar] [CrossRef]
30. Pang, R., Sang, W., Cai, Y. (2018). Two-dimensional simulation study on aerodynamic drag reduction characteristics of superhydrophobic structures. Asia-Pacific International Symposium on Aerospace Technology, pp. 402–415. Springer, Singapore. [Google Scholar]
31. Faheem, A., Ranzi, G., Fiorito, F., Lei, C. (2016). A numerical study of turbulent mixed convection in a smooth horizontal pipe. Journal of Enhanced Heat Transfer, 138(1), 1–11. DOI 10.1115/1.4031112. [Google Scholar] [CrossRef]
32. Shih, T. H., Liou, W. W., Shabbir, A., Yang, Z., Zhu, J. (1995). A new k-epsilon eddy viscosity model for high reynolds number turbulent flows. Computers & Fluids, 24(3), 227–238. DOI 10.1016/0045-7930(94)00032-T. [Google Scholar] [CrossRef]
33. Li, M., Khan, T. S., Al-Hajri, E., Ayub, Z. H. (2016). Single phase heat transfer and pressure drop analysis of a dimpled enhanced tube. Applied Thermal Engineering, 101, 38–46. DOI 10.1016/j.applthermaleng.2016.03.042. [Google Scholar] [CrossRef]
34. Launder, B. E., Spalding, D. B. (1983). The numerical computation of turbulent flows. Numerical prediction of flow, heat transfer, turbulence and combustion. Pergamon, 96–116. DOI 10.1016/B978-0-08-030937-8.50016-7. [Google Scholar] [CrossRef]
35. Robinson, S. K. (1991). Coherent motions in the turbulent boundary layer. Annual Review of Fluid Mechanics, 23(1), 601–639. DOI 10.1146/annurev.fl.23.010191.003125. [Google Scholar] [CrossRef]
 | This work is licensed under a Creative Commons Attribution 4.0 International License, which permits unrestricted use, distribution, and reproduction in any medium, provided the original work is properly cited. |