| Journal of Renewable Materials |
DOI: 10.32604/jrm.2022.016933
ARTICLE
Adsorption Properties and Cost of Dicarboxylic Nanocellulose on Copper Ions for Wastewater Treatment
1College of Engineering, Northeast Agricultural University, Harbin, 150030, China
2College of Mechanical Engineering, Jiamusi University, Jiamusi, 154007, China
*Corresponding Author: Xiaozheng Sun. Email: sxz1976@hotmail.com
Received: 21 April 2021; Accepted: 21 May 2021
Abstract: The accumulation of Cu2+ in water is a potential threat to human health and environment. Dicarboxylic nanocellulose (DNC) with rich carboxyl groups was prepared through the NaIO4–NaClO2 sequential oxidation method to efficiently remove copper ions, and the Cu2+ adsorption properties and cost were studied. The maximum adsorption capacity reached 184.2 mg/g at pH 6 and an adsorbent dose of 5 g/L. Theoretically, the maximum adsorption capacities of monocarboxylic nanocellulose (MNC), DNC, and tricarboxylic nanocellulose (TNC) with carboxyl groups as the main adsorption sites were calculated to be 228.7, 261.3, and 148.1 mg/g, respectively. The Cu2+ adsorption costs of MNC, DNC, and TNC were calculated and compared with those of powdered activated carbon (PAC). The Cu2+ adsorption capacity of DNC is higher than that of PAC, and the adsorption cost is close to or lower than that of PAC, demonstrating that the DNC prepared by sequential oxidation of NaIO4–NaClO2 has competitive adsorption capacity and cost in the treatment of wastewater containing Cu2+.
Keywords: Nanocellulose; heavy metal ions; maximum adsorption capacity; adsorption cost
The rapid development of industrial and agricultural products since the 20th century has led to the gradual accumulation of heavy metal ions in soil and water. Heavy metal ions accumulate in the human body through the transmission of the food chain, causing irreversible harm [1]. Copper ions are the most common heavy metal pollutants in industrial effluents and may accumulate in the human liver, posing serious threat to health [2]. Therefore, the removal of Cu2+ from wastewater has attracted increasing attention.
Adsorption is one of the most common approaches for removing heavy metal ions from aqueous solutions. This method mainly exploits the porosity, high specific surface area, and high surface activation energy of the adsorbent to remove heavy metal ions from water by surface complexation, hydrogen bonding, and electrostatic attraction. Common adsorbents include activated carbon, ion-exchange fibers, modified cellulose, and other materials [3]. Activated carbon is a material with abundant oxygen-containing functional groups on its surface, which are conducive to the adsorption of heavy metals. Ion-exchange fibers adsorb heavy metal ions through ion exchange between the exchange groups attached to the fibers. Graft copolymerization or the introduction of functional groups to modify the fibers can improve their adsorption capacity, but the recyclability and reusability of ion-exchange fibers are relatively weak [4].
Biomass is a renewable resource, so the use of biomass to prepare various biomass materials instead of non-renewable materials has become a research hotspot [5,6]. Nanocellulose is a class of cellulose materials with at least one dimension in the range of 1–100 nm [7–9]. It has a high specific surface area, excellent mechanical properties, and environmental friendliness, and is widely used in polymer reinforcement materials, heavy-metal ion adsorption, and oxygen-barrier packaging materials [10–12]. Carboxylic nanocellulose contains active carboxyl groups in the cellulose chains, thus providing more reactive sites, and has a high specific surface area, enhancing its ability to remove metal ions from water [13].
Studies have shown that the increase in the carboxyl content of nanocellulose enhances its interaction with positively charged heavy metal ions; thus, nanocellulose with higher carboxyl content has a strong adsorption capacity for heavy metal ions [14,15]. Therefore, many studies have focused on increasing the carboxyl content of nanocellulose to improve the amount of metal ions adsorbed [16–18]. TEMPO (2,2,6,6-tetramethylpiperidine-1-oxyl)-mediated oxidation and periodate oxidation are two commonly used methods to increase the content of carboxyl groups on the surface of nanocellulose [19]. The TEMPO-mediated oxidation method can selectively convert hydroxyl groups at the C6 sites of nanocellulose to carboxyl groups [20]. The hydroxyl groups at C2 and C3 can be selectively oxidized to carboxyl groups by sequential oxidation using sodium periodate (NaIO4) and sodium chlorite (NaClO2) [9]. The adsorbed amount of Cu2+ reached 75.0 mg/g using monocarboxylic nanocellulose (MNC) prepared by TEMPO-mediated oxidation [20]. Dicarboxylic nanocellulose (DNC) adsorbed 246.0 mg Cu2+ per gram at pH 4.6 [21]. Tricarboxylic nanocellulose (TNC) was prepared by TEMPO-mediated oxidation of pulp followed by periodate–chlorite oxidation [13], and the adsorption capacity of Cu2+ was 97.3 mg/g. Carboxymethylated cellulose has a carboxyl content of 2.7 mmol/g and an adsorbed Cu2+ amount of 115.3 mg/g [22]. However, Under the condition that nanocellulose maintains the morphology of intact cellulose microfibrils, the theoretical maximum adsorption capacity of Cu2+ onto nanocellulose has not been reported.
In addition, the adsorption capacity and cost of adsorbent are the two most important factors to optimize for the adsorption process to be economically feasible. Currently, activated carbon is still the main metal-ion adsorbent commonly used in the market. Granular activated carbon (GAC) and powdered activated carbon (PAC) are the two forms of activated carbon that are usually applied. Carboxylic nanocellulose is usually powdered, so it is fair to compare the adsorption cost of carboxylic nanocellulose with that of PAC. In 1995, the prices of PAC were around $0.80–2.00 per kg in the USA and $0.70–1.50 per kg in Europe [21]. PAC cannot be reactivated because the average total regeneration costs are approximately $0.70–0.85 per kg (i.e., close to production cost); therefore, PAC is used as a one-way adsorbent [23]. However, the price of nanocellulose fluctuates widely, ranging from $60–1200 per kg (dry weight) in Europe [24], and carboxylic nanocellulose can be regenerated and recycled to remove heavy metal ions [14]. It is inconclusive whether carboxylic nanocelluloses can compete with PAC in terms of adsorption cost.
In this study, microcrystalline cellulose (MCC) was used as the raw material, and DNC was prepared using the NaIO4–NaClO2 sequential oxidation method. The effects of initial pH, initial Cu2+ concentration, and adsorbent dose on the adsorbed amount were investigated. The adsorption kinetics and isotherm models are discussed. In addition, the theoretical maximum adsorption capacities of Cu2+ onto MNC, DNC, and TNC were calculated, and the Cu2+ adsorption costs of MNC, DNC, and TNC were compared with those of PAC. This study can provide a scientific basis for the development of renewable nano-adsorbents with high adsorption capacity and low cost.
All chemicals used in this study were of reagent grade and used as received without further purification. All test water was deionized, and all chemicals were purchased from Chemical Reagent Co., Ltd., China National Medicine Group, China.
DNC was prepared using a previously reported method [9]. Specifically, 4 g MCC, 5.33 g NaIO4, and 15.6 g NaCl were dispersed in deionized water. The reaction beaker was wrapped by aluminum foil to prevent degradation of the NaIO4 caused by light irradiation. The oxidation reaction was carried out for 24 h at room temperature (RT). Ethylene glycol was used to quench the reaction. The oxidized MCC was thoroughly washed using deionized water by centrifugation (1500 g, 5 min) until the conductivity of the supernatant was less than 30 μS/cm. The precipitate was dried using a freeze dryer.
One gram of the dried precipitate was suspended in 50 mL water and 2.93 g NaCl; NaClO2 and H2O2 (with molarities twice that of the aldehyde content of the dried precipitate) were added to this mixture. The mixture was stirred at RT for 24 h, and the pH was maintained at 5.0 by adding NaOH (0.5 M). After the reaction, the oxidized product was washed with deionized water by centrifugation at 8500 g for 5 min. After the conductivity of the supernatant dropped to less than 30 μS/cm, the dried DNC was obtained by drying in a vacuum freeze dryer.
The morphology of DNC was observed and analyzed using transmission electron microscopy (TEM; JEM-2100, Japan Electronics Corporation, Japan) and field-emission scanning electron microscopy (FE-SEM; JSM-7401F, JEOL, Ltd., Japan), respectively. Fourier-transform infrared spectroscopy (FTIR; Nicolette 6700, Nicolette, USA) was used to acquire the infrared spectrum of the DNC. X-ray diffraction analysis (XRD; D/max-2200VPC type, Nippon Science Co., Ltd., Japan) was used to characterize the nanocellulose in terms of crystal form and crystallinity. The diffraction patterns were background corrected to remove any signal from the sample holder. Data from a blank run including the sample holder were subtracted from the data of experimental samples [25]. The carboxyl contents of DNC were determined by conductometric titration in previously reported method with the following Eq. (1). The crystallinity index (CI) was determined using the Segal method [26–28] with the following Eq. (2).
where [COO−] is carboxyl content (mmol/g); VNaOH(added) is the volume of NaOH at the inflection point (mL); VHCl is the volume of HCl added to the 0.1 M HCl-0.5 M NaCl mixed solution (mL); MNaOH is equivalent concentration of NaOH (mol/L); WCEL is starting mass of DNC (g).
where I200 is the maximum diffraction intensity at 2θ between 22° and 23°; Iam is the minimum diffraction intensity at 2θ between 18° and 19° [27].
Batch adsorption experiments were conducted to explore the effects of the initial pH value (1–6), adsorbent dose (2.5–25 g/L), initial Cu2+ concentration (51.6–1014.0 mg/L), and contact time (2 h) on the adsorption capacities of Cu2+ ions. Specifically, a designated amount of adsorbent was introduced into a 100 mL beaker containing a 50 mL Cu2+ solution of known concentration. Then, the initial pH was adjusted precisely to the desired value with 0.1 M HCl or 0.1 M NaOH. The beaker was covered with aluminum foil during adsorption to prevent evaporation of the solution. After continuous stirring for 2 h at 23 ± 2°C, the adsorbent was filtered out with a 0.22 μm needle filter, and the remaining Cu2+ concentration in the filtrate was measured. The results were recorded as the averages of three parallel tests.
Flame atomic absorption spectrometry (900 H, Perkin Elmer Company, USA) was employed to detect the Cu2+ concentration in the solution before and after adsorption. First, the concentration of the test solution was diluted to 1.0–5.0 mg/L with 10% HCl. Thereafter, 3 mL of the diluted solution was used to measure the Cu2+ concentration before and after adsorption. Subsequently, the concentrations of the original Cu2+ solutions were calculated according to the dilution factor. Finally, the adsorbed amount (qe) was calculated using the following equation:
where C0 (mg/L) is the initial Cu2+ concentration, Ce (mg/L) is the equilibrium Cu2+ concentration, V (L) is the volume of the Cu2+ solution, and m (g) is the mass of the adsorbent.
To investigate the reusability of DNC after the adsorption of Cu2+ ions, adsorption and desorption experiments were carried out at the initial pH of 6, the adsorbent dose of 5 g/L, the initial Cu2+ concentration of 1014.0 mg/L, and the contact time of 2 h. After the adsorption reaction, the solution was centrifuged at 3000 rpm for 5 min to obtain a blue precipitate, which is characteristic of the presence of Cu2+. Then, 50 mL HCl (0.5 M) was added and placed on a magnetic stirrer for continuous stirring. Although the blue precipitate disappeared immediately after adding HCl, the desorption reaction was carried out for 2 h to ensure complete desorption. After desorption was completed, the desorbed adsorbent was obtained by centrifugal separation and used again to adsorb copper ions. The adsorption and desorption experiments were repeated five times, and the adsorbed amounts were measured each time.
To analyze the adsorption rates of Cu2+ onto nanocellulose, pseudo-first-order and pseudo-second-order kinetic models were tested [29]. The pseudo-first-order kinetic equation is as follows:
where qe (mg/g) is the adsorbed amount of Cu2+ at equilibrium, qt (mg/g) is the adsorbed amount of Cu2+ at any time t, k1 (min–1) is the rate constant of pseudo-first-order adsorption, and t (min) is the contact time.
The pseudo-second-order kinetic equation is as follows:
where qe (mg/g) and qt (mg/g) are the adsorption capacities of copper ions (mg/g) at the time of equilibrium and time t, respectively; k2 (g/mg min) is the adsorption rate constant of the pseudo-second-order adsorption; and t (min) is the contact time.
2.2.6 Adsorption Isotherm Models
Adsorption isotherms are predominantly used to study the relationship between the concentration of heavy metal ions adsorbed on the adsorbent and the equilibrium concentration of the solution and can help elucidate the equilibrium adsorption mechanism between solid substances and solutions. The Langmuir and Freundlich models are the most frequently used isotherm models.
The Langmuir adsorption model is assumed for monolayer adsorption, and the active adsorption sites are uniformly distributed on the surface of the adsorbent. The equation is as follows [30]:
where qe (mg/g) is the adsorbed amount of metal ions at equilibrium, qm (mg/g) is the maximum adsorption capacity corresponding to complete monolayer coverage, KL (L/mg) is the Langmuir constant and is related to the affinity of the binding sites, and Ce (mg/L) is the equilibrium adsorbate concentration.
The Freundlich model assumes heterogeneous multilayer adsorption, which means that the distribution of the adsorption sites on the surface of the adsorbent is not fixed, and the equation is as follows [31]:
where Ce (mg/L) is the equilibrium adsorbate concentration, qe (mg/g) is the amount of metal ions adsorbed at equilibrium, KF (L/mg) is the Freundlich adsorption constant, and n is a parameter related to the adsorption strength.
3.1 XRD and FTIR Spectroscopy Analysis
XRD is used to analyze the crystal form and crystallinity of DNC. The XRD patterns of MCC and DNC are shown in Fig. 1a, the DNC have three main peaks at 15.1°, 16.3°, and 22.8° 2θ corresponding to the Miller indices of (1 1¯0), (110) and (200); the characteristic peaks of cellulose Type I are preserved, and the DNC is categorized as Type I cellulose, the crystal form has not changed after the reaction [27]. The crystallization indices of MCC and DNC were 79.1% and 76.4%, respectively.
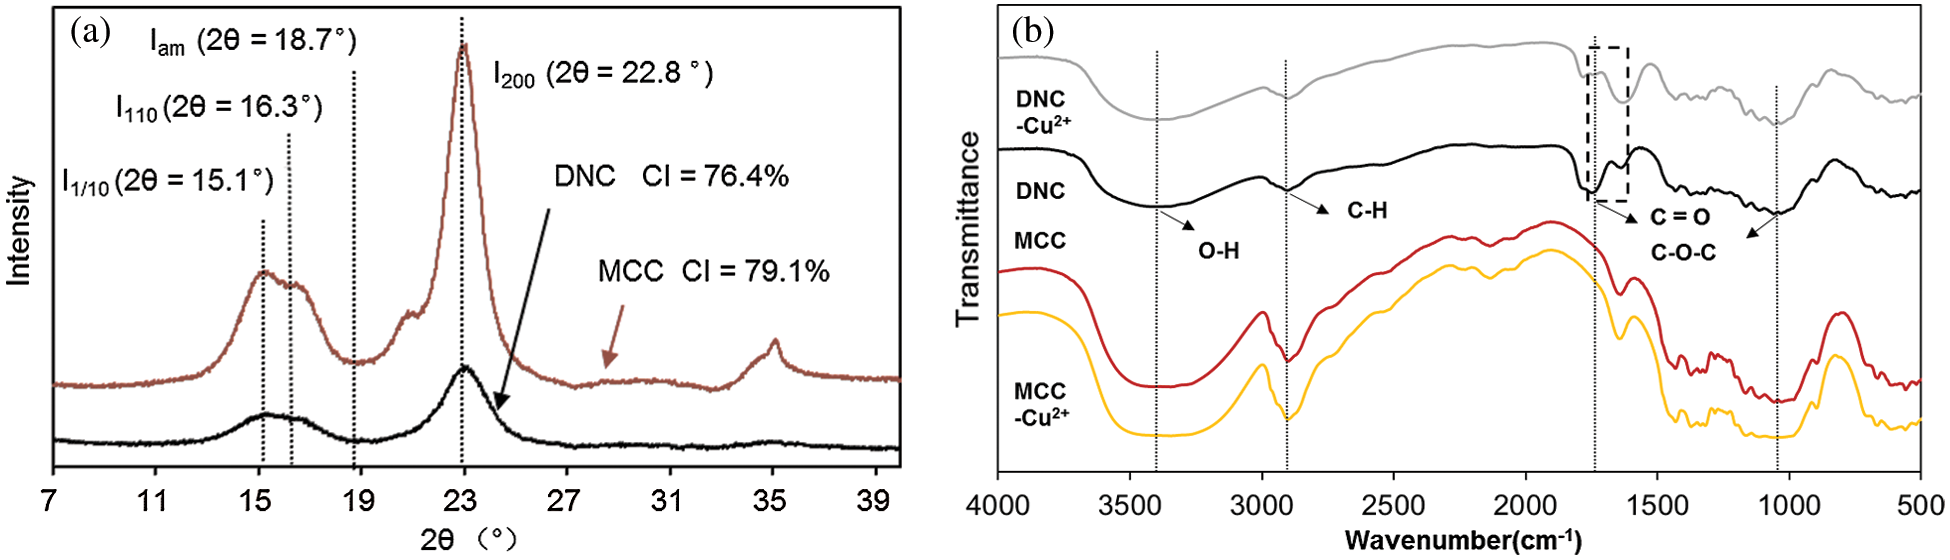
Figure 1: (a) XRD patterns of MCC and DNC, (b) FTIR spectra of MCC and DNC before and after Cu2+ adsorption
Fig. 1b shows the FTIR spectra of MCC and DNC before and after Cu2+ adsorption. The characteristic peaks of cellulose were observed, such as the hydrogen-bonded O-H stretch at 3400 cm–1, the sp3-hybridized C–H stretching vibration at 2900 cm–1, the C–O–C stretching vibration at 1020 cm–1, and the absorption peak of –OH in the dimer at 890 cm–1. Before and after Cu2+ adsorption, no significant difference was observed between MCC and MCC–Cu2+, which showed that little Cu2+ was adsorbed onto MCC [12]. This is consistent with the results of Garba et al. that the adsorption capacity of unmodified MCC is low due to the lack of strong binding sites for heavy metals [32]. The FTIR spectra of DNC and DNC–Cu2+ were significantly different from those of MCC and MCC–Cu2+ from 1700 to 1800 cm–1, because the C=O stretching vibration was observed in the DNC spectra. It could be explained that carboxyl groups appeared on the surface of DNC, and the hydroxyl groups in the molecular chain of cellulose were oxidized to carboxyl groups [33]. The FTIR spectra of DNC-Cu2+ were significantly different from those of DNC in the range of 1650–1750 cm−1, in which the bending and in-plane vibrations of heavy metal atoms were observed in the FTIR spectra of DNC-Cu2+ [34]. The wavenumbers from 1650–1750 cm−1 belong to the stretching vibration region of the carboxyl group, which demonstrated that the carboxyl groups were involved in the coordination of Cu2+.
3.2 Content of Carboxyl Groups and TEM and SEM Analysis
Steric hindrance and repulsion forces prevent hydrated metal ions from utilizing all the active sites afforded by the carboxylic groups accumulated on the surface of nanocellulose. A large amount of the appropriate functionalities should exist on the surface of the adsorbent for the adsorption of Cu2+; furthermore, a relatively high surface area is required. The content of carboxyl groups on DNC is 3.4 mmol/g, which is approximately double the carboxyl content of MNC prepared by TEMPO-mediated oxidation [35]. The TEM image of DNC is shown in Fig. 2. The morphology of DNC is short and rod-shaped, with thin ends and is thick in the middle. The diameter, aspect ratio, and specific surface area (SSA) of DNC were 5.3 ± 1.8 nm (n = 200), 20.6, and 500 m2/g (SSA = 4/ρd, ρ=1500 kg/m3, d = 5.3 nm). The abundant carboxyl groups and high specific surface area can provide many reaction sites for the adsorption of copper ions. The SEM images before and after the adsorption of Cu2+ are shown in Fig. 3. Fig. 3b shows that the square-planar Cu2+ moiety was scattered on the surface of the DNC [36,37].
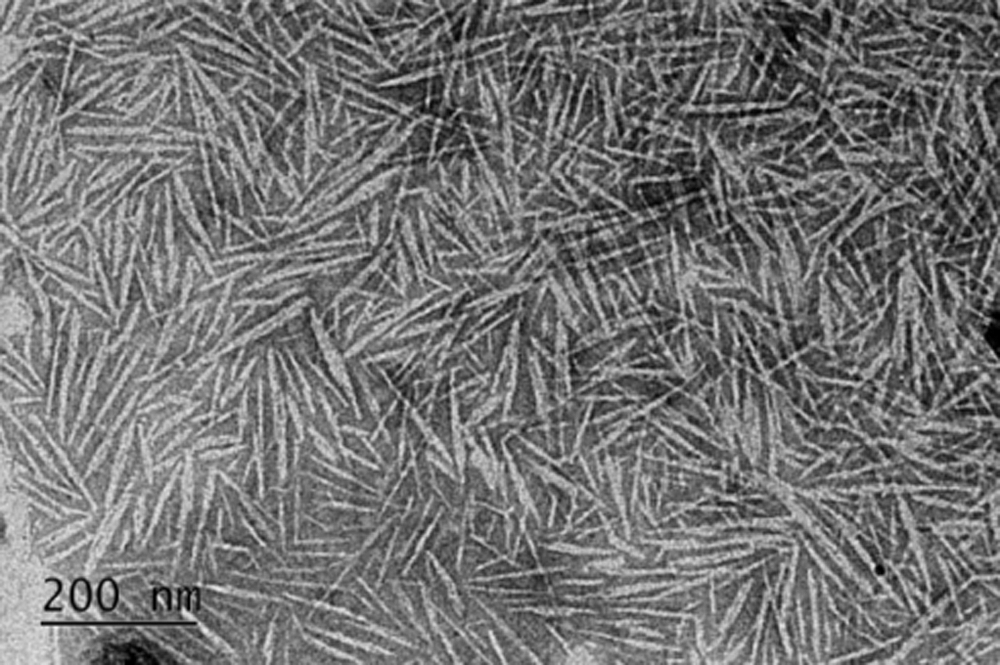
Figure 2: Transmission electron microscopy image of DNC
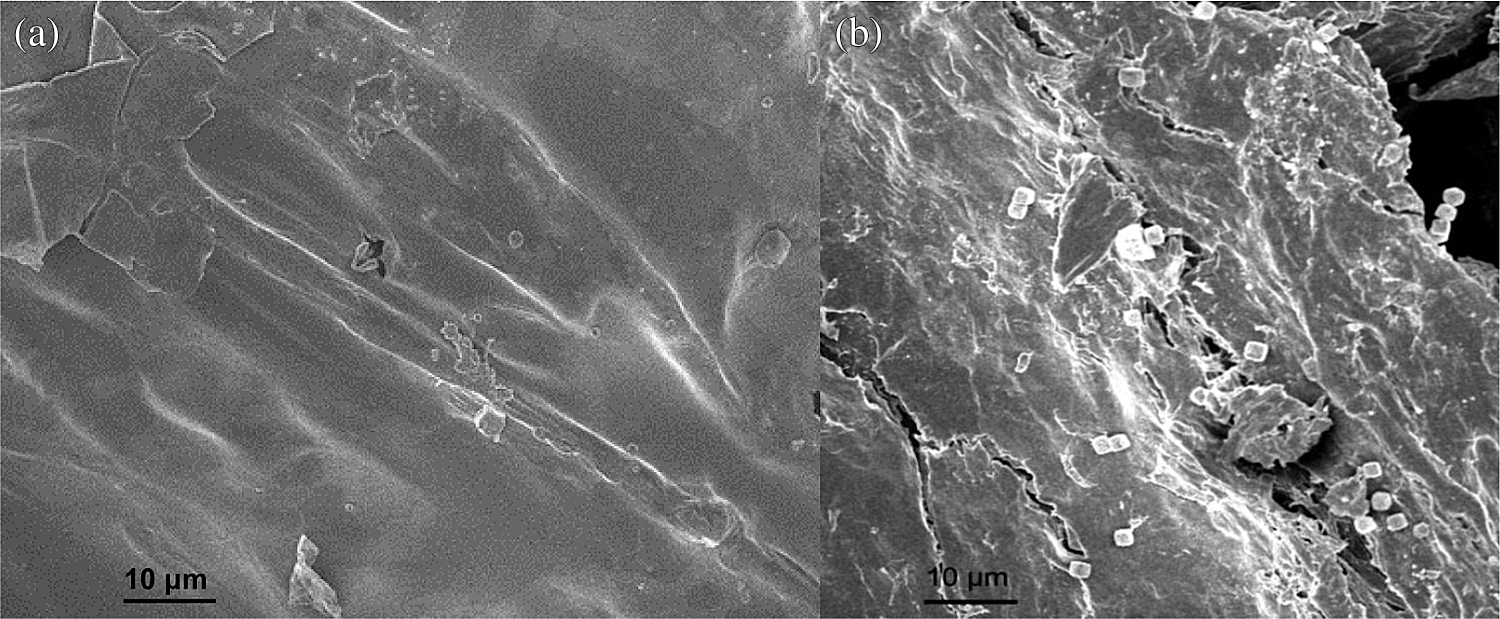
Figure 3: Scanning electron microscopy images of DNC before (a) and after (b) Cu2+ adsorption
3.3 Effects of Initial pH, Adsorbent Dose, Initial Cu2+ Concentration, and Contact Time on Adsorption Amount
The effects of the initial pH value, adsorbent dose, initial Cu2+ concentration, and contact time on the Cu2+ adsorption capacities of DNC were studied. The experimental design and results are presented in Tab. 1. The effect of the initial pH on adsorption amount is shown in Fig. 4a, the adsorbed amount of Cu2+ increased from 63.6 to 157.6 mg/g as the initial pH of the Cu2+ solution increased from 1 to 6. The pH of the solution is an important factor affecting the Cu2+ adsorption amount [10,38]. These results can be explained by the protonation of carboxyl groups, which cannot trap Cu2+ at low pH values. The lower pH values provide a higher H+ concentration, which strongly competes with Cu2+ for adsorption on the adsorption sites of the DNC, thus reducing the adsorbed amount of Cu2+ [14]. With increasing pH, the free H+ in the system gradually decreases, and the negative impact of competitive adsorption on the DNC adsorption of Cu2+ ions decrease. In addition, the increase in pH facilitates the conversion of carboxylic groups on the surface of DNC into electronegative carboxylate ions, and the adsorbed amount of DNC increases. Because copper hydroxide precipitation occurred for pH values higher than 6.2 [10], the following adsorption experiments were carried out at pH 6.0 to avoid the influence of copper hydroxide precipitation on the results of the adsorption experiment [35].
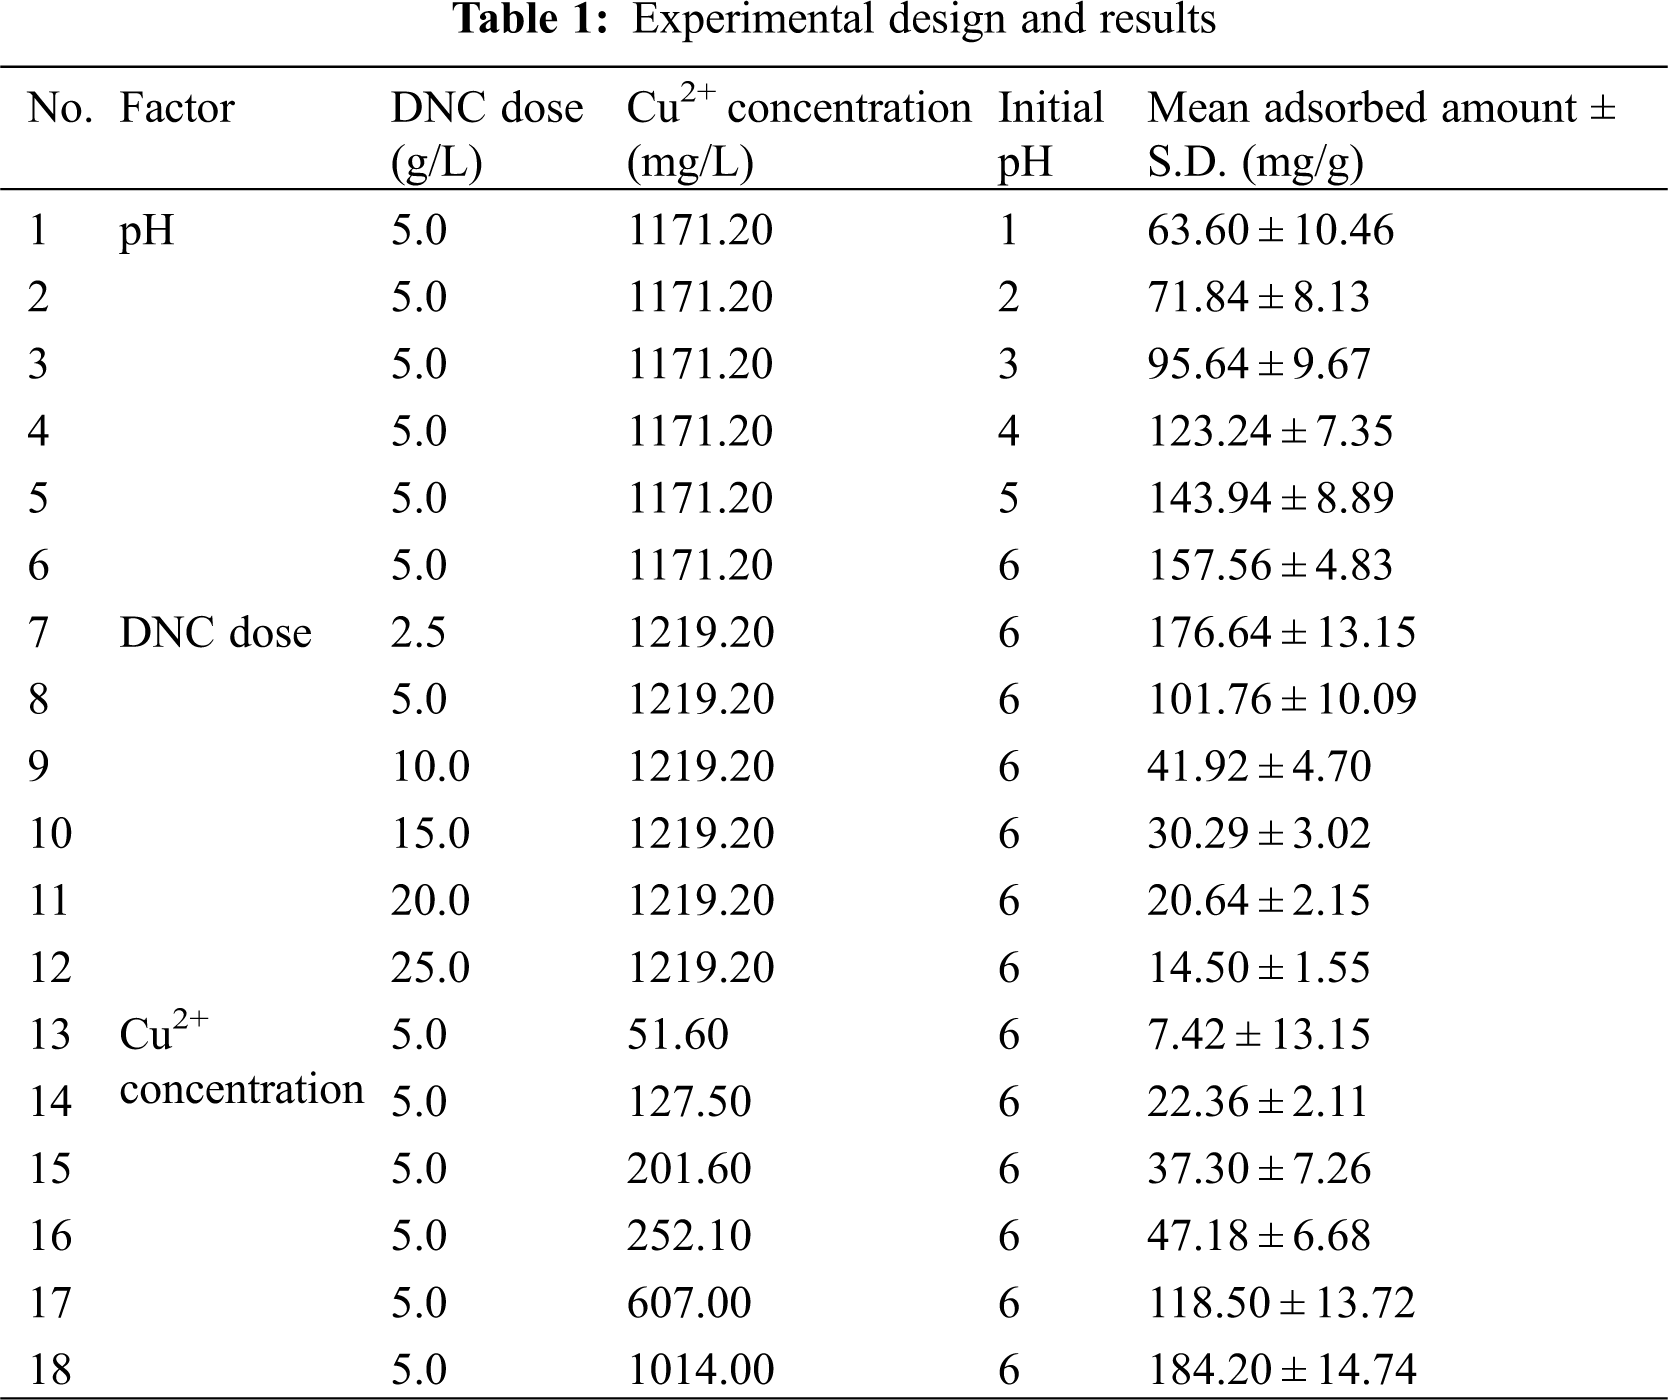
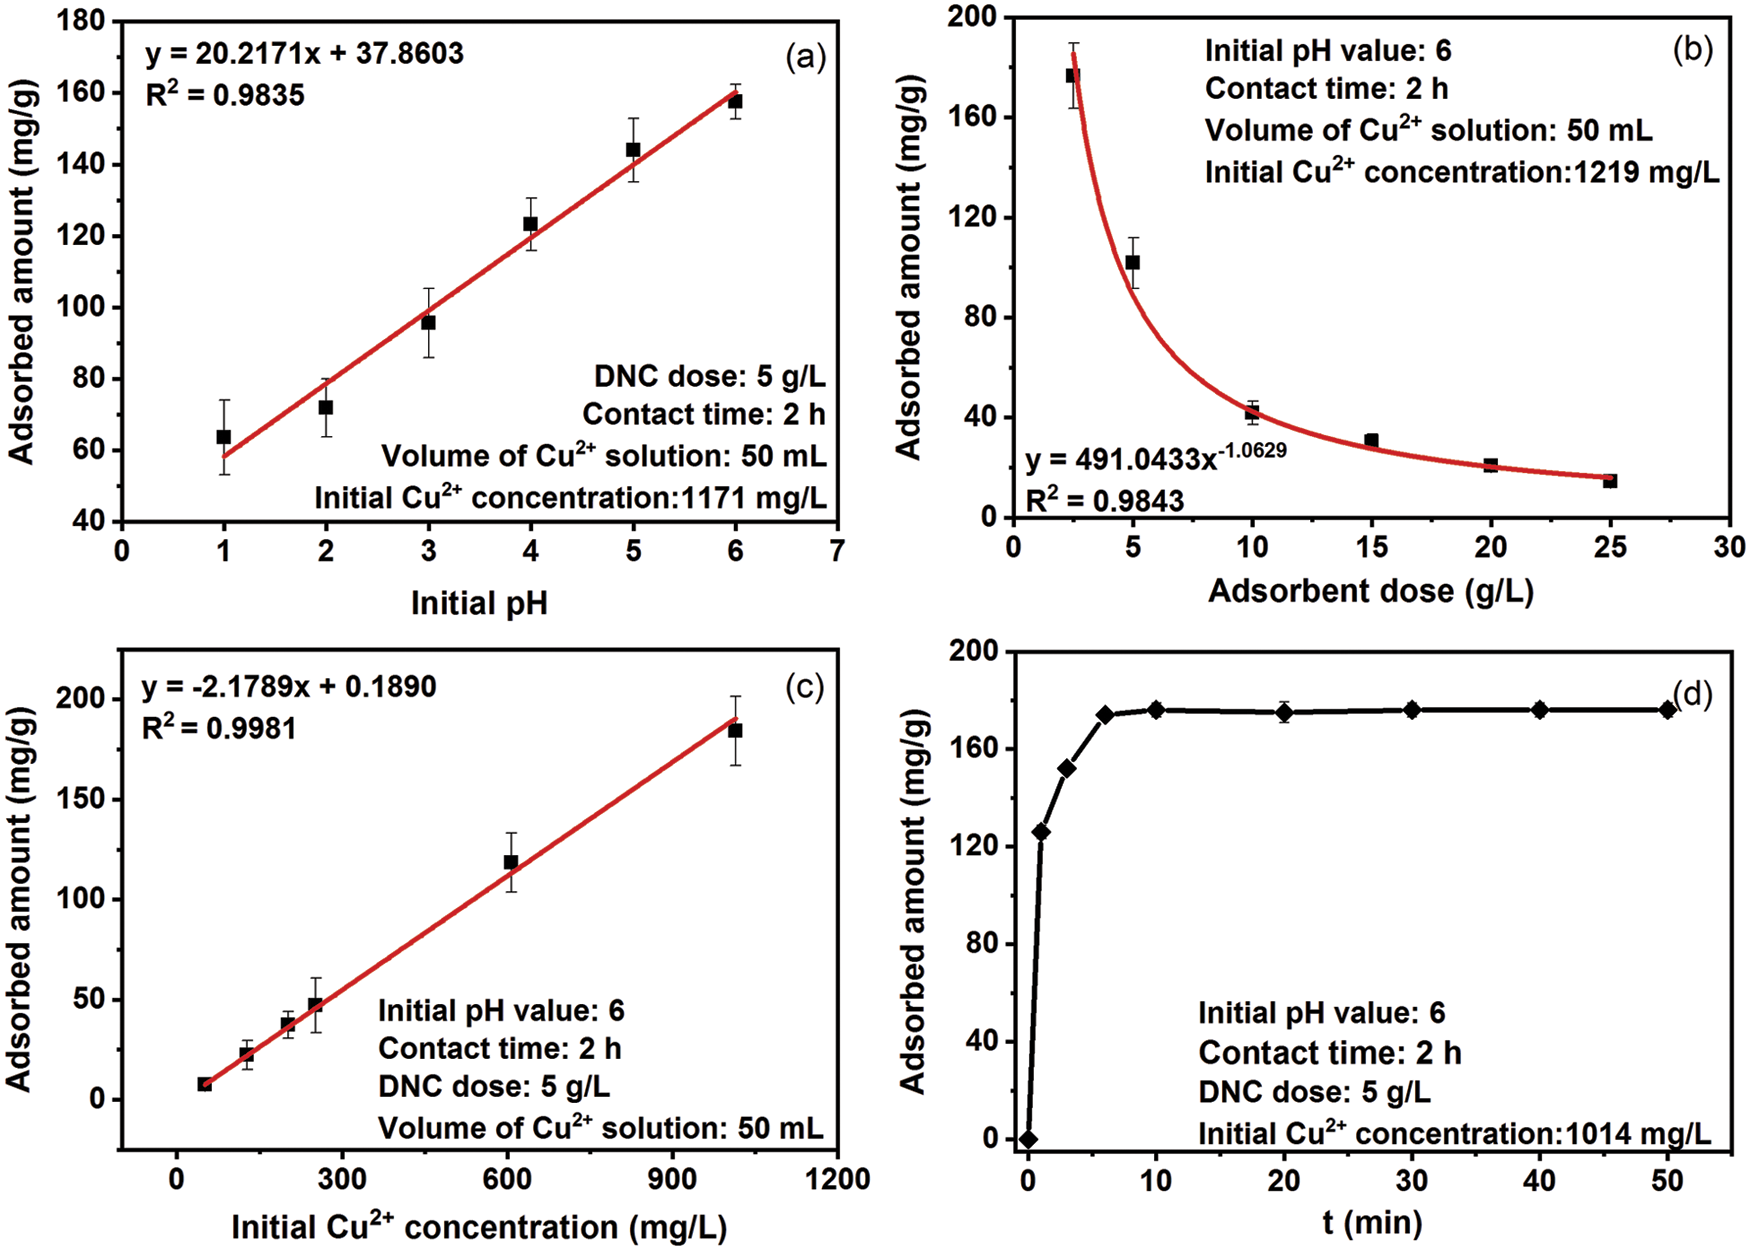
Figure 4: Effects of the initial pH. (a) DNC dose (b) initial Cu2+ concentration (c) and contact time (d) on adsorption amount
As shown in Fig. 4b, the amount of Cu2+ adsorbed onto DNC decreased with increasing adsorbent dose. The results of the present study agree with the results of Sheikhi et al. [39]. The main reason for this trend is that the concentration of remaining Cu2+ in the liquid phase is higher under low adsorbent doses and the equilibrium level of the system is higher, resulting in a high adsorption amount. The concentration of the remaining Cu2+ in the system was lower at the higher adsorbent dose, and the adsorbed amount of the system was close to saturation. However, most of the adsorption sites of DNC were still unsaturated, and the adsorbed amount of DNC was low. Therefore, it is of great significance to choose a reasonable dose of DNC for Cu2+-adsorption engineering.
Adsorption experiments were performed by varying the initial Cu2+ concentration from 50 to 1000 mg/L to investigate the effect of the initial Cu2+ concentration on the adsorbed amount (Fig. 4c). The adsorbed amount increased with increasing initial Cu2+ concentration, which suggested that the maximum Cu2+ adsorption capacity of DNC was not achieved under the conditions of this study. When the pH value was kept constant at 6, the amount of Cu2+ adsorbed was affected by the increase in the initial copper concentration. At low Cu2+ concentrations, Cu2+ adsorption involves only higher-energy surface sites, resulting in a lower adsorption amount. At higher Cu2+ concentrations, both the higher- and lower-energy surface sites could adsorb copper ions, resulting in a higher adsorbed amount [40]. The maximum adsorption capacity reached 184.2 mg/g at pH 6 and an adsorbent dose of 5 g/L.
As shown in Fig. 4d, the amount of Cu2+ adsorbed sharply increased to 176.0 mg/g within 10 min, and little change was observed after 10 min. At the initial stage of adsorption, there are considerably many electronegative carboxyl groups on the surface of DNC, and the copper ions in the solution rapidly complex with the carboxyl groups, occupying most of the adsorption sites. After 10 min, few adsorption sites remained on the DNC surface, and because of the steric hindrance effect, the adsorbed amount of copper ions increased slightly when the contact time was increased. The adsorption rate of Cu2+ by DNC is fast, and the adsorption equilibrium can be reached within 10 min.
3.4 Adsorbent Regeneration Experiments
The adsorption capacity of DNC was taken as 100% when it first adsorbed Cu2+, and after the first desorption and re-adsorption, the adsorbed amount decreased to 96% (Fig. 5). Thereafter, the adsorbed amount tended to stabilize with an increasing number of desorption cycles. After desorption and re-adsorption for five cycles, the adsorbed amount was still above 90%, proving that the DNC could be recycled through desorption and regeneration in the adsorption of heavy metal ions. The adsorbed amount of DNC decreases after desorption because although hydrochloric acid desorption of Cu2+ can effectively remove Cu2+ by competitive adsorption, the process of desorption leads to protonation of carboxylic groups on the DNC surface and increases the adsorption difficulty. This causes the Cu2+ adsorbed amount to decrease, while DNC remains in the form of carboxylic acid after hydrochloric acid desorption; therefore, the continuous increase in desorption cycles has little influence on the adsorption amount.
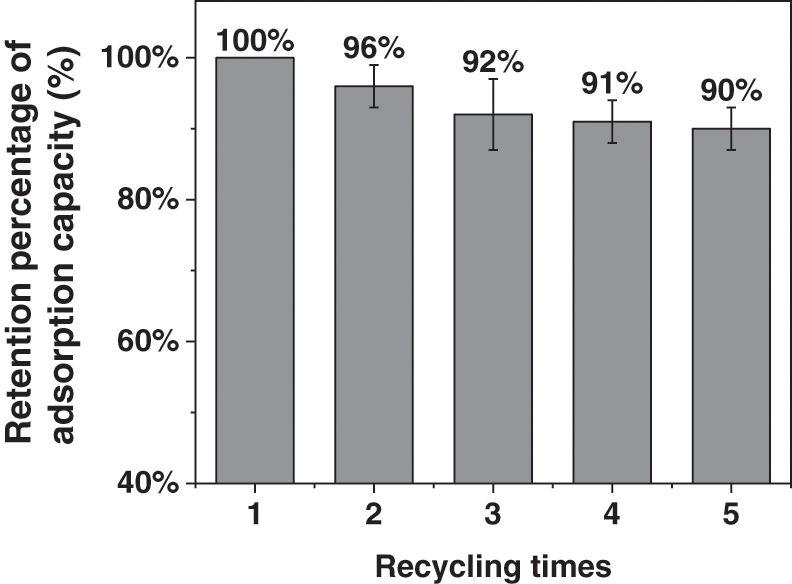
Figure 5: Relationship between recycling times and retention percentage of adsorption capacity for copper ions
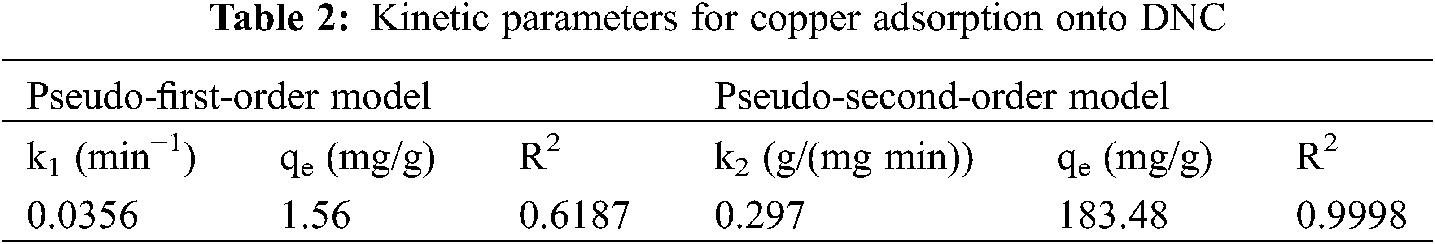
3.5 Adsorption Kinetics of Copper ion Removal by DNC
Pseudo-first-order and pseudo-second-order kinetic models were used to investigate the kinetics of Cu2+ removal by DNC (Tab. 2). The determination coefficient (R2) values were 0.6187 and 0.9998 for the pseudo-first-order and pseudo-second-order kinetic models, respectively. Therefore, the adsorption kinetics of Cu2+ by DNC can be explained by the pseudo-second-order kinetic model, indicating that Cu2+ adsorption onto DNC is a chemisorption process.
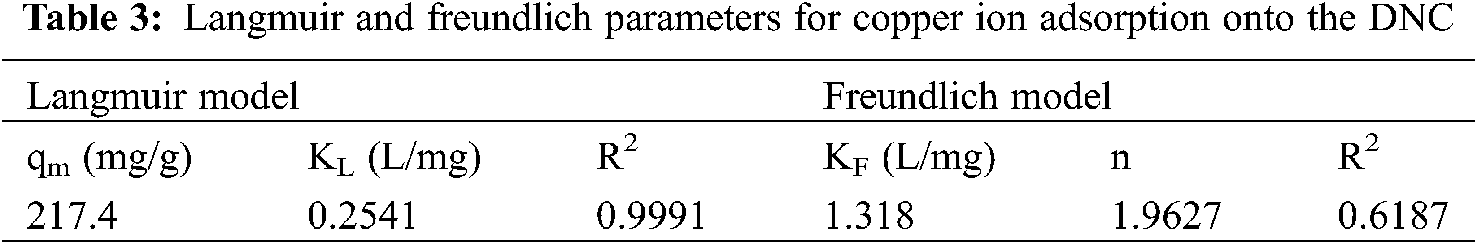
Langmuir and Freundlich isotherm models were used to obtain the isotherm parameters for the adsorption of Cu2+ ions onto DNC (Tab. 3). The determination coefficients (R2) values were 0.9991 and 0.6187 for Langmuir and Freundlich models, respectively. The adsorption data of Cu2+ onto DNC fit well with the Langmuir model; therefore, the distribution of adsorption sites on the DNC surface is uniform, and the adsorption of Cu2+ onto DNC has the characteristics of monolayer adsorption. The results were consistent with those described in Section 3.2. The maximum adsorption capacity of Cu2+ onto DNC was 217.4 mg/g, as calculated by the Langmuir model.
3.7 Study on the Maximum Adsorption Capacity of Carboxylic Nanocellulose
The adsorption of Cu2+ by carboxylic nanocellulose was mainly achieved through the adsorption of Cu2+ by carboxyl and hydroxyl sites, and carboxyl groups were found to be more effective in adsorbing Cu2+ than hydroxyl groups [22,41]. The possible complexations of Cu2+ with carboxyl groups on the surface of carboxylic nanocellulose can be summarized in the following reactions [37,39]. First, the Cu(OH)+ and Cu(COO)+ are generated by the Cu2+ combining with OH− and COO− in the solution. Then, two different forms of complexes (Cu(COO)2 and Cu(COO)(OH)) are generated by the complexation of the Cu(OH)+ and Cu(COO)+ with a large number of COO− on the surface of DNC.
According to Eqs. (8)–(12), the theoretical maximum adsorption capacity of carboxyl groups can be calculated as follows:
where q(COO–) is the theoretical maximum adsorption capacity of carboxyl groups, c(COO–) is the molarity of the carboxyl groups, and M is the relative atomic mass of Cu2+.
Because one five-membered stable chelate is formed by every four hydroxyl groups and one Cu2+ ion, the theoretical maximum adsorption amount of hydroxyl groups can be calculated as follows [36]:
where q(-OH) is the theoretical maximum adsorption capacity of hydroxyl groups, c(-OH) is the molarity of hydroxyl groups, and M is the relative atomic mass of Cu2+.
The theoretical maximum adsorption capacity of carboxylic nanocellulose (qmax) with carboxyl and hydroxyl groups on copper ions is as follows:
The glucose rings in the molecular chain structure of cellulose are alternately distributed, i.e., the functional groups at C2, C3, and C6 are alternately distributed [42]. Therefore, the mole number of the exposed hydroxyl groups is twice that of the carboxyl groups along the cellulose molecular chain in MNC, while the mole number of hydroxyl groups is half that of carboxyl groups in DNC. Although the theoretical maximum adsorption capacity in Eq. (14) is calculated from the carboxyl and hydroxyl content, the carboxyl content can be calculated from the hydroxyl content, so the theoretical maximum adsorption capacity of carboxylic nanocellulose can be calculated using only the carboxyl content.
According to our previous study [19], the maximum carboxyl contents of MNC, DNC, and TNC were 3.0865, 6.1727, and 9.2592 mmol/g, respectively.
For MNC, only the hydroxyl groups at the C6 site are oxidized to carboxyl groups, and the four hydroxyl groups at the C2 and C3 sites can capture one Cu2+ ion [36]. Therefore, the theoretical maximum adsorption capacity of the MNC is calculated as follows:
For DNC, the hydroxyl groups at the C2 and C3 sites are oxidized to carboxyl groups, and it is difficult for the one hydroxyl group remaining at the C6 site to capture copper ions alone [36,41]. Therefore, the theoretical maximum adsorption capacity of DNC was calculated as follows:
For TNC, the hydroxyl groups at the C6, C2, and C3 sites are oxidized to carboxyl groups. The length of cellobiose, the basic unit of cellulose, is 1.03 nm [42], while the ionic diameter of Cu2+ ions in water is 1.2 nm [43]. For TNC, three anhydroglucose units are required to capture one Cu2+ ion because of steric hindrance, that is, 4 moles of carboxylate ions capture 1 mol of copper ions. Therefore, the theoretical maximum adsorption capacity of TNC was calculated as follows:
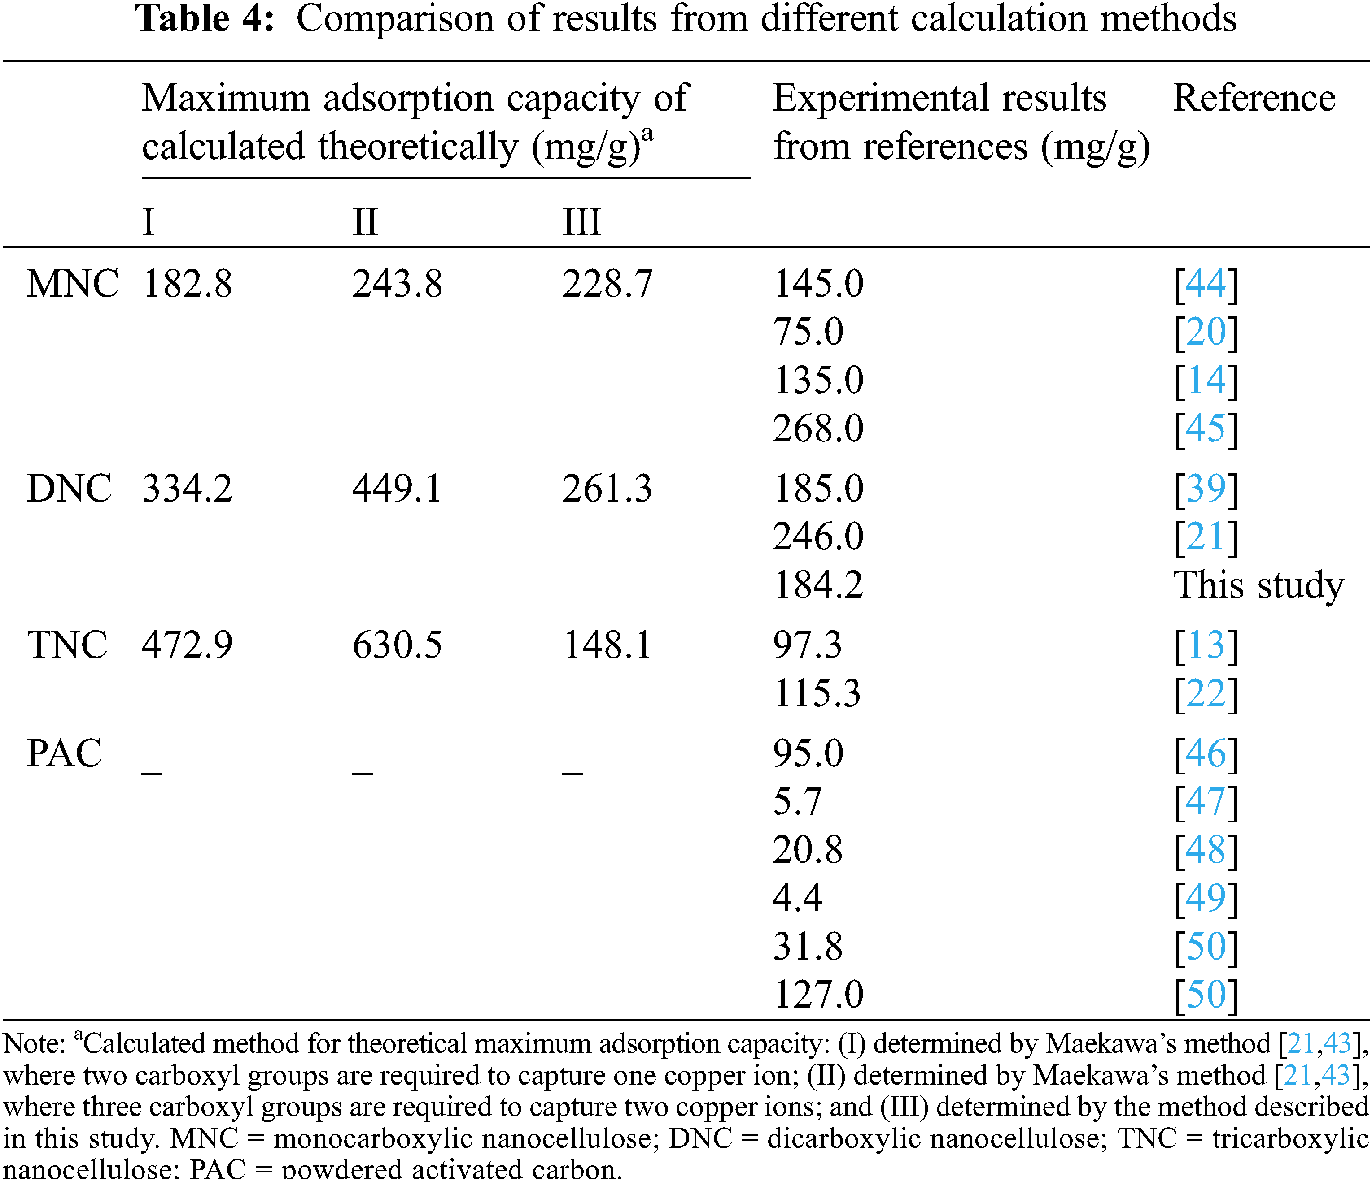
The theoretical maximum adsorption capacities of Cu2+ for MNC, DNC, and TNC were 228.7, 261.3, and 148.1 mg/g, respectively. Tab. 4 compares the results of our theoretical calculations with those of the other methods. The results of this study were closer to the experimental results from other studies. Therefore, the current results were used to investigate the adsorption cost of carboxylic nanocellulose for copper ions.
3.8 Adsorption Cost of Cu2+ onto Carboxylic Nanocellulose
The PAC price of $0.8–2.0 per kg collected from Chinese manufacturers in 2020 was used to analyze the adsorption cost of PAC (Tab. 5). The price data for carboxylic nanocellulose were collected from Chinese manufacturers or suppliers. The price of carboxylic nanocellulose is highly volatile and may range from $77.2–231.7 per kg (dry weight). According to the results of previous research, carboxylic nanocellulose can be recycled at least five times through desorption and regeneration.

The adsorption costs of Cu2+ ions for MNC, DNC, TNC, and PAC are shown in Fig. 6. As shown in Fig. 6a, the Cu2+ adsorption costs of carboxylic nanocelluloses were higher than those of PAC, and the maximum multiple could even reach 500 times when no regeneration was conducted. The fluctuation ranges of the adsorption cost were $288.2–3089.8, and $6.08–456.4 per kg of carboxylic nanocelluloses and PAC, respectively. When five regeneration cycles were performed for carboxylic nanocelluloses, there was an overlapping area of adsorption cost between carboxylic nanocelluloses and PAC (Fig. 6b). The Cu2+ adsorption cost of DNC ($59.1–286.09 per kg Cu2+) is especially likely to be lower than those of PAC ($6.08–456.4 per kg Cu2+). These results indicate that the carboxylic nanocellulose must be recycled to compete with PAC in terms of adsorption cost. In addition, the price of PAC was the price of industrial-scale production, while the price of DNC was the price of small-scale production. With the expansion of DNC production scale, the price of DNC is expected to drop sharply. Therefore, considering the adsorption capacity, reusability and adsorption cost, the DNC prepared by sequential oxidation of NaIO4–NaClO2 has the potential to compete with PAC in the treatment of wastewater containing Cu2+.
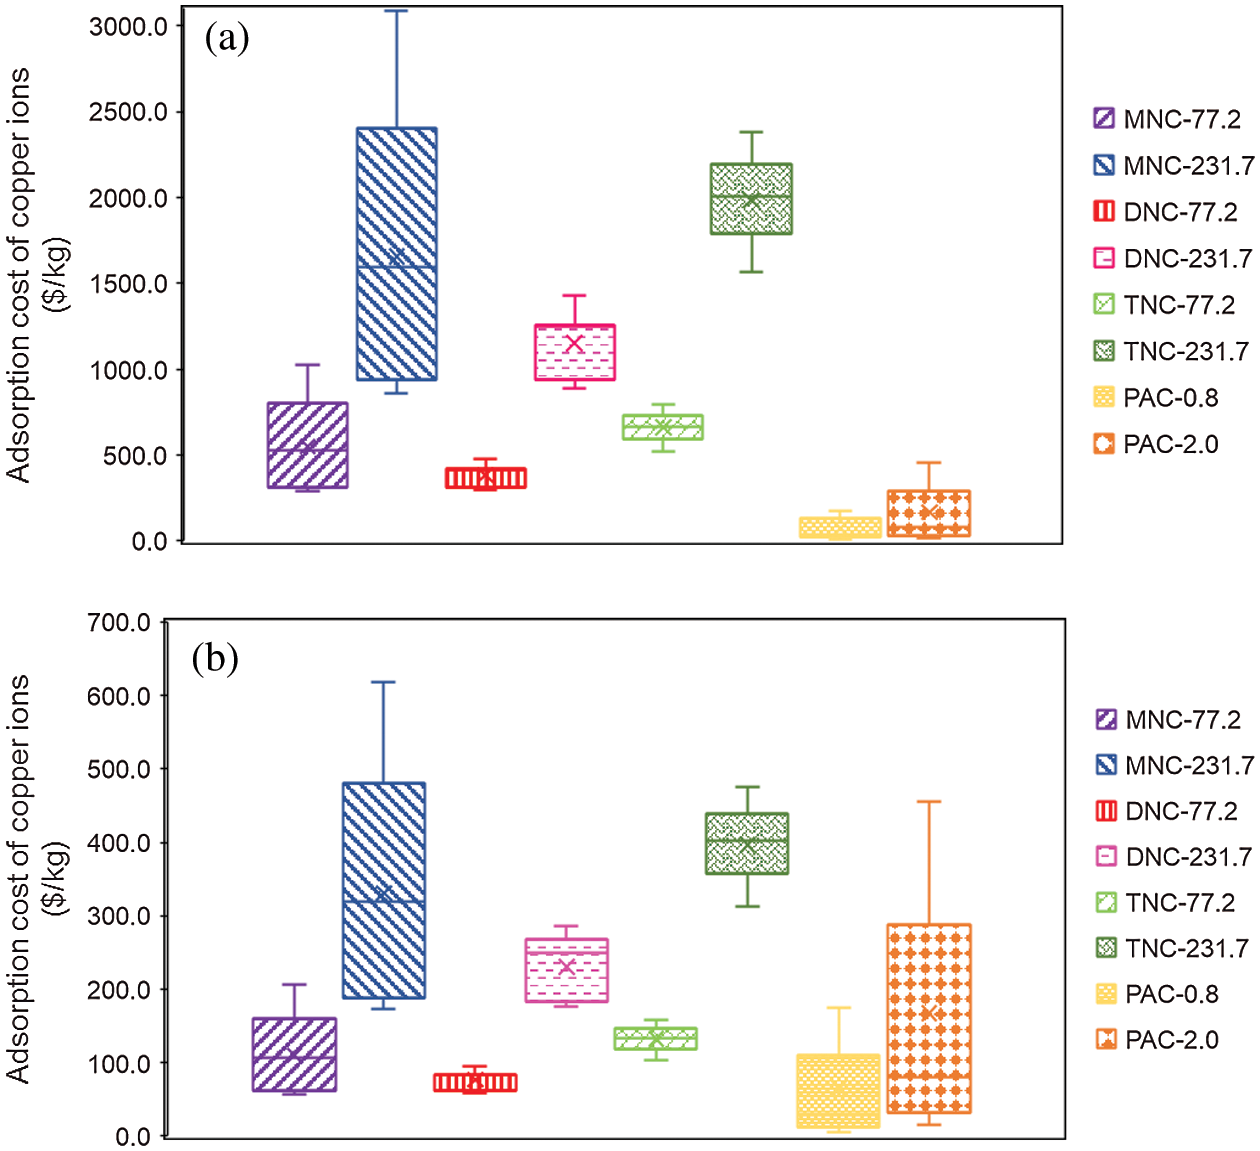
Figure 6: Fluctuation range of the adsorption cost of different adsorbents for copper ions. (a) No regeneration, (b) Five regeneration cycles for MNC, DNC, and TNC
DNC was prepared from MCC using the NaIO4–NaClO2 sequential oxidation method. The higher carboxyl content of 3.4 mmol/g and high specific surface area of 500 m2/g endow DNC with a strong adsorption capacity of 184.2 mg/g for Cu2+ ions. The theoretical maximum adsorption capacities of Cu2+ for MNC, DNC, and TNC were calculated to be 228.7, 261.3, and 148.1 mg/g, respectively. The Cu2+ adsorption cost of DNC is close to or lower than that of PAC, demonstrating that DNC prepared by NaIO4–NaClO2 sequential oxidation has competitive adsorption capacity and cost for the treatment of wastewater containing Cu2+.
Funding Statement: The authors received no specific funding for this study.
Conflicts of Interest: The authors declare that they have no conflicts of interest to report regarding the present study.
1. Blais, J. F., Djedidi, Z., Cheikh, R., Tyagi, R., Mercier, G. (2008). Metals precipitation from effluents: Review. Practice Periodical of Hazardous, Toxic, and Radioactive Waste Management, 12, 135–149. DOI 10.1061/(ASCE)1090-025X(2008)12:3(135). [Google Scholar] [CrossRef]
2. Liu, Y., Wu, Y., Guo, X., Wen, Y., Yang, H. (2019). Rapid and selective detection of trace Cu2+ by accumulation- reaction-based Raman spectroscopy. Sensors & Actuators B: Chemical, 283, 278–283. DOI 10.1016/j.snb.2018.12.043. [Google Scholar] [CrossRef]
3. Demirbaş, A. (2008). Heavy metal adsorption onto agro-based waste materials: A review. Journal of Hazardous Materials, 157, 220–229. DOI 10.1016/j.jhazmat.2008.01.024. [Google Scholar] [CrossRef]
4. Fu, F., Wang, Q. (2011). Removal of heavy metal ions from wastewaters: A review science direct. Journal of Environmental Management, 92, 407–418. DOI 10.1016/j.jenvman.2010.11.011. [Google Scholar] [CrossRef]
5. Sxa, B., Jc, C., Hp, A., Sl, C., Hui, L. D. et al. (2021). Effect of biomass type and pyrolysis temperature on nitrogen in biochar, and the comparison with hydrochar. Fuel, 291, 120128. DOI 10.1016/j.fuel.2021.120128. [Google Scholar] [CrossRef]
6. Leng, L., Xiong, Q., Yang, L., Li, H., Huang, H. (2021). An overview on engineering the surface area and porosity of biochar. Science of the Total Environment, 763, 144204. DOI 10.1016/j.scitotenv.2020.144204. [Google Scholar] [CrossRef]
7. Sun, X. Z., Moon, D., Yagishita, T., Minowa, T. (2013). Evaluation of energy consumption and greenhouse gas emissions in preparation of cellulose nanofibers from woody biomass. Transactions of the ASABE, 56, 1061–1067. DOI 10.13031/trans.56.10040. [Google Scholar]
8. Song, L. Y., Wu, Y. Z., Pei, X. X., Li, R., Chen, H. T. et al. (2020). Pulmonary toxicity and RNA sequencing analyses of mouse in response to exposure to cellulose nanofibrils. Inhalation Toxicology, 32, 388–401. DOI 10.1080/08958378.2020.1831112. [Google Scholar] [CrossRef]
9. van de Ven, T. G. M., Sheikhi, A. (2016). Hairy cellulose nanocrystalloids: A novel class of nanocellulose. Nanoscale, 8, 15101–15114. DOI 10.1039/c6nr01570k. [Google Scholar] [CrossRef]
10. Abouzeid, R. E., Khiari, R., El-Wakil, N., Dufresne, A. (2019). Current state and New trends in the Use of cellulose nanomaterials for wastewater treatment. Biomacromolecules, 20, 573–597. DOI 10.1021/acs.biomac.8b00839. [Google Scholar] [CrossRef]
11. Hokkanen, S., Bhatnagar, A., Sillanpaa, M. (2016). A review on modification methods to cellulose-based adsorbents to improve adsorption capacity. Water Research, 91, 156–173. DOI 10.1016/j.watres.2016.01.008. [Google Scholar] [CrossRef]
12. Voisin, H., Bergstrom, L., Liu, P., Mathew, A. P. (2017). Nanocellulose-based materials for water purification. Nanomaterials, 7, 57–75. DOI 10.3390/nano7030057. [Google Scholar] [CrossRef]
13. Abouzeid, R., Dacrory, S., Ali, K., Kamel, S. (2018). Novel method of preparation of tricarboxylic cellulose nanofiber for efficient removal of heavy metal ions from aqueous solution. Journal of Chromatography B-Analytical Technologies in the Biomedical and Life Sciences, 119, 207–214. DOI 10.1016/j.ijbiomac.2018.07.127. [Google Scholar] [CrossRef]
14. Sehaqui, H., de Larraya, U. P., Liu, P., Pfenninger, N., Mathew, A. P. et al. (2014). Enhancing adsorption of heavy metal ions onto biobased nanofibers from waste pulp residues for application in wastewater treatment. Cellulose, 21, 2831–2844. DOI 10.1007/s10570-014-0310-7. [Google Scholar] [CrossRef]
15. Zhang, N., Zang, G. L., Shi, C., Yu, H. Q., Sheng, G. P. (2016). A novel adsorbent TEMPO-mediated oxidized cellulose nanofibrils modified with PEI: Preparation, characterization, and application for Cu(II) removal. Journal of Hazard Materiels, 316, 11–18. DOI 10.1016/j.jhazmat.2016.05.018. [Google Scholar] [CrossRef]
16. Çavuş, S., Gürdağ, G., Yasar, M., Güçlü, K., Gürkaynak, M. (2006). The competitive heavy metal removal by hydroxyethyl cellulose-g-poly(acrylic acid) copolymer and its sodium salt: The effect of copper content on the adsorption capacity. Polymer Bulletin, 57, 445–456. DOI 10.1007/s00289-006-0583-6. [Google Scholar] [CrossRef]
17. Du, Z., Zheng, T., Wang, P. (2018). Experimental and modelling studies on fixed bed adsorption for Cu(II) removal from aqueous solution by carboxyl modified jute fiber. Powder Technology, 338, 952–959. DOI 10.1016/j.powtec.2018.06.015. [Google Scholar] [CrossRef]
18. Lu, J., Jin, R. N., Liu, C., Wang, Y. F., Ouyang, X. K. (2016). Magnetic carboxylated cellulose nanocrystals as adsorbent for the removal of Pb(II) from aqueous solution. International Journal of Biological Macromolecules, 93, 547–556. DOI 10.1016/j.ijbiomac.2016.09.004. [Google Scholar] [CrossRef]
19. Song, L. Y., Pei, X., Li, R., Chen, H. T., Sun, X. Z. (2020). Preparation of cellulose nanofibrils by multi-site regioselective oxidation. Journal of Renewable Materials, 8, 1269–1273. DOI 10.32604/jrm.2020.010923. [Google Scholar] [CrossRef]
20. Liu, P., Garrido, B., Oksman, K., Mathew, A. P. (2016). Adsorption isotherms and mechanisms of Cu(ii) sorption onto TEMPO-mediated oxidized cellulose nanofibers. RSC Advances, 6, 107759–107767. DOI 10.1039/C6RA22397D. [Google Scholar] [CrossRef]
21. Maekawa, E., Koshijima, T. (1984). Properties of 2,3-dicarboxy cellulose combined with various metallic ions. Journal of Applied Polymer Science, 29, 2289–2297. DOI 10.1002/app.1984.070290705. [Google Scholar] [CrossRef]
22. Qin, F., Fang, Z., Zhou, J., Sun, C., Chen, K. et al. (2019). Efficient removal of Cu2+ in water by carboxymethylated cellulose nanofibrils: Performance and mechanism. Biomacromolecules, 20, 4466–4475. DOI 10.1021/acs.biomac.9b01198. [Google Scholar] [CrossRef]
23. Marsh, H., Rodriguez-Reinoso, F. (2006). Activated carbon. Elsevier Science, Ltd., Oxford, UK. [Google Scholar]
24. Bulota, M., Maasdam, B., Tiekstra, S. (2013). Breakthrough technologies, more with less kenniscentrum papier en karton, pp. 1–17. https://www.docin.com/p-1810342499.html. [Google Scholar]
25. French, A. D. (2020). Increment in evolution of cellulose crystallinity analysis. Cellulose, 27, 5445–5448. DOI 10.1007/s10570-020-03172-z. [Google Scholar] [CrossRef]
26. Segal, L., Creely, J., Martin, A. E. J., Conrad, C. (1959). An empirical method for estimating the degree of crystallinity of native cellulose using the X-ray diffractometer. Textile Research Journal, 29, 786–794. DOI 10.1177/004051755902901003. [Google Scholar] [CrossRef]
27. French, A. D. (2014). Idealized powder diffraction patterns for cellulose polymorphs. Cellulose, 21, 885–896. DOI 10.1007/s10570-013-0030-4. [Google Scholar] [CrossRef]
28. French, A. D., Santiago Cintrón, M. (2013). Cellulose polymorphy, crystallite size, and the segal crystallinity index. Cellulose, 20, 583–588. DOI 10.1007/s10570-012-9833-y. [Google Scholar] [CrossRef]
29. Ho, Y. S., Ng, J., McKay, G. (2000). Kinetics of pollutant sorption by biosorbents: Review. Separation and Purification Reviews, 29, 189–232. DOI 10.1081/SPM-100100009. [Google Scholar] [CrossRef]
30. Langmuir, I. (1917). The constitution and fundamental properties of solids and liquids. Part II. Liquids. Journal of the American Chemical Society, 184, 721. DOI 10.1016/S0016-0032(17)90938-X. [Google Scholar] [CrossRef]
31. Herbert, F. (1907). Über die adsorption in lösungen. Zeitschrift für Physikalische Chemie, 57, 385–470. DOI 10.1515/zpch-1907-5723. [Google Scholar] [CrossRef]
32. Barczynski, P., Komasa, A., Ratajczak, M. (2011). Structure of 3,4-dicarboxy-1-methylpyridinium inner salt studied by X-ray diffraction, DFT calculations, FTIR, Raman and NMR spectra. Journal of Molecular Structure, 994, 216–222. DOI 10.1016/j.molstruc.2011.03.021. [Google Scholar] [CrossRef]
33. Garba, Z. N., Lawan, I., Zhou, W., Zhang, M., Wang, L. et al. (2020). Microcrystalline cellulose (mcc) based materials as emerging adsorbents for the removal of dyes and heavy metals-A review. The Science of the Total Environment, 717, 135070.1–135070.21. DOI 10.1016/j.scitotenv.2019.135070. [Google Scholar] [CrossRef]
34. Conley, K., Whitehead, M. A., van de Ven, T. G. M. (2016). Chemically peeling layers of cellulose nanocrystals by periodate and chlorite oxidation. Cellulose, 23, 1553–1563. DOI 10.1007/s10570-016-0922-1. [Google Scholar] [CrossRef]
35. Liu, P., Oksman, K., Mathew, A. P. (2016b). Surface adsorption and self-assembly of Cu(II) ions on TEMPO-oxidized cellulose nanofibers in aqueous media. Journal of Colloid & Interface Science, 464, 175–182. DOI 10.1016/j.jcis.2015.11.033. [Google Scholar] [CrossRef]
36. Ajiboye, S. I., Brown, D. R. (1990). Electron spin resonance study of soluble copper(II)–cellulose complexes. Journal of the Chemical Society, Faraday Transactions, 86, 65–68. DOI 10.1039/FT9908600065. [Google Scholar] [CrossRef]
37. Borges, F., Guimaraes, C., Lima, J. L., Pinto, I., Reis, S. (2005). Potentiometric studies on the complexation of copper(II) by phenolic acids as discrete ligand models of humic substances. Talanta, 66, 670–673. DOI 10.1016/j.talanta.2004.12.012. [Google Scholar] [CrossRef]
38. Abouzeid, R., Salama, A., Alahmed, Z., Awwad, N., Youssef, M. (2020). Carboxylated cellulose nanofibers as a novel efficient adsorbent for water purification. Cellulose Chemical and Technology, 54, 237–245. DOI 10.35812/CelluloseChemTechnol. [Google Scholar] [CrossRef]
39. Sheikhi, A., Safari, S., Yang, H., van de Ven, T. G. M. (2015). Copper removal using electrosterically stabilized nanocrystalline cellulose. ACS Applied Materials & Interfaces, 7, 11301–11308. DOI 10.1021/acsami.5b01619. [Google Scholar] [CrossRef]
40. Kadirvelu, K., Faur-Brasquet, C., Le Cloirec, P. (2000). Removal of Cu(IIPb(IIand Ni(II) by adsorption onto activated carbon cloths. Langmuir, 16, 8404–8409. DOI 10.1021/la0004810. [Google Scholar] [CrossRef]
41. Poorsargol, M., Razmara, Z., Amiri, M. M. (2020). The role of hydroxyl and carboxyl functional groups in adsorption of copper by carbon nanotube and hybrid graphene–carbon nanotube: Insights from molecular dynamic simulation. Adsorption, 26, 397–405. DOI 10.1007/s10450-020-00214-7. [Google Scholar] [CrossRef]
42. Bruce, S. (2005). Cellulose: Structure and distribution. Encyclopedia of life sciences, New York, John Wiley & Sons. [Google Scholar]
43. Maekawa, E., Ueno, I., Koshijima, T. (1981). Properties and thermal behaviors of 2,3-dicarboxy cellulose metallic salts. Seni Gakkaishi, 37, 57–63 (in Japanese). DOI 10.2115/fiber.37.12_T509. [Google Scholar] [CrossRef]
44. Zhang, L., Lu, H., Yu, J., Fan, Y., Yang, Y. et al. (2018). Synthesis of lignocellulose-based composite hydrogel as a novel biosorbent for Cu2+ removal. Cellulose, 25, 7315–7328. DOI 10.1007/s10570-018-2077-8. [Google Scholar] [CrossRef]
45. Isobe, N., Chen, X., Kim, U. J., Kimura, S., Wada, M. et al. (2013). TEMPO-Oxidized cellulose hydrogel as a high-capacity and reusable heavy metal ion adsorbent. Journal of Hazardous Materials, 260, 195–201. DOI 10.1016/j.jhazmat.2013.05.024. [Google Scholar] [CrossRef]
46. Reyad, A., Shawabkeha, D. A. R., Bhadab, R. K. (2002). Copper and strontium adsorption by a novel carbon material manufactured from pecan shells. Carbon, 40, 781–786. DOI 10.1016/S0008-6223(01)00198-1. [Google Scholar] [CrossRef]
47. Kalavathy, M. H., Karthikeyan, T., Rajgopal, S., Miranda, L. R. (2005). Kinetic and isotherm studies of Cu(II) adsorption onto H3PO4-activated rubber wood sawdust. Journal of Colloid and Interface Science, 292, 354–362. DOI 10.1016/j.jcis.2005.05.087. [Google Scholar] [CrossRef]
48. Rao, M. M., Ramesh, A., Rao, G. P., Seshaiah, K. (2006). Removal of copper and cadmium from the aqueous solutions by activated carbon derived from ceiba pentandra hulls. Journal of Hazardous Materials, 129, 123–129. DOI 10.1016/j.jhazmat.2005.08.018. [Google Scholar] [CrossRef]
49. An, H. K., Park, B. Y., Kim, D. S. (2001). Crab shell for the removal of heavy metals from aqueous solution. Water Research, 35, 3551–3556. DOI 10.1016/S0043-1354(01)00099-9. [Google Scholar] [CrossRef]
50. Dastgheib, S. A., Rockstraw, D. A. (2001). Pecan shell activated carbon: Synthesis, characterization, and application for the removal of copper from aqueous solution. Carbon, 39, 1849–1855. DOI 10.1016/S0008-6223(00)00315-8. [Google Scholar] [CrossRef]
 | This work is licensed under a Creative Commons Attribution 4.0 International License, which permits unrestricted use, distribution, and reproduction in any medium, provided the original work is properly cited. |