| Journal of Renewable Materials |
DOI: 10.32604/jrm.2022.016898
ARTICLE
Finite Element Analysis on the Uniaxial Compressive Behavior of Concrete with Large-Size Recycled Coarse Aggregate
Department of Structural Engineering, Tongji University, Shanghai, 200092, China
*Corresponding Author: Jianzhuang Xiao. Email: jzx@tongji.edu.cn
Received: 07 April 2021; Accepted: 18 June 2021
Abstract: To model the concrete with complex internal structure of concrete with large sized aggregates the effect of internal structure on uniaxial compression behavior are studied. Large-sized recycled aggregates behave differently in the concrete matrix. To understand the influence on concrete matrix, a finite element model was developed to model recycled aggregate concrete composed of multiple randomly distributed irregular aggregates and cement mortar. The model was used to calculate the effect of large-size recycled coarse aggregate (LRCA) on the strength of recycled aggregate concrete and simulate the compressive strength of cubes and prisms. The factors such as the strength of new concrete, the strength of old concrete, the defective element content, the shape of LRCA, the incorporation ratio of LRCA and the size of LRCA that can affect the strength of concrete are analyzed in this paper. Results showed that the influence of various factors on concrete strength are in the following desending order: (i) strength of newly poured concrete; (ii) original strength of recycled aggregates; and (iii) defects. It can be seen that the cracking of the phase material elements starts along the bonding zones between gravel and mortar or the new and old mortar, then spreads to mortar and finally to LRCA. The cracking tendency is most significant in LRCA, which means that the fracturing is related to the fracture of the LRCA. After evaluating the variations in strength and quality of the recycled concrete, the influences on concrete strength and quality were studied. The results showed that the proposed concrete model with LRCA was successfully applied to studying the uniaxial compressive behavior of concrete with large-size recycled coarse aggregate.
Keywords: Recycled aggregate concrete (RAC); large-size recycled coarse aggregates (LRCA); finite element simulation; strength; cracking
Concrete with large-size recycled coarse aggregate (LRCA) has obvious advantages of lower production costs and higher utilization of waste. Using concrete with LRCA can minimize processes on conventional recycled aggregate concrete (RAC), reduces production costs, and increase the utilization rate of waste concrete. This kind of concrete is produced by incorporating large-size waste concrete (Hereinafter referred to as old concrete) block to fresh concrete (Hereinafter referred to as new concrete) and mixing. The maximum size of recycled aggregate used in this study is 80 mm confirming Hydraulic Concrete Mix Design Procedures [1], in which the size of the aggregate can be up to 150 mm. This kind of concrete is suitable for engineering components or projects requiring a large concrete volume with sparse steel distribution. For example, the concrete with LRCA can be applied in a pile foundation platform, massive reinforced concrete members, foundation pit support structure, or small dams.
Different structures characterize concrete at different length scales [2,3]. Pichler et al. [4] studied micro-cracks, propagating and interacting with each other, determining the material’s non-trivial macroscopic behavior. The development of mathematics allows the randomness of concrete to be estimated and used in the analysis, such as Stochastic Galerkin Approach to Uncertainty Quantification [5–7] and collocation moment equation [8–10] can provide the mean value, standard deviation, covariance to estimate the randomness of concrete. However, the failure of concrete is rooted in the uneven distribution of each phase in concrete. It cannot reflect this uneven distribution in the macroscopic model. Thus, the mesoscopic model with uneven phase distribution and various defects is more likely to reveal the complexity of concrete’s mechanical behavior. Wittmann et al. [11] and Sadouki et al. [12] divided the concrete material into the macro, meso, and micro-scale, and in mesoscale, the concrete is non uniform. Thus, the macro approach is only an approximation, which cannot describe the mechanical characteristics of stress distribution and crack in the concrete.
RCA concrete has been well researched. The most practical maximum RCA length is about 30.5 mm. RAC has not been widely applied due to high cost and lowered quality. RAC was more expensive, and that prevented it from being widely used. Another recycling approach that Zhu et al. [13] promoted was waste concrete utilization. Wu et al. [14] used 500 mm or longer waste concrete segments to replace concrete in steel stub concrete columns to produce thin-walled steel stub columns containing demolished concrete segments. The compression bearing capacity of steel tubular columns did not significantly drop, which is an alternative to using concrete segments/lumps in concrete construction. To begin, Peng et al. [15,16] proposed the five-phase sphere model of recycled aggregate concrete (RAC) to calculate the theoretical formulas for the Poisson’s ratio and effective elastic modulus, which is accomplished using the finite element method (base force element method). Ying et al. [17] utilized the finite element method to create a dynamic base force element model to simulate and analyze the dynamic mechanical behavior of RAC under axial, flexural, and shear stress. The same method could be used to simulate the whole stress-strain softening curve of RAC material. Yu et al. [18] used finite element and discrete element methods to simulate the uniaxial compression process of recycled concrete while also analyzing adhered mortar content and other variables. Reused concrete components by Raza et al. [19,20] used the finite element method on FRP-Reinforced Concrete Structures. This proves the process of recycling concrete is feasible using the simulation method. However, the composition of the LRCA is quite different from that of conventional concrete, and its failure mechanism also will be different from that of conventional concrete. Conventional tests have difficulty in revealing the internal failure process. Numerical simulations can reveal phenomena that are difficult to observe at a meso-scale by explaining the failure mechanisms and strength change or can replace some tests [21,22]. When the specimen is subjected to splitting tensile load, the crack development shows a so-called crack bridging phenomenon [23], which is similar to the specimen’s failure state in the test. Gurson [24] proposed the Gurson model for describing the plastic deformation of microscopic voids, then Tvergaard [25] modified the Gurson model to allow the interaction between micro-porosity. Bazant et al. [26] proposed a random particle model to simplify the recycled aggregates into randomly distributed particles. Later, Mohamed et al. [27] proposed the meso-structure model and carried out the finite element to predict the complete mechanical response of concrete materials under monotonic loading. Caballero et al. [28] used a zero-thickness element between the aggregate and the mortar to establish a three-dimensional micromechanical model and carried out the numerical simulation of the concrete’s tensile test. Based on the concrete’s meso-scale, various meso-mechanical models of the fracture process were proposed [29,30]. Therefore, in this study, the failure of concrete with LRCA under uniaxial compression was studied using simulation on the mesoscale.
At present, the simulation of recycled concrete is relatively simple. A simple recycled aggregate model is a natural aggregate as the core and a thin layer of mortar on the surface aggregate for conventional recycled concrete. However, the large-size recycled aggregate is complicated, so that this simplification maybe not appropriate. Because the mortar is wrapped with multiple aggregates, it needs to be established as a structural model. Large-size recycled concrete’s complex structure also causes it to be quite different from conventional concrete under uniaxial compressive behavior. The larger specimen size increases the complexity of the test, so numerical simulation has become a necessary analysis method. In this paper, numerical simulation is used to find the influence of new and old concrete strength, recycled aggregate incorporation ratio, recycled aggregate shape, and damage degree on recycled concrete’s uniaxial compression performance. In this study, the strength characteristics of concrete with LRCA under the influence of different factors such as phase material strength, aggregate shape, defect, etc., will be obtained and analyzed. Moreover, through the compression process analyze obtained the cracking characteristics and mechanisms of this concrete. These studies will provide a basis for master the mechanical properties and application of this kind of concrete.
LRCA is far more prominent in size than natural aggregate, presenting a more jagged and rough profile and cannot be easily replaced with natural coarse aggregates. Recycled aggregate is obtained by crushing waste concrete, and the surface will be covered with a layer of old mortar from waste concrete. In recycled concrete, the old mortar is covered with a layer of new mortar, making it a compound composite with old and new mortar. Also, when the concrete breaks, much old mortar in the LRCA will fracture [31]. Therefore, the distribution of natural aggregate, mortar, and the interface transition zone (ITZ) in LRCA is simulated in this study. A two-dimensional model was built to simulate the failure process of concrete with LRCA under a uniaxial compression process. In this way, a model that can reflect the mesoscale structure of concrete with LRCA was established.
2.1 Generation of Random Aggregate
In this study, the aggregate was generated using two methods. First, the polar coordinate is used to generate nodes, and then nodes were connected by the polar coordinate system at different angles to form a polygon. The generated polygon is judged based on the convexity of the shape. Second, a triangular or a quadrangular base was adopted, and outside of this base, vertices were randomly generated and connected with adjacent sides to form a new base. These steps are repeated until a suitable shape is formed.
In this paper, the convex hull algorithm [32] was used to generate two-dimensional aggregates with different shapes, with a reference circle to form a convex polyhedron. First, random vertices were generated with a constant radius, and then unqualified vertices were eliminated. The vertices are sequentially connected to form an irregular convex polygon, and the generation process is as follows:
Step 1: In polar coordinates, a random radius was selected in the aggregate gradation range, and some random angles were selected in the range (0, 2π) for the generation of the vertices of a polygon.
Step 2: The vertices were sorted in ascending order of the angle.
Step 3: Counterclockwise, connect a selected vertice v1 and the next vertice v2 to form line l1.
Step 4: If the remaining vertices are on the left of l1, select the next vertice as v1 and continue to Step 3. Otherwise, remove the vertice v2 and repeat Step 3 until all vertices are on the left of all lines.
The generated points are shown in Fig. 1a, and generated aggregate is shown in Fig. 1b. It can be seen from Fig. 1b that the polygon is similar to the actual shape of the coarse aggregate.
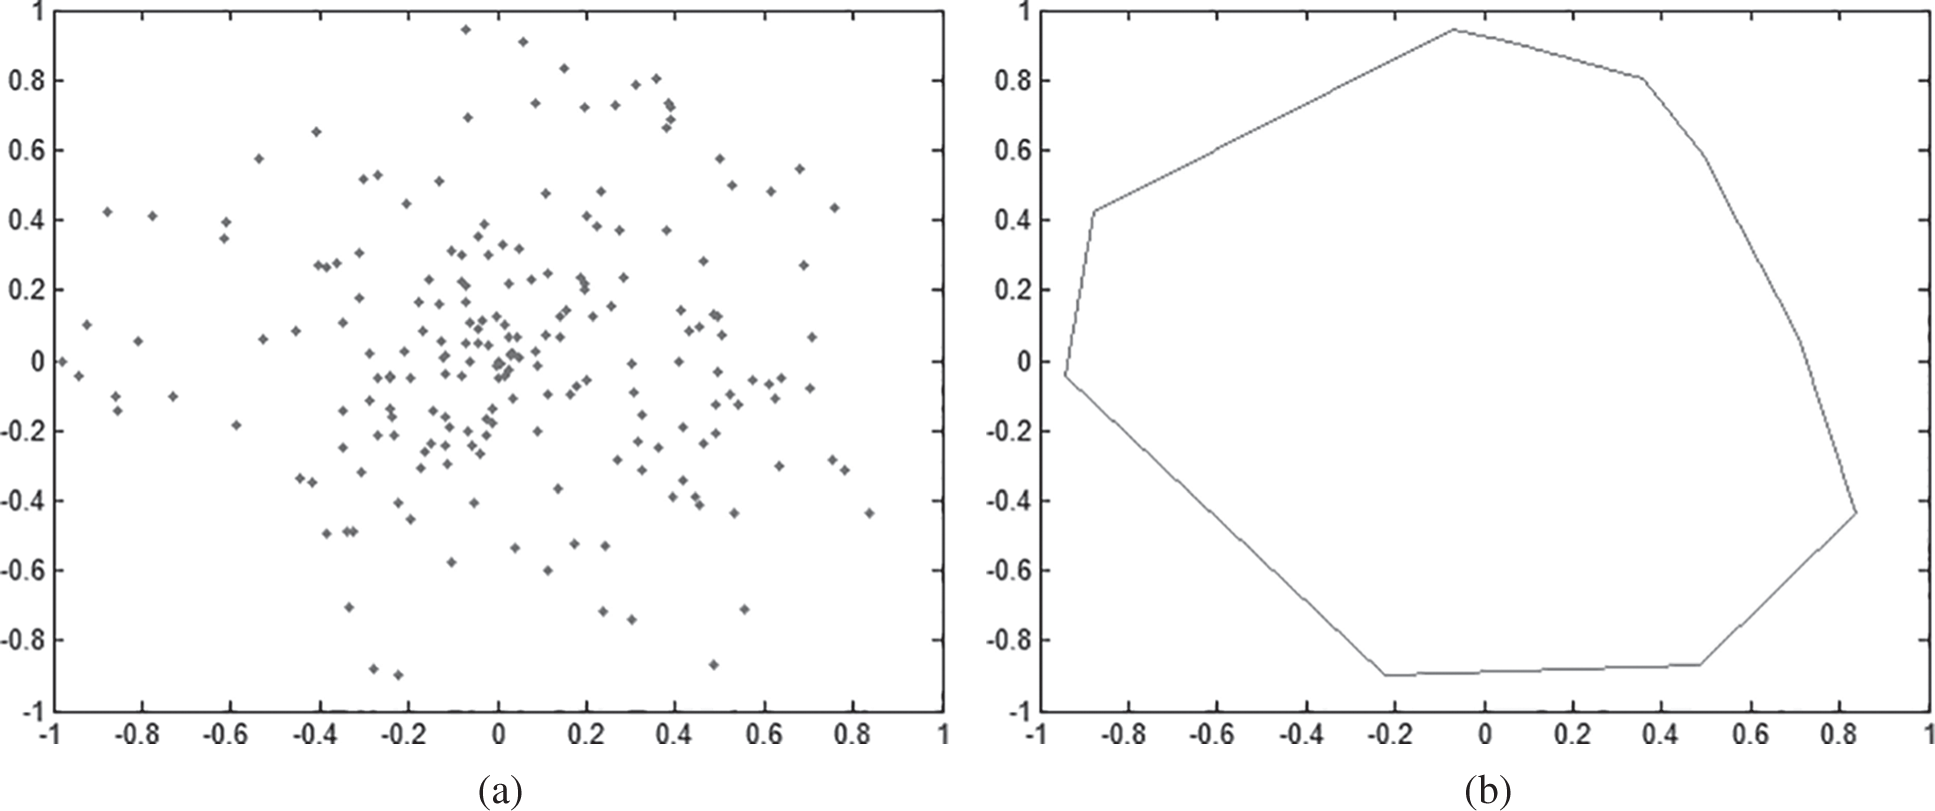
Figure 1: Process of building aggregate (a) Random points (b) Final aggregate
To eliminate the slender aggregate, the polygon’s area ratio to circle and the standard deviation are used to check the generated aggregate. The area ratio is used to determine how circular a polygon is, which means whether the polygon is in the shape of a perfect circle. Through multiple attempts, the area ratio parameter was set to 0.5, with which the generated shape of aggregate is close to the shape of real aggregate.
2.2 Distribution of Aggregates
The Monte Carlo method was used to generate the position and size of the aggregate. Then, by using the Dinger Funk function, the size grading of the aggregate is determined. A commercial software, MATLAB, was used for the modeling of aggregate. As specified in the specification, the minimum particle size (5 mm) of coarse aggregate accounts for accuracy and computational efficiency, so an element with a 3 mm edge is selected.
Intersection judgment of polygons is judged in the same way as in the generation of RCA. Following are the steps are taken for the judgment:
1. A random point was used as the center of aggregate, where the aggregate will be placed, and coordinates of each vertex are then calculated.
2. The boundary equation of the generated aggregate was used to determine whether each vertex is within the placed aggregate.
3. If the vertices are not within the already placed aggregate, then the whole process from Step 1 is repeated, else, aggregate is placed.
4. Similarly, the steps were repeated for other aggregates which have not been placed.
A quadrilateral mesh is used as the background grid to calculate each mesh node’s intersection with coarse aggregate. A 3 × 3 grid unit determines the aggregate boundary and material properties based on the mesh node’s position. To cover the mesh nodes and calculate the properties of different nodes, two steps are adopted for rough boundary division, and the detailed boundary material judgment will be performed later. The two steps involved are as follows:
1. If all the mesh nodes are of a single material, the grid’s center point is the same as the material type.
2. If nodes have more than one material type, the grid’s center point is the interface of the different material types.
In the experiment, the incorporation ratio is calculated by the mass ratio of LRCA to new concrete with the need to incorporate LRCA. In the model, the area of new and old mortars and large-size recycled aggregates and the gravel is calculated first. Then the mass ratio of LRCA to new concrete according to the apparent density of the gravel as 2600 kg/m3 and the density of the mortar as 2400 kg/m3 is calculated. When the incorporation ratio error of the generated model is less than 10%, it is considered to meet the requirements; otherwise, it is regenerated until the requirements are met. Five different incorporations (0%, 10%, 20%, 30%, and 40%) of RCA model the cube and the prism specimen. The dimensions of the cube and prism models are 300 × 300 mm and 300 × 600 mm, respectively. The microscopic mechanical models of these compressive specimens are shown in Figs. 2 and 3, respectively. Since LRCA cannot be reduced to regular gravel with attached old mortar, the model shown in Figs. 2 and 3 reflects gravel distribution within LRCA. This is an apparent difference between the conventional recycled concrete and LRCA concrete model.
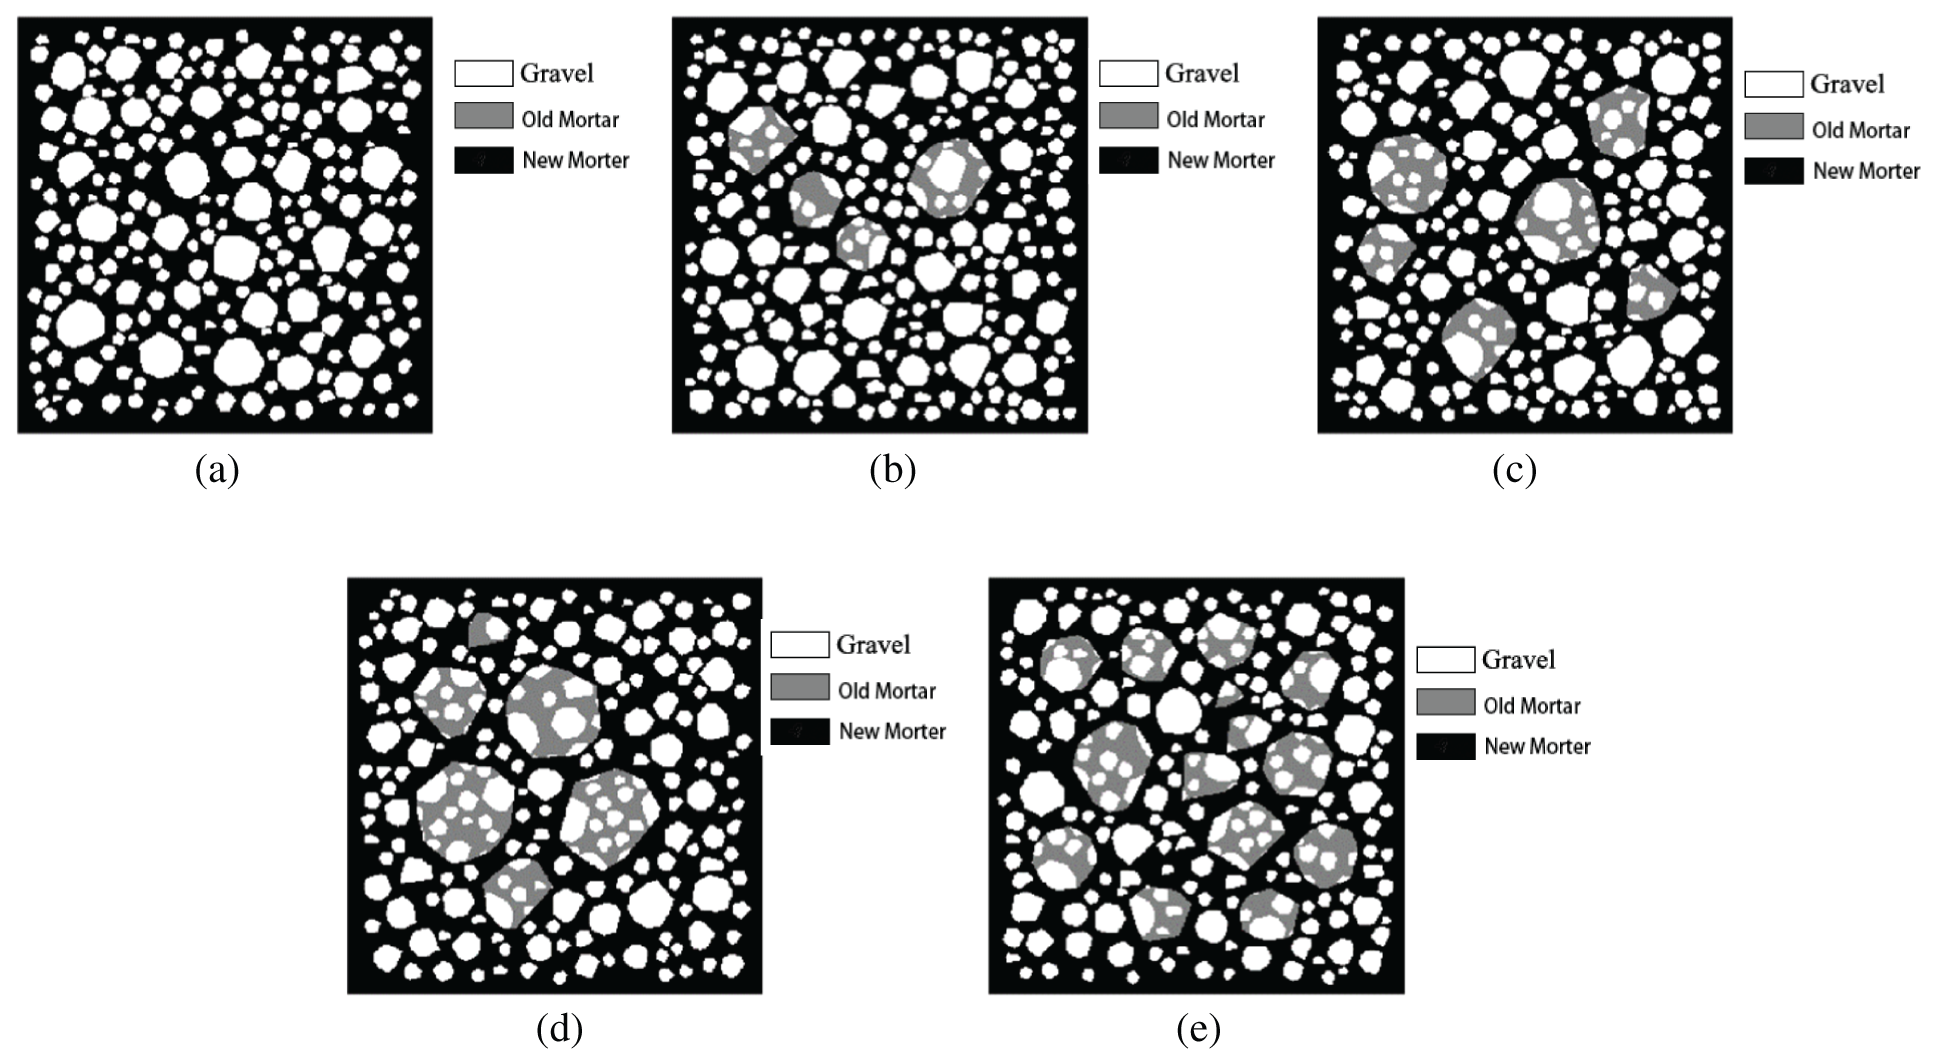
Figure 2: The cube model with different LRAC incorporation (a) 0% of LRCA (b) 10% of LRCA (c) 20% of LRCA (d) 30% of LRCA (e) 40% of LRCA
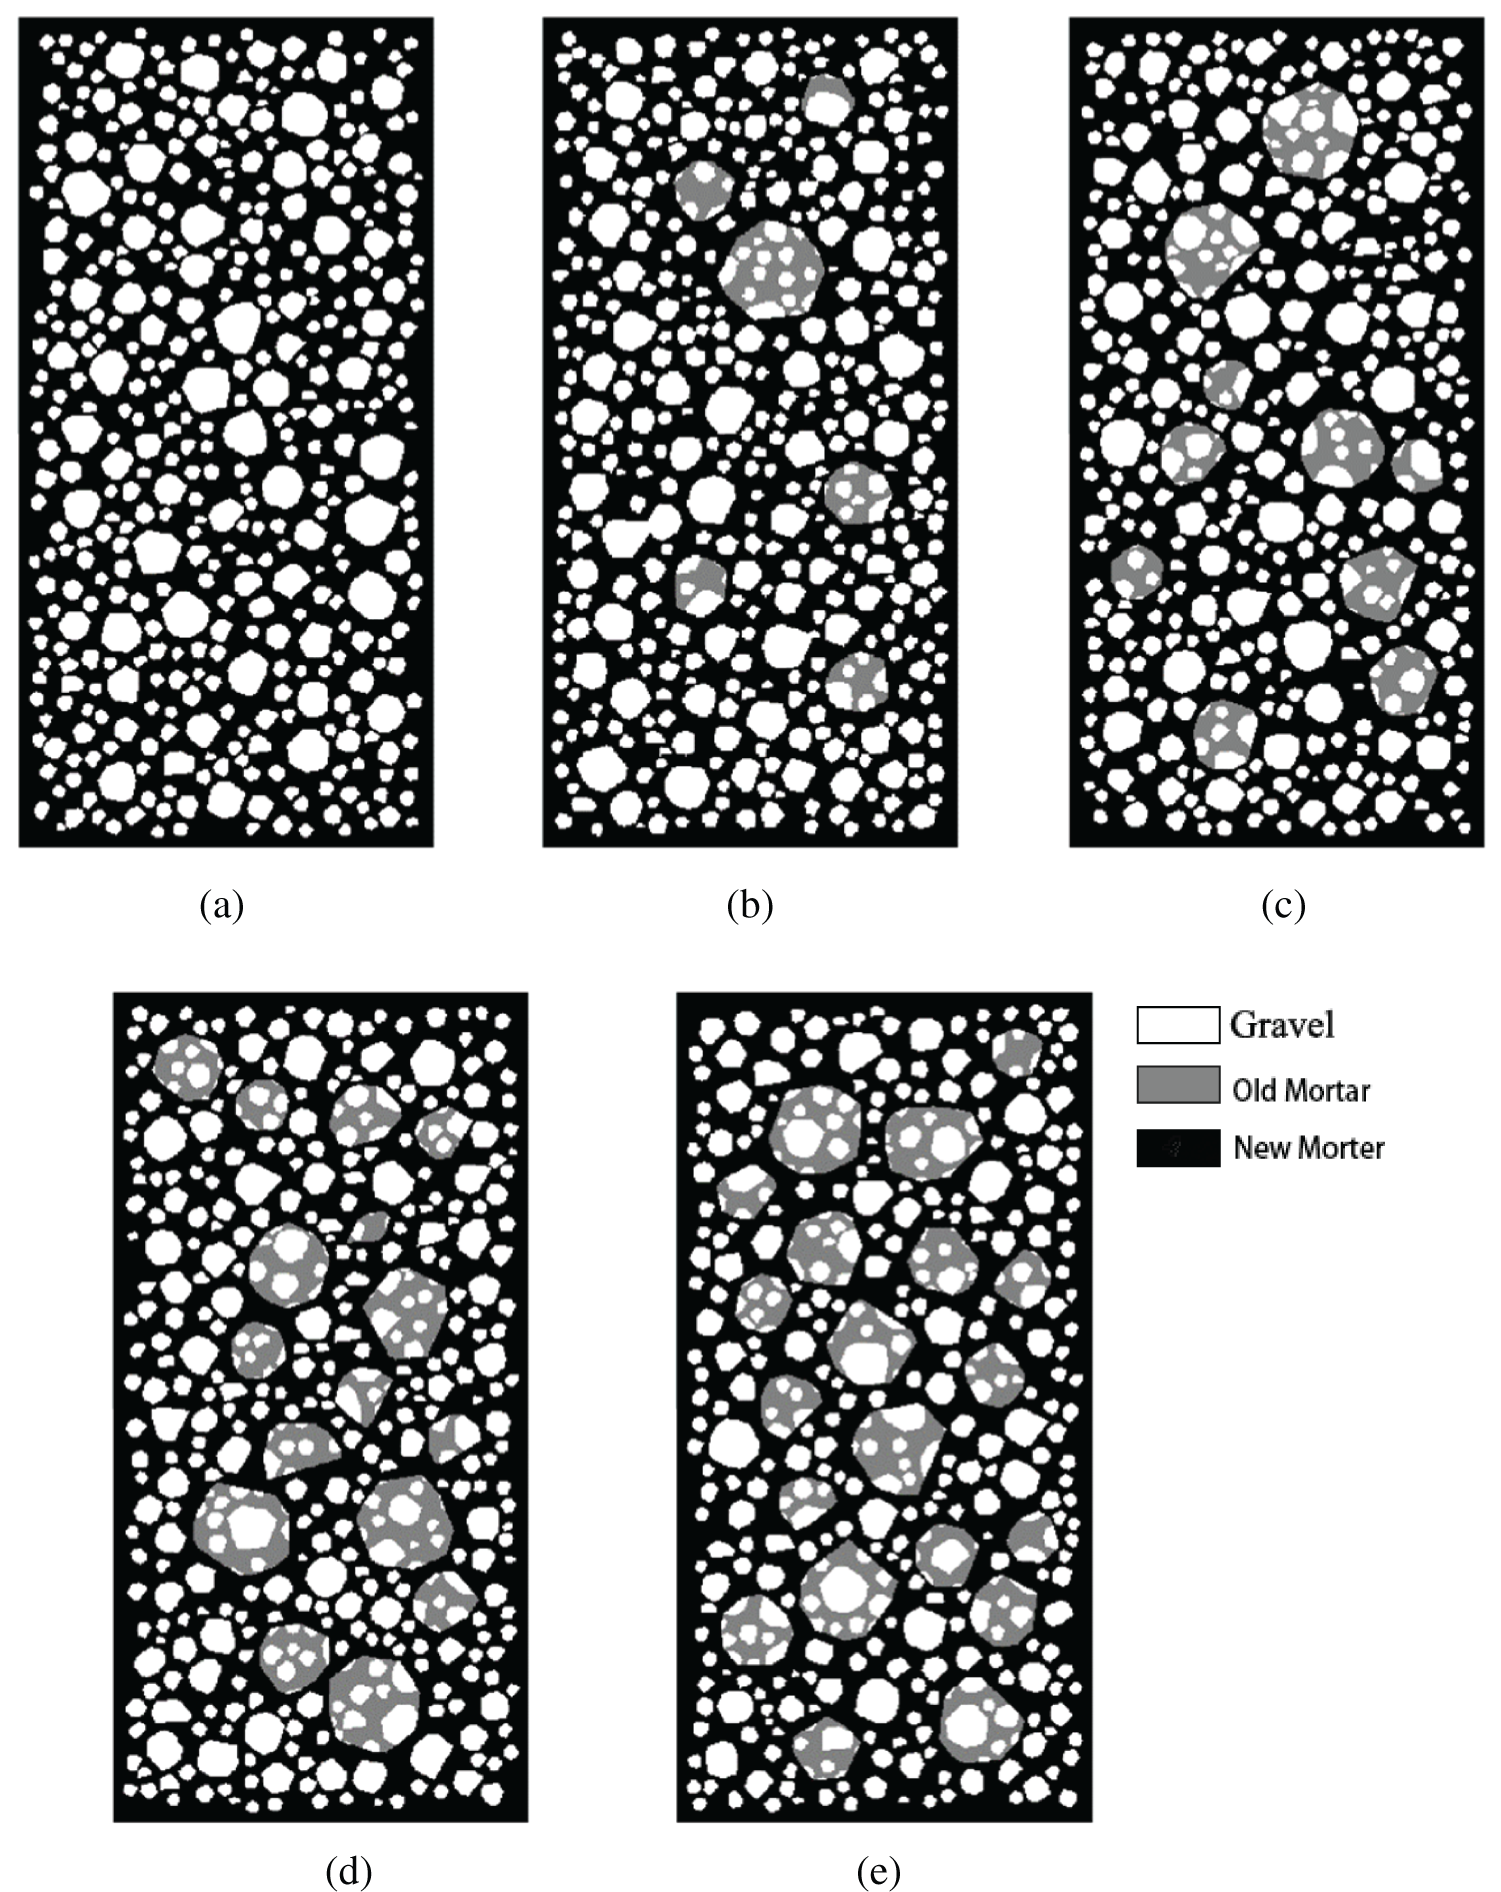
Figure 3: The prism model with different RAC incorporation (a) 0% of RCA (b) 10% of RCA (c) 20% of RCA (d) 30% of RCA (e) 40% of RCA
2.3 Interface Element Generation
The interface transition zone is an essential part of recycled aggregate. So, it is necessary to establish a bonding element to reflect the influences of the ITZ. The element’s boundary was created in previous steps, but the element property was not classified in detail. The following steps are followed to generate the interface elements: Create a blank array b[n][m] with the same size as the model. The corresponding array to each element’s material number of the original model is a[n][m]. It assigns the material element number as 2k, where k is the material number of each phase except the bonding element. Suppose the current array is a[x, y]. Then the new array is as follows:
In Eqs. (1)–(4), the “|” represents the binary OR operation. The matrix is obtained by processing the entire finite element mesh, which stores the material number that contains boundary information. Each number in matrix a corresponds to a material type, an ITZ material type can be determined from a material number in matrix b using adjacent material number.
2.3 Material Parameter Selection and Loading Process
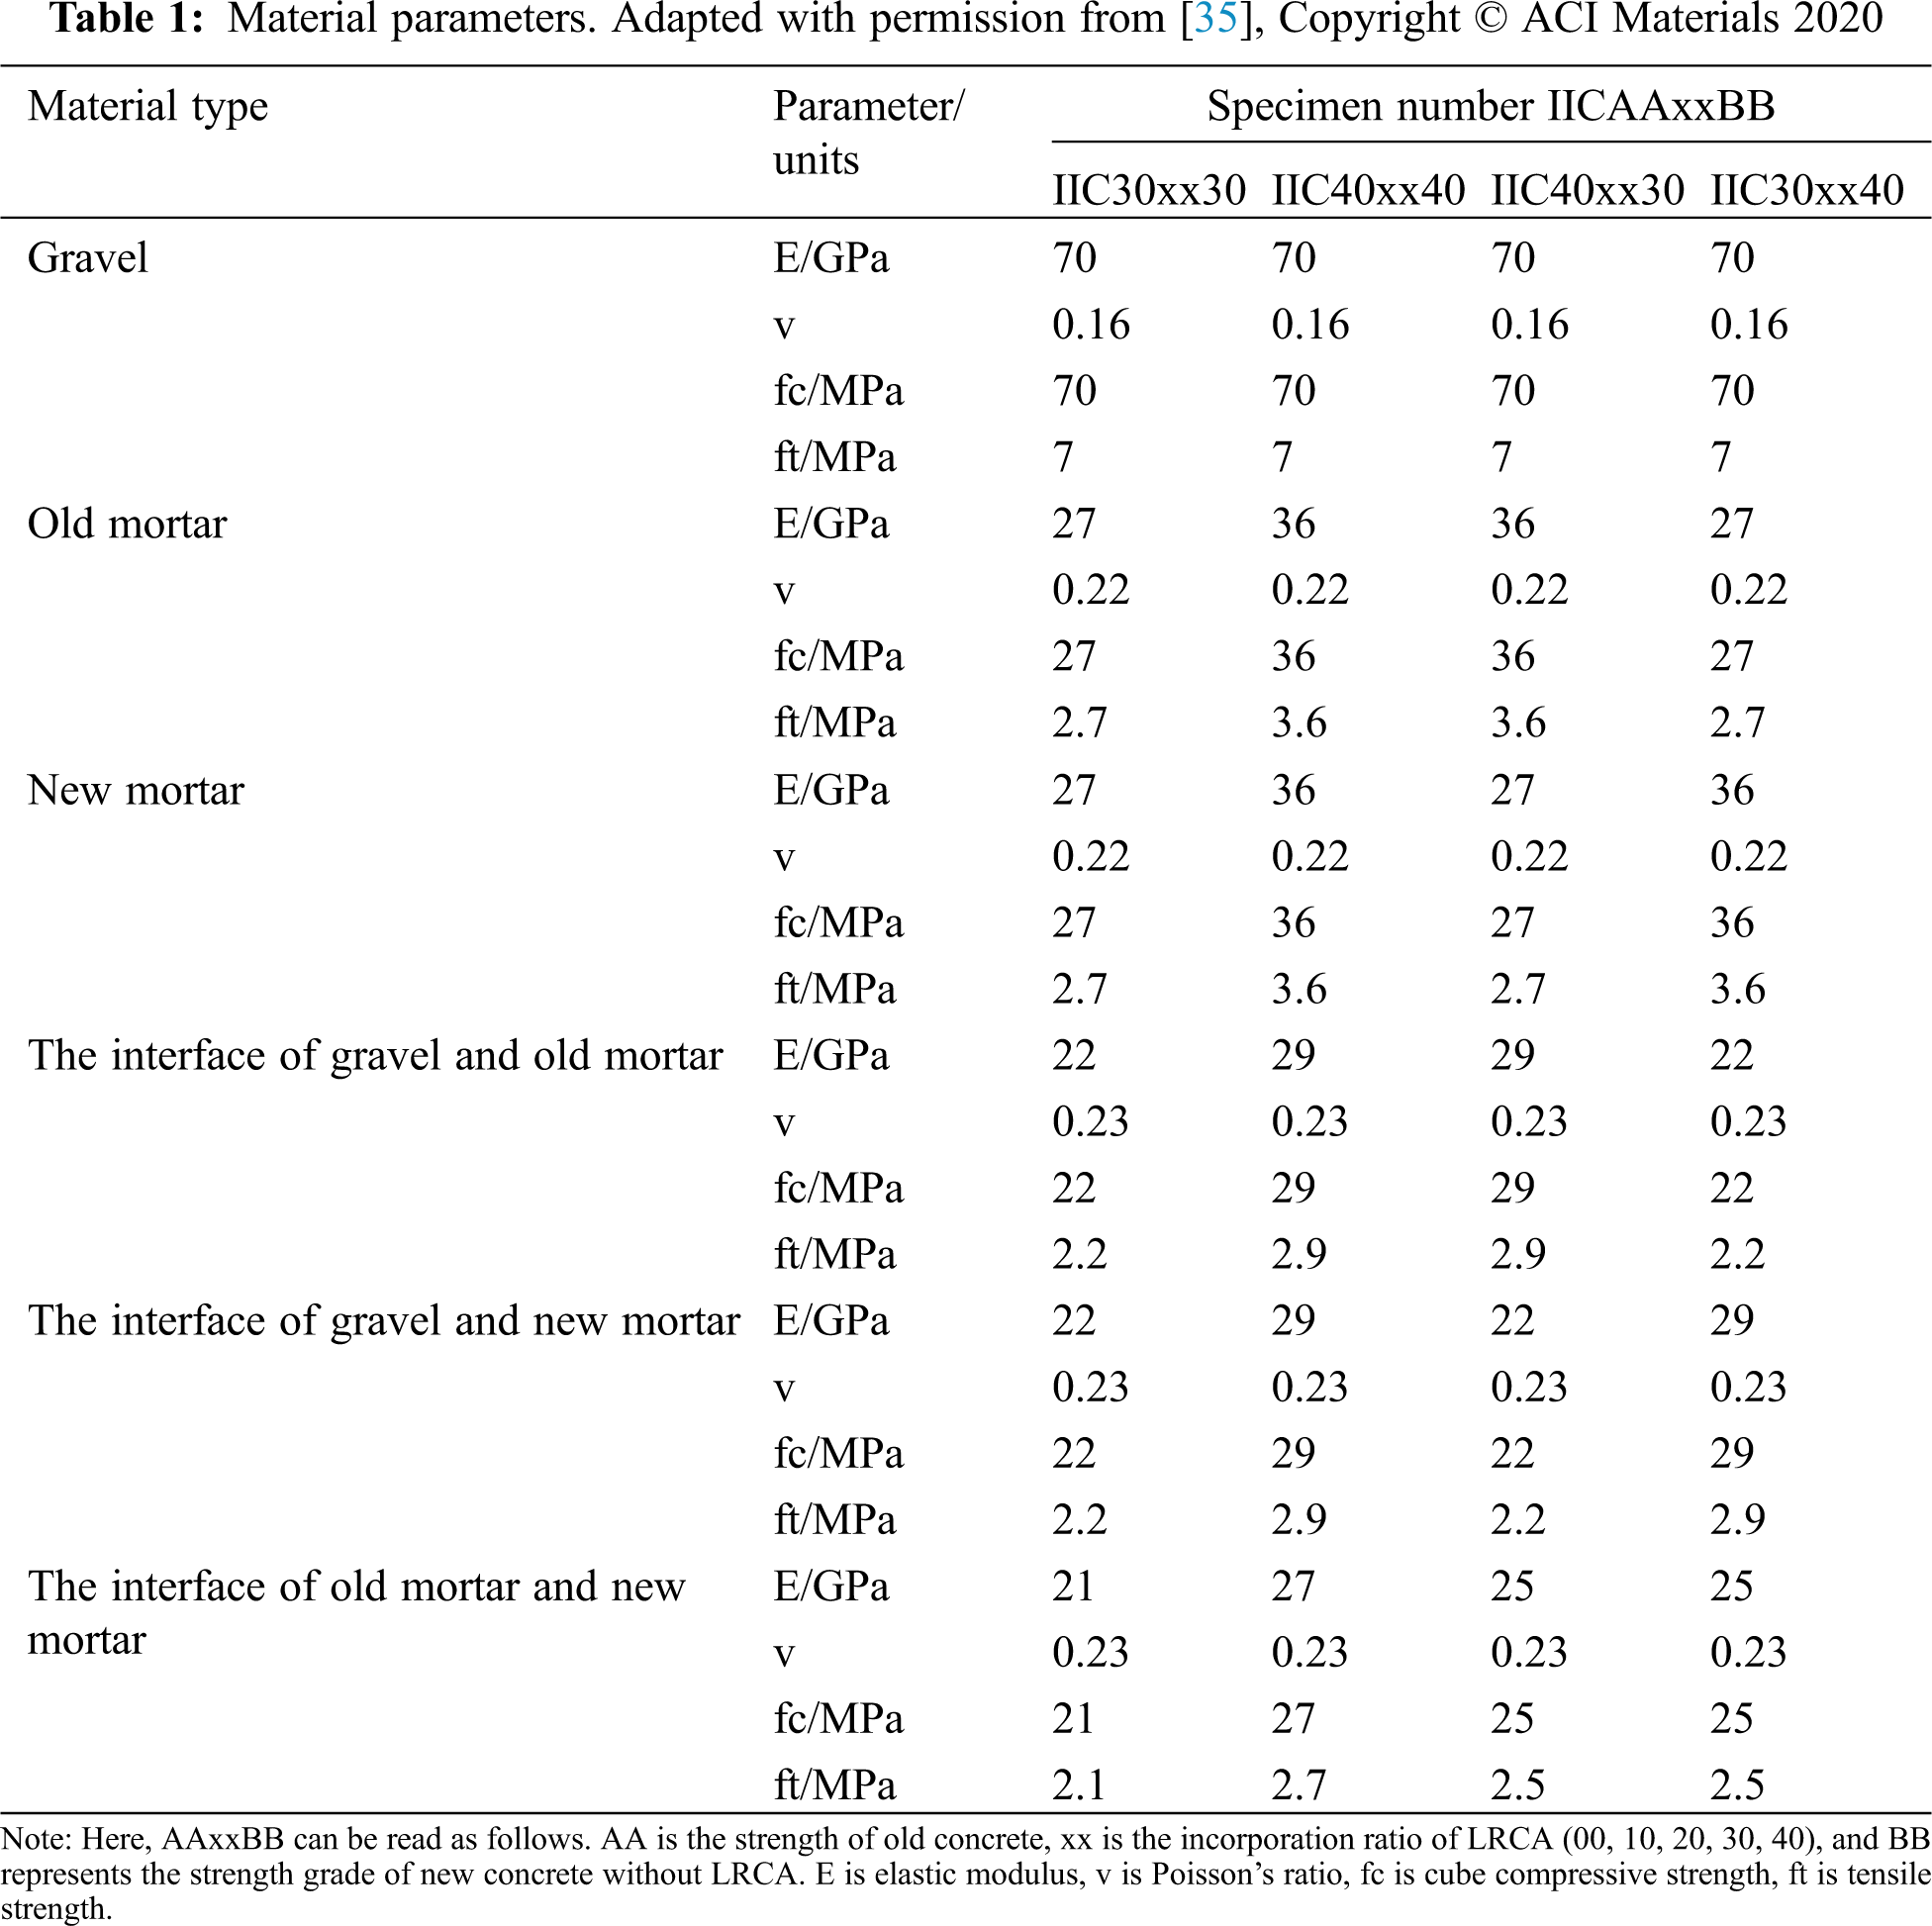
A commercial software ANSYS 15.0, was used for the simulation of the compression experiment. Cube and prism compression model’s specimen are of size 300 × 300 × 3 mm and 300 × 600 × 3 mm, respectively. The built-in element type, Solide65 [33], was used as the element of each phase material because it can simulate the unique mechanical properties of concrete materials such as cracking and crushing. A Willam-Warnke five-parameter criterion (W-W criterion) was then used to define material damage. The failure surface of the Willam-Warnke five-parameter criterion is a triaxially symmetric convex, smooth triangle on the π plane. This model can reflect the difference in concrete performance under low and high hydrostatic pressure. The multilinear isotropic model (MISO) was used to describe the nonlinear multi-axis constitutive characteristics of recycled concrete. The stress-strain curve used in this study follows the curve given in the Chinese code [34]. The strength and elastic modulus of the material in the test will be affected by the specimen size. Thus, the simulation of the compression test is done by adjusting the material properties. The aggregate and the mortar specimens’ parameters were matched to the experimental process by simulating the compression process of the material specimen and adjusting the values of the material parameters. The simulation results were consistent with the test results to obtain the modified material parameters to be used in the simulation. The material parameters of the ITZ bonding element between gravel and mortar were determined by simulating the concrete compression test after the material parameters of mortar and gravel are determined. Then after simulation of the compression test of recycled concrete, the material parameters of the ITZ bonding element between new and old mortar were determined. The final values of the material parameters calculated are presented in Tab. 1.
Aiming to determine the range of material parameters, some concrete mesoscale numerical simulation parameters [36,37] were collected and analyzed. The comparison of the collected parameters and calculated values of material properties (Tab. 1) are shown in Fig. 4. It can be observed from Fig. 4 that the parameters taken in this paper are in the range given by collected parameters and are reasonable.
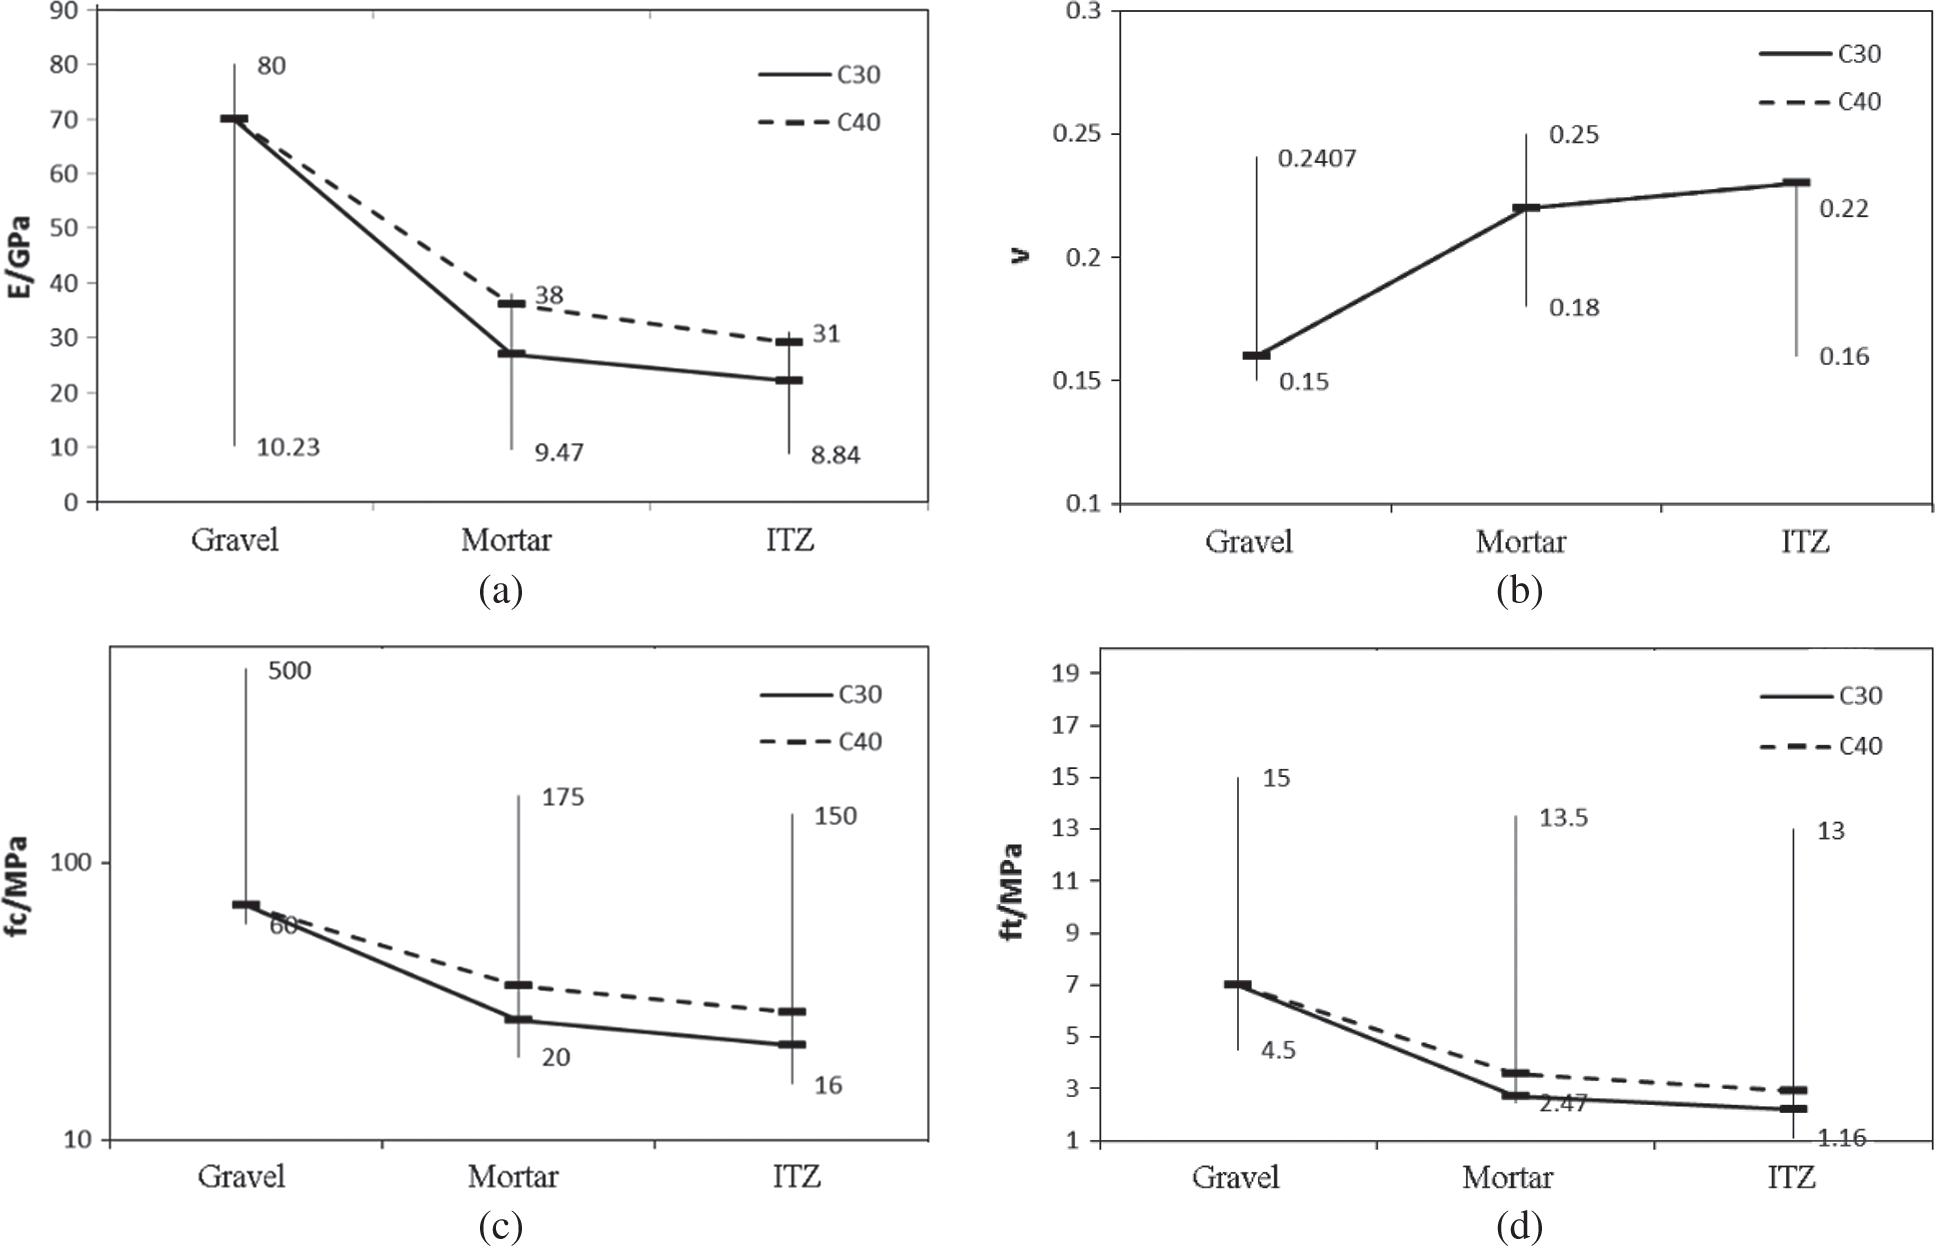
Figure 4: Range of model parameter values in literature (a) Elastic modulus (b) Poisson’s ratio (c) Cube compressive strength (d) Tensile strength
3 Simulation Results and Analysis
Some relative experiments were carried out with cube (300 × 300 × 300 mm) specimens to examine the simulation’s accuracy. The maximum size of LRCA used in the experiment is 80 mm. The gradation interval of recycled coarse aggregate is divided into 25–40 mm and 40–80 mm particle size segments. The mass ratio of the two-particle size segments is determined to be 50:50 using the Ping-Funk equation. Portland cement (Grade 42.5) was used in the experiment. The basalt gravel and river sand used in this study both had a fineness modulus of 2.7. Water used for mixing was potable. For improved workability, a superplasticizer was mixed with an 18.4% water-reducing ratio. To produce LRCA, the jaw crusher was used. C30 and C40 are used to produce the waste and new concrete. Five different incorporation ratios were used: 0%, 10%, 20%, 30%, and 40% of LRCA. The mixture proportions of RAC (utilizing C30 NAC and C40 NAC) are listed in Tabs. 2 and 3, respectively. 10,000 kN multifunctional structural test system was used for the cube compressive tests. The loading process programmed the constant loading rate. The concrete structures testing method (GB/T 50152–2012) [38] recommends C30 compressive strength prediction for concrete when the loading speed is 0.3–0.5 MPa/s. When the predicted compressive strength is C40, the loading rate was within 0.5 MPa/s to 0.8 MPa/s. Simulation results are shown in Fig. 5.
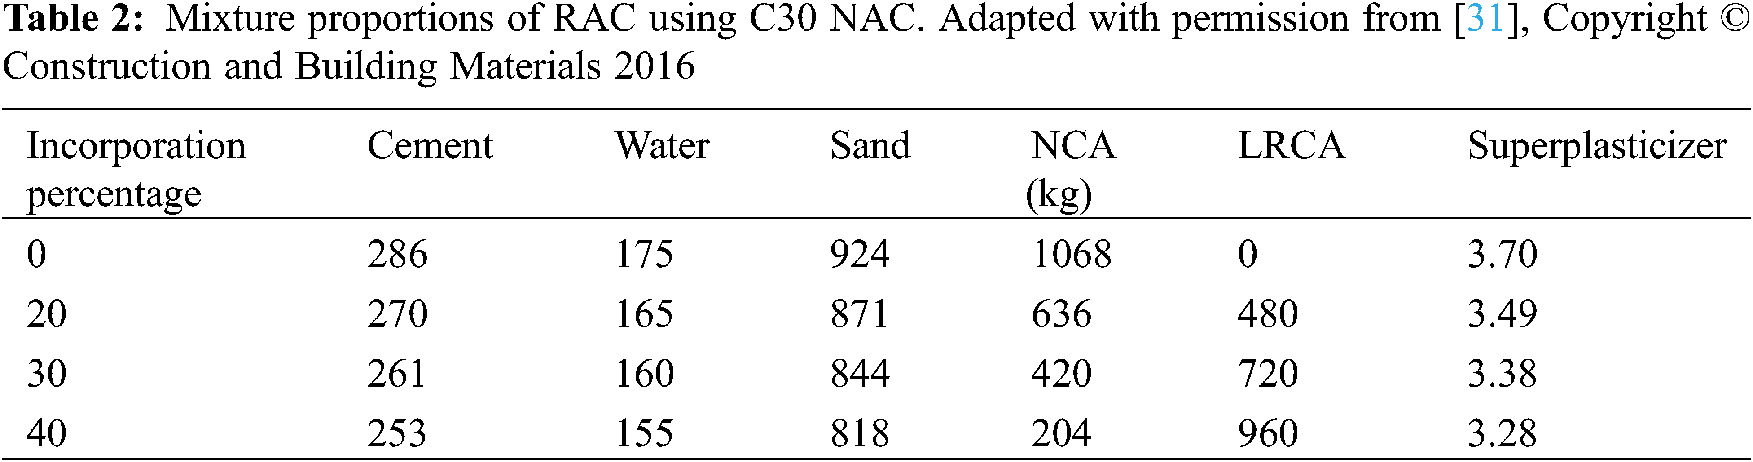
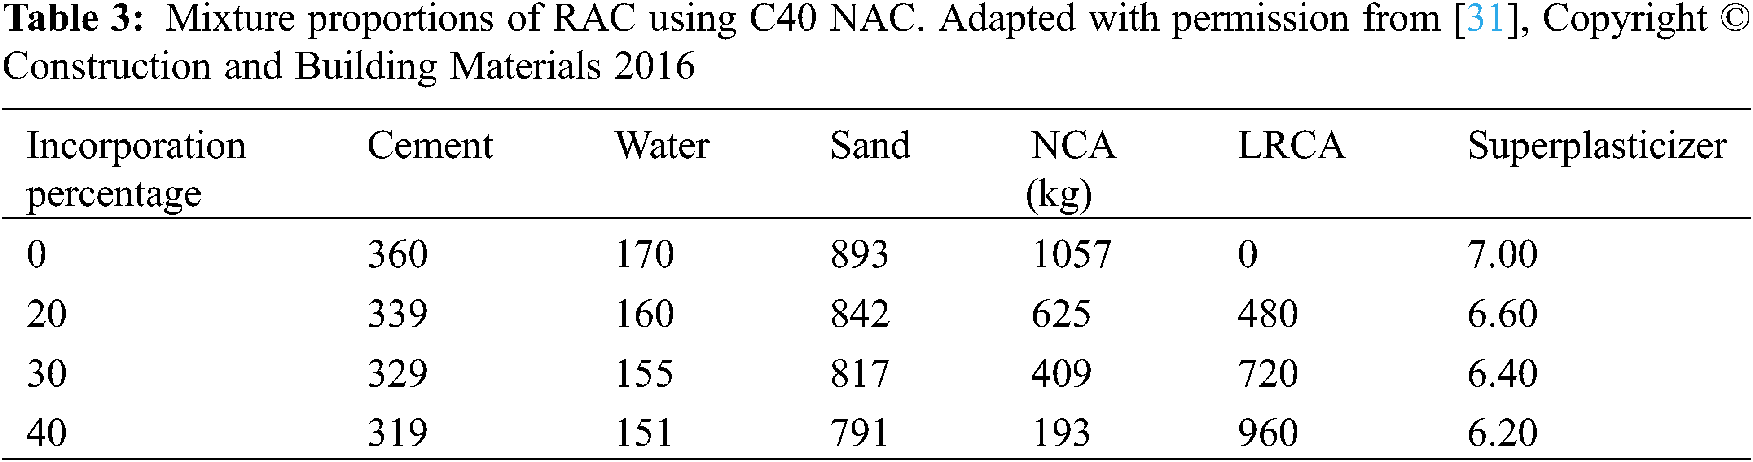
Figure 5: A simulation model
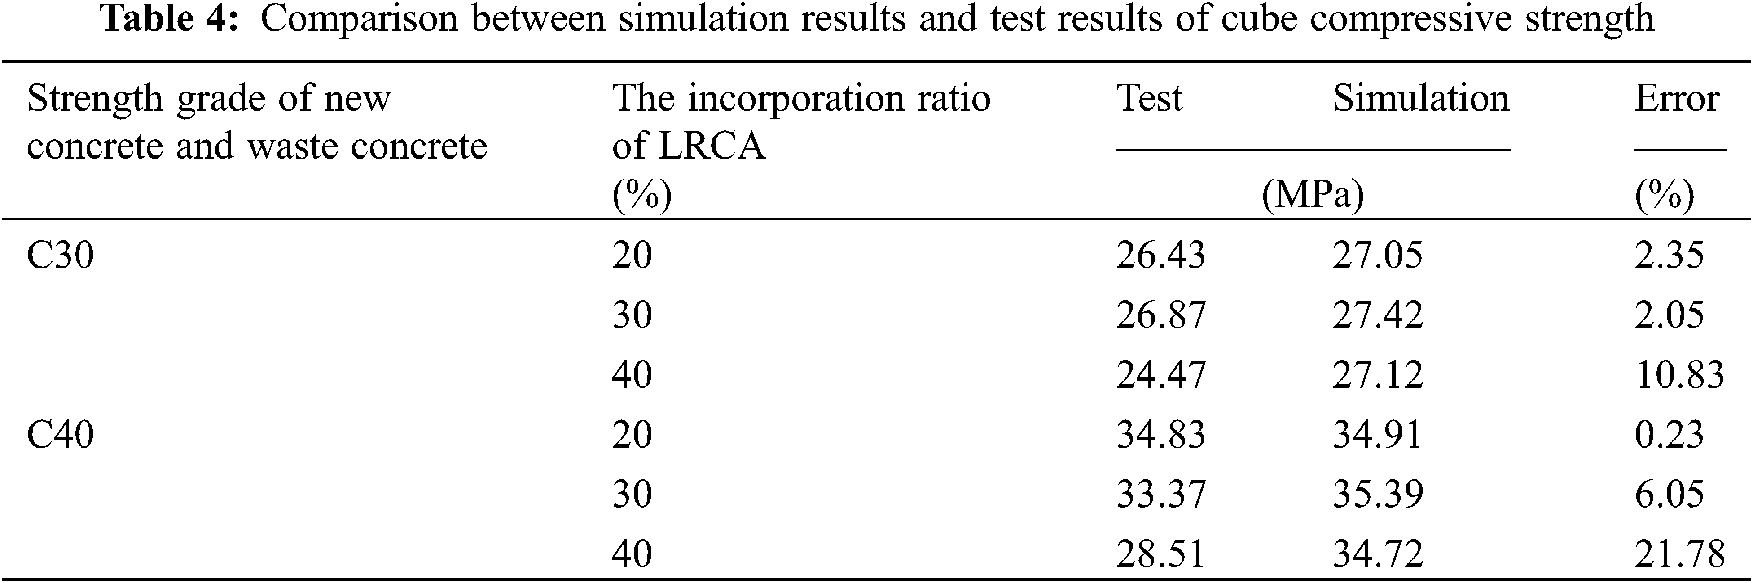
The cube compressive strength results obtained by simulation with the polygonal random aggregate model are listed in Tab. 4. It can be seen from Tab. 4 that the difference between most of the cube strength simulation results and the experimental results is within 10% of the error range except for a mix with 40% LRCA concrete of C30 and C40 each, which was 21.78% and 11.03%, respectively. As the incorporation ratio of LRAC is higher, the concrete with LRAC may have more defects, leading to a more significant reduction and dispersion in the mechanical properties of recycled concrete. Observation of the cracked surface of recycled concrete showed that when the incorporation ratio of LRCA is 40%, the failure plane is through the LRCA in the broken specimen. Therefore, using the damage cracks model in the finite element method will lead to more significant errors in dealing with the fracture of a large number of LRCA, leading to a higher error between test results and simulation is large.
3.2 Cube Cracking Characteristics under Compressive Load
Fig. 6 shows the failure patterns when the strength of old and new concrete is C30. The figure shows that when the incorporation of waste concrete is zero, the distribution zone of damaged elements is wide, and a sizeable cracking zone with wider cracks is found on lateral sides. Additional minor cracking patterns are found on the whole surface of the specimen. From Fig. 6b, when the incorporation ratio of recycled concrete is 10%, it can be seen that the crack elements are less than that of the control, especially at the top and bottom zones of the specimen, when the incorporation ratio of LRCA is raised to 20%, from Fig. 6c, the main crack formed as a line.
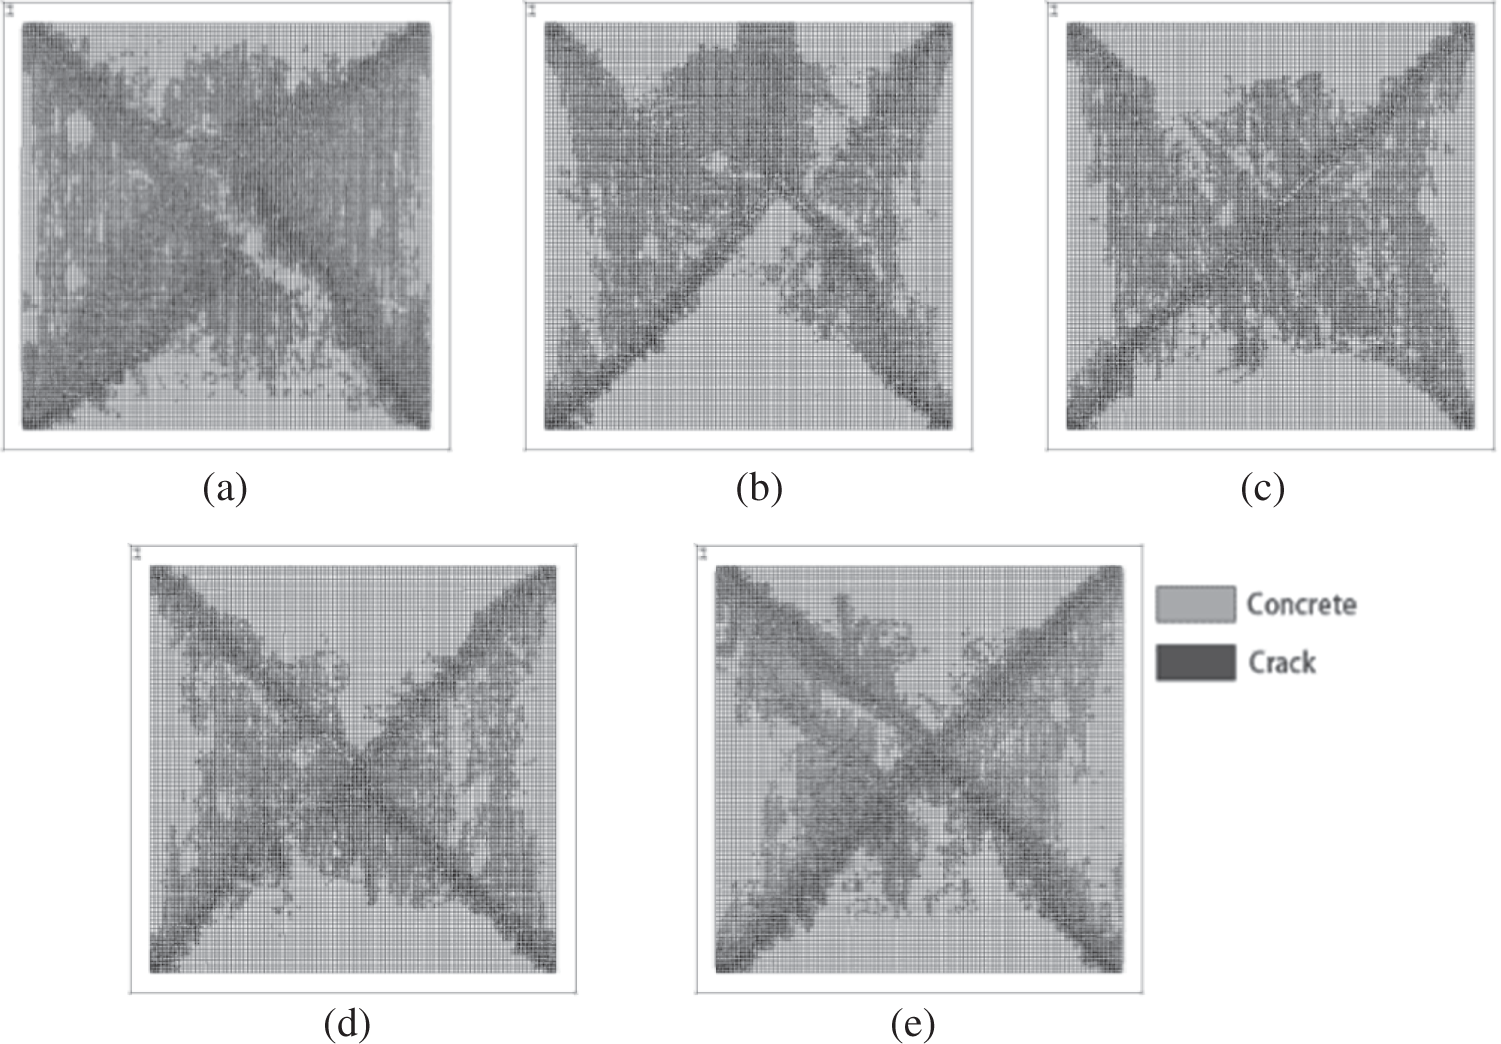
Figure 6: The influence of incorporation ratio on the compress strength of RAC (a) NC300030 (b) NC301030 (c) NC302030 (d) NC303030 (e) NC304030
When the incorporation ratio of waste concrete is raised to 30%, it can be observed from Fig. 6d that the change of cracking patterns is relatively small when the incorporation ratio of waste concrete reaches 40% (Fig. 6e) that the area of the cracking zone is reduced in a small fraction. When the strength of old concrete and new concrete is C30, the number of crack elements of LRCA is less than that of conventional concrete. This is because the aggregate strength of recycled concrete is lower than that of natural aggregates, and the macro cracks are more likely to penetrate. Thus, the ductility of recycled concrete is inferior to that of conventional concrete. However, around the incorporation ratio of 30% LRCA, the crack situations are similar to the conventional concrete. Therefore, the incorporation ratio of 30% is optimum and does not significantly reduce concrete strength.
When the strength grade of new and old concrete is C40, the cracking situation of the various concrete specimens with different incorporation rates under axial compression load is presented in Fig. 7. During the simulation, the cracks formed are irregular in Fig. 6, and the intersection of the two cracks is not in the center of the modeled specimen. This indicates that increasing the strength of the LRCA affects crack development.
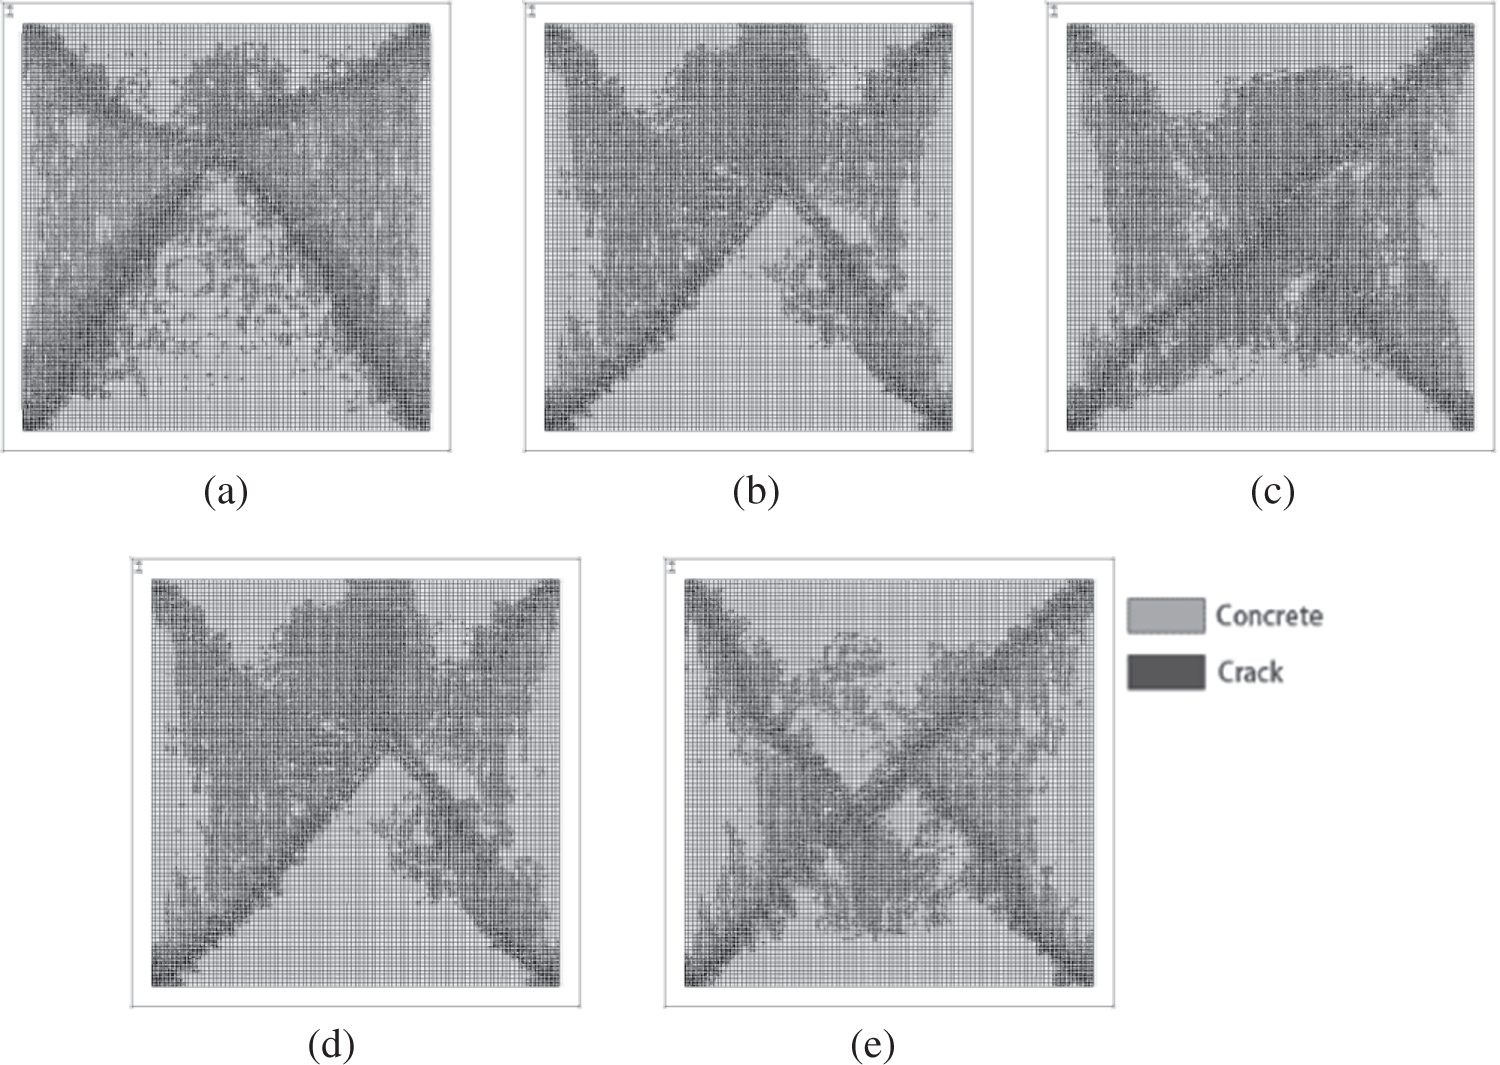
Figure 7: The influence of incorporation of LRCA when of new and old concrete is C30 (a) 0% incorporation (b) 10% incorporation (c) 20% incorporation (d) 30% incorporation (e) 40% incorporation
3.3 The Failure Characteristics Model of the Prism Specimen
The analysis is performed using a recycled concrete model with a 30% incorporation ratio of LRCA, and the new and old concrete grade assumed in this model is C30. The shape of the aggregate is assumed as a polygon. Some strain monitoring points were placed on the prism specimen to monitor the prism’s longitudinal and transverse strains under axial pressure to determine its corresponding Poisson ratio and bulk strain. A total of 4 strain monitoring points was placed on the prism specimen. Points A and B were used to measure transverse strain, Points C and D were used to measure the longitudinal strain, as shown in Fig. 8. The distance between Points A and B and the distance between points C and D is 300 mm.
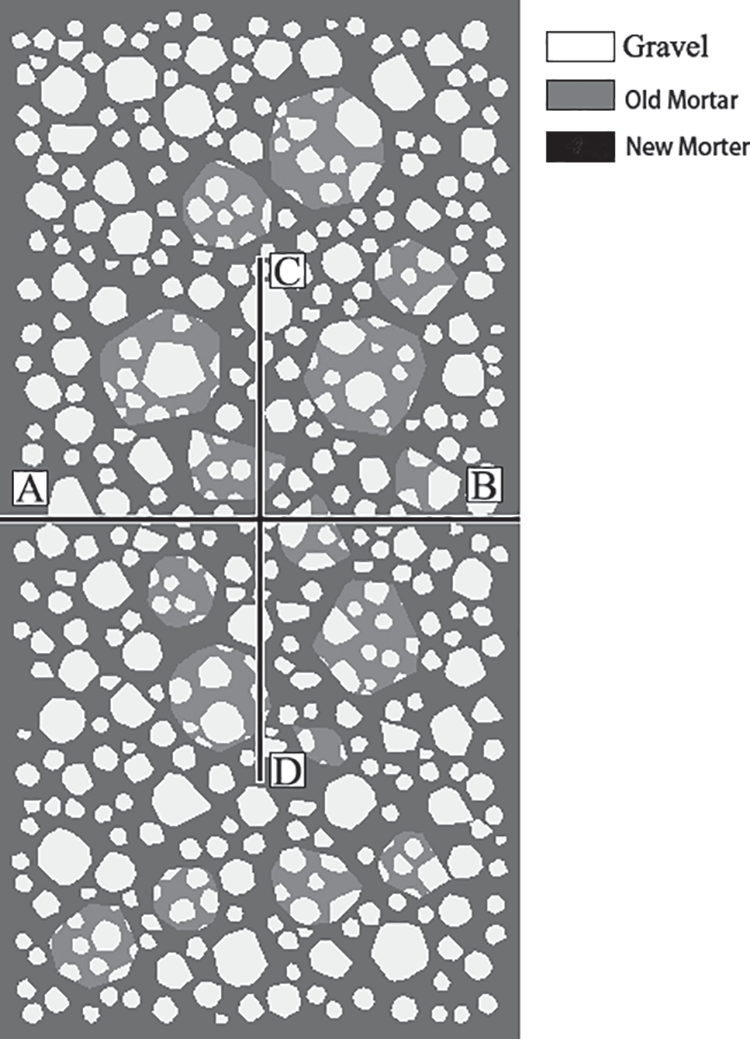
Figure 8: Strain monitoring position
The stress-strain curve obtained from the simulation is shown in Fig. 9, in which the stress and strain were normalized by peak stress and the corresponding strain. It can be seen from Fig. 8 that the ductility of recycled concrete is not bad. Poisson’s ratios and volumetric strains obtained by simulation are shown in Figs. 10 and 11. The Poisson’s ratio of the model has a relatively gentle and rapid growth stage. It can be seen from Fig. 11 that the axial strain of dilatancy of recycled concrete is smaller than that of conventional concrete.
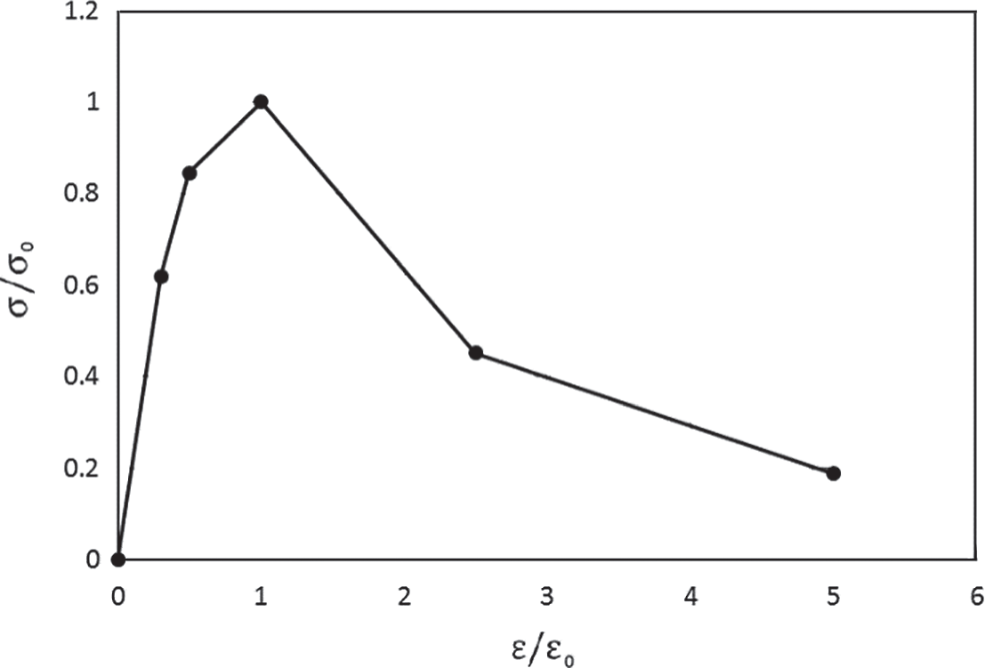
Figure 9: Normalized stress-strain curve
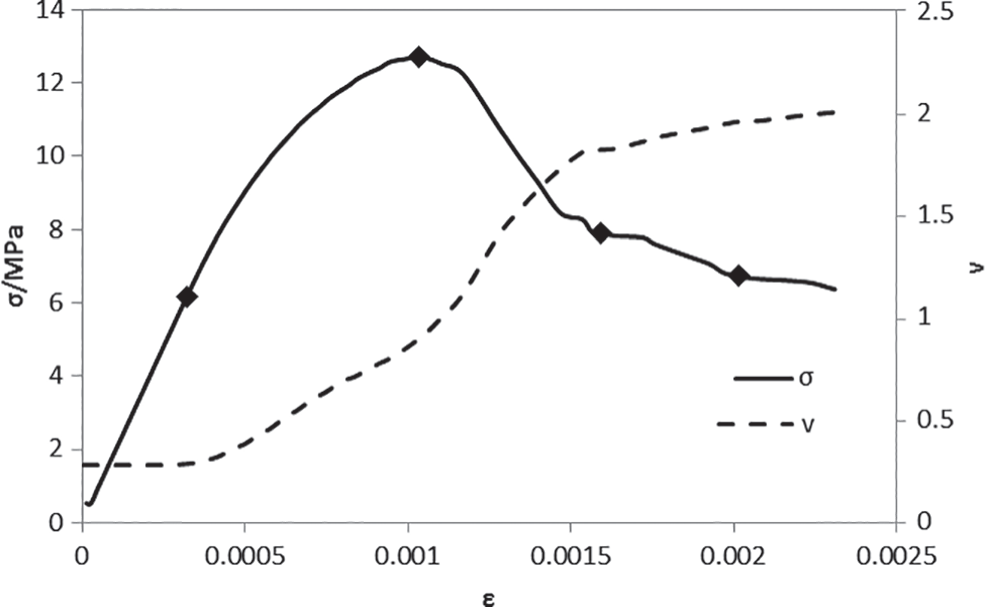
Figure 10: Poisson’s ratio varies with longitudinal strain
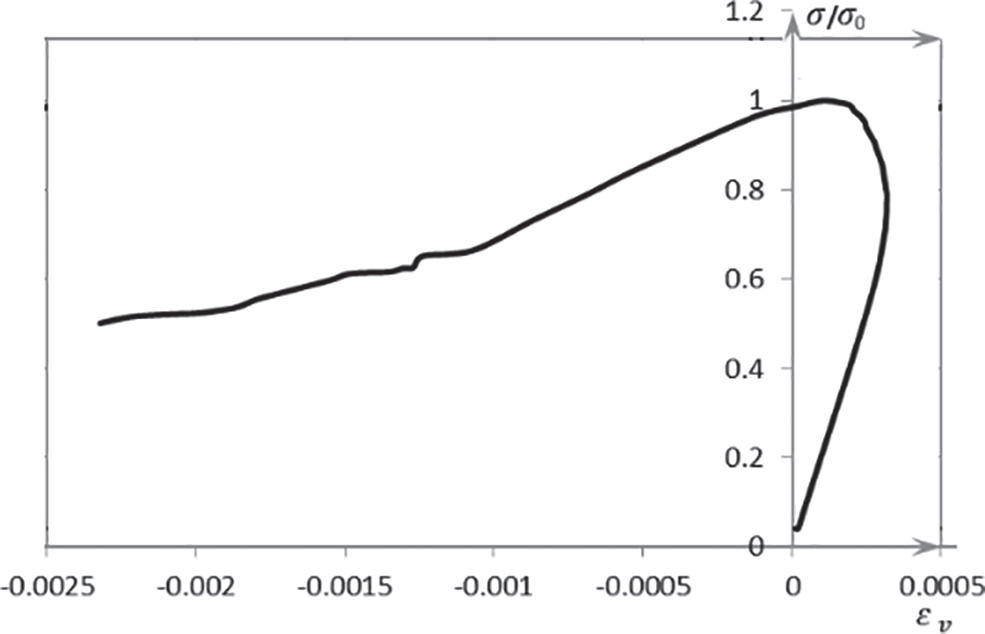
Figure 11: The strength varies with volume strain
The variation of the Poisson’s ratio with stress and strain of the prism concrete is shown in Fig. 10. Demarcation point in graph (ε = 0.0003, ε = 0.0010 and ε = 0.0016) corresponds to stages of crack development in modeled concrete. The relationship between the volume strain and the strength of the prism is shown in Fig. 11, where the positive value of abscissa (εv) represents the compressive deformation. It can be seen from Fig. 11 that when the volume strain of the prism is maximum, the corresponding stress is 78.7% of its maximum stress, which is the smaller value in the range of conventional concrete 75–90%. Because recycled concrete contains a variety of LRCA with defects and weak ITZ, micro-cracks are easier to grow under the same stress, so the stress of recycled concrete is slightly less than the concrete with natural aggregates.
When the replacement ratio of LRCA is 30%, the cracking pattern of the prismatic specimen under axial compression is shown in Fig. 12. In Fig. 12, the dark area indicates that the cracking has already occurred. It can be seen from the figure that when the ε = 0.0003, the early cracks occurred at two places: (1) the bonding zones between gravel and mortar, (2) the bonding zones between new mortar and old mortar. With the increase in the compressive load, when ε = 0.0010, the stress in the modeled concrete reaches the maximum value, and the position of the cracking element increases from the center toward the periphery of the specimen, and the cracks extending from bonding zones to adjacent mortar elements, i.e., new mortar and old mortar. The number of cracks in gravels is relatively low. With the increase in compressive load, cracks pass through the gravels located within two diagonal macroscopic cracks. The gravel is less defective, high in strength, and cracks later, so gravel cracking almost corresponds to macroscopic cracks.

Figure 12: Simulated cracking pattern of prism specimen under compressive load (a) ε = 0.0003 (b) ε = 0.0010 (c) ε = 0.0016 (d) ε = 0.0020
Through programming, the status of each element in the calculation process is read, and statistics obtain the number of cracked elements. The natural aggregate is gravel, which exists in the model, including the new concrete and LRCA. Fig. 13 shows that the percentage of cracked elements increased with loading process/strain in the specimen where old ITZ 1 is the ITZ element between gravel and new mortar, Old ITZ 2 is the ITZ between gravel and old mortar, New ITZ is the ITZ between new mortar and old mortar. It can be seen from Fig. 13 that at the beginning of loading, compared with new ITZ, the number of cracked old ITZ elements is relatively more. Before reaching the peak stress, as the compressive load increases, the percentage of cracked elements increases significantly. After the compressive load’s ultimate stress, the increase in the cracking ratio is reduced. After the stress-strain curve’s inflection point, the increment in the cracked element of each kind of cracked element becomes less. The element cracking situation of each phase material shows that, during failure, the crack extends along with the bonding elements, extends to the mortar matrix, and finally to LRCA. When ε = 0.0020, Old ITZ2 bonding elements cracked 63%, old mortar elements cracked 62%, old ITZ1 bonding elements cracked 57%, aggregate elements cracked 54%, new ITZ bonding elements cracked 48%, and new mortar cracked 46%. The cracking ratio of bonding elements in the LRCA and old mortar is the highest, indicating that the recycled concrete’s failure pattern is due to the fracture of LRCA. Compared with Fig. 12, the element cracking situation of each phase material in Fig. 13 shows that, at the early stage of loading, when the strain is about 0.0007, the crack of the bond zone elements develops faster; after that, the increase of the crack of the bond zone elements slows down, and the crack of mortar element continued to increase. At this time, the cracks extended into the nearby mortar. Finally, at about 0.0017, the increase of cracked elements all become slowly. It is the macroscopic crack formation process, and the cracks are concentrated near the macroscopic cracks.
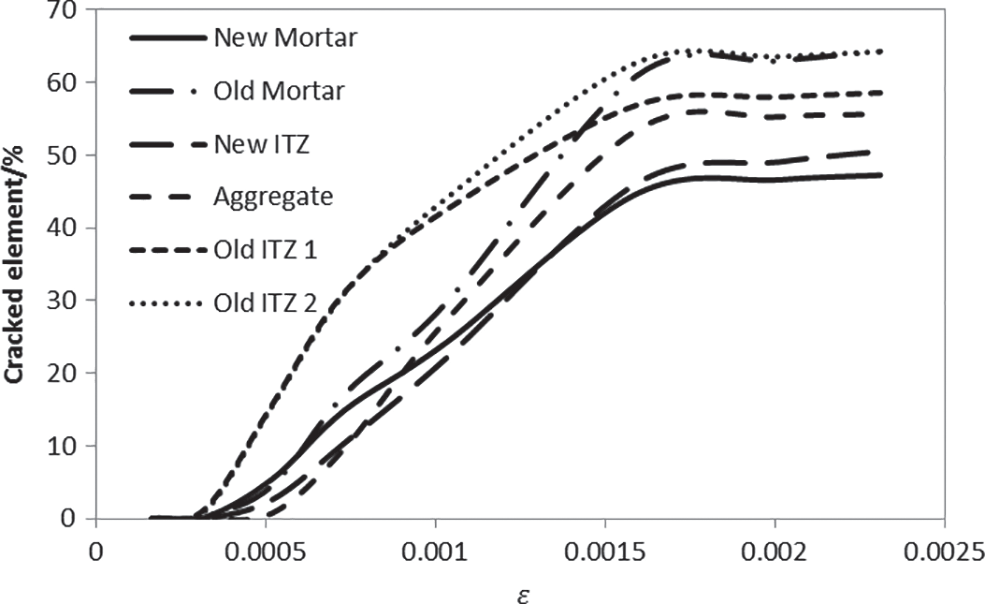
Figure 13: The percentage of cracked elements under different strain
The failure pattern of the prismatic specimen obtained by the axial compression test is shown in Fig. 14. In the figure, the dark area indicates that the cracking has occurred. The number “NBAAxxBB” represents the random aggregate model, where NB is the model type, AA is the strength of old concrete, xx is the percentage incorporation, and BB is the strength of new concrete. It can be seen from Fig. 14 that the incorporation of LRCA has little effect on the extension direction of the main crack. Moreover, the aggregate interlock between the new mortar and old mortar exists a relatively better force transfer, reducing the probability of ITZ cracking. Thus, the influence of the incorporation of LRCA on the cracking of prism specimens is relatively small. From Fig. 14, no obvious macroscopic cracks were observed in a broken specimen, such as NB301030, NB303040, NB404030. This indicates the brittleness of the model generated with different LRCA incorporations. These results show that the concrete with LRCA has good mechanical properties. The cracks of recycled concrete initiate in the ITZs and then develop into the nearby mortar. Concrete with larger size aggregates results in more tortuous crack patterns, therefore prevent the crack extension. From Fig. 14, it can be seen that relatively wide prominent cracks exist in many specimens. The reason can be attributed to the distribution of the LRCA deciding the direction of ITZ between new mortar and old mortar, different from the main crack’s direction. This prevents crack development and lets the crack extend need accumulates much energy, and the crack extends through the specimen with a relatively wide crack width. It can be seen from Fig. 14 that NB404030 showed a minimal number of cracks because of the higher strength of LRCA than new concrete.
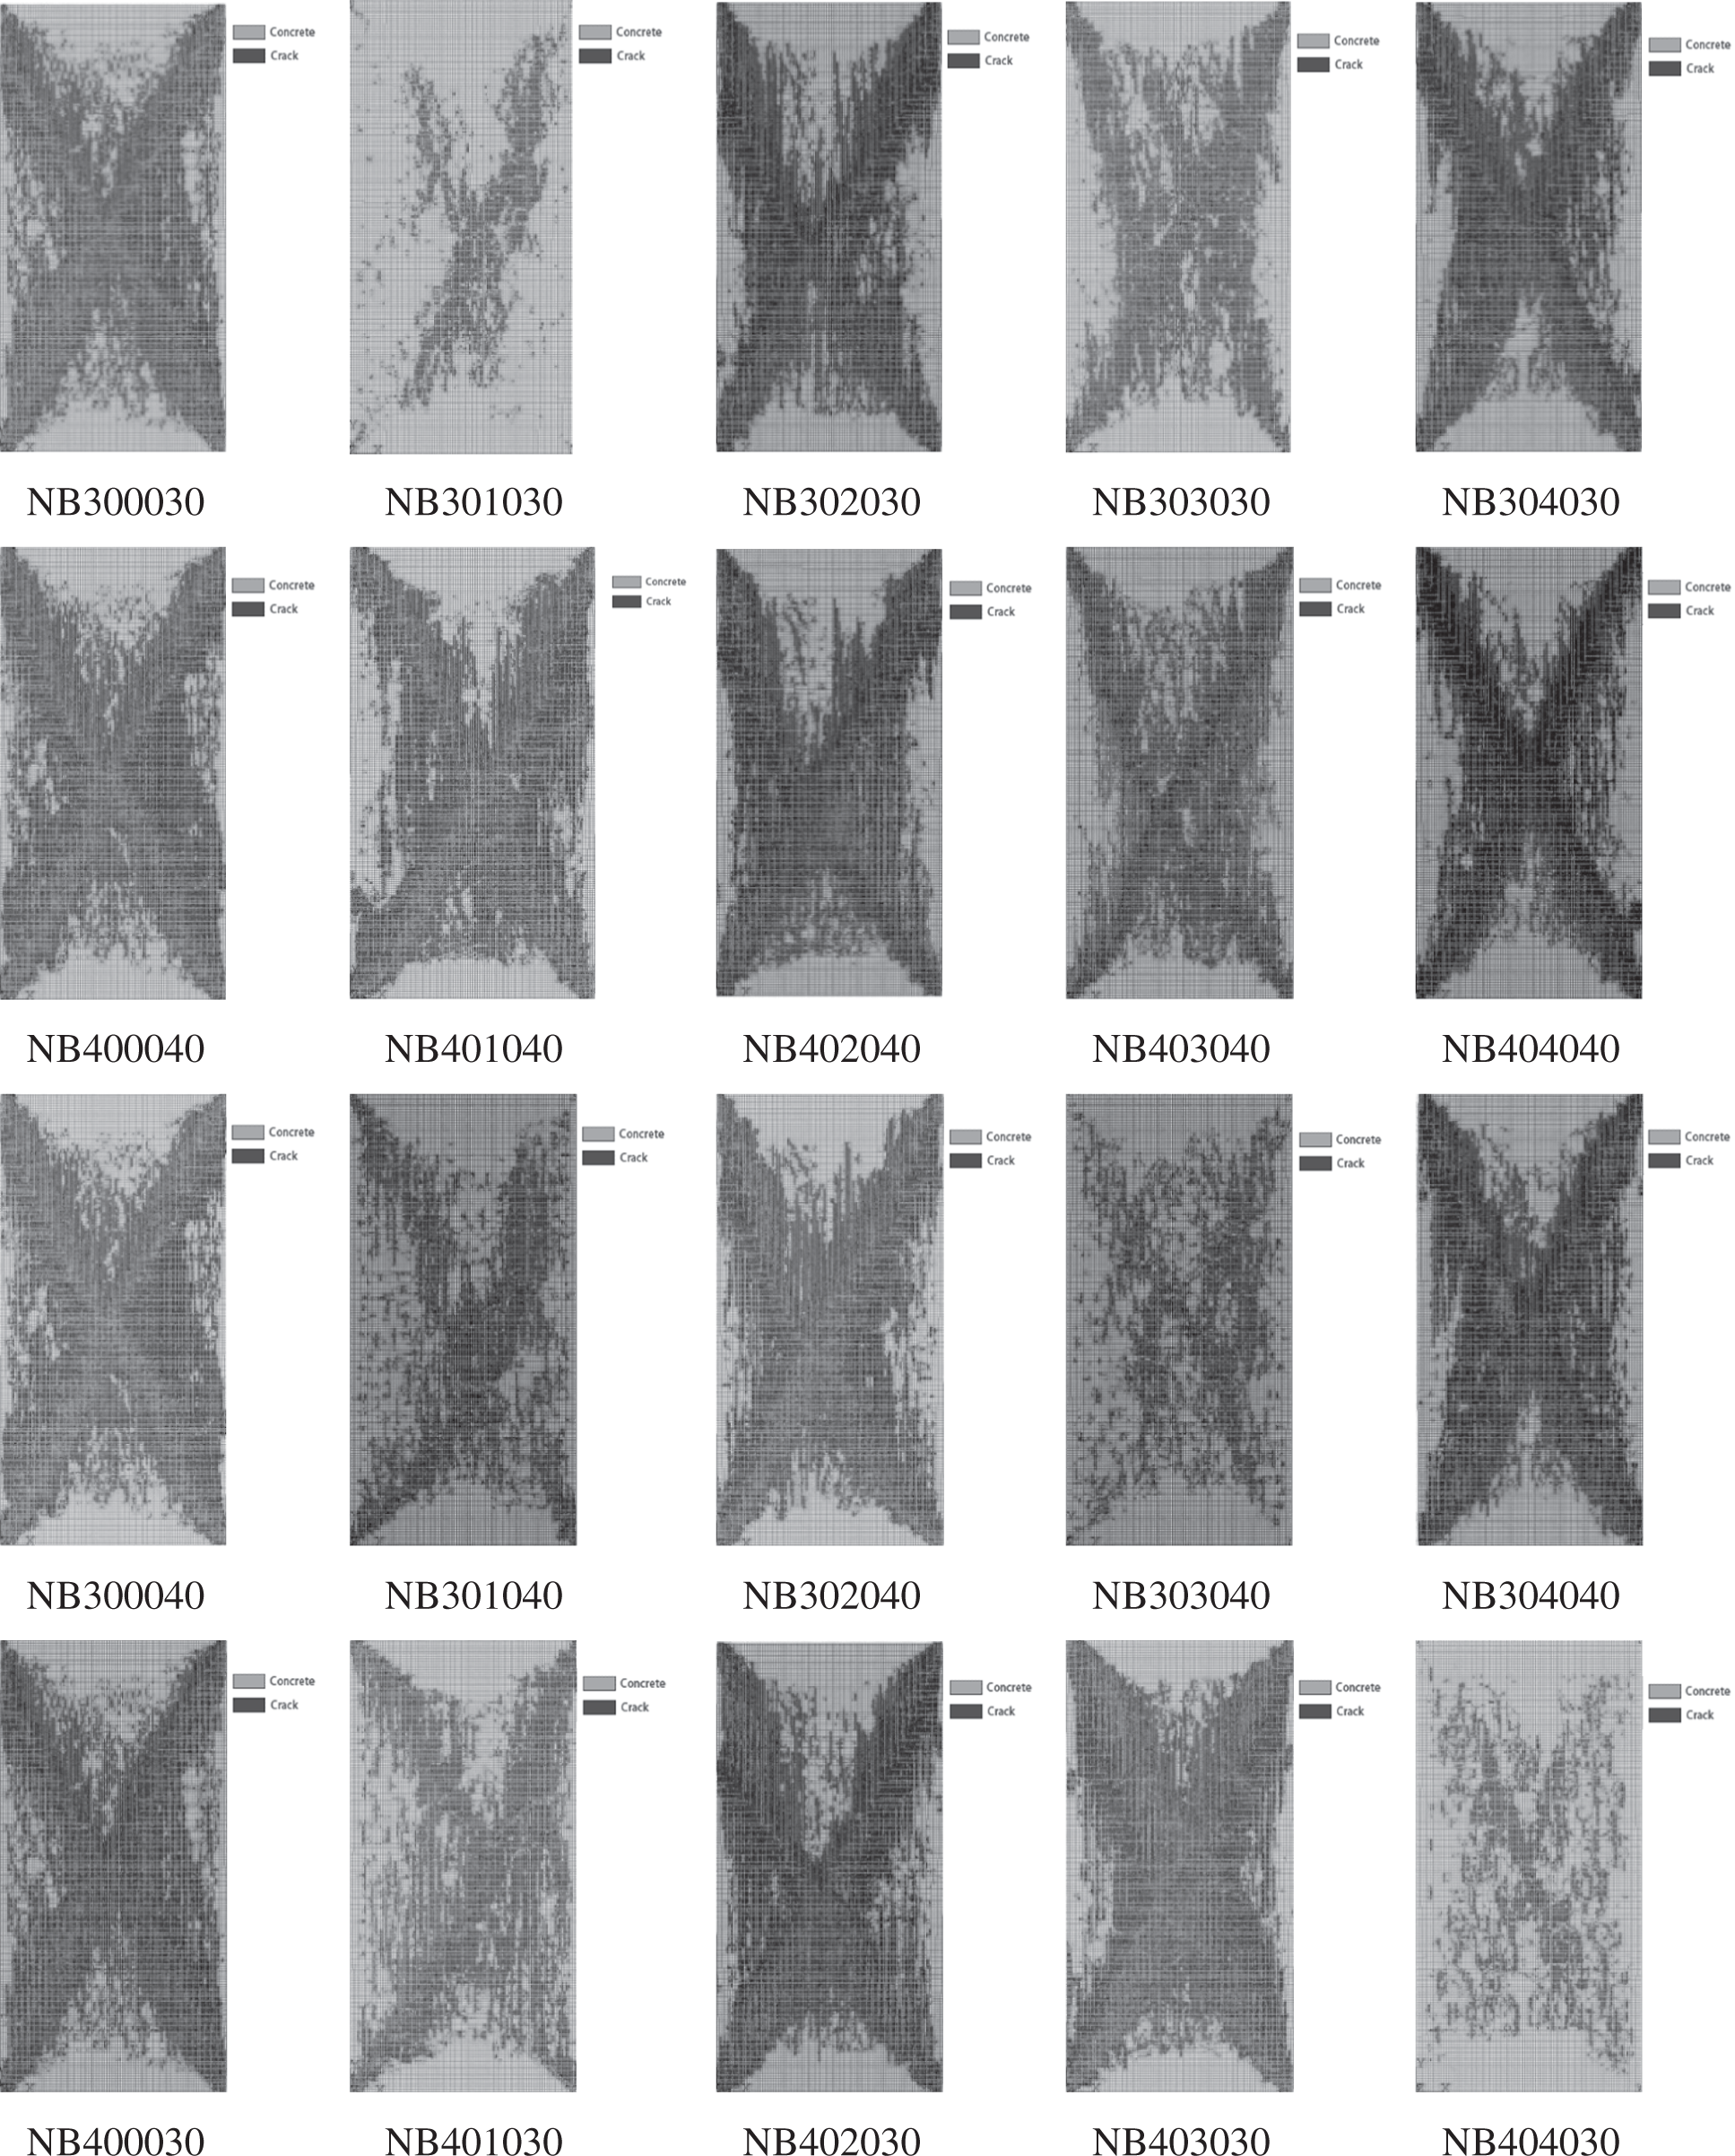
Figure 14: The failure modes of concrete with different strength new and old concrete combination
4 Variable-Parameters Analysis
4.1 Strength Characteristics When the Defect Content Changes
Many micro-cracks appeared during the crushing process of waste concrete. To consider the influence of these micro-cracks in the simulation, some defective elements were created in LRCA. The model with defects generated by the above steps is shown in Fig. 15. Different gray levels in Fig. 15 indicate different material parameter values. The first step of creating a defective element is selecting an element and assigning the defective element’s material properties. Then, randomly select a certain number of elements, the creation method of the defective element is as follows:
1. Using element information in software ANSYS, the output element model command was used for the node files.
2. Using MATLAB, nodes and elements from ANSYS were used to obtain the material parameters and the numbers of mortar and gravel.
3. According to the defective element percentage, the numbers of defective mortar and defective gravel were calculated, then distributing randomly into the concrete specimen model and generating new elements file of ANSYS.
4. The modified element file is used in ANSYS to change the element material parameters to the damaged value.
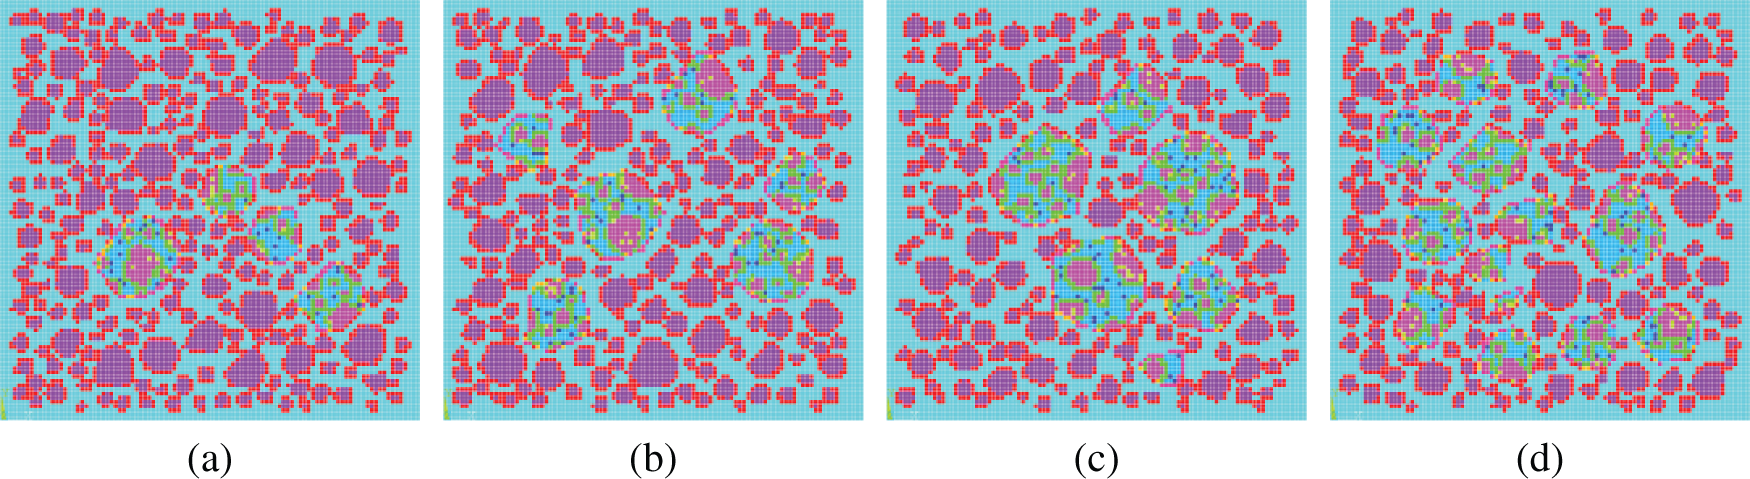
Figure 15: The damage model of the cube specimen (a) 10% of LRCA (b) 20% of LRCA (c) 30% of LRCA (d) 40% of LRAC
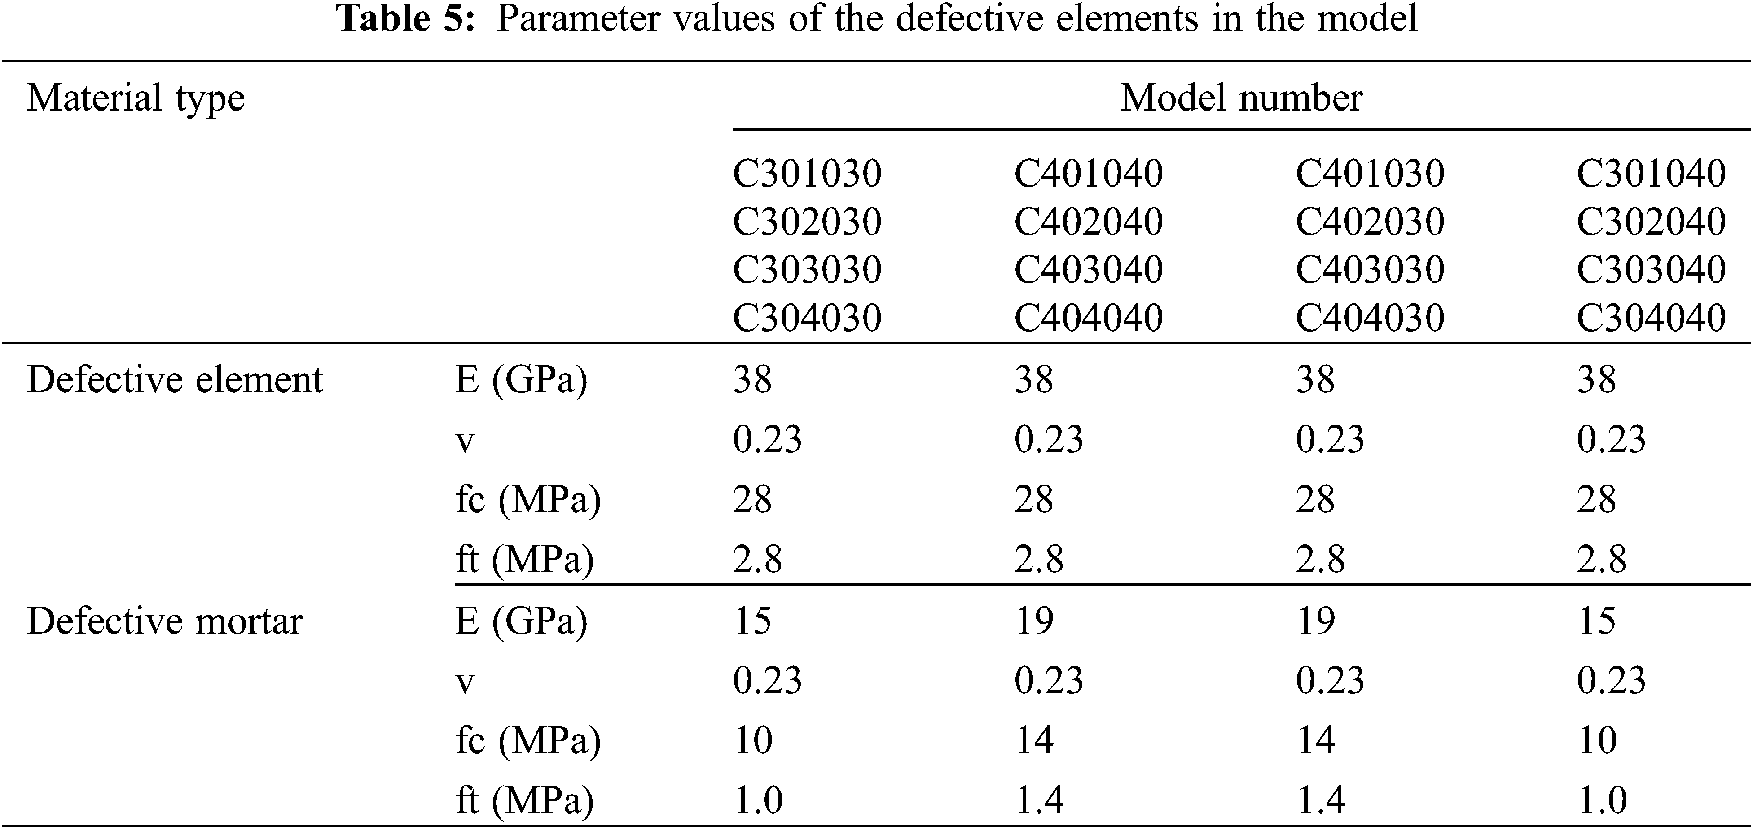
The multi-layer perception of SPSS statistical analysis software was used to build the neural network prediction model, and the importance of each factor is analyzed. Tab. 5 shows the parameter values of the defective elements in the model.
The calculated importance of strength sorted by the importance from largest to smallest is the strength of new concrete, the strength of old concrete, the defective element content, and the incorporation ratio of LRCA. Thus, the importance of every factor is 50.9, 20.4, 20.0, and 8.6, respectively.
4.2 Strength Characteristics When the Strength of New and Old Concrete Changes
In the numerical simulation, new and old concrete’s strength value is expanded to take C20, C30, C40, and C50, respectively. On the cube compressive strength, the calculated importance of strength sorted by the importance from largest to smallest is the strength of new concrete, the incorporation ratio of LRCA, and old concrete strength. The importance of every factor is 69.3, 17.4, and 17.4, respectively.
4.3 Strength Characteristics When LRAC Size Changes
Two types of maximum LRCA diameters, 50 mm and 63 mm, are used in the model to study the strength characteristics at different LRCA sizes. The influence of the calculated factors of the strength sorted by the importance from largest to smallest is the strength of new concrete, the strength of waste concrete, the incorporation ratio of old concrete, and the size of LRCA. The importance of every factor is 70.5, 15.5, 13.5 and 0.6, respectively.
4.4 Strength Characteristics When LRCA Shape Changes
Circular LRCA was used in the model and calculate the strength of recycled concrete, then compare it with the strength of recycled concrete with polygonal aggregate. The calculated importance of the strength sorted by the importance from largest to smallest is the strength of new concrete, the strength of old concrete, the shape of old concrete, and the incorporation ratio of LRCA. The importance of every factor is 54.9, 26.3, 11.0 and 7.8, respectively. When the aggregate shape of LRCA is circular, the incorporation ratio of LRAC is greater than that of old concrete strength. However, the effect will be the opposite when the shape of aggregate is a polygon. This is because when the recycled aggregate is polygonal in shape, it is easier to combine with the surrounding mortar. Under the relatively large incorporation ratio of LRCA, the reduction of concrete is not apparent. When the LRCA is round, the combination of recycled aggregate and surrounding mortar is weak, when the incorporation ratio of recycled aggregate increases, the strength of recycled concrete will decrease significantly.
Paired sample t-test was used to analyze the strength sample of recycled concrete with polygonal LRCA and round aggregate. When test level α is 0.05, the significance (on both sides) is 0.40. Since Significance is greater than 0.05, there is no significant difference between the two data sets.
4.5 Effect of All Factors on Strength
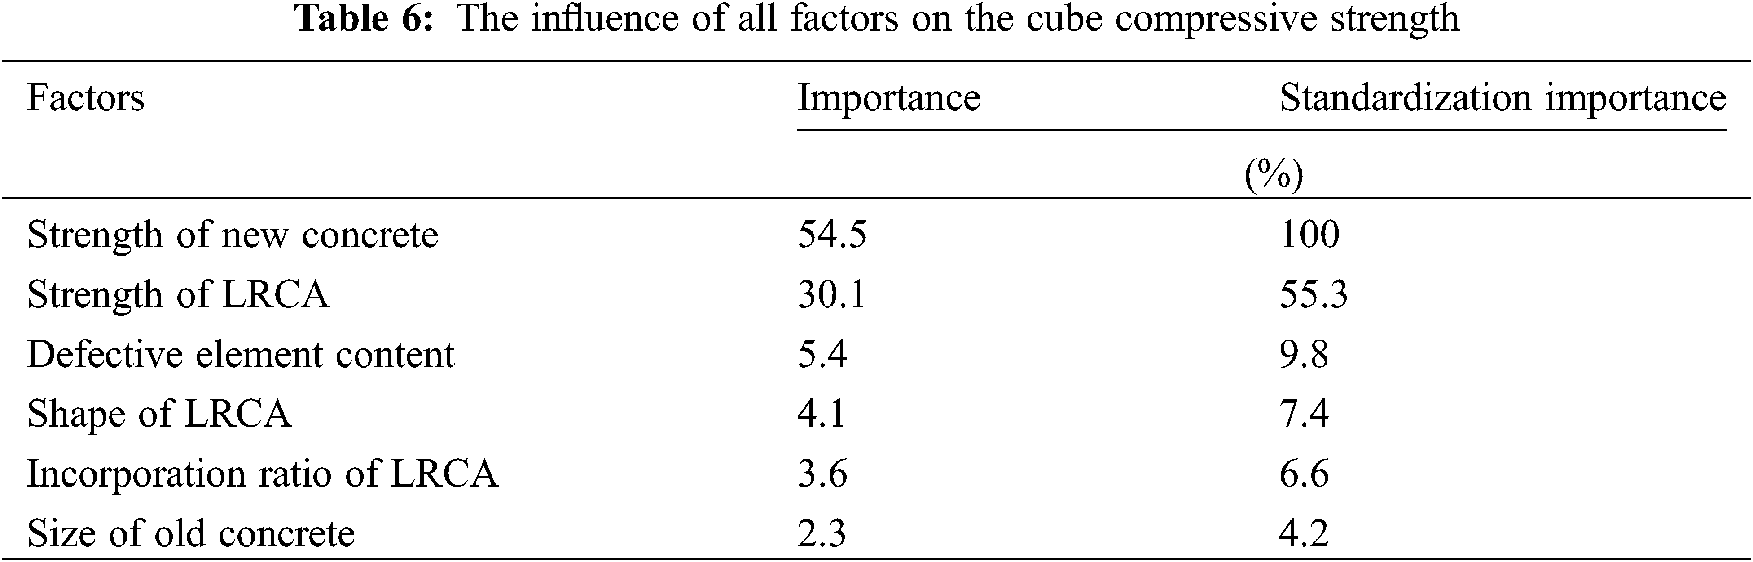
Tab. 6 shows the influence of all factors on the cube compressive strength. From the table, we can see that the impact of various factors on the cube compressive strength of recycled concrete sorted from largest to smallest and are: the strength of new concrete, the strength of old concrete, the defective element content, the shape of LRCA, the incorporation ratio of LRCA and the size of old concrete.
Tab. 7 shows the influence of all factors on the compressive strength of LRAC. From Tab. 7, we can see that the impact of various factors on the prism compressive strength of recycled concrete sorted from largest to smallest are the strength of new concrete, the strength of old concrete, the defective element content, the shape of LRCA, the incorporation ratio of LRCA and the size of LRCA. Thus, the sequence of influencing factors is the same as that of cube compression strength.
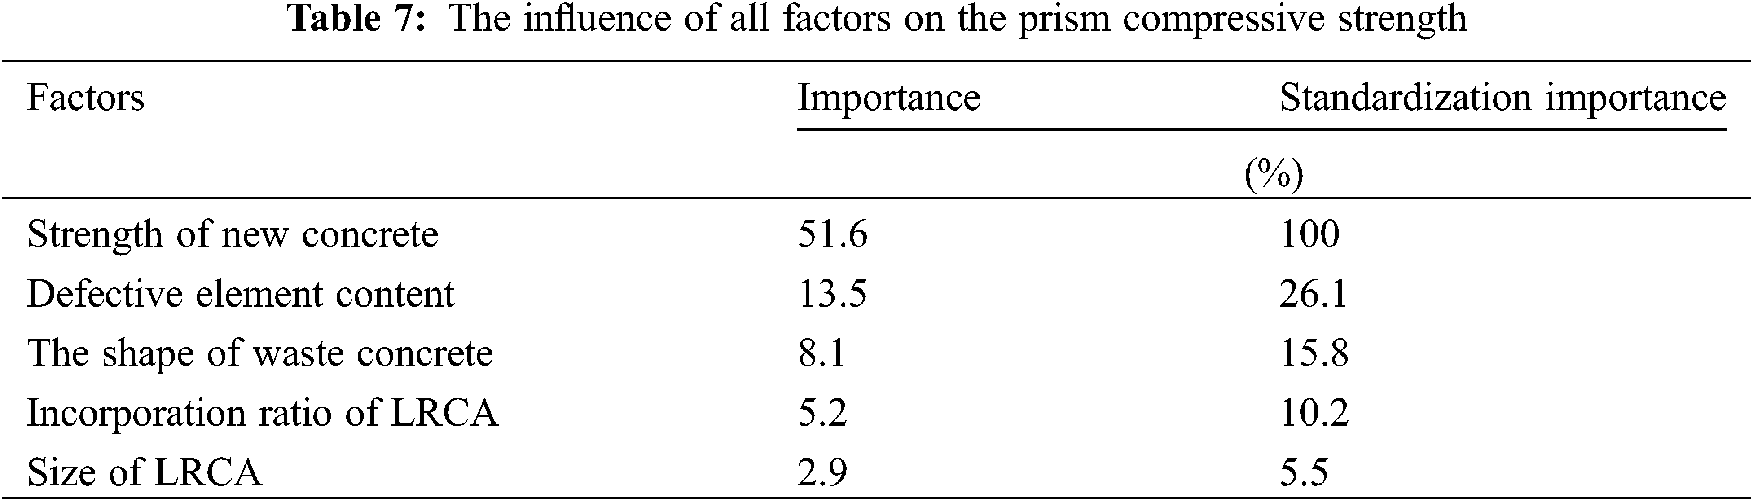
The importance of each factor is shown in Fig. 16. In Fig. 16, the area occupied by each influencing factor indicates the extent of its influence on the strength.
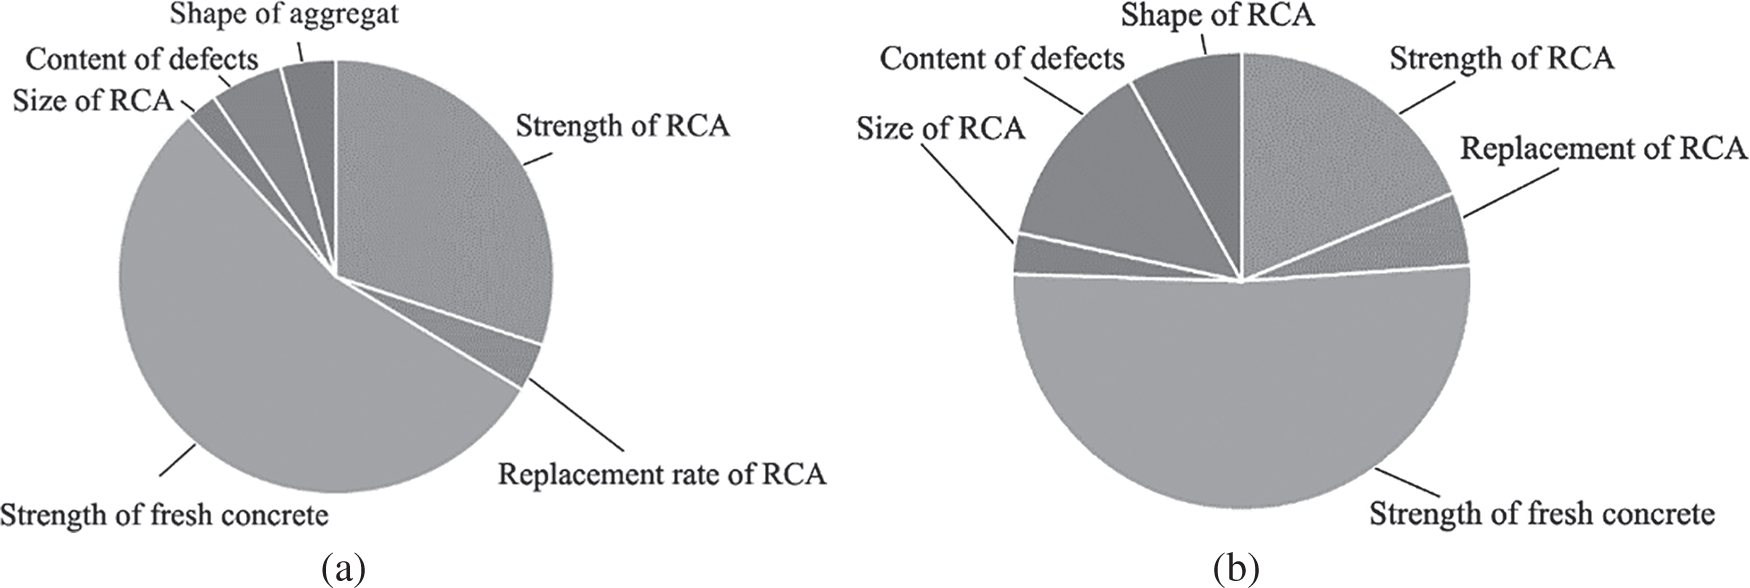
Figure 16: The importance of each factor (a) The impact on cube compressive strength (b) The impact on prism compressive strength
According to Fig. 16, the main factors on the cube compressive strength sorted by importance are the strength of new concrete, the strength of LRCA has the most significant impact, and the rest factors take 15.5%. The main factors on the prism compressive strength sorted by importance are the strength of new concrete, the strength of old concrete has the most significant impact, and the rests take 29.7%. The degree of influence of recycled aggregates on prisms’ compressive strength is not as great as that of the cube. The influence of new concrete strength on cube compressive strength is similar to prism compressive strength, holding a considerable proportion. To cube compressive strength and prism compressive strength, the influence of new concrete strength is 54.5% and 51.6%, respectively. The defect and shape factors significantly impact prism compression strength than cube compressive strength. Since the shape of the recycled aggregate is irregular, it will have a better aggregate interlocking and strengthen the shear transmission between the aggregate and the mortar. Under the action of confining pressure, the shear force can be better transmitted. When there is no confining pressure, the transmission of shear force is poor, and the influence of aggregate interlock is more evident at this time. The prism is less affected by the friction at the top, so the influence of aggregate interlock is more prominent; the benefiting of the shape of the aggregate on the compressive strength of the cube is relatively large.
In this paper, based on the random aggregate model, FEM software ANSYS was used to establish the numerical model of concrete with large-size recycled coarse aggregate (LRCA). Through the simulation of the uniaxial compression process of cubes and prisms and the analysis of the cracking process, the following conclusions can be obtained:
(1) The compressive strength ratios of prism to cube from the simulation are compared with the experimental results. The error between simulation and experiment is approximately 10–20%.
(2) The cracking situation of each phase material element shows that, in the initial stage, the crack extends along with the bonding elements, then extends to the mortar matrix and LRCA. In this simulation, the cracking ratio of the bonding element and old mortar elements near the old mortar is the highest, reached 63% and 62%, separately.
(3) The stress of recycled concrete with LRCA is slightly less than that of concrete with natural aggregates. In this simulation, when the volume strain of the prism is maximum, the corresponding stress is 78.7% of its maximum stress, which is the smaller value in the range of conventional concrete 75–90%.
(4) Considering the defects’ effect, the initial crack is formed near each defect element under the load action, connects and extends to an adjacent area, and many staggered cracks appear. Coarse aggregates are fractured by these cracks and become more fragmented, leading to a wide range of cracking areas in the model. The defects of LRCA have a more noticeable effect on the recycled concrete with a relatively high original strength of LRCA.
(5) The shape of the LRCA has a relatively small effect on the cube compressive strength, but it relatively large influences the prism compressive strength. The influence of LRCA size on recycled concrete is not significant. The impact of various factors on the cube compressive strength of recycled concrete sorted from largest to smallest are the strength of new concrete, the strength of old concrete, the defective element content, the shape of LRCA, the incorporation ratio of LRCA, and the size of LRCA. In this simulation, the importance coefficients of these influencing factors are 54.5, 30.1, 5.4, 4.1, 3.6 and 2.3.
Acknowledgement: The authors would like to acknowledge the National Natural Science Foundation (NSFC) of PR China (Nos. 51778463, 51438007, 52078370).
Funding Statement: This work was funded by the National Natural Science Foundation (NSFC) of PR China (Nos. 51778463, 51438007, 52078370).
Conflicts of Interest: The authors declare that they have no conflicts of interest to report regarding the present study.
1. Changjiang Institute of Survey (2015). Planning, design and research. Code for Mix design of Hydraulic Concrete (DL∕T 5330-2015). The Ministry of Water Resources of the People’s Republic’ of China, Beijing, China (in Chinese). [Google Scholar]
2. Pichler, B., Hellmich, C. (2011). Upscaling quasi-brittle strength of cement paste and mortar: A multi-scale engineering mechanics model. Cement and Concrete Research, 41(5), 467–476. DOI 10.1016/j.cemconres.2011.01.010. [Google Scholar] [CrossRef]
3. Pichler, B., Scheiner, S., Hellmich, C. (2008). From micron-sized needle-shaped hydrates to meter-sized shotcrete tunnel shells: Micromechanical upscaling of stiffness and strength of hydrating shotcrete. Acta Geotechnica, 3, DOI 10.1007/s11440-008-0074-z. [Google Scholar] [CrossRef]
4. Pichler, B., Hellmich, C., Mang, H. (2007). A combined fracture-micromechanics model for tensilestrain-softening in brittle materials, based on propagationof interacting microcracks. International Journal for Numerical and Analytical Methods in Geomechanics, 31(2), 111–132. DOI 10.1002/(ISSN)1096-9853. [Google Scholar] [CrossRef]
5. Babuška, I., Nobile, F., Tempone, R. (2007). A stochastic collocation method for elliptic partial differential equations with random input data. SIAM Journal on Numerical Analysis, 45(3), 1005–1034. DOI 10.1137/050645142. [Google Scholar] [CrossRef]
6. Babuška, I., Tempone, R., Zouraris, G. E. (2004). Galerkin finite element approximation of stochastic elliptic partial differential equations. SIAM Journal on Numerical Analysis, 42(2), 800–825. DOI 10.1137/S0036142902418680. [Google Scholar] [CrossRef]
7. Bäck, J., Nobile, F., Tamellini, T., Tempone, R. (2011). Stochastic spectral Galerkin and Collocation methods for PDEs with random coefficients: A numerical comparison. Spectral and high order methods for partial differential equations, pp. 43–62, Berlin, Germany: Springer. [Google Scholar]
8. Bonizzoni, F., Nobile, F. (2020). Regularity and sparse approximation of the recursive first moment equations for the lognormal darcy problem. Computers & Mathematics with Applications, 80(12), 2925–2947. DOI 10.1016/j.camwa.2020.10.014. [Google Scholar] [CrossRef]
9. Bonizzoni, F., Nobile, F., Kressner, D. (2016). Tensor train approximation of moment equations for elliptic equations with lognormal coefficient. Computer Methods in Applied Mechanics and Engineering, 308, 349–376. DOI 10.1016/j.cma.2016.05.026. [Google Scholar] [CrossRef]
10. Harbrecht, H., Schneider, R., Schwab, C. (2008). Sparse second moment analysis for elliptic problems in stochastic domains. Numerische Mathematik, 109(3), 385–414. DOI 10.1007/s00211-008-0147-9. [Google Scholar] [CrossRef]
11. Wittmann, F. H., Roelfstra, P. E., Sadouki, H. (1985). Simulation and analysis of composite structures. Materials Science and Engineering, 68, 239–248. DOI 10.1016/0025-5416(85)90413-6. [Google Scholar] [CrossRef]
12. Sadouki, H. S., Wittmann, F. H. (1988). On the analysis of the failure process in composite materials by numerical simulation. Materials Science & Engineering A: Structural Materials: Properties, Microstructure and Processing, 104, 9–20. DOI 10.1016/0025-5416(88)90401-6. [Google Scholar] [CrossRef]
13. Zhu, C. M., Li, T. (2014). Mechanical properties of waste concrete-participated recycled concrete. Journal of South China University of Technology, 42, 50–56 (in Chinese). DOI 10.3969/j.issn.1000-565X.2014.02.009. [Google Scholar] [CrossRef]
14. Wu, B., Zhao, X. Y., Zhang, J. S. (2012). Cyclic behavior of thin-walled square steel tubular columns filled with demolished concrete lumps and fresh concrete. Journal of Constructional Steel Research, 77, 69–81. DOI 10.1016/j.jcsr.2012.05.003. [Google Scholar] [CrossRef]
15. Peng, Y., Wu, Z., Ying, L., Yang, D. (2020). Five-phase sphere equivalent model of recycled concrete and numerical simulation based on the base force element method. Engineering Computations, 38(5), 1957–1977. DOI 10.1108/EC-08-2019-0352. [Google Scholar] [CrossRef]
16. Peng, Y., Chen, X., Ying, L., Kamel, M. M. A. (2019). Research on softening curve of recycled concrete using base force element method in meso-level. Engineering Computations, 36(7), 2414–2429. DOI 10.1108/EC-11-2018-0510. [Google Scholar] [CrossRef]
17. Ying, L., Peng, Y., Kamel, M. M. A. (2020). Mesoscopic numerical analysis of dynamic tensile fracture of recycled concrete. Engineering Computations, 37(6), 1899–1922. DOI 10.1108/EC-05-2019-0214. [Google Scholar] [CrossRef]
18. Yu, Y., Zheng, Y., Zhao, X. Y. (2021). Mesoscale modeling of recycled aggregate concrete under uniaxial compression and tension using discrete element method. Construction and Building Materials, 268, 121116. DOI 10.1016/j.conbuildmat.2020.121116. [Google Scholar] [CrossRef]
19. Raza, A., Rafique, U. (2021). Efficiency of GFRP bars and hoops in recycled aggregate concrete columns: Experimental and numerical study. Composite Structures, 255, 112986. DOI 10.1016/j.compstruct.2020.112986. [Google Scholar] [CrossRef]
20. Raza, A., Shah, S. A. R., Alhazmi, H., Abrar, M., Razzaq, S. (2021). Strength profile pattern of FRP-reinforced concrete structures: A performance analysis through finite element analysis and empirical modeling technique. Polymers, 13(8), 1265. DOI 10.3390/polym13081265. [Google Scholar] [CrossRef]
21. Wang, Z. M., Kwan, A. K. H., Chan, H. C. (1999). Meso-scopic study of concrete (IGeneration of random aggregate structures and finite element mesh. Computers and Structure, 70, 533–544. DOI 10.1016/S0045-7949(98)00177-1. [Google Scholar] [CrossRef]
22. Chang, C. S., Wang, T. K., Sluys, L. J., van Mier, J. G. M. (2002). Fracture modeling using a microstructural mechanics approach––II. finite element analysis. Engineering Fracture Mechanics, 69, 1959–1976. DOI 10.1016/S0013-7944(02)00071-1. [Google Scholar] [CrossRef]
23. Erik, S., van Mier, J. G. M. (1991). Lattice model for numerical simulation of concrete fracture. International Conference on Dam Fracture Denver, Colorado, USA. [Google Scholar]
24. Gurson, L. (1977). Continuum theory of ductile rupture by void nucleation and growth. Part I. Yield criteria and flow rules for porous ductile media. Journal of the Mechanics and Physics of Solids, 99, 2–15. DOI 10.1115/1.3443401. [Google Scholar] [CrossRef]
25. Tvergaard, V. (1981). Influence of voids on shear bamd instablities under plane strain condition. International Journal of Fracture, 17, 389–407. DOI 10.1007/BF00036191. [Google Scholar] [CrossRef]
26. Bažant, Z. P., Tabbara, M. R., Kazemi, M. T., Gilles, P. (1990). Random particle model for fracture of aggregate or fiber composites. Journal of Engineering Mechanics, 116, l686–1705. DOI 10.1061/(ASCE)0733-9399(1990)116:8(1686). [Google Scholar] [CrossRef]
27. Mohamed, A. R., Hansen, W. (1999). Micromechanical modeling of concrete response under static loading-Part 1: Model development and validation. ACI Materials Journal, 96, 196–203. [Google Scholar]
28. Caballero, A., López, C. M., Carol, I. (2006). Meso-structural analysis of concrete specimens under uniaxial tension. Computer Methods in Applied Mechanics and Engineering, 195, 7182–7195. DOI 10.1016/j.cma.2005.05.052. [Google Scholar] [CrossRef]
29. Monteiro, A. N., Lemos, J. V. (2005). A generalized rigid particle contact model for fracture analysis. International Journal for Numerical and Analytical Methods in Geomechanics, 29, 269–285. DOI 10.1002/(ISSN)1096-9853. [Google Scholar] [CrossRef]
30. van Mier, J. G. M., van Vliet, M. R. A. (1999). Experimentation, numerical simulation and the role of engineering judgement in the fracture mechanics of concrete and concrete structures. Construction and Building Materials, 13, 3–14. DOI 10.1016/S0950-0618(99)00003-3. [Google Scholar] [CrossRef]
31. Li, T., Xiao, J., Zhu, C., Zhong, Z. (2016). Experimental study on mechanical behaviors of concrete with large-size recycled coarse aggregate. Construction and Building Materials, 120, 321–328. DOI 10.1016/j.conbuildmat.2016.05.110. [Google Scholar] [CrossRef]
32. Jayasuriya, A., Adams, M. P., Bandelt, M. J. (2020). Generation and numerical analysis of random aggregate structures in recycled concrete aggregate systems. Journal of Materials in Civil Engineering, 32(4), 04020044. DOI 10.1061/(ASCE)MT.1943-5533.0003113. [Google Scholar] [CrossRef]
33. ANSYS, Inc. (2013). ANSYS Mechanical User’s Guide. Release 15.0, 2013. [Google Scholar]
34. Ministry of Housing and Urban-Rural Construction of the People’s Republic of China (2015). Code for design of concrete structures (GB 50010-2010). Ministry of Housing and Urban-Rural Development of the People’s Republic of China, Beijing, China (in Chinese). [Google Scholar]
35. Li, T., Xiao, J. (2020). Simulation on compressive property of concrete with large-size recycled coarse aggregate. ACI Materials Journal, 117, 159–168. DOI 10.14359/51725976. [Google Scholar] [CrossRef]
36. Haeri, H., Vahab, S. (2016). Numerical simulation of tensile failure of concrete using particle flow code (PFC). Computers and Concrete, 18, 39–51. DOI 10.12989/cac.2016.18.1.039. [Google Scholar] [CrossRef]
37. Gui, Y., Chen, Y., Gao, D. (2011). PFC simulation on shaking table concrete-faced rockfill Dam model test. Advanced Materials Research, 163–167, 4208–4212. DOI 10.4028/www.scientific.net/AMR.163-167.4208. [Google Scholar] [CrossRef]
38. China Academy of Building Research (2012). Standard for method of concrete structure (GB/T 50152–2012). The Ministry of Housing and Urban-rural Development of People’s Republic of China, Beijing, China (in Chinese). [Google Scholar]
 | This work is licensed under a Creative Commons Attribution 4.0 International License, which permits unrestricted use, distribution, and reproduction in any medium, provided the original work is properly cited. |