| Journal of Renewable Materials |
DOI: 10.32604/jrm.2022.016735
ARTICLE
Tunable Luminescence Properties and Elucidating the Electronic Structures of Single-Phase Spherical BaWO4: Dy3+, Tm3+, Eu3+ Phosphors for Warm-White-Lighting
1State Key Laboratory of Materials–Orient Chemical Engineering, College of Materials Science and Engineering, Nanjing Tech University, Nanjing, China
2Jiangsu National Synergetic Innovation Center for Advanced Materials (SICAM), Nanjing, China
3Jiangsu Collaborative Innovation Center for Advanced Inorganic Function Composites, Nanjing, China
*Corresponding Authors: Yunfei Liu. Email: yfliu@njtech.edu.cn; Yinong Lyu. Email: yinonglu@njtech.edu.cn
Received: 22 March 2021; Accepted: 13 May 2021
Abstract: A series of uniform single-phase spherical BaWO4: Dy3+, Tm3+, Eu3+ phosphors were prepared via a microwave hydrothermal method by using trisodium citrate dehydrate as surfactant. The phase structure, morphology and photoluminescence properties were measured by powder X-ray diffraction, scanning electron microscope and fluorescence spectrometer, respectively. The results show that uniform spherical microcrystals with diameters in the range of 2–4 μm are obtained. And the phase and morphology of samples are not significantly changed by doping rare earth (RE3+) ions. Under the excitation wavelength of 356 and 365 nm, the samples BaWO4: 0.03Dy3+, yTm3+ can emit cold white light. In order to lower the correlated color temperature (CCT) to get a warm white light, the Eu3+ ions were doped into BaWO4: 0.03Dy3+, 0.01Tm3+. Especially, under the excitation of 365 nm, BaWO4: 0.03Dy3+, 0.01Tm3+, 0.03Eu3+ phosphor shew a bright warm white light with color coordinate of (0.4013, 0.3629) and CCT of 3288 K. Moreover, in the BaWO4: Dy3+, Tm3+, Eu3+ phosphors, the energy transfer mechanism among Dy3+, Tm3+ and Eu3+ ions have been discussed and the change of electron structures have been calculated by first-principles calculations. The results shew that the uniform single-phase spherical BaWO4: Dy3+, Tm3+, Eu3+ phosphors could be favorable candidates in warm white LEDs.
Keywords: Barium tungstate; microwave hydrothermal method; spherical; warm white lighting; electron structures
Solid-state white lighting equipment based on semiconductors chips and inorganic phosphors have become an excellent choice for providing ambient lighting because of the advantages of long service life, energy efficiency and environmental friendliness [1–3]. White light-emitting diodes (LEDs) have already replaced incandescent and fluorescent lamps as a new generation of lighting source [4]. There are a number of different strategies to realize a white LED. The most common one is InGaN blue chips combined with YAG: Ce3+ yellow phosphors, which shows high correlated color temperature (CCT > 4500 K) because of the deficiency of red component [5–8]. Another method is combined red, green and blue (RGB) phosphors with ultraviolet (UV) or near-ultraviolet (NUV) chips, which still has a problem that phosphors may have different degradation rates and the final color of light will change over time [9–12]. A more attractive approach is using a UV chip in conjunction with a single-phase phosphor that has multiple emitting centers to get warm-white light [13–15].
Alkaline earth tungstate AWO4 (A = Ca, Sr or Ba) include a wide range of applications materials such as scintillators, luminescent materials, electro-optical devices, and catalysts [16–18]. Barium Tungstate (BaWO4) is considered an prominent matrix material for photoluminescence materials due to the charge transfer (CT) from oxygen to the tungsten under the UV light [19]. Rare earth (RE) ions have a large number of energy levels in which electrons can jump when excited by UV light. One of the RE ions Dy3+ has a great potential in the preparation of white phosphors because of the emission light of Dy3+ contain blue (470–500 nm) and yellow (570–600 nm) composition under UV excitation [20]. Thulium Tm3+ can be used as a sensitizer to promote the emission of Dy3+ ions due to the energy transfer between Tm3+ and Dy3+ [21]. Europium Eu3+ ions are wide used in phosphors due to the red emission upon UV excitation [22–24]. Among Dy3+, Tm3+ and Eu3+ ions in the host of BaWO4, Tm3+ ions can serve as not only an activator but also a sensitizer in luminescent materials and Dy3+ and Eu3+ ions are activators. Therefore, in the present work, Dy3+, Tm3+, and Eu3+ ions were co-doped into a BaWO4 matrix to obtain a single-phase warm-white phosphor with improved luminescence properties.
The doping of RE ions will have an impact on the electronic structures of materials. The type and amount of doping elements can adjust the band gap and electronic state density distribution of materials, which will affect the practical application of materials [25,26]. Carvalho et al. employed the Density Functional Theory (DFT) to calculate band gap, electron density of states and optical properties of the AWO4 (A = Ca, Sr or Ba) with scheelite-type structure [27]. But the change of the electronic structures when RE doped BaWO4 were not discussed enough. Considering the influence of particle size and morphology on the fluorescence performance, uniform and spherical microcrystals is advantageous of fluorescence performance due to the high bulk densities and low light scattering. Therefore, in this works, a series of single phase BaWO4: RE3+ (Dy3+, Tm3+ and Eu3+) were synthesized by a microwave hydrothermal method to explore the variations of electronic structures and test the photoluminescence properties of this samples. Based on the experimental results and theoretical calculations, the tunable color and single phase BaWO4: RE3+ (Dy3+, Tm3+ and Eu3+) could be favorable candidates in warm white LEDs.
A series of samples of BaWO4: xDy3+, BaWO4: xDy3+, yTm3+, BaWO4: xDy3+, yTm3+, zEu3+ were prepared by the microwave hydrothermal method. The raw materials used were Ba(NO3)2(A.R.), Na2WO4•2H2O(A.R.), Tm(NO3)3•6H2O(A.R.), Dy2O3(99.9%) and Eu2O3(99.9%). Dy(NO3)3 and Eu(NO3)3 solution were obtained by dissolving the Dy2O3(99.9%) and Eu2O3(99.9%) in nitric acid solution under stirring. In a typical experiment, the Ba(NO3)2 (0.1 mol/L), Dy(NO3)3 (0.1 mol/L), Tm(NO3)3 (0.1 mol/L) and Eu(NO3)3 (0.1 mol/L) solutions were mixed with the designed stoichiometric ratio. Then trisodium citrate dehydrate (C6H5Na3O7) (0.2 mol/L) as a surfactant were added with stirring for 10 min. After that, Na2WO4 (0.15 mol/L) were injected into the hybrid solution and the pH of mixture was adjusted to 8 by the sodium hydroxide solution. After stirring for 15 min, the mixture solution was transferred and sealed into a glass tube and heated by microwave (CEM-discovery, CEM, USA) with T = 160°C and t = 1 h. After naturally cooling to room temperature, the products were separated by centrifugation (5000 r/min, 10 min) and rinsed several times with water and alcohol, which were further dried at 80°C for 8 h.
The crystal structure and phase composition of the samples were determined by the X-ray diffraction (XRD) analysis (SmartLab X-ray Diffractometer) with Cu Kα radiation (λ = 0.15405 Å) at a scanning speed of 10°/min from 10° to 80°. The morphology and energy dispersive X-ray (EDX) spectrum were inspected by a scanning electron microscope (SEM, JSM-6510, JEOL Ltd., Japan). The fluorescence properties of prepared samples were carried out by a FL3-221 fluorescence spectrometer (HORIBA, France) using a Xe lamp as an excitation source. The TU-1810 UV-Vis spectrophotometer produced by Beijing Purse General Instrument Co., Ltd. China, is used to measure the UV absorption spectra of the materials.
According to Cavalcante et al. report, scheelite-type structure BaWO4 with lattice parameters (a = b = 5.6054 Å, c = 12.7041 Å) was chosen for the structural optimization and calculation [28]. The optimizations and calculations were performed by the DFT based on the software package CASTEP in Materials Studio. The exchange correlation interactions was described by generalized gradient approximation (GGA) with the Predew-Burke-Ernzerhof (PBE) scheme [28]. Throughout the calculation, the Vanderbilt ultrasoft pseudopotential with a cutoff energy of 571.4 eV was carried out and the Brillouin zone of samples were sampled using 3 × 3 × 1 mesh of the Monkhorst–Pack scheme. The convergence tolerance for geometry optimization was 1.0 × 10⁻⁶ eV/atom and the maximal force on each atom was less than 0.01 eV/Å.
The XRD patterns of BaWO4: RE3+ (Dy3+, Tm3+ and Eu3+) samples synthesized by the microwave hydrothermal method with C6H5Na3O7 at 160°C for 1 h with pH = 8 were present in Fig. 1. All of the diffraction patterns detected can be assigned to the pure scheelite-type tetragonal crystal structures with the space group I41/a (88), which is in line with the PDF card (JCPDS 43-0646). The results indicate that the RE ions successfully introduced into the host and did not significantly change the BaWO4 structure. But, with the concentration of the RE ions increased, the XRD diffraction peaks of the samples offset a little to the high angle region, because the radii of Dy3+ (0.912 Å), Tm3+ (0.880 Å) and Eu3+ (0.947 Å) are smaller than that of Ba2+ (1.350 Å). That further indicates that RE ions replace Ba2+ into the lattice. To balance the crystal charge, the vacancies of Ba (VBa) occurred, and the VBa increased with the increase of doping concentration, which will lead the diffraction peak intensities to be reduced and broad [29].
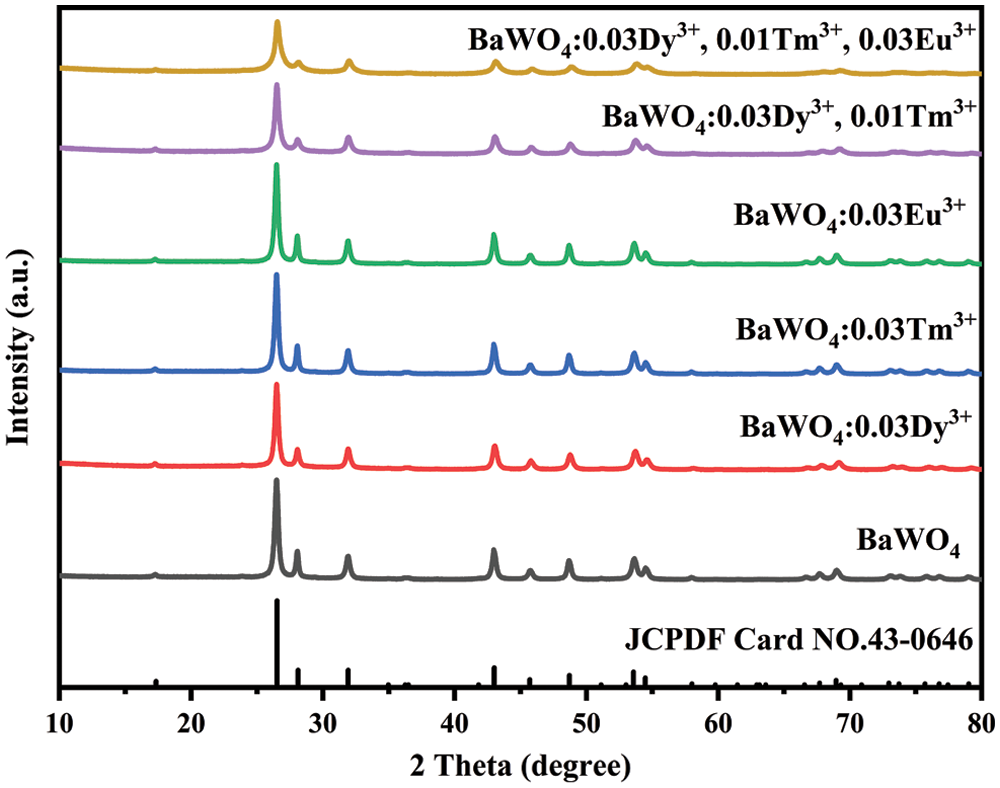
Figure 1: XRD patterns of BaWO4: RE3+ samples prepared by the microwave hydrothermal method with C6H5Na3O7 at 160°C for 1 h
Fig. 2 shows the SEM images of the BaWO4 and BaWO4: RE3+ (Dy3+, Tm3+ and Eu3+) samples. It can be clearly seen that the BaWO4 and BaWO4: RE3+ samples are well-dispersed microspheres and the diameters are about 2–4 μm. As shown in Fig. 2, with the doping of RE3+ ions, the particle size of the sample decreased slightly and the particle surface becomes smooth. The reason for this phenomenon is that vacancy defects caused by unequal substitution between Ba2+ ions and RE3+ ions will restrict the growth of crystals and eventually lead to the reduction of particle size. Combining with XRD results, RE3+ ions doping into BaWO4 host will not significantly change the crystal structure and morphology, which consistent with the previous reports [30]. As we know, spherical phosphor has a higher packing densities and lower light scattering characteristics, so a narrow particle size distribution and a spherical shape with an appropriate particle size are conducive to obtaining higher brightness [31].
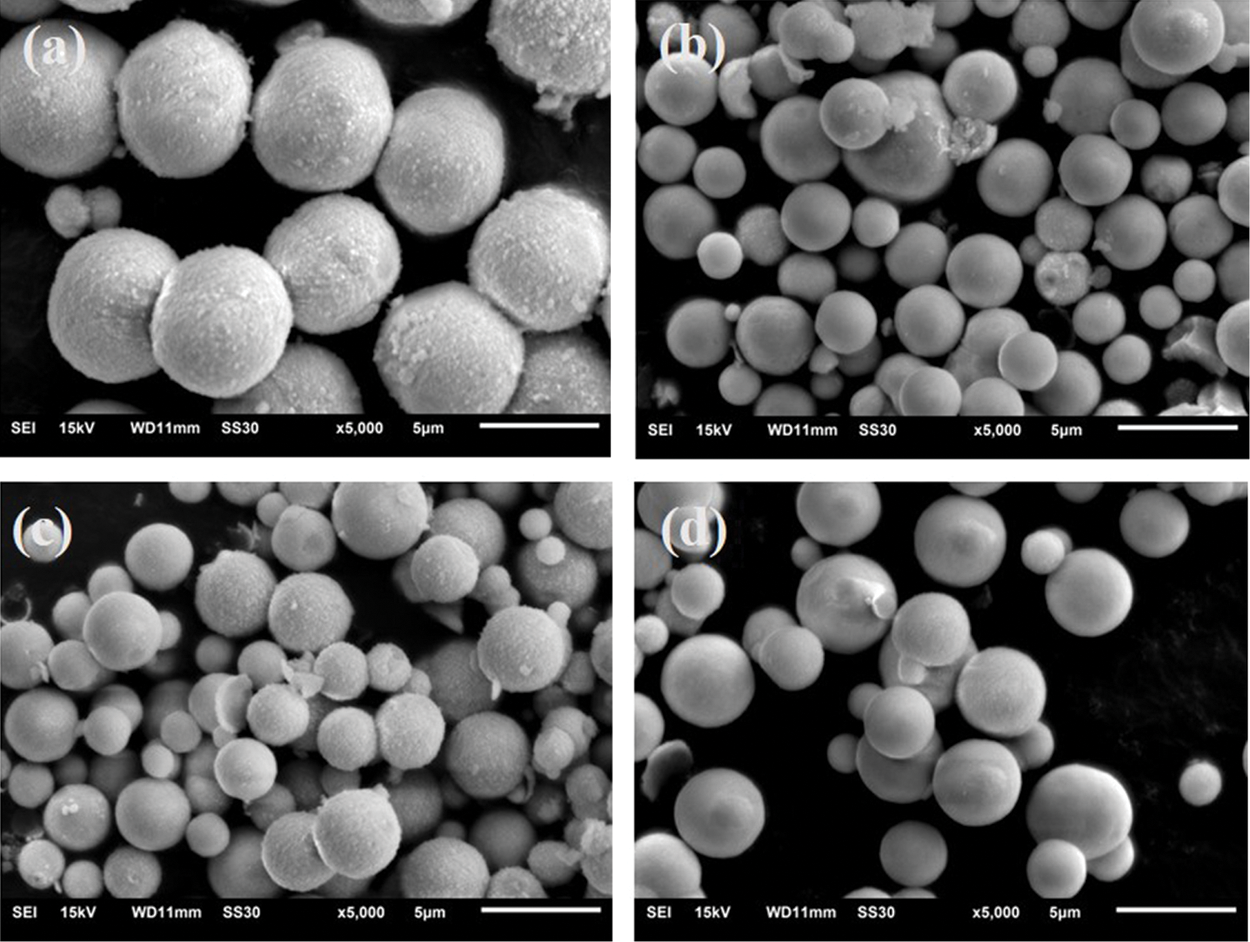
Figure 2: SEM images of the synthesized samples (a) BaWO4, (b) BaWO4: 0.03Dy3+, (c) BaWO4: 0.03Dy3+, 0.01Tm3+ and (d) BaWO4: 0.03Dy3+, 0.01Tm3+, 0.03Eu3+
For purpose of exploring the electronic structure of BaWO4, the band structures and density of states was calculated and shown in Fig. S1. The valence band (VB) maxima and conduction band (CB) minima are both located at the G point indicated that BaWO4 is a direct gap material, which is keeping with other’s experiment results. The band gap energy (Eg) of BaWO4 is 4.666 eV, which is similar to the report [32]. Fig. 3 shew the band structures of BaWO4: xDy3+ (x = 0.01–0.05) calculated by the DFT calculations. With the doping of Dy3+ ions, comparing with pure BaWO4, band gaps decreased linearly, which show in Fig. 3f. But the direct character of the band gap is not changed with the increased concentration of Dy3+ ions. As shown in Fig. S2 and Fig. 4, with the doping of Tm3+ and Eu3+ions, the band gap still decreases linearly and keeps the direct character. By studying the change of partial density of states near the Fermi level of the BaWO4: 0.03Dy3+, 0.01Tm3+, zEu3+, the p and f populations around the fermi level are shown in Fig. 4. The doping of RE3+ ions will affect both conduction band and valence band. And the effect on the valence band is more obvious The valence band rises while the conduction band falls, resulting in a decrease in the band gap, which consistent with the literature reported previously [33]. The reduction of the band gap helps the transition of electrons to improve the fluorescence performance. The experimental values obtained for the band gap of the BaWO4 and BaWO4: RE3+ phosphors were estimated from the respective UV-vis absorption spectra by plotting the square of the Kubelka−Munk equation [34,35]:
where A was absorption constant, h was the Planck’s constant, v was frequency of light, Eg was optical band gap and n takes the values n = 1/2 or 2, corresponding to the direct or indirect allowed transition. The Eg values are presented in Fig. S4, but the Eg values are larger than that of theoretical calculation. This is due to the defects of the GGA, which underestimates the correlation between the excited electrons and makes the calculated value lower than the experimental value [36]. The experiment band gaps shared a same trend with the theoretical calculations, RE3+ ions doping will reduce the band.
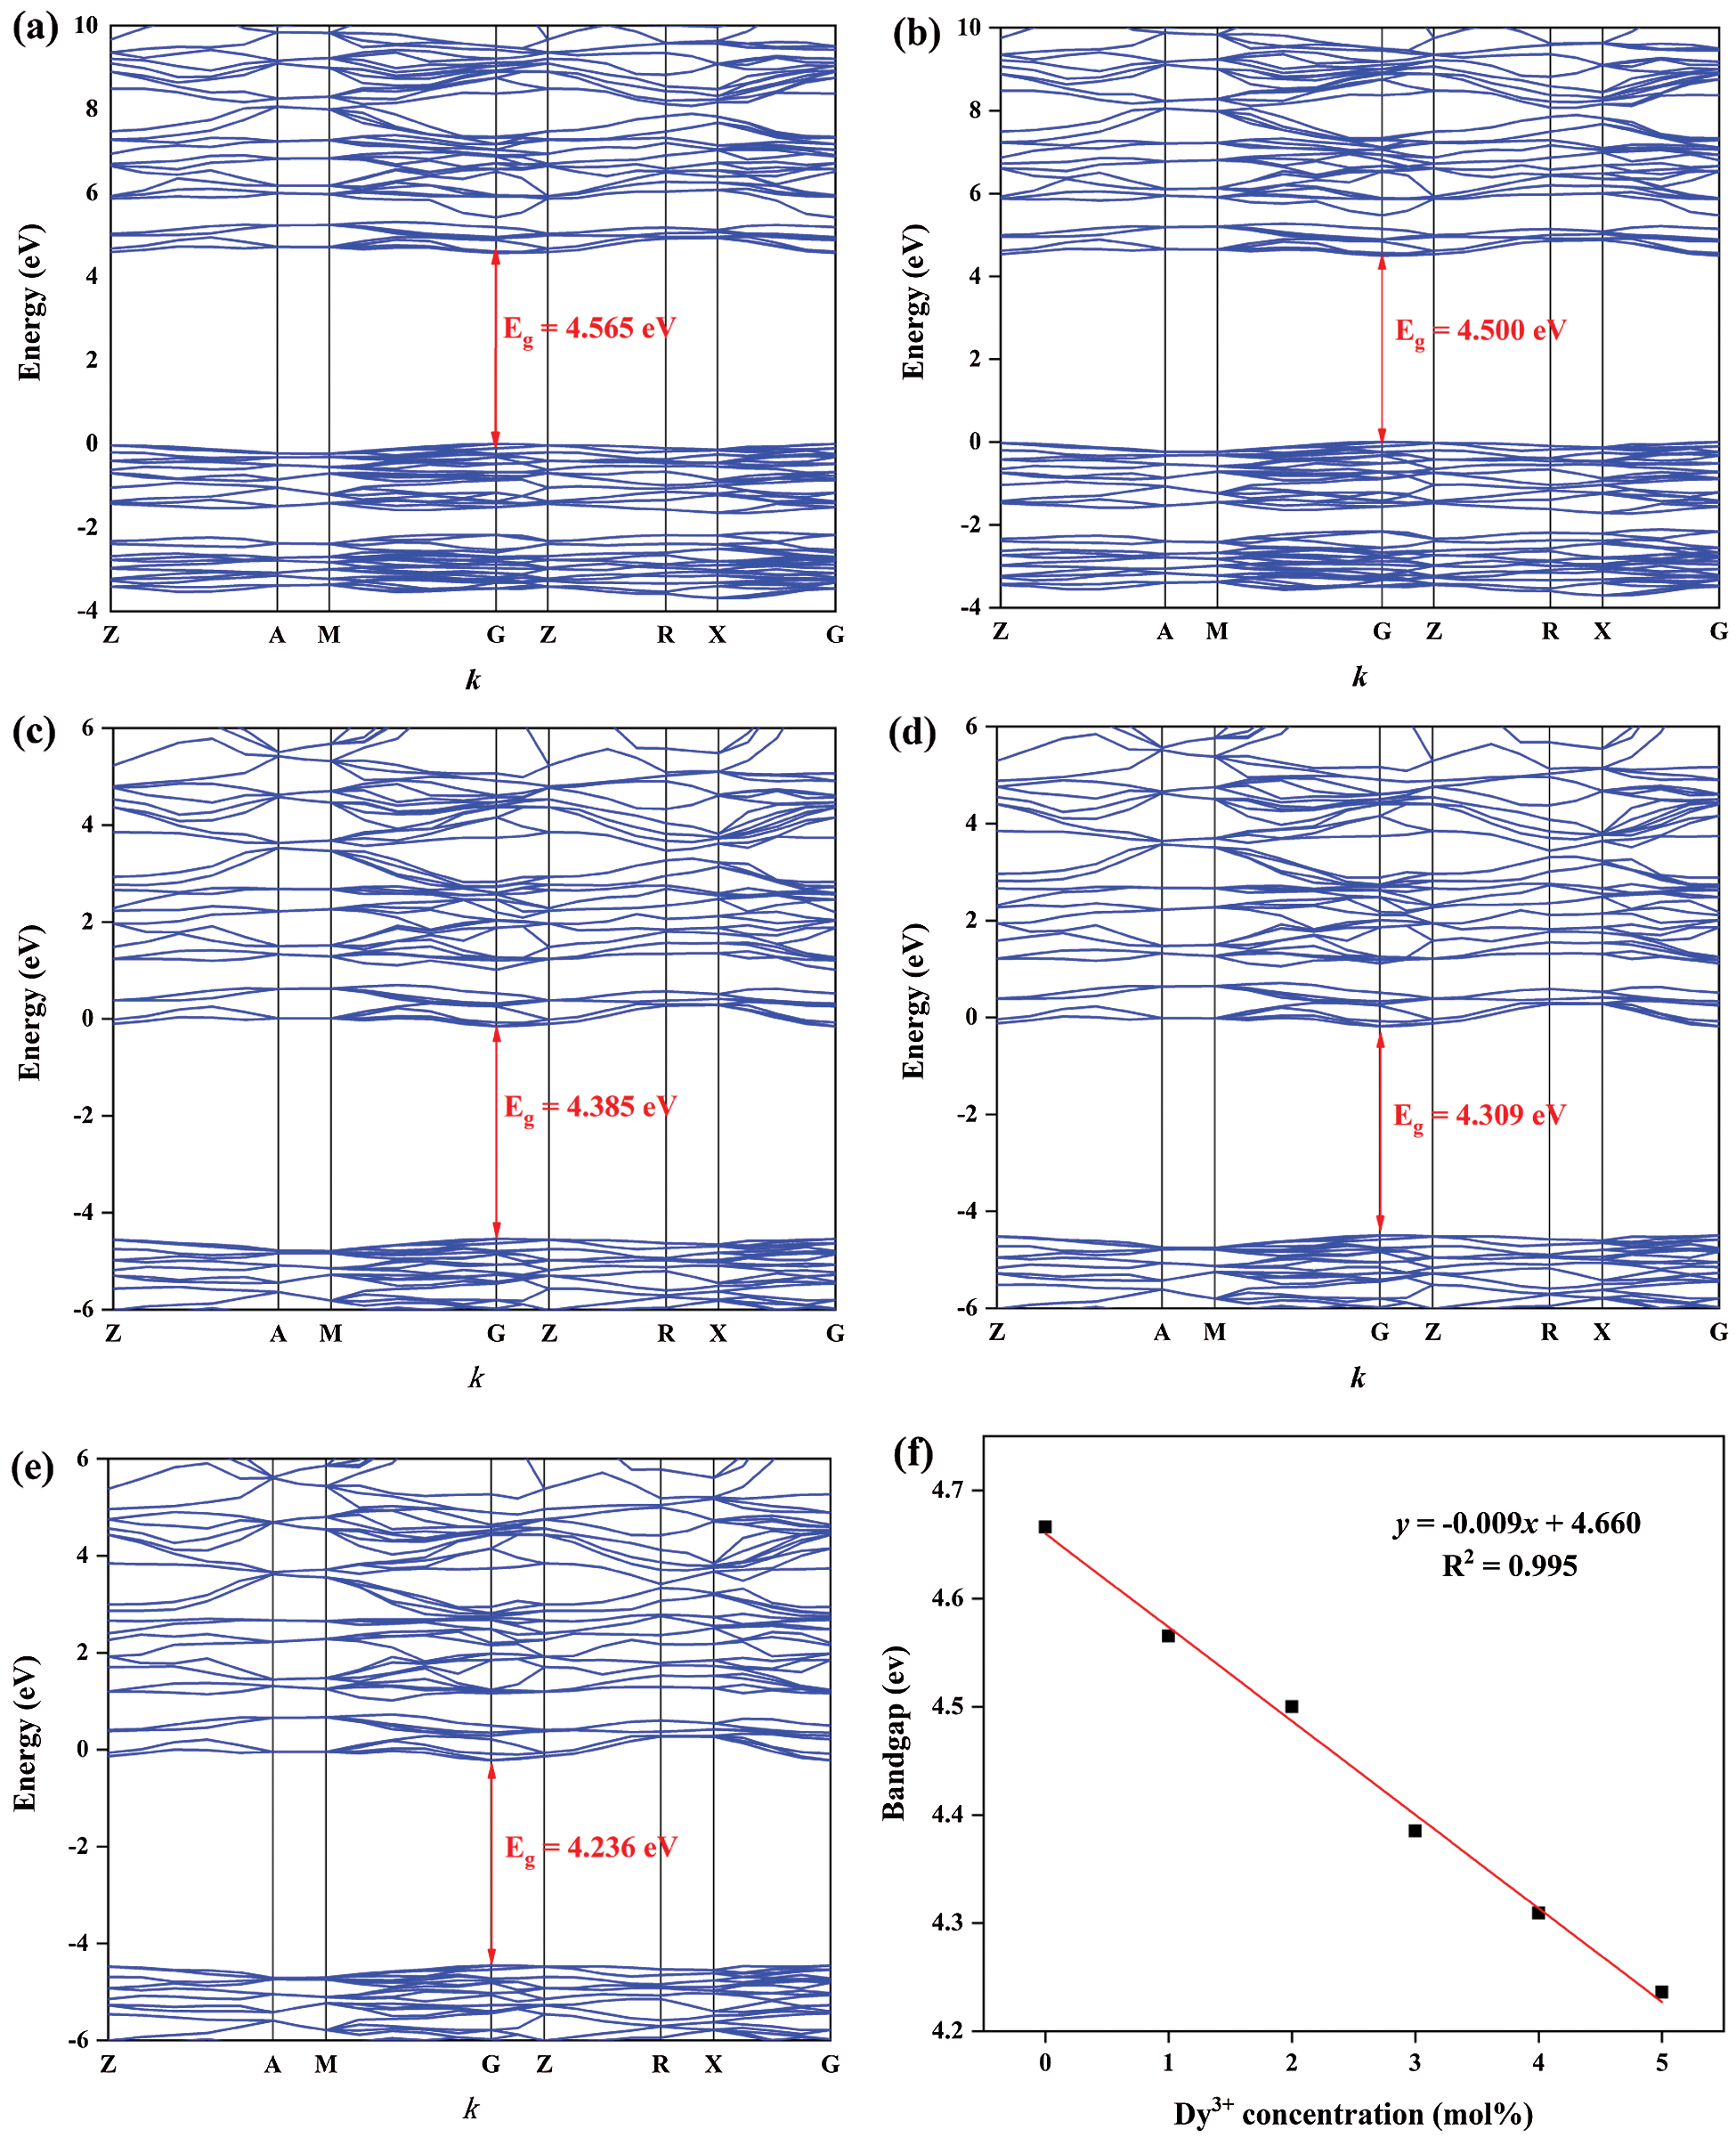
Figure 3: Band structures of BaWO4: xDy3+, (a) x = 0.01, (b) x = 0.02, (c) x = 0.03, (d) x = 0.04, (e) x = 0.05, and (f) the dependence of band gaps on x
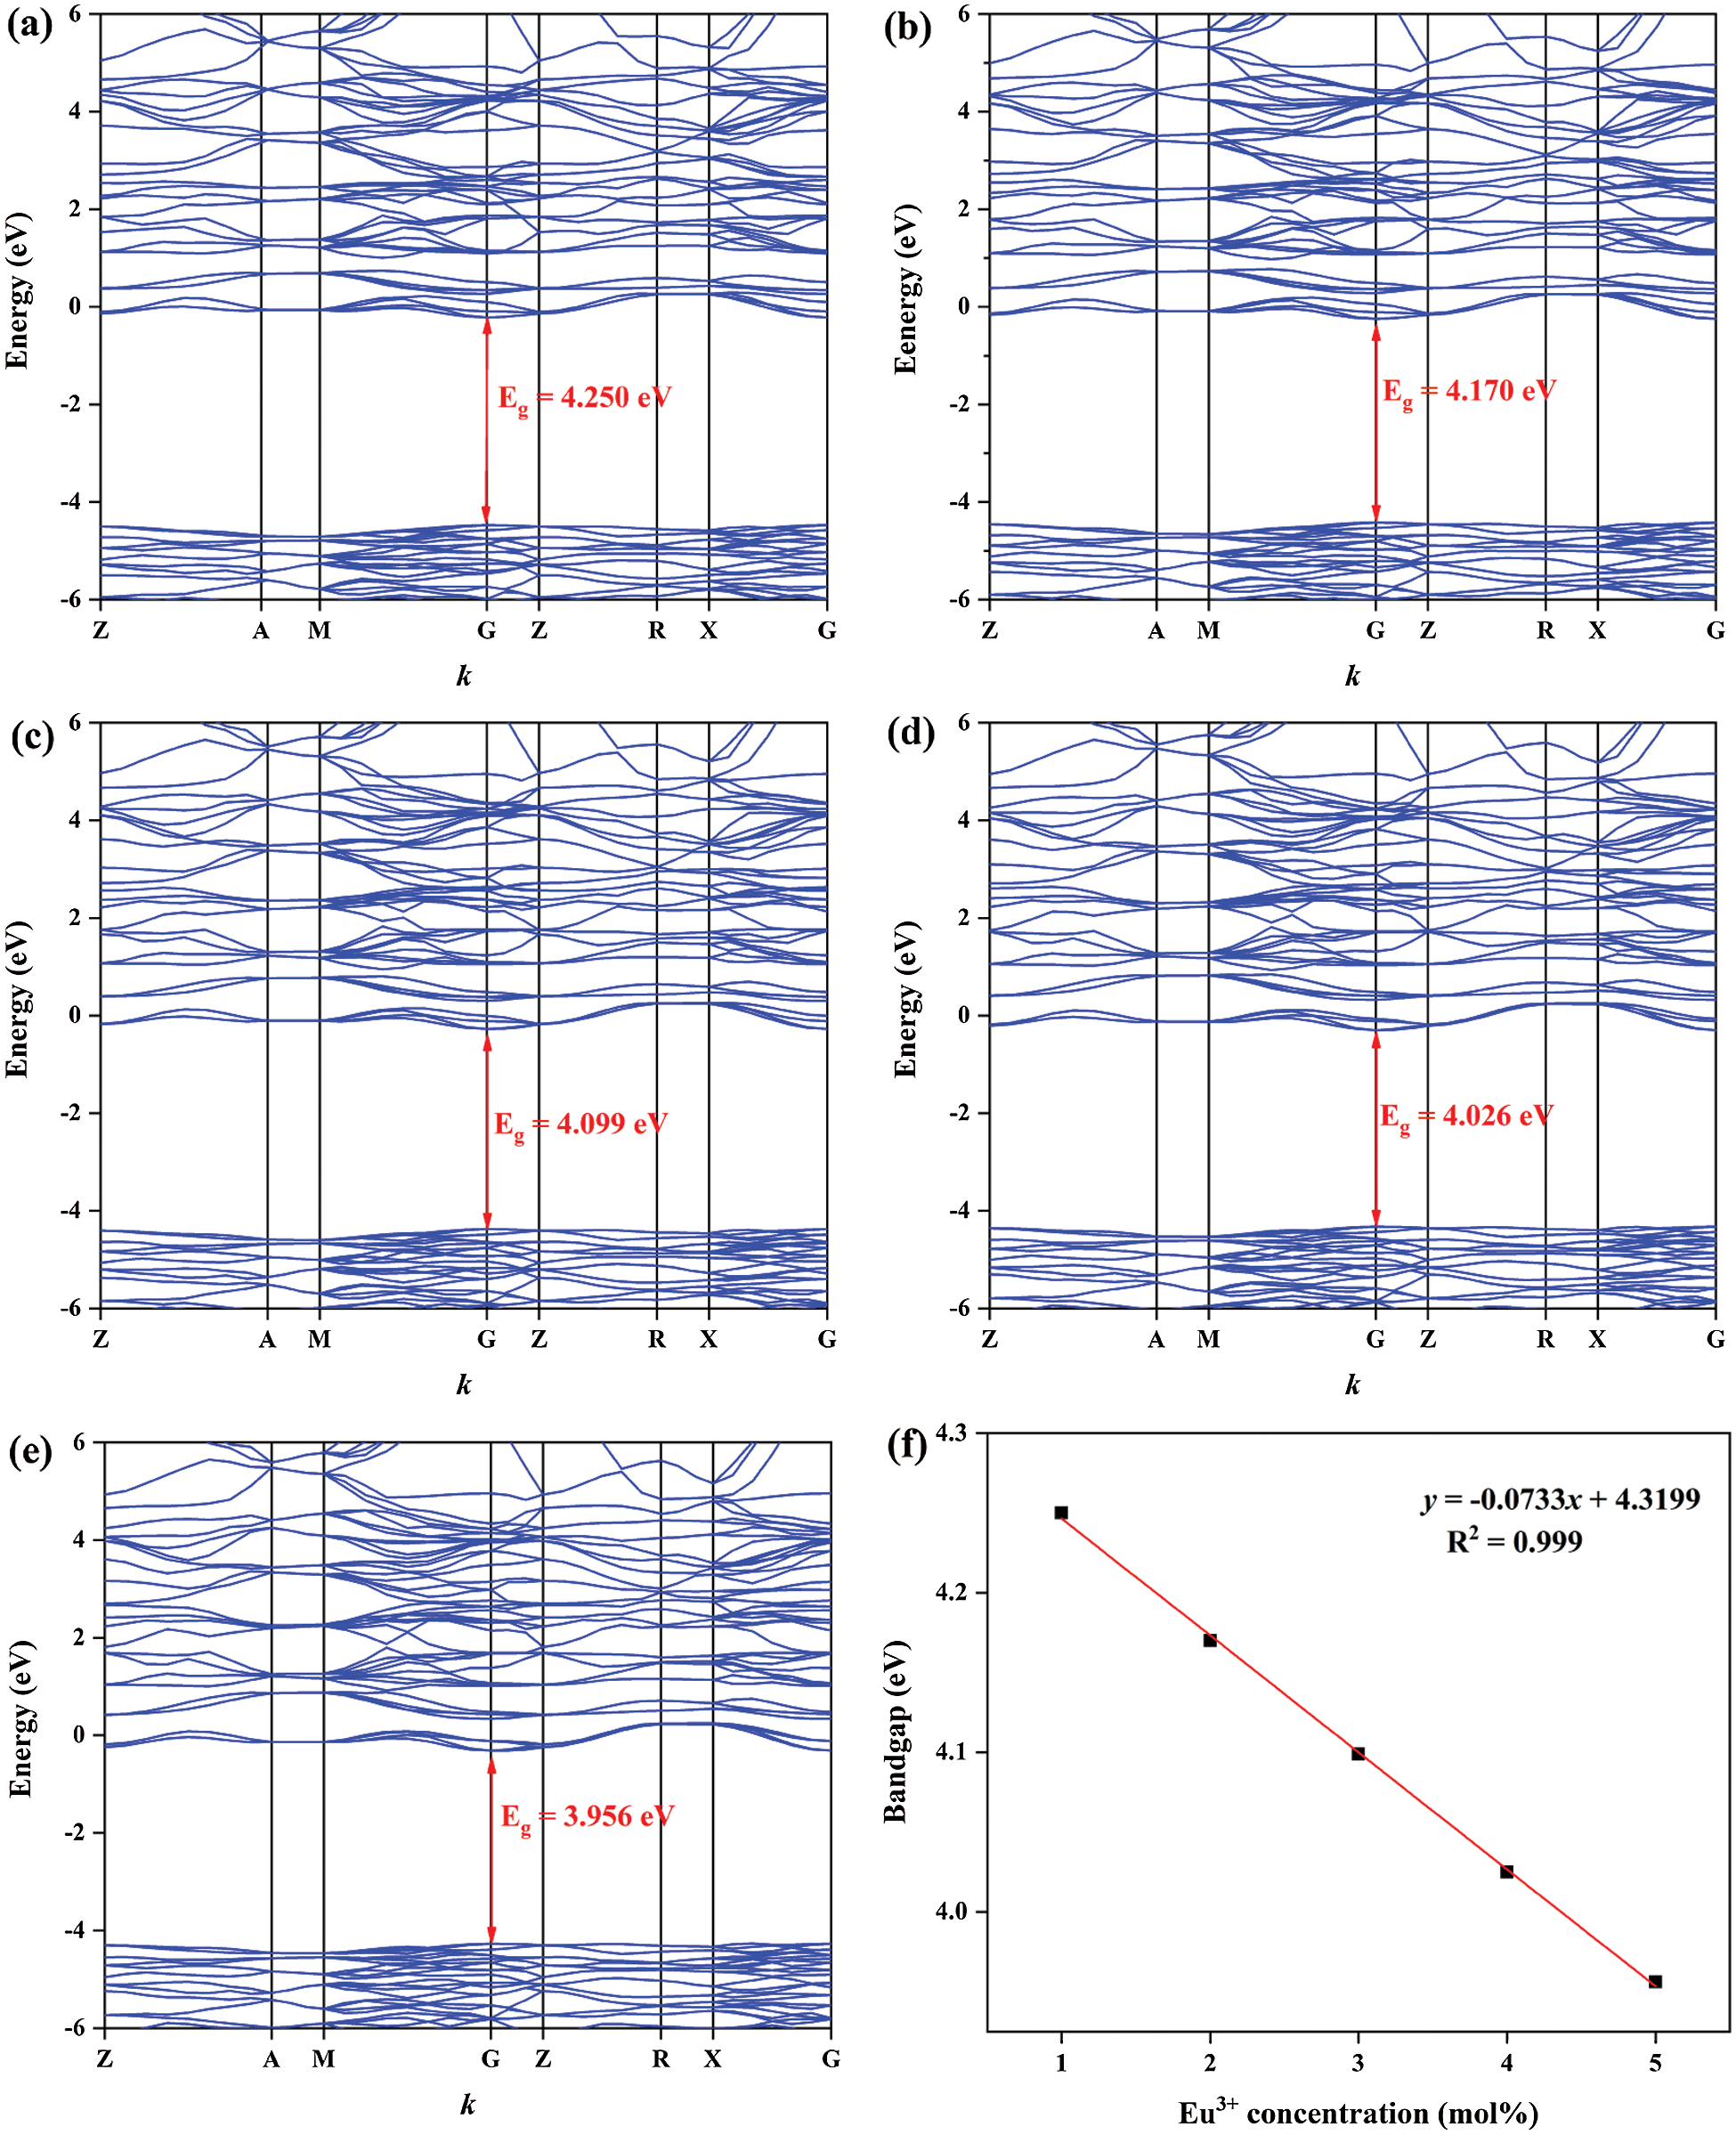
Figure 4: Band structures of BaWO4: 0.03Dy3+, 0.01Tm3+, zEu3+ (a) z = 0.01, (b) z = 0.02, (c) z = 0.03, (d) z = 0.04, (e) z = 0.05, and (f) the dependence of band gaps on z
The room temperature PLE and PL spectra of the BaWO4: xDy3+(x = 0.01–0.05) phosphors are shown in Fig. 5. The PLE spectrum monitored at 571 nm consists of a wide absorption band because of the O2−→W6+ charge transfer band (CTB) and several bands located at 327, 351, 367, 389 and 427 nm, which are corresponded to the electronic transitions of Dy3+ from 6H15/2 to 6P3/2, 6P7/2, 6P5/2, 4I13/2 and 4G11/2, respectively [37]. Under the excitation at 351 nm, the characteristic emission peaks of the BaWO4: xDy3+(x = 0.01–0.05) phosphors are located at 482, 571 and 660 nm, which are ascribed to the transitions from the 4F9/2 to the 6H15/2, 6H13/2 and 6H11/2, respectively. The PL emission of Dy3+ are significantly influenced by the structural defects in the crystalline lattice, which will break the symmetry of the crystal structure and makes the electric dipole transition (yellow light) significantly stronger than the magnetic dipole transition (blue light). Fig. 4b shows the PL emission spectra of BaWO4: xDy3+(x = 0.01–0.05) phosphors upon 351 nm excitation. It can be seen that the emission intensity increased with the concentration of Dy3+ increasing to 0.03, and then declined due to the concentration quenching. The increase in emission intensity is mainly due to two reasons: on the one hand, the increase in the emission center, on the other hand, the reduction of the band gap enhance the charge transfer process between the WO4 and REO6, which corresponded with the literature reported previously [38]. The concentration quenching mainly arises from an increase in probability of non-radiative interaction with increasing distance between Dy3+ ions at higher concentrations. The critical distance Rccan be calculated by the following equation [39]:
where V stands for the unit cell volume, xc is the critical concentration, at which the emission intensity of Dy3+ reaches to maximum value, and N is the number of available sites for the dopant in the unit cell. For BaWO4 host, V = 399.17 Å3, N = 4 and xc = 0.03. Hence, the Rc = 17.54 Å. When the concentration of Dy3+ exceeded 0.03, the non-radiative transfer among Dy3+ ions giving rise to the decrease of fluorescence intensity.
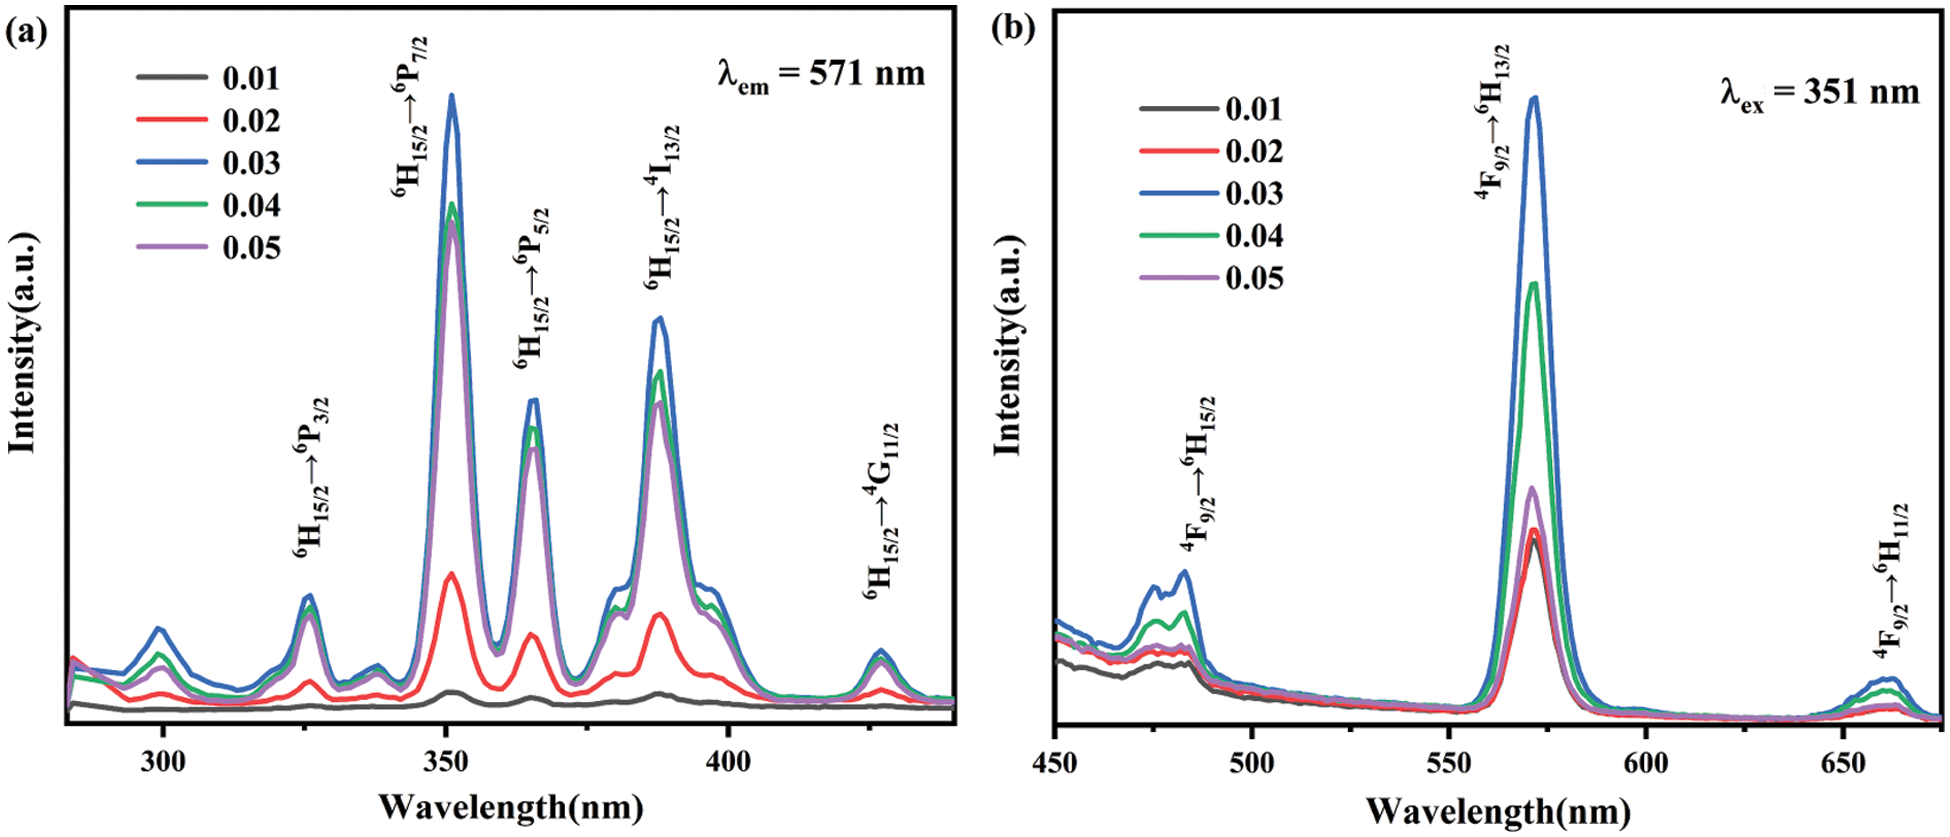
Figure 5: (a) The excitation spectra of BaWO4: xDy3+(x = 0.01–0.05), (b) the emission spectra of BaWO4: xDy3+(x = 0.01–0.05)
As shown in Fig. 6a, the PLE spectra of BaWO4: 0.03Tm3+ and BaWO4: 0.03Dy3+ phosphors are monitored at 451 and 571 nm, respectively. The BaWO4: 0.03Tm3+ shows blue emission at 451 nm, which was ascribed to the 1D2→3F4 transition (451 nm) of the Tm3+ ions upon excitation at 360 nm [40]. There is an obvious overlap part between the excitation peak of Dy3+ peaking at 454 nm (6H15/2→4I15/2) and the emission peak of Tm3+ peaking at 451 nm (1D2→3F4), indicating Tm3+ ions can be employed as efficient sensitizers for Dy3+ emission. And it also indicating that the light of the overlap can excite Dy3+ and Tm3+ in BaWO4: Dy3+, Tm3+ phosphor concurrently. So we selected 356 and 365 nm which are corresponding to the intersection point of the PLE curves of BaWO4: 0.03Tm3+ and BaWO4: 0.03Dy3+ as the excitation wavelength. Fig. 6b present the emission spectra of BaWO4: 0.03Dy3+, 0.01Tm3+ phosphors excited by 351, 356, 360 and 365 nm, respectively. The excitation peaks at 351 and 360 nm are attributed to the transition 6H15/2→6P7/2 of Dy3+ and the transition 3H6→1D2 of Tm3+, separately. With a change of the lights, the emission intensity at 451 nm of Tm3+ first increase then decrease and the emission intensity at 481 and 571 nm of Dy3+ are contrary to the emission intensity of Tm3+. When excitation peaks at 351 nm, the emission intensity at 451 nm of Tm3+ is too weak to change the color of light. And the luminescence intensity of Dy3+ at 360 nm is much lower than that at 351 nm. So, we selected 356 and 365 nm excited Dy3+ and Tm3+ co-doped phosphors.
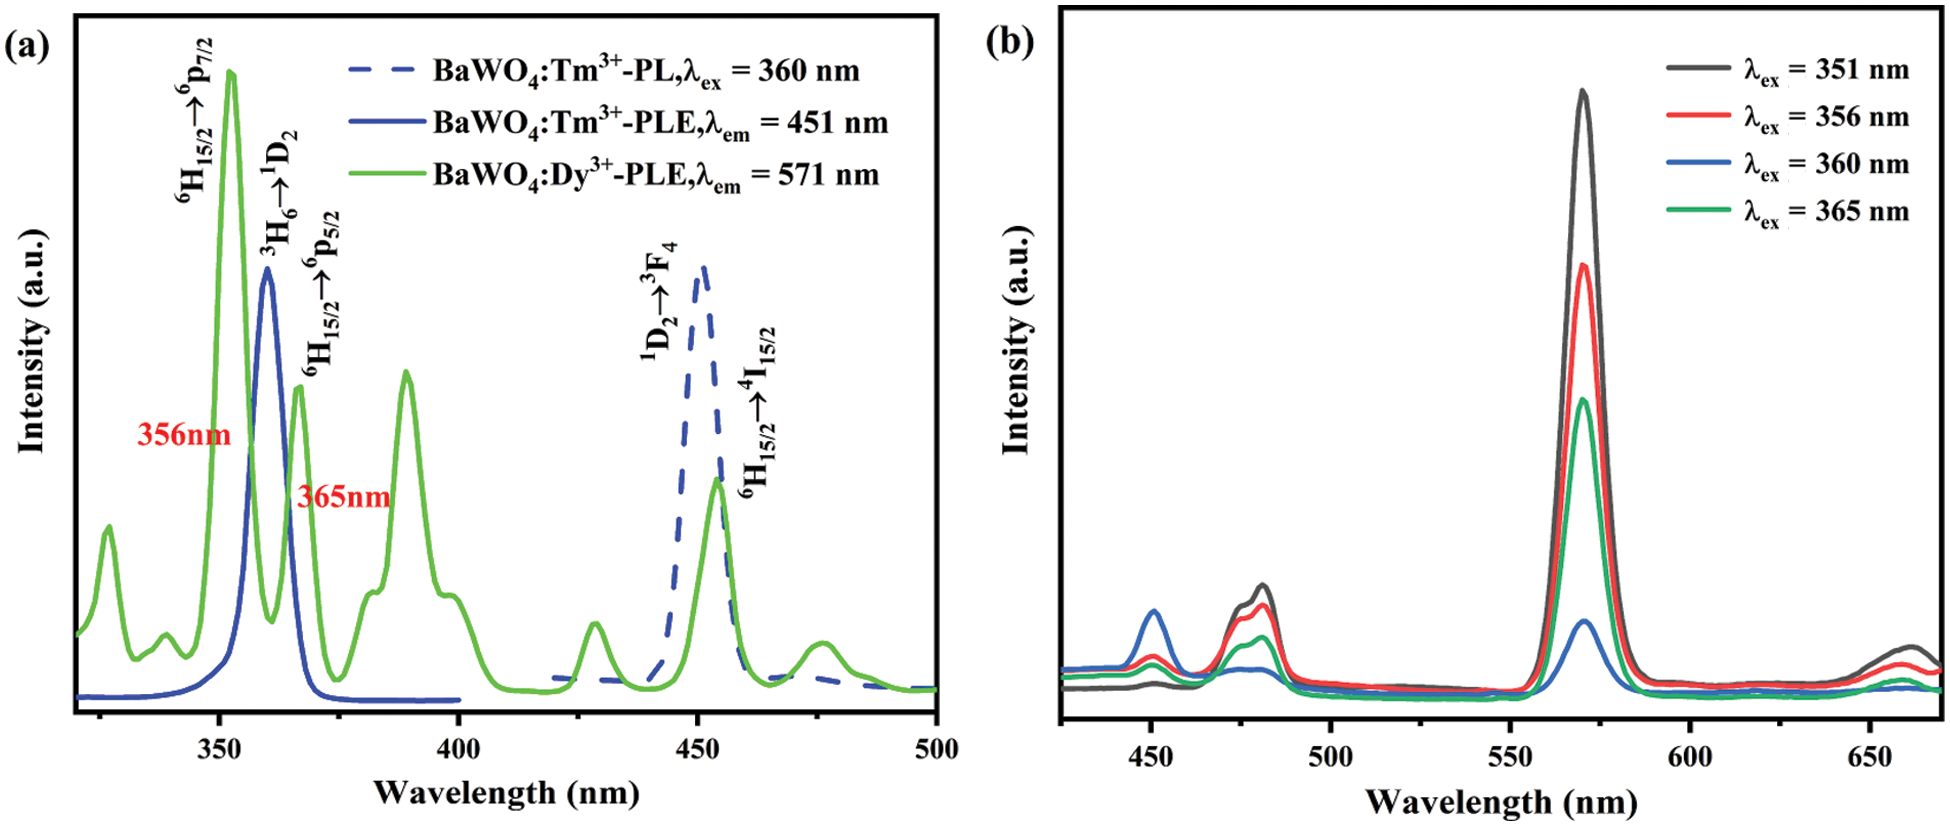
Figure 6: (a) The PL and PLE spectra of BaWO4: Tm3+ (blue) and PLE spectrum of BaWO4: Dy3+ (green), (b) the PL spectra of BaWO4: 0.03Dy3+, 0.01Tm3+ under different excitation light
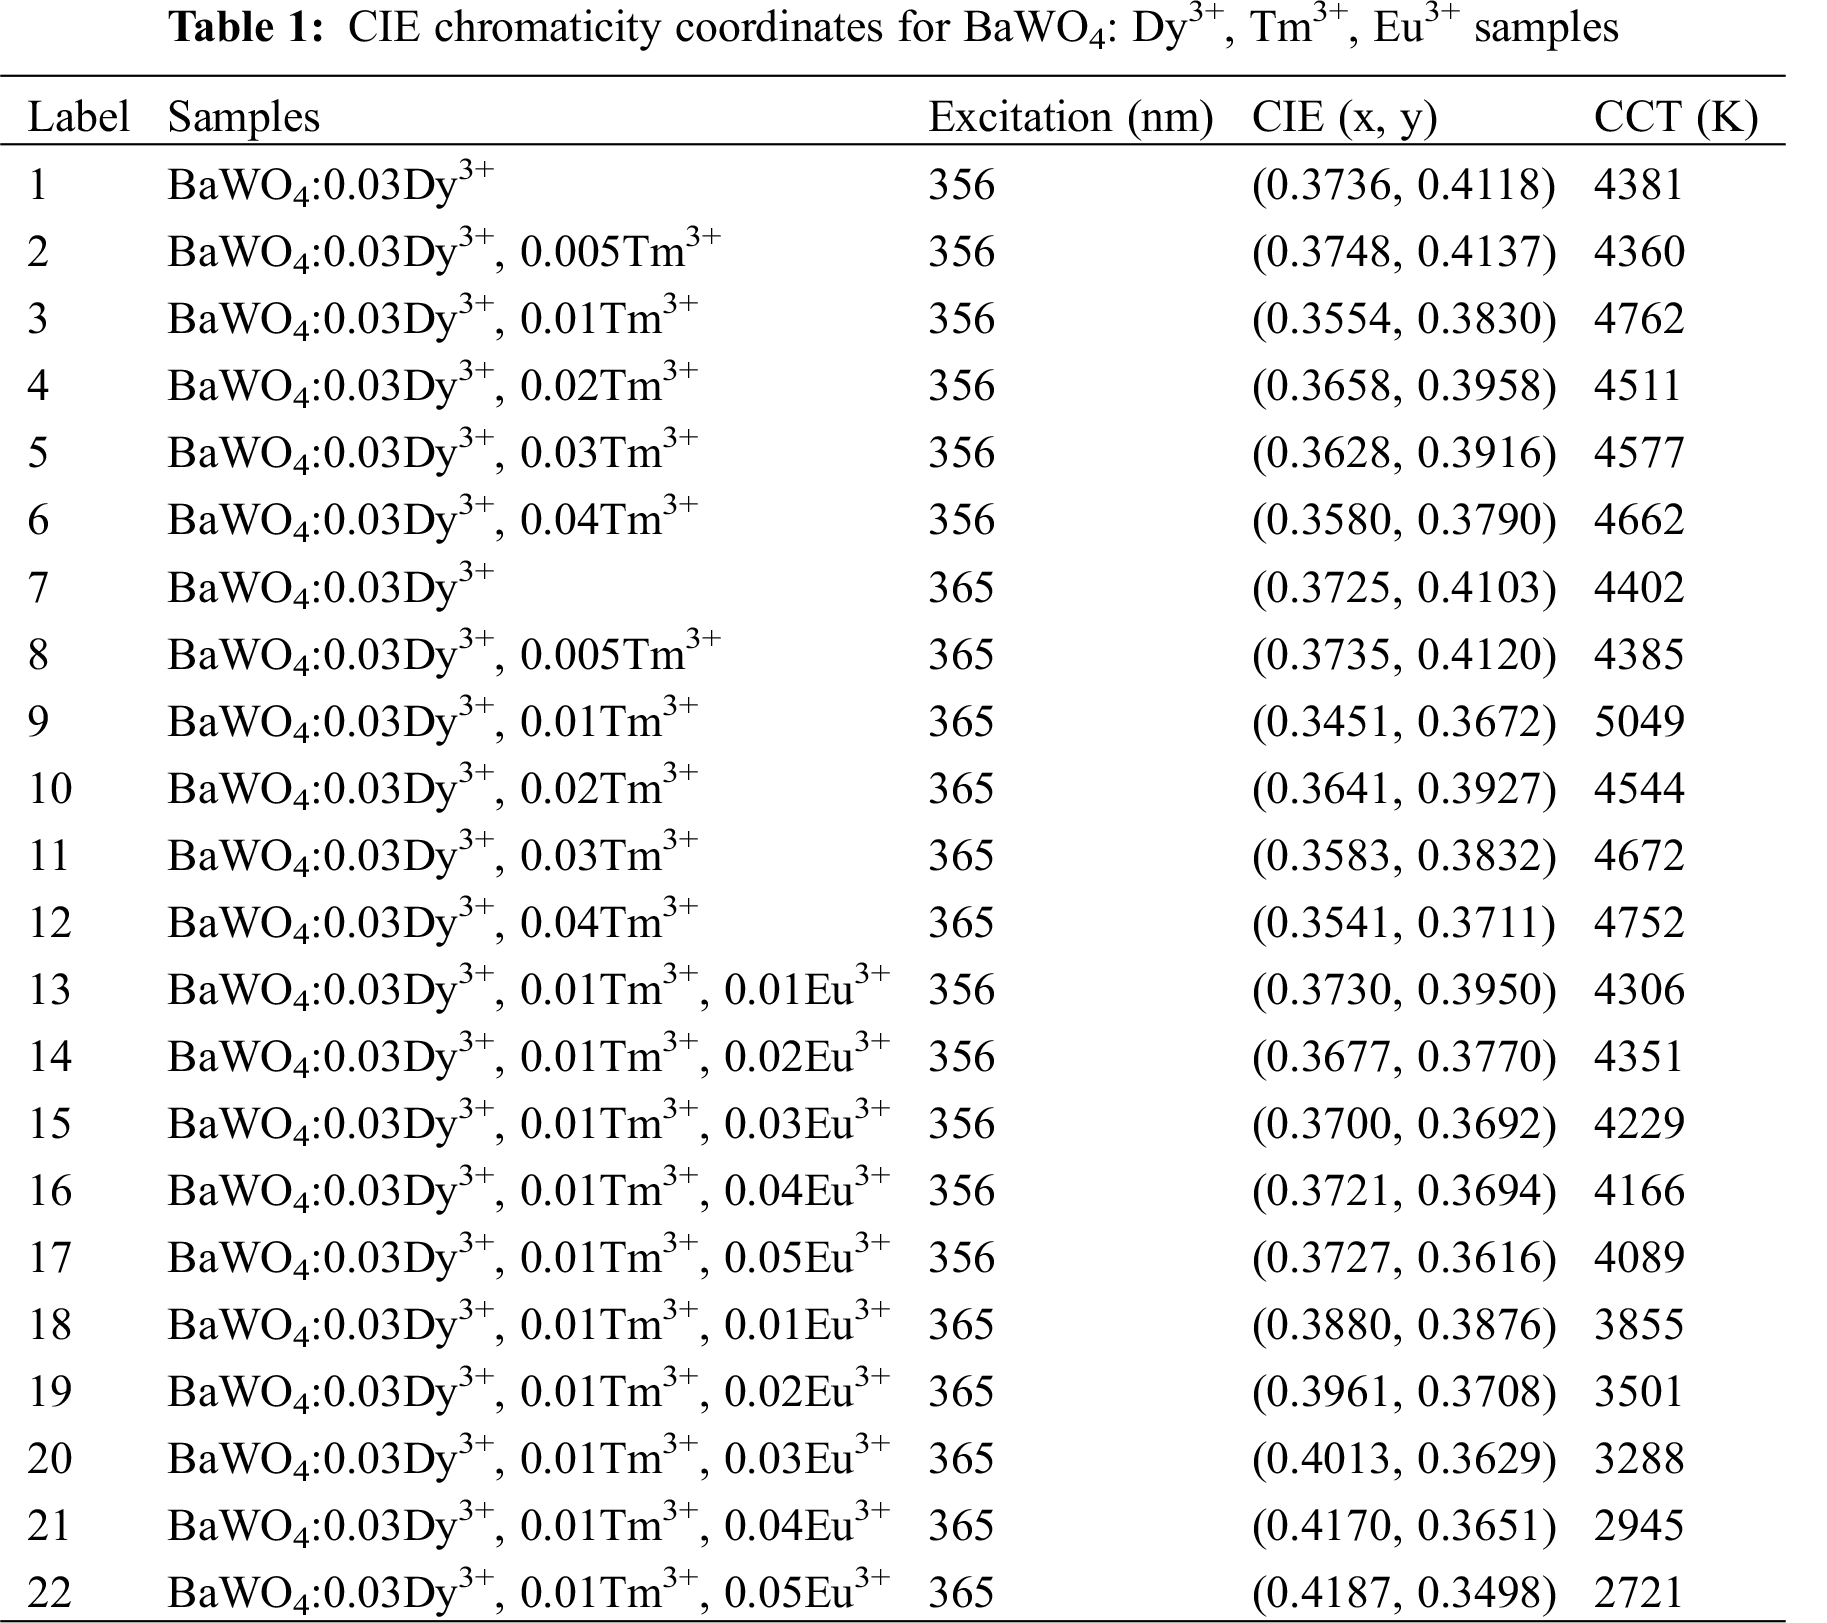
For purpose of tuning the color of the emitted light, a series of BaWO4: 0.03Dy3+, yTm3+ (y = 0, 0.005, 0.01, 0.02, 0.03 and 0.04) were synthesized in this work. As shown in Fig. 7, under 356 nm light excitation, the emission peaks at 451 nm correspond to the transitions of Tm3+ and the emission peaks at 481 and 571 nm are attributed to the transitions of Dy3+. Fig. 7 inset showed the change of emission intensities peaking at 451, 481 and 571 nm on Tm3+ concentration. With the concentration of Tm3+ increasing, the emission intensity of Tm3+ centered at 451 nm are gradual increasing, whereas that of Dy3+ first increase and then decrease. This phenomenon shows that there is an energy transfer between Dy3+ and Tm3+ in them co-doped phosphors. As shown in Fig. S4., under 365 nm light excitation, the same phenomenon happened with exciting at 356 nm. Tab. 1 shows the Commission International de I’Eclairage (CIE) chromaticity of BaWO4: 0.03Dy3+, yTm3+ and the CIE diagrams are shown in Figs. 11a and 11b. Because of the enhancing emission of Tm3+ and the weakening emission of Dy3+, the CIE coordinates moved to the blue region except the BaWO4: 0.03Dy3+, 0.005Tm3+ sample. When the doping concentration of Tm3+ is 0.005, the emission of Dy3+ enhanced and CIE coordinates shifted toward the yellow region. The CCT values can be calculated by the equation [41]:
where n = (x − 0.332)/(y − 0.186). And the results also shown in Tab. 1. It can be clearly seen that the CCT are more than 4000 K and belongs to the cold white light.
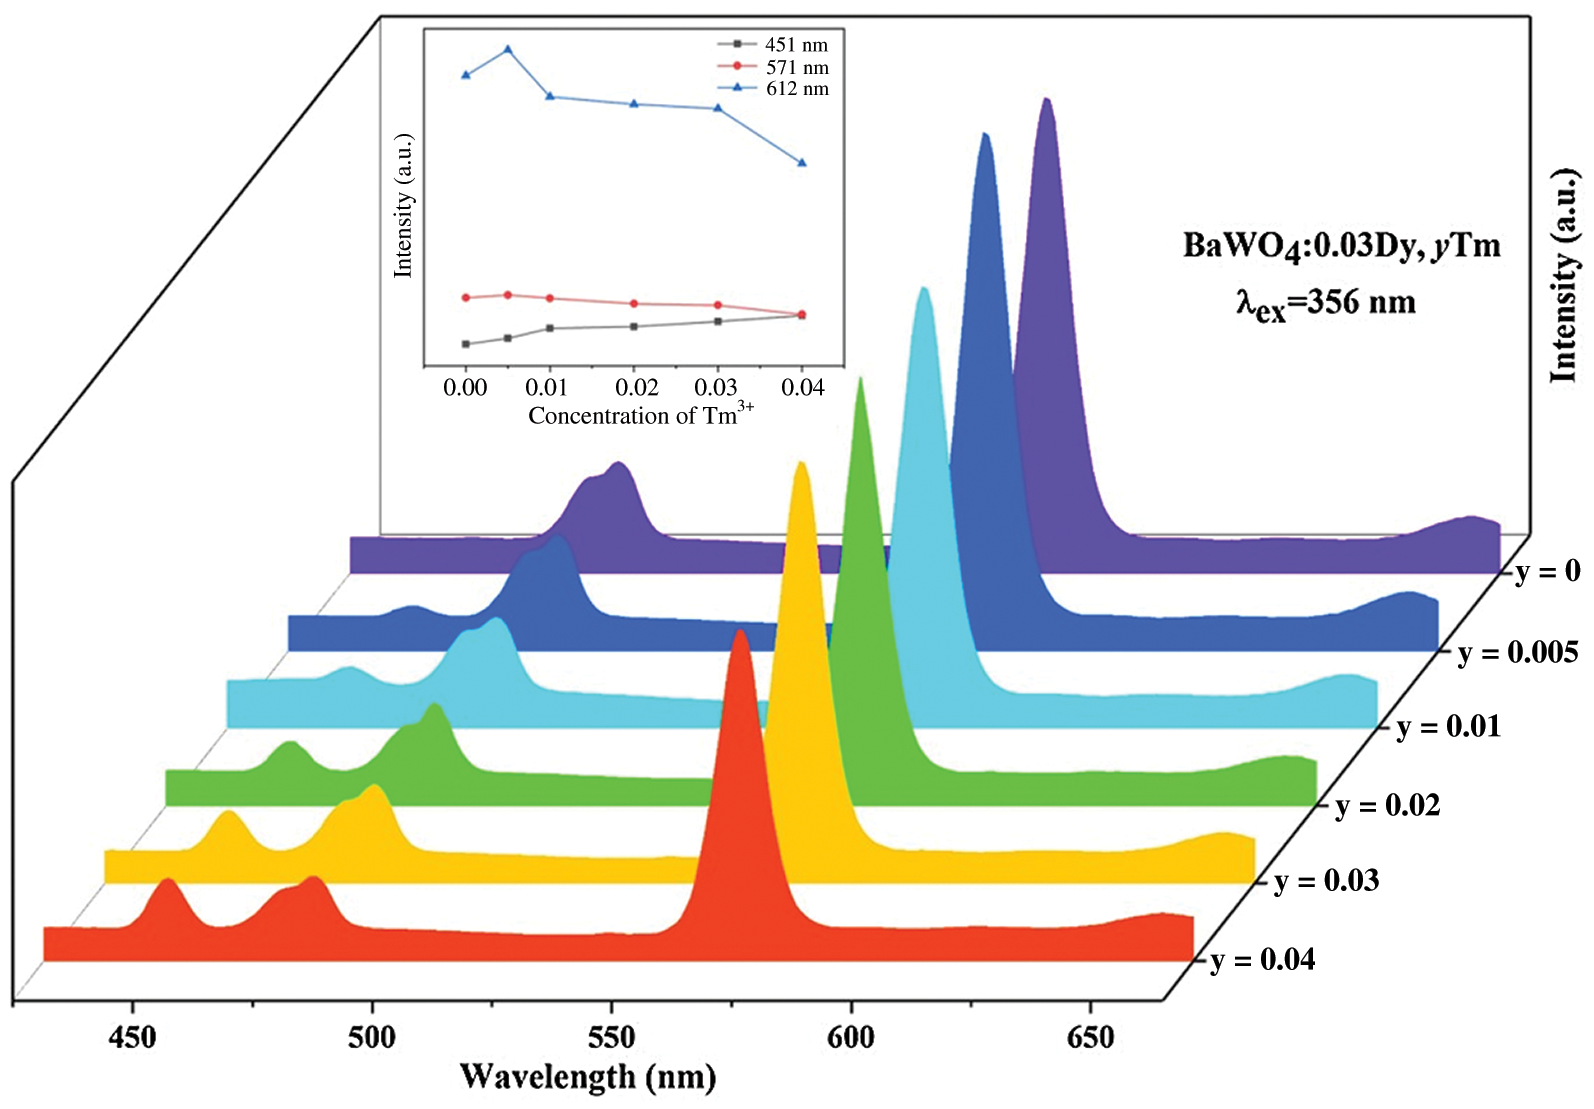
Figure 7: PL spectra of BaWO4: 0.03Dy3+, yTm3+ with different Tm3+ doping concentrations excited at 356 nm. Inset shows dependence of emission intensity peaking at 451, 481 and 571 nm
In order to get warm white light, the Eu3+ ion which can supplement red light ingredients is introduced into BaWO4: 0.03Dy3+, 0.01Tm3+ phosphors. Fig. 8 depicts the PL spectrum of BaWO4: 0.03Dy3+, 0.01Tm3+ samples excited by 365 nm. And the PLE spectrum of BaWO4: 0.03Eu3+ sample monitored by 612 nm. Some main excitation band located at 363, 395, 466 and 536 nm are ascribed to the transitions of Eu3+ from 7F0 to5D4, 5L6, 5D2 and 5D1, respectively [42]. It can be distinctly seen that two overlap parts located in the range of 455–480 nm and 550–580 nm. This phenomenon shows that energy transfers among Tm3+, Dy3+ and Eu3+ ions are existed in BaWO4: Dy3+, Tm3+, Eu3+ phosphors.
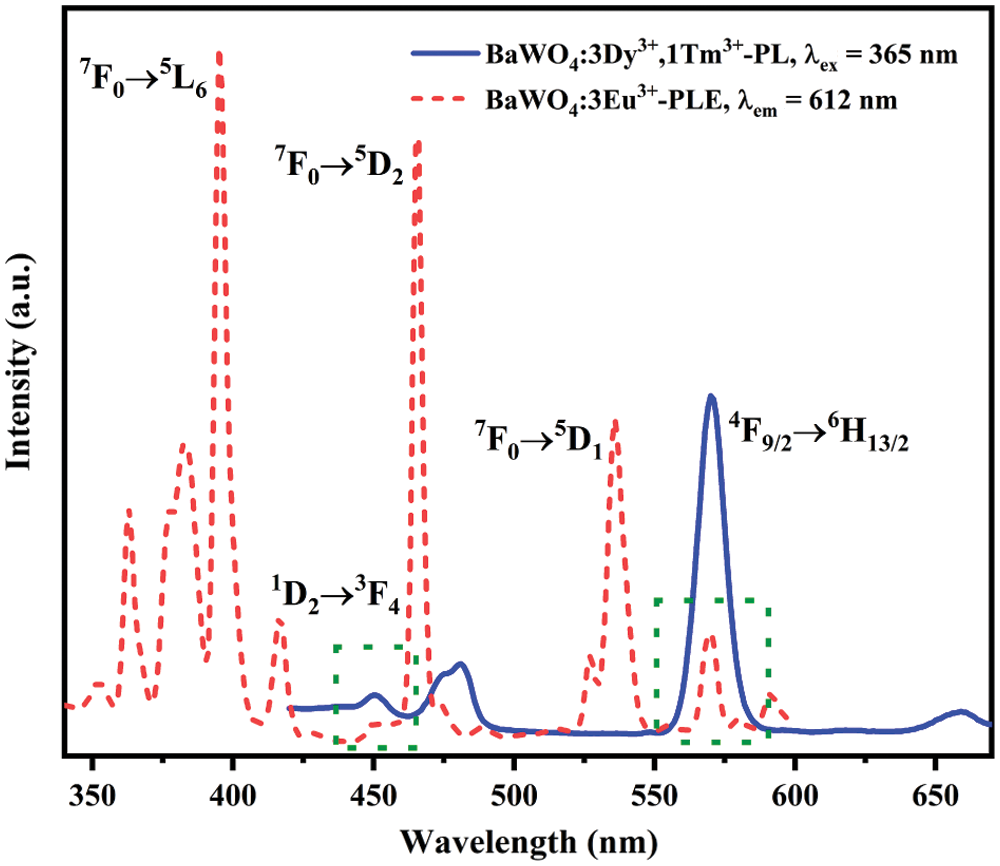
Figure 8: The PL spectrum of BaWO4: 0.03Dy3+, 0.01Tm3+ (blue) and the PLE spectrum of BaWO4: 0.03Eu3+ (red)
The purpose of this work is to tunable color to get warm white light in a single phase host. To achieve this goal, a series of BaWO4: 0.03Dy3+, Tm3+, zEu3+ (z = 0, 0.01, 0.02, 0.03, 0.04 and 0.05) were synthesized in this work. Fig. 9 shows the PL spectra of BaWO4: 0.03Dy3+, Tm3+, zEu3+ (z = 0.01, 0.02, 0.03, 0.04 and 0.05) phosphors excited at 356 and 365 nm, respectively. The emission peak at 612 nm is attributed to the transition 5D0→7F2 of Eu3+ [43]. The emission intensities peak at 451 nm (Tm3+), 571 nm (Dy3+) and 612 nm (Eu3+) with change of the concentration of Eu3+ ions are shown in inset of Figs. 9a and 9b. With the increasing content of Eu3+ ions, the Eu3+ related red emission (peak at 612 nm) increases, however the intensity of characteristic emission peaks of Dy3+ and Tm3+ decreased because of the energy transfers among the Dy3+, Tm3+ and Eu3+ ions. Under 356 nm light exciting, only one emission of Eu3+ peaks at 612 nm due to the transition 5D0→7F2 can be identified and that has a low emission intensity. This suggests that the light of 356 nm cannot effectively excite Eu3+ ions. Whereas, upon excitation at 365 nm, two characteristic peaks appeared: electric dipole transition 5D0→7F2 peak at 612 nm and magnetic dipole transition 5D0→7F1 peak at 588 nm. And electric dipole transition intensity is much stronger than magnetic dipole transition intensity, which means that Eu3+ ions occupied the non-inversion symmetry center in the matrix material lattice [44]. The CIE coordinates and CCT of this series of BaWO4: 0.03Dy3+, Tm3+, zEu3+ phosphors are also calculated and shown in Tab. 1. Due to the red emission of Eu3+ ions, CIE coordinates shifted toward to the red region and the CCT have decreased.
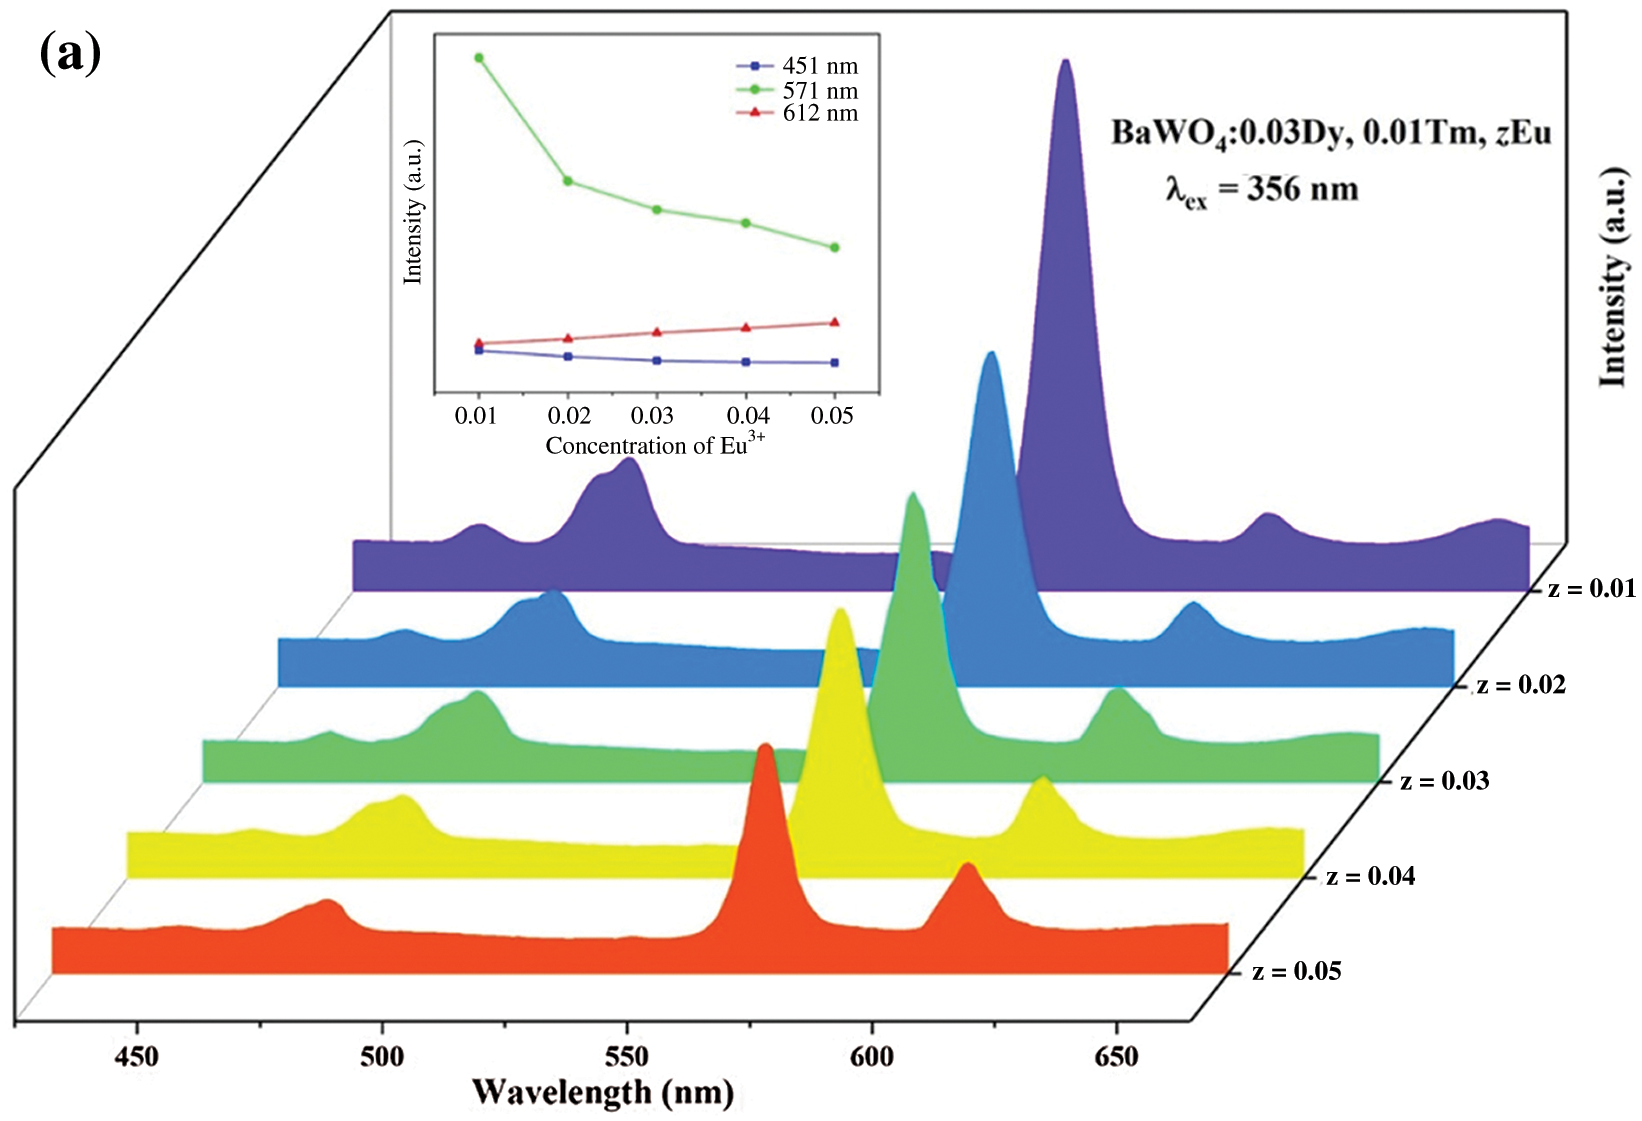
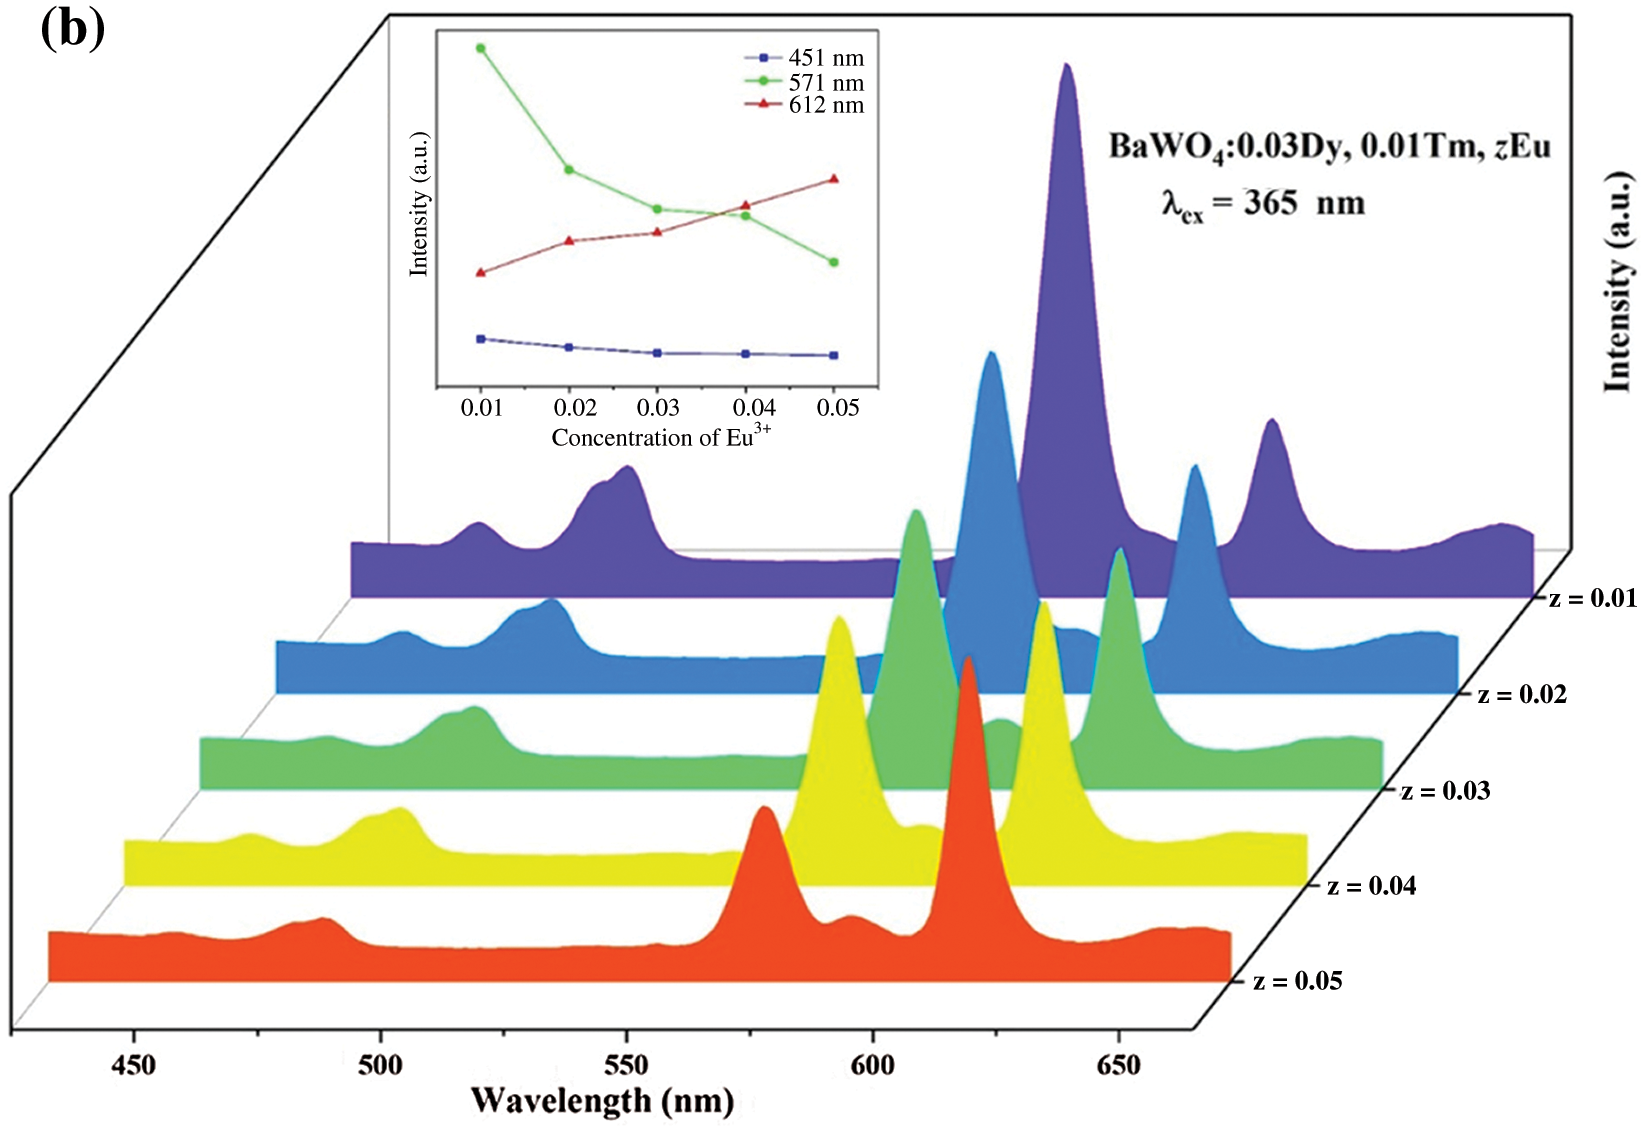
Figure 9: The PL spectra (a) λex = 356 nm and (b) λex = 365 nm of BaWO4: Dy3+, Tm3+, zEu3+ (z = 0.01–0.05) phosphors. Inset shows dependence of emission intensity peaking at 451, 571 and 612 nm
For a better understand the energy transfer mechanism among Tm3+, Dy3+ and Eu3+ ions, a possible schematic diagram is shown in Fig. 10. According to the results of the previous calculation, when the Tm3+, Dy3+ and Eu3+ ions doping into the BaWO4, the band gap is decreasing, which indicates that the 2 p electron of O2− are more easily jumped to the 5 d orbit of W6+ in WO42− under UV excitation and then a part of the energy is released in the form of light, and the other part is transferred to the RE ions. On the other hand, under UV excitation, for example ground state (3H6) electrons of Tm3+ will absorb energy and jump to a higher energy state (1D2). And then some excited electrons returned to the lower energy level (1D2→3F4) and the excess energy was released as light. Some high energy states electrons returned to lower energy level (1D2→1G4) by non-radiative (NR) transition and returns to a lower energy level (1G4→3H6) by emitting light. As for Dy3+ and Eu3+, ground state electrons first jumped to a higher energy state, then fell to lower energy states by NR, and finally fell to lower energy states by emitting different colors of light such as yellow light (4F9/2→6H13/2) of Dy3+ and red light (5D0→7F2) of Eu3+ [45]. Moreover, combining with the Figs. 6a and 8, the blue emission (1D2→3F4) of Tm3+ can excited the ground state (6H15/2) electrons of Dy3+ to excitation state (4I15/2) and then electrons fell back to lower energy states by NR and emitting light.
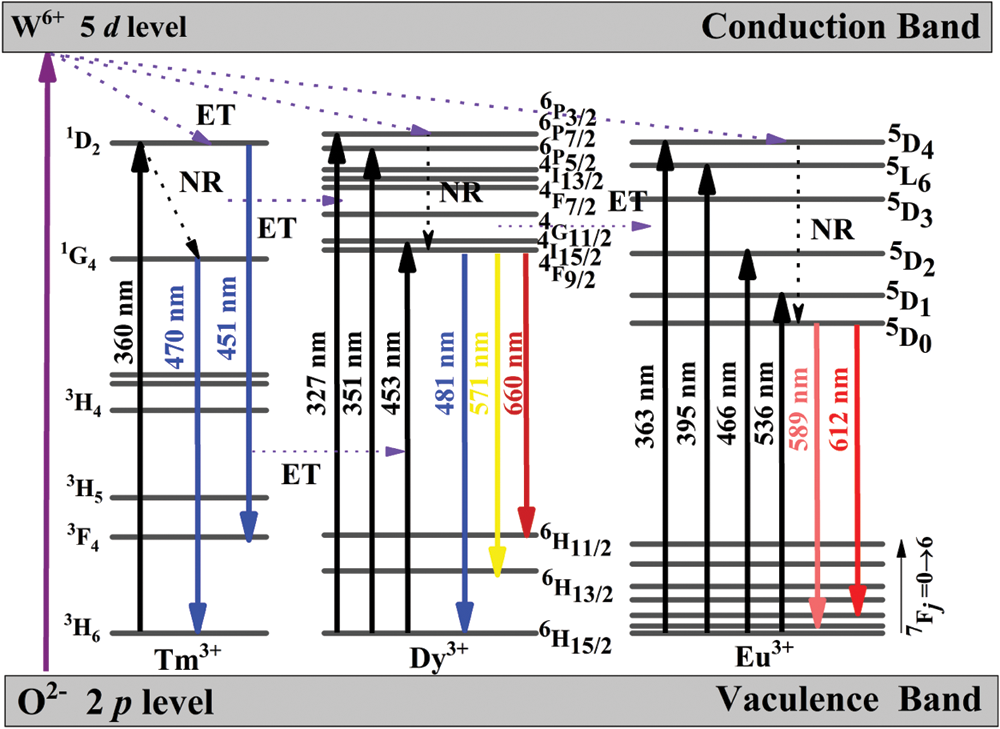
Figure 10: A schematic energy level diagram indicating energy transfer progresses under UV excitation. NR and ET stand for non-radiation transition and energy transfer, respectively
For a better catching on the actual emission color of the phosphor, the CIE chromaticity coordinates and CCT for BaWO4: xDy3+, yTm3+, zEu3+ phosphors are calculated by the emission spectra excited at different lights and the consequences are shown in Tab. 1 and Fig. 11. The doping concentration of Dy3+ is fixed at 0.03, with the doping of Tm3+ increasing, under 356 and 365 nm excitation, the emitting color of the phosphors are modulated from yellow to blue as shown in Fig. 11a (Points 1–6) and (b) (Points 7–12). As for BaWO4: 0.03Dy3+, yTm3+ (y = 0, 0.005, 0.01, 0.02, 0.03 and 0.04) phosphors, all CIE coordinates locate in white light area. But the CCT of BaWO4: 0.03Dy3+, yTm3+ (y = 0, 0.005, 0.01, 0.02, 0.03 and 0.04) phosphors are more than 4000 K, which cannot be used as warm white light. Therefore, a series of BaWO4: 0.03Dy3+, 0.01Tm3+, zEu3+ (z = 0, 0.01, 0.02, 0.03, 0.04 and 0.05) phosphors were been synthesized. Under excitation at 356 and 365 nm, the CIE coordinates move to the red area by increasing of Eu3+ content and are shown in Fig. 11c (point 13–17) and (d) (Points 18–22). Especially, under excitation at 356 nm, the coordinate of BaWO4: 0.03Dy3+, 0.01Tm3+, 0.03Eu3+ is (0.4013, 0.3629) and the CCT is 3288 K, which meets the requirements of warm white light. And the digital photographs of BaWO4: 0.03Dy3+, 0.01Tm3+, 0.02Eu3+ and BaWO4: 0.03Dy3+, 0.01Tm3+, 0.03Eu3+ phosphors excited at 365 nm and shown in Fig. 11d.
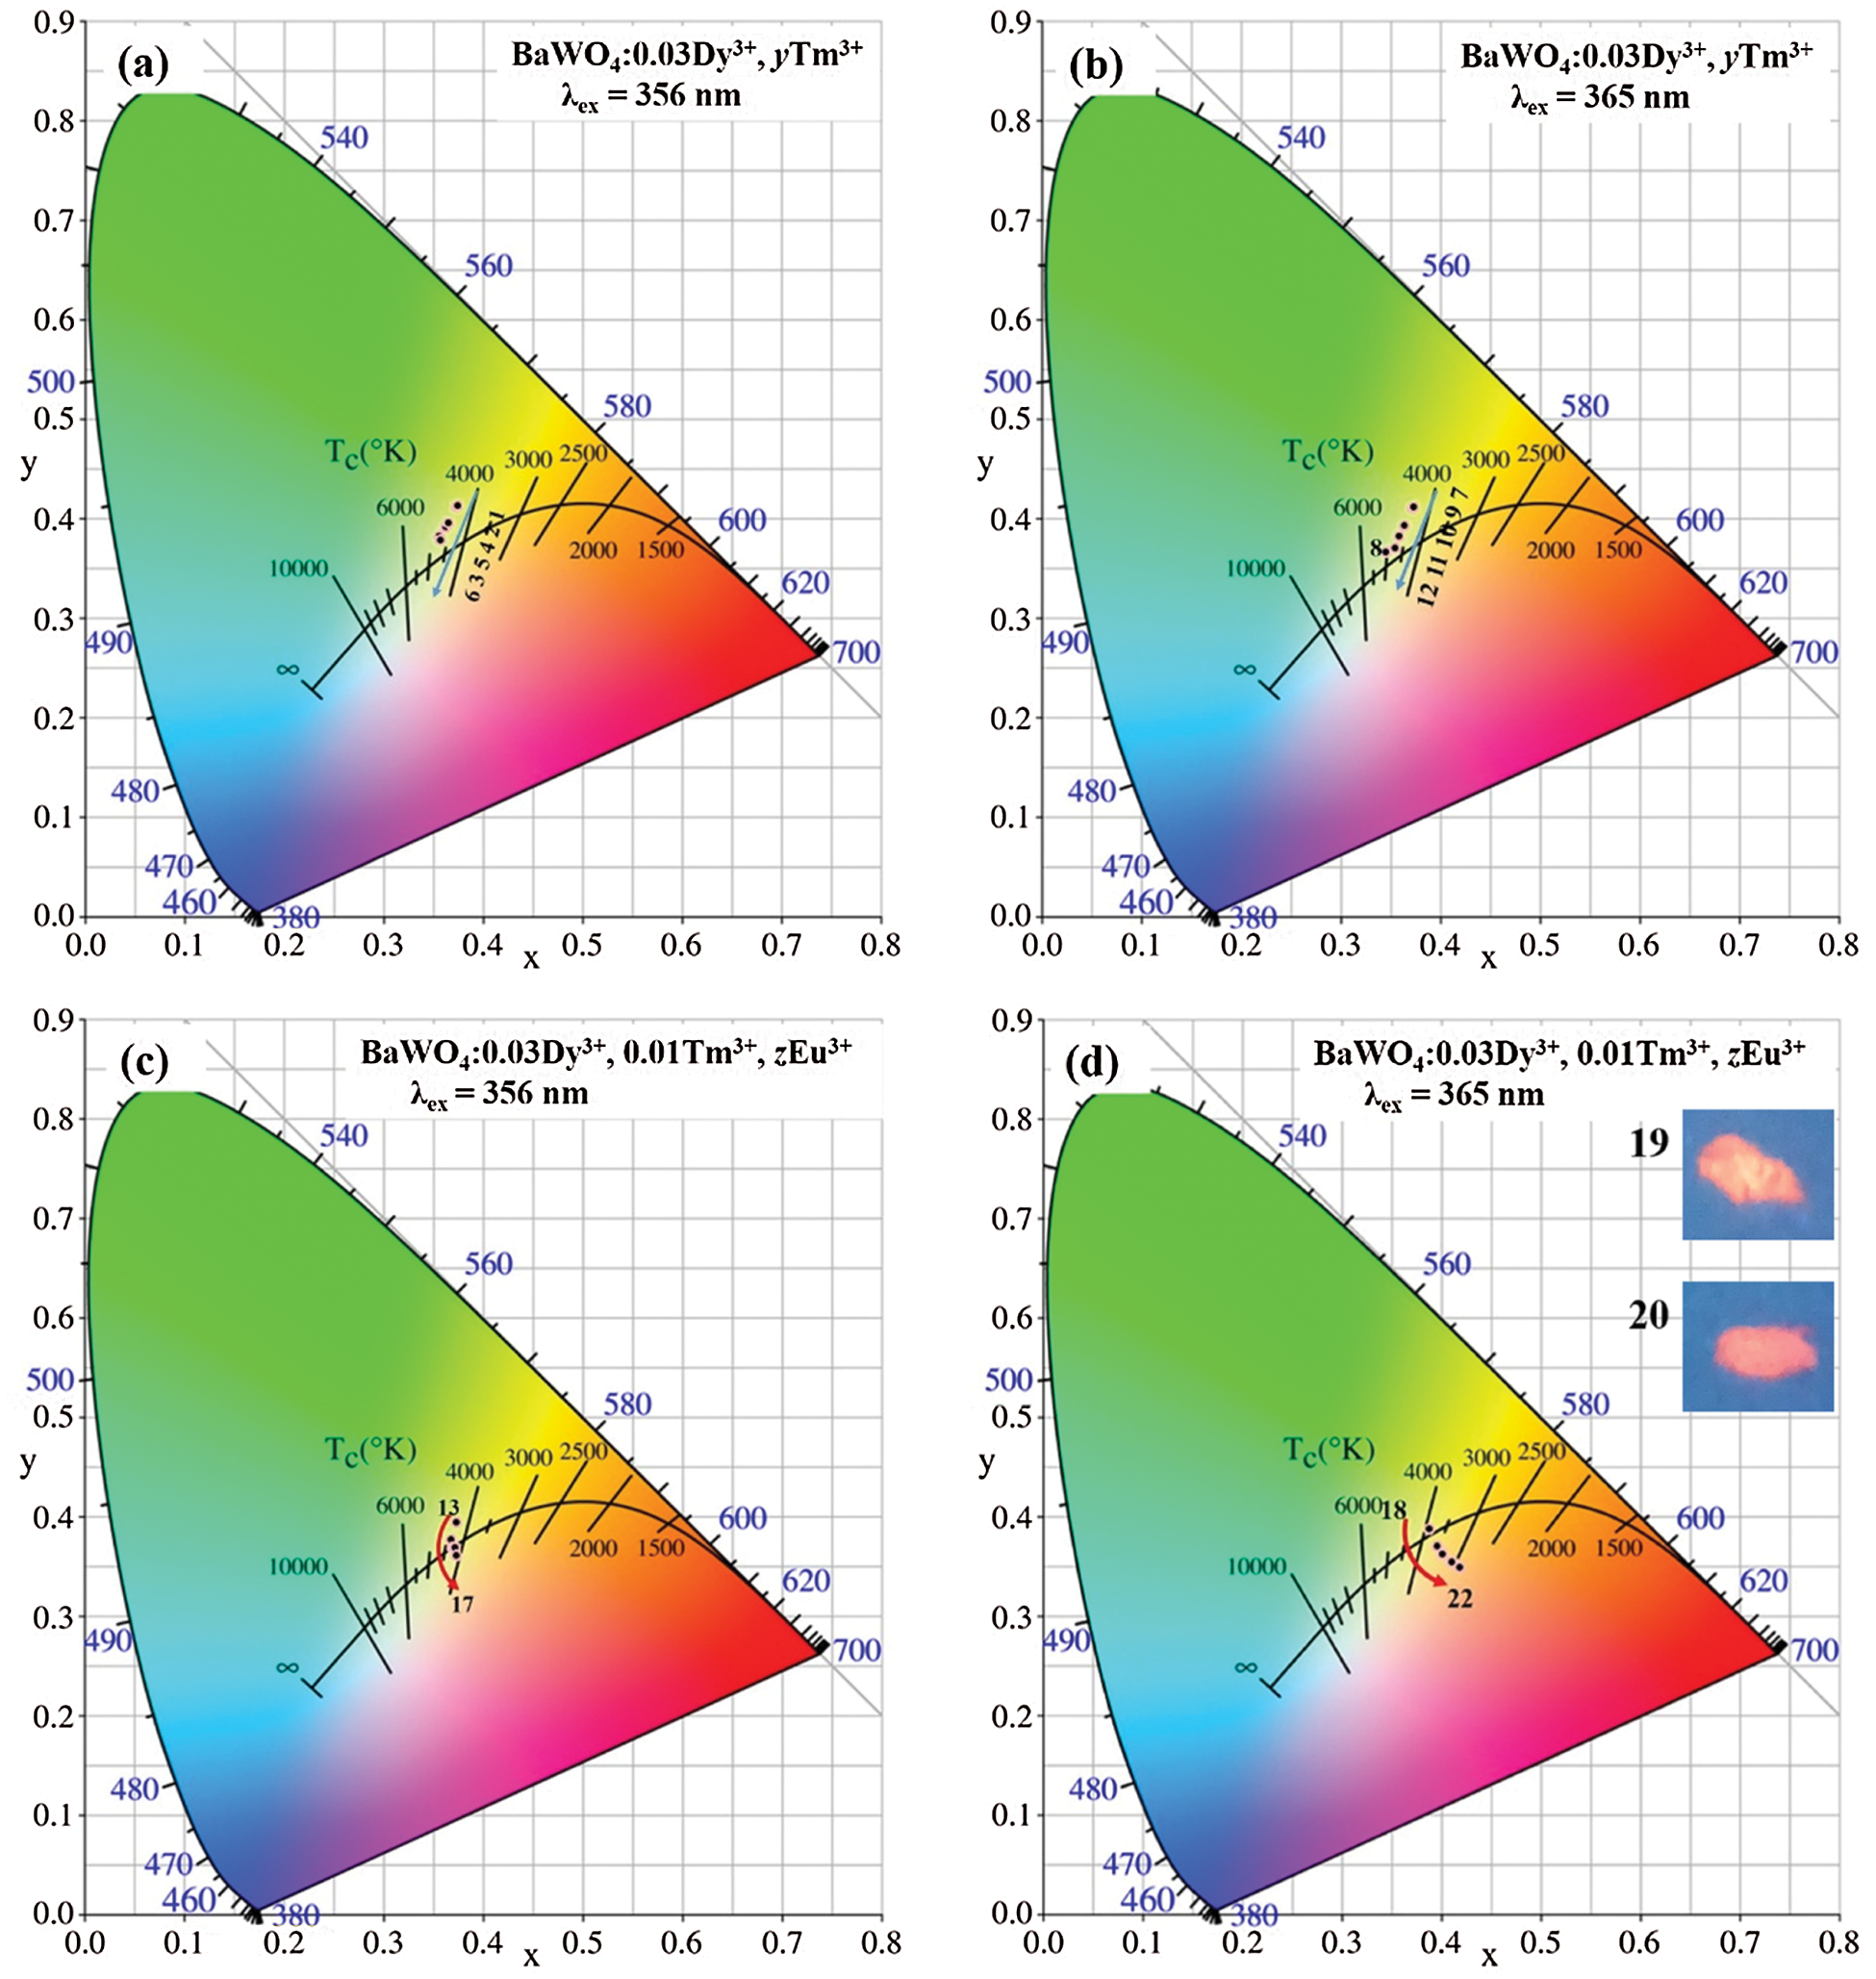
Figure 11: CIE chromaticity diagram of BaWO4: Dy3+, Tm3+, Eu3+ samples
In summary, a series of uniform single-phase color-tunable spherical BaWO4: xDy3+, yTm3+, zEu3+ phosphors were synthesized by microwave hydrothermal method. The XRD patterns and SEM images illustrate that the doping of RE ions does not significantly change the crystal structure and morphology. According to the DFT calculations, the doping of RE ions will causes the bands gap to decrease due to both the VB maximum and CB minimum are both changed by the substitution of the RE3+ cation electronic states. The reduction of the band gap is conducive to electron transition and thus to increase the luminescence intensity. For the BaWO4: xDy3+ phosphors, the quenching concentrations of Dy3+ were 0.03. With increasing Tm3+ concentration, emission colors of BaWO4: 0.03Dy3+, yTm3+ phosphors were properly tuned from yellow to blue. By supplement red component of light, single-phased phosphors BaWO4: Dy3+, Tm3+, Eu3+ with warm white light were prepared. Under 365 nm excitation, the CIE coordinate of BaWO4: 0.03Dy3+, 0.01Tm3+, 0.03Eu3+ was (0.4013, 0.3629) and the CCT was 3288 K, which could be a favorable candidate in warm white LEDs.
Funding Statement: This work was supported by Priority Academic Program Development (PAPD) of Jiangsu Higher Education Institutions.
Conflicts of Interest: The authors declare that they have no conflicts of interest to report regarding the present study.
1. Huang, X., Sun, Q., Devakumar, B. (2020). Facile low-temperature solid-state synthesis of efficient blue-emitting Cs3Cu2I5 powder phosphors for solid-state lighting. Materials Today Chemistry, 17, 100288. DOI 10.1016/j.mtchem.2020.100288. [Google Scholar] [CrossRef]
2. Xia, Z., Xu, Z., Chen, M., Liu, Q. (2016). Recent developments in the new inorganic solid-state LED phosphors. Dalton Transactions, 45, 11214–11232. DOI 10.1039/C6DT01230B. [Google Scholar] [CrossRef]
3. Xia, Z., Liu, Q. (2016). Progress in discovery and structural design of color conversion phosphors for LEDs. Progress in Materials Science, 84, 59–117. DOI 10.1016/j.pmatsci.2016.09.007. [Google Scholar] [CrossRef]
4. George, N. C., Denault, K. A., Seshadri, R. (2013). Phosphors for solid-state white lighting. Annual Review of Materials Research, 43, 481–501. DOI 10.1146/annurev-matsci-073012-125702. [Google Scholar] [CrossRef]
5. Pust, P., Schmidt, P. J., Schnick, W. (2015). A revolution in lighting. Nature Materials, 14, 454. DOI 10.1038/nmat4270. [Google Scholar] [CrossRef]
6. Shen, B., Chen, B., Zhang, Y., Hu, J. (2020). A study of optical properties and site preference of Bi3+/Eu3+ co-doped CaLa4Si3O13 red-emitting phosphors for w-lED applications. Journal of Luminescence, 218, 116821. DOI 10.1016/j.jlumin.2019.116821. [Google Scholar] [CrossRef]
7. Yang, C., Liang, X., Di, X., Li, P., Hu, G. et al. (2016). Facile fabrication and luminescence characteristics of Ce: YAG phosphor glass thick films coated on a glass substrate for white LEDs. Ceramics International, 42, 14526–14532. DOI 10.1016/j.ceramint.2016.06.065. [Google Scholar] [CrossRef]
8. Jin, Y., Zhang, J., Lü, S., Zhao, H., Zhang, X. et al. (2008). Fabrication of Eu3+ and Sm3+ codoped micro/Nanosized MMoO4 (M = Ca, Ba, and Sr) via facile hydrothermal method and their photoluminescence properties through energy transfer. The Journal of Physical Chemistry C, 112, 5860–5864. DOI 10.1021/jp800559f. [Google Scholar] [CrossRef]
9. Wang, S., Devakumar, B., Sun, Q., Liang, J., Sun, L. et al. (2020). Highly efficient near-uV-excitable Ca2YHf2Al3O12:Ce3+, Tb3+ green-emitting garnet phosphors with potential application in high color rendering warm-white LEDs. Journal of Materials Chemistry C, 8, 4408–4420. DOI 10.1039/D0TC00130A. [Google Scholar] [CrossRef]
10. Huang, X., Liang, J., Rtimi, S., Devakumar, B., Zhang, Z. (2021). Ultra-high color rendering warm-white light-emitting diodes based on an efficient green-emitting garnet phosphor for solid-state lighting. Chemical Engineering Journal, 405, 126950. DOI 10.1016/j.cej.2020.126950. [Google Scholar] [CrossRef]
11. Terraschke, H., Wickleder, C. (2015). UV, blue, green, yellow, Red, and small: Newest developments on Eu2+-Doped nanophosphors. Chemical Reviews, 115, 11352. DOI 10.1021/acs.chemrev.5b00223. [Google Scholar] [CrossRef]
12. Wei, R., Yang, L., Zhang, X., Tian, X., Peng, X. et al. (2020). Energy transfer and highly thermal stability in single-phase SrY2O4: Bi3+, Sm3+ phosphors for UV-lEDs. Journal of Luminescence, 228, 117606. DOI 10.1016/j.jlumin.2020.117606. [Google Scholar] [CrossRef]
13. Zhao, W., Wen, H., Fan, B., Li, H., Hao, M. (2019). Preparation and luminescent properties of tunable polychromatic phosphors CaNaB5O9: RE3+ (RE = Dy, Eu, Tb). Optical Materials, 96, 109274. DOI 10.1016/j.optmat.2019.109274. [Google Scholar] [CrossRef]
14. Su, L., Fan, X., Cai, G., Jin, Z. (2016). Tunable luminescence properties and energy transfer of Tm3+, Dy3+, and Eu3+ co-activated InNbO4 phosphors for warm-white-lighting. Ceramics International, 42, 15994–16006. DOI 10.1016/j.ceramint.2016.07.105. [Google Scholar] [CrossRef]
15. Guan, H., Sheng, Y., Song, Y., Xu, C., Zhou, X. et al. (2017). YF3: RE3+ (RE = Dy, Tb, Eu) Sub-microstructures: Controllable morphology, tunable multicolor, and thermal properties. The Journal of Physical Chemistry C, 121, 23080–23095. DOI 10.1021/acs.jpcc.7b07879. [Google Scholar] [CrossRef]
16. Thongtem, T., Kungwankunakorn, S., Kuntalue, B., Phuruangrat, A., Thongtem, S. (2010). Luminescence and absorbance of highly crystalline CaMoO4, SrMoO4, CaWO4 and SrWO4 nanoparticles synthesized by co-precipitation method at room temperature. Journal of Alloys and Compounds, 506, 475–481. DOI 10.1016/j.jallcom.2010.07.033. [Google Scholar] [CrossRef]
17. Shan, Z., Wang, Y., Ding, H., Huang, F. (2009). Structure-dependent photocatalytic activities of MWO4 (M = Ca, Sr, Ba). Journal of Molecular Catalysis A: Chemical, 302, 54–58. DOI 10.1016/j.molcata.2008.11.030. [Google Scholar] [CrossRef]
18. Kamal, R., Saif, M. (2020). Barium tungstate doped with terbium ion green nanophosphor: Low temperature preparation, characterization and potential applications. Spectrochimica Acta Part A: Molecular and Biomolecular Spectroscopy, 229, 117928. DOI 10.1016/j.saa.2019.117928. [Google Scholar] [CrossRef]
19. Nikl, M., Bohacek, P., Mihokova, E., Kobayashi, M., Ishii, M. et al. (2000). Excitonic emission of scheelite tungstates AWO4 (A = Pb, Ca, Ba, Sr). Journal of Luminescence, 87–9, 1136–1139. DOI 10.1016/S0022-2313(99)00569-4. [Google Scholar] [CrossRef]
20. Zhang, J., Chen, G. (2019). A long-persistent phosphor Sr3MgSi2O8–1.5xNx: Eu2+, Dy3+, Mn2+ based on white LEDs applications. Journal of Luminescence, 211, 69–75. DOI 10.1016/j.jlumin.2019.03.027. [Google Scholar] [CrossRef]
21. Fan, M., Liu, S., Yang, K., Guo, J., Wang, J. et al. (2020). Fast synthesis and energy transfer of the tunable single-phase white-emitting phosphor Li2Gd4(WO4)7: Dy3+, Tm3+ for WLEDs. Ceramics International, 46, 6926–6933. DOI 10.1016/j.ceramint.2019.11.189. [Google Scholar] [CrossRef]
22. Huang, X., Li, B., Guo, H., Chen, D. (2017). Molybdenum-doping-induced photoluminescence enhancement in Eu3+-activated CaWO4 red-emitting phosphors for white light-emitting diodes. Dyes and Pigments, 143, 86–94. DOI 10.1016/j.dyepig.2017.04.037. [Google Scholar] [CrossRef]
23. Guo, H., Huang, X., Zeng, Y. (2018). Synthesis and photoluminescence properties of novel highly thermal-stable red-emitting Na3Sc2(PO4)3: Eu3+ phosphors for UV-excited white-light-emitting diodes. Journal of Alloys and Compounds, 741, 300–306. DOI 10.1016/j.jallcom.2017.12.316. [Google Scholar] [CrossRef]
24. Huang, X., Wang, S., Li, B., Sun, Q., Guo, H. (2018). High-brightness and high-color purity red-emitting Ca3Lu(AlO)3(BO3)4: Eu3+ phosphors with internal quantum efficiency close to unity for near-ultraviolet-based white-light-emitting diodes. Optics Letters, 43, 1307–1310. DOI 10.1364/OL.43.001307. [Google Scholar] [CrossRef]
25. Mandlik, N. T., Rondiya, S. R., Dzade, N. Y., Kulkarni, M. S., Sahare, P. D. et al. (2020). Thermoluminescence, photoluminescence and optically stimulated luminescence characteristics of CaSO4: Eu phosphor: Experimental and density functional theory (DFT) investigations. Journal of Luminescence, 221, 117051. DOI 10.1016/j.jlumin.2020.117051. [Google Scholar] [CrossRef]
26. Ran, W., Noh, H. M., Moon, B. K., Park, S. H., Jeong, J. H. et al. (2018). Crystal structure, electronic structure and photoluminescence properties of KLaMgWO6: Eu3+ phosphors. Journal of Luminescence, 197, 270–276. DOI 10.1016/j.jlumin.2018.01.053. [Google Scholar] [CrossRef]
27. Carvalho, I. P., Lima, A. F., Lalic, M. V. (2019). Theoretical study of electronic and optical properties of the scheelite MWO4 (M = Ca, Sr or Ba) compounds by applying the modified becke-johnson exchange-correlation potential. Optical Materials, 92, 187–194. DOI 10.1016/j.optmat.2019.04.026. [Google Scholar] [CrossRef]
28. Cavalcante, L. S., Sczancoski, J. C., Lima, L. F., Espinosa, J. W. M., Pizani, P. S. et al. (2009). Synthesis, characterization, anisotropic growth and photoluminescence of BaWO4. Crystal Growth & Design, 9, 1002–1012. DOI 10.1021/cg800817x. [Google Scholar] [CrossRef]
29. Tranquilin, R. L., Lovisa, L. X., Almeida, C. R. R., Paskocimas, C. A., Li, M. S. et al. (2019). Understanding the white-emitting CaMoO4 Co-doped Eu3+, Tb3+, and Tm3+ phosphor through experiment and computation. The Journal of Physical Chemistry C, 123, 18536–18550. DOI 10.1021/acs.jpcc.9b04123. [Google Scholar] [CrossRef]
30. Zhang, C., Zhang, L., Song, C., Jia, G., Huo, S. et al. (2014). Well-defined barium molybdate hierarchical architectures with different morphologies: Controllable synthesis, formation process, and luminescence properties. Journal of Alloys and Compounds, 589, 185–191. DOI 10.1016/j.jallcom.2013.11.075. [Google Scholar] [CrossRef]
31. Lin, J., Yu, M., Lin, C., Liu, X. (2007). Multiform oxide optical materials via the versatile pechini-type sol-gel process: Synthesis and characteristics. The Journal of Physical Chemistry C, 111, 5835–5845. DOI 10.1021/jp070062c. [Google Scholar] [CrossRef]
32. Benmakhlouf, A., Errandonea, D., Bouhemadou, A., Bentabet, A., Maabed, S. et al. (2017). Ab initio study of the mechanical and electronic properties of scheelite-type XWO4(X = Ca, Sr, Ba) compounds. International Journal of Modern Physics B, 31, 175008612. DOI 10.1142/S0217979217500862. [Google Scholar] [CrossRef]
33. Zhu, R., Jia, K., Bi, Z., Liu, Y., Lyu, Y. (2020). Realizing white emission in Sc2(MoO4)3: Eu3+/Dy3+/Ce3+ phosphors through computation and experiment. Journal of Solid State Chemistry, 290, 121592. DOI 10.1016/j.jssc.2020.121592. [Google Scholar] [CrossRef]
34. Jiang, Y., Tong, Y., Chen, S., Zhang, W., Hu, F. et al. (2021). A three-mode self-referenced optical thermometry based on up-conversion luminescence of Ca2MgWO6: Er3+, Yb3+ phosphors. Chemical Engineering Journal, 413, 127470. DOI 10.1016/j.cej.2020.127470. [Google Scholar] [CrossRef]
35. Botella, P., Errandonea, D., Garg, A. B., Rodriguez-Hernandez, P., Muñoz, A. et al. (2019). High-pressure characterization of the optical and electronic properties of InVO4, InNbo4, and InTao4. SN Applied Sciences, 1, 389. DOI 10.1007/s42452-019-0406-7. [Google Scholar] [CrossRef]
36. Benmakhlouf, A., Errandonea, D., Bouhemadou, A., Bentabet, A., Bin-Omran, S. (2017). Ab initio study of the mechanical and electronic properties of scheelite-type XWO4(X = Ca, Sr, Ba) compounds. International Journal of Modern Physics B, 31, 1750086. [Google Scholar]
37. Liu, Y., Liu, G., Wang, J., Dong, X., Yu, W. (2014). Single-component and warm-white-emitting phosphor NaGd(WO4)2: Tm3+, Dy3+, Eu3+: Synthesis, luminescence, energy transfer, and tunable color. Inorganic Chemistry, 53, 11457–11466. DOI 10.1021/ic501284y. [Google Scholar] [CrossRef]
38. Munoz-Santiuste, J. E., Lavin, V., Rodriguez-Mendoza, U. R., Ferrer-Roca, C., Errandonea, D. et al. (2018). Experimental and theoretical study on the optical properties of LaVO4 crystals under pressure. Physical Chemistry Chemical Physics, 20, 27314–27328. DOI 10.1039/C8CP04701D. [Google Scholar] [CrossRef]
39. Xia, Z., Liu, R., Huang, K., Drozd, V. (2012). Ca2Al3O6F: Eu2+: A green-emitting oxyfluoride phosphor for white light-emitting diodes. Journal of Materials Chemistry, 22, 15183–15189. DOI 10.1039/c2jm32733c. [Google Scholar] [CrossRef]
40. Wang, J., Wang, J., Duan, P. (2014). Luminescence and energy transfer of Tm3+ or/and Dy3+ co-doped in Sr3Y(PO4)3 phosphors with UV excitation for WLEDs. Journal of Luminescence, 145, 1–5. DOI 10.1016/j.jlumin.2013.07.014. [Google Scholar] [CrossRef]
41. Wu, Y., Yang, F., Yan, F. (2019). Warm-white light performance of Dy3+, Eu3+: NaLa(WO4)2 phosphors excited with a 450 nm LED. Journal of the American Ceramic Society, 102, 7347–7354. DOI 10.1111/jace.16615. [Google Scholar] [CrossRef]
42. Wang, Y., Ding, J., Li, Y., Yang, L., Ding, X. et al. (2016). A novel single-phase warm white emission phosphor Sr3YAl2O7.5: Bi3+, Eu3+ with energy transfer for UV white LEDs. RSC Advance, 6, 42618–42626. DOI 10.1039/C6RA05445E. [Google Scholar] [CrossRef]
43. Ji, C., Huang, Z., Tian, X., Xie, W., Wen, J. et al. (2019). Synthesis and photoluminescence properties of a novel BaGe4O9:Eu3+ red emitting phosphor for warm white LEDs. Dyes and Pigments, 160, 772–778. DOI 10.1016/j.dyepig.2018.09.012. [Google Scholar] [CrossRef]
44. Bai, S., Liu, Y., Tan, G., Liu, W., Liu, D. et al. (2020). Enhanced quantum efficiency and thermal stability in CaWO4: Eu3+ phosphor based on structural modification induced by co-doping Al3+. Journal of Luminescence, 225, 117351. DOI 10.1016/j.jlumin.2020.117351. [Google Scholar] [CrossRef]
45. Vijayakumar, R., Guo, H., Huang, X. (2018). Energy transfer and color-tunable luminescence properties of Dy3+ and Eu3+ co-doped Na3Sc2(PO4)3 phosphors for near-uV LED-based warm white LEDs. Dyes and Pigments, 156, 8–16. DOI 10.1016/j.dyepig.2018.03.053. [Google Scholar] [CrossRef]
Supplementary Information
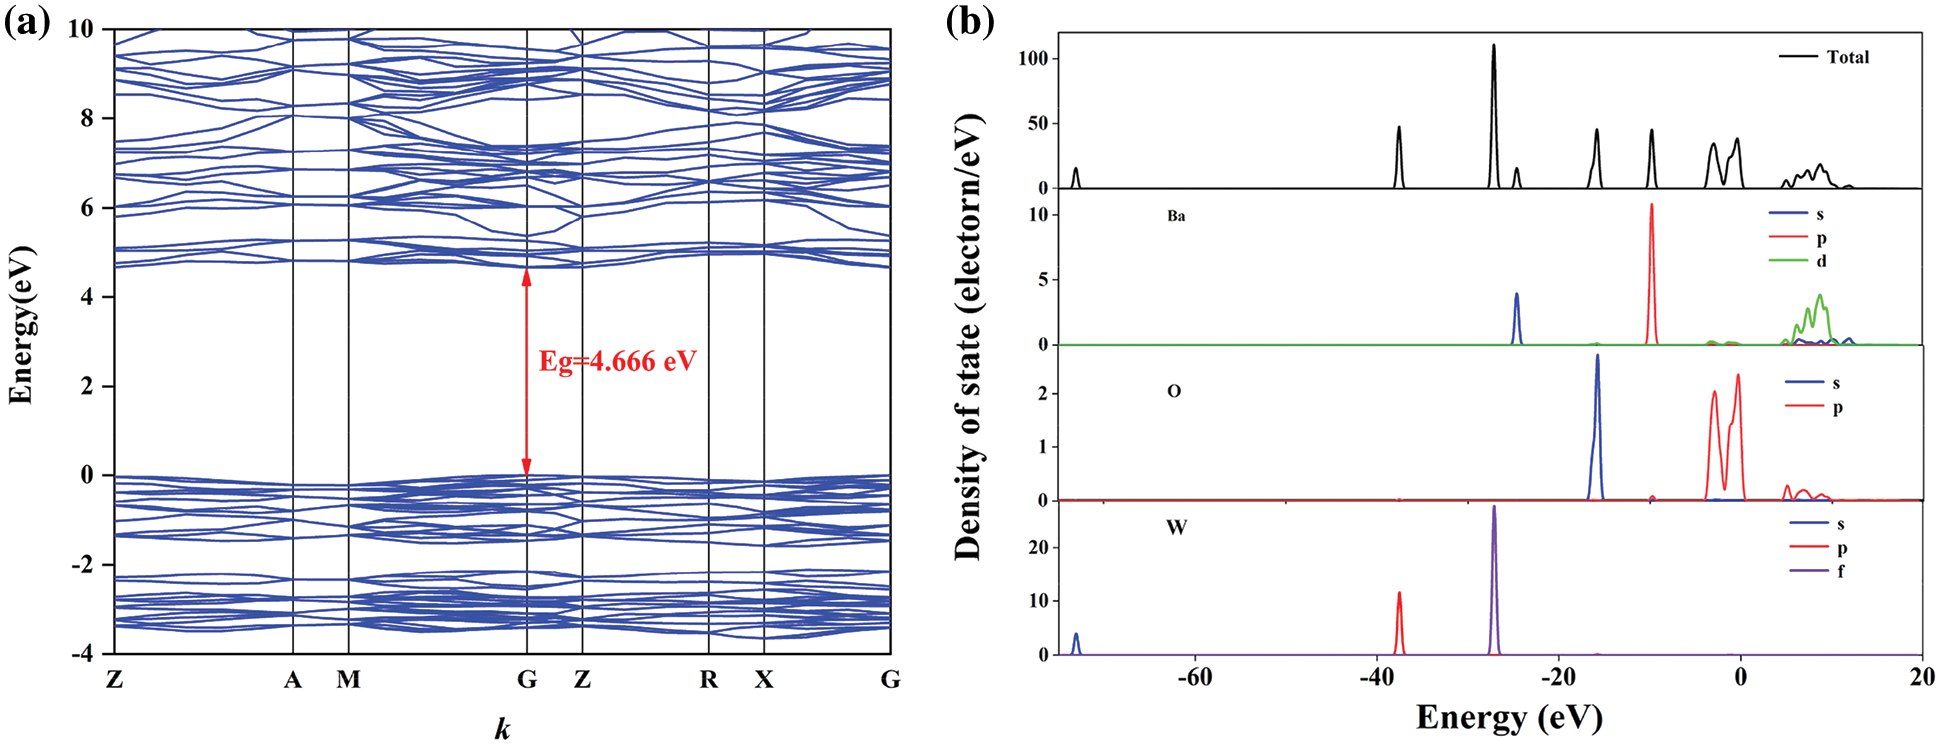
Figure S1: (a) The energy band structure around fermi energy level and (b) the representative orbital populations of BaWO4. DFT calculations revealed that the BaWO4 was a kind of direct bandgap (4.666 eV) materials
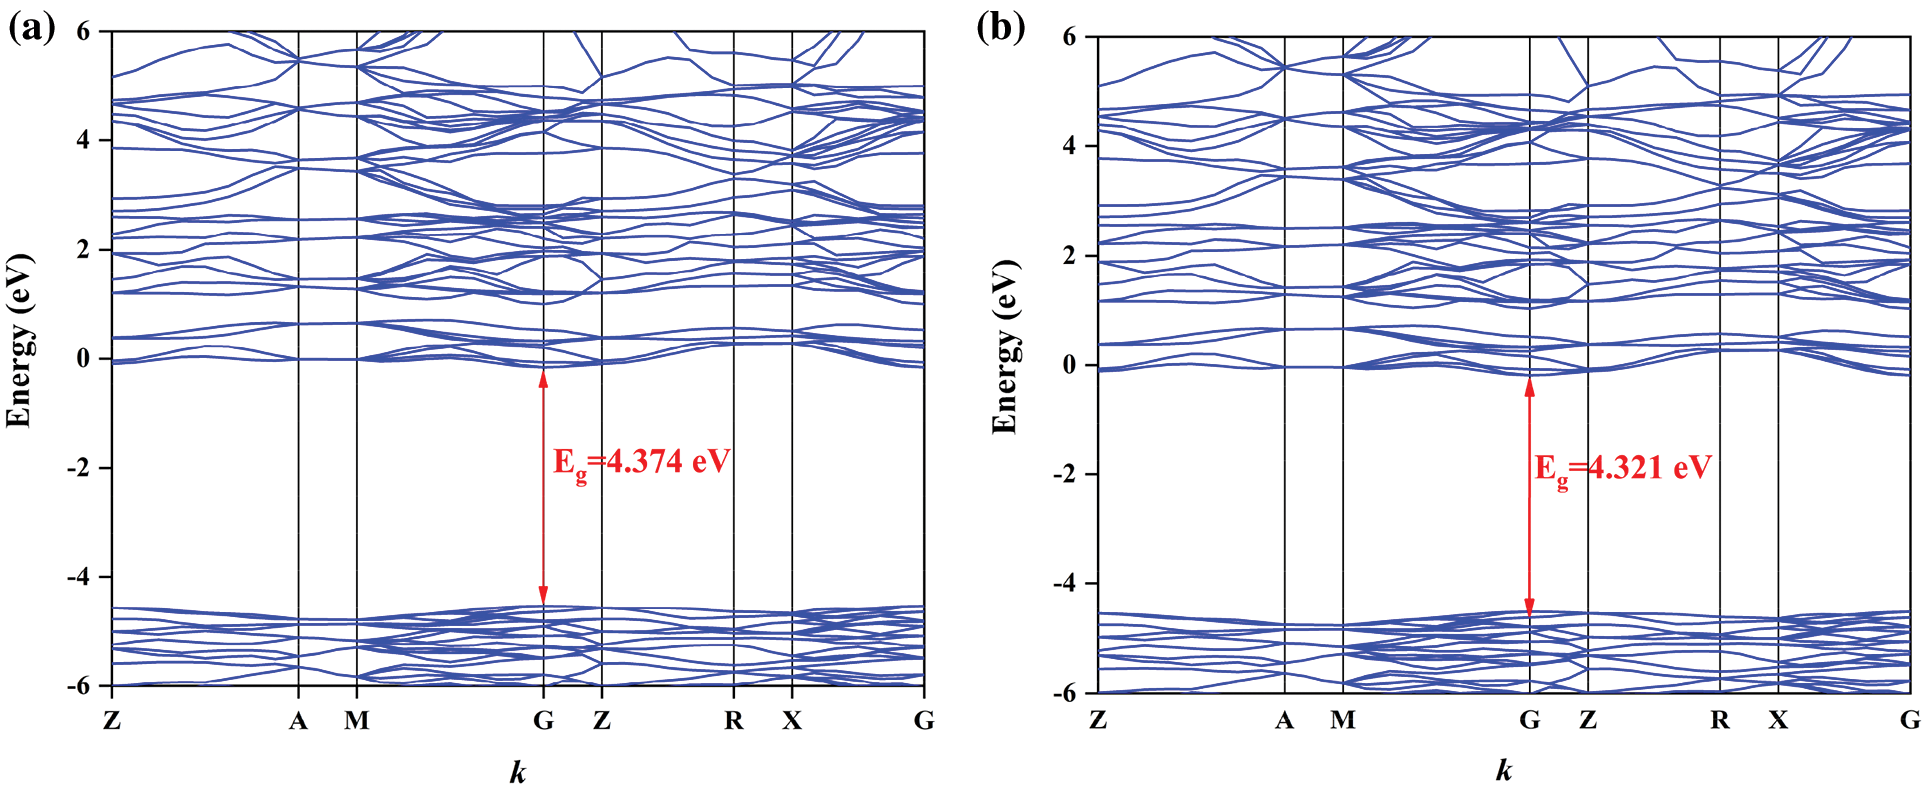
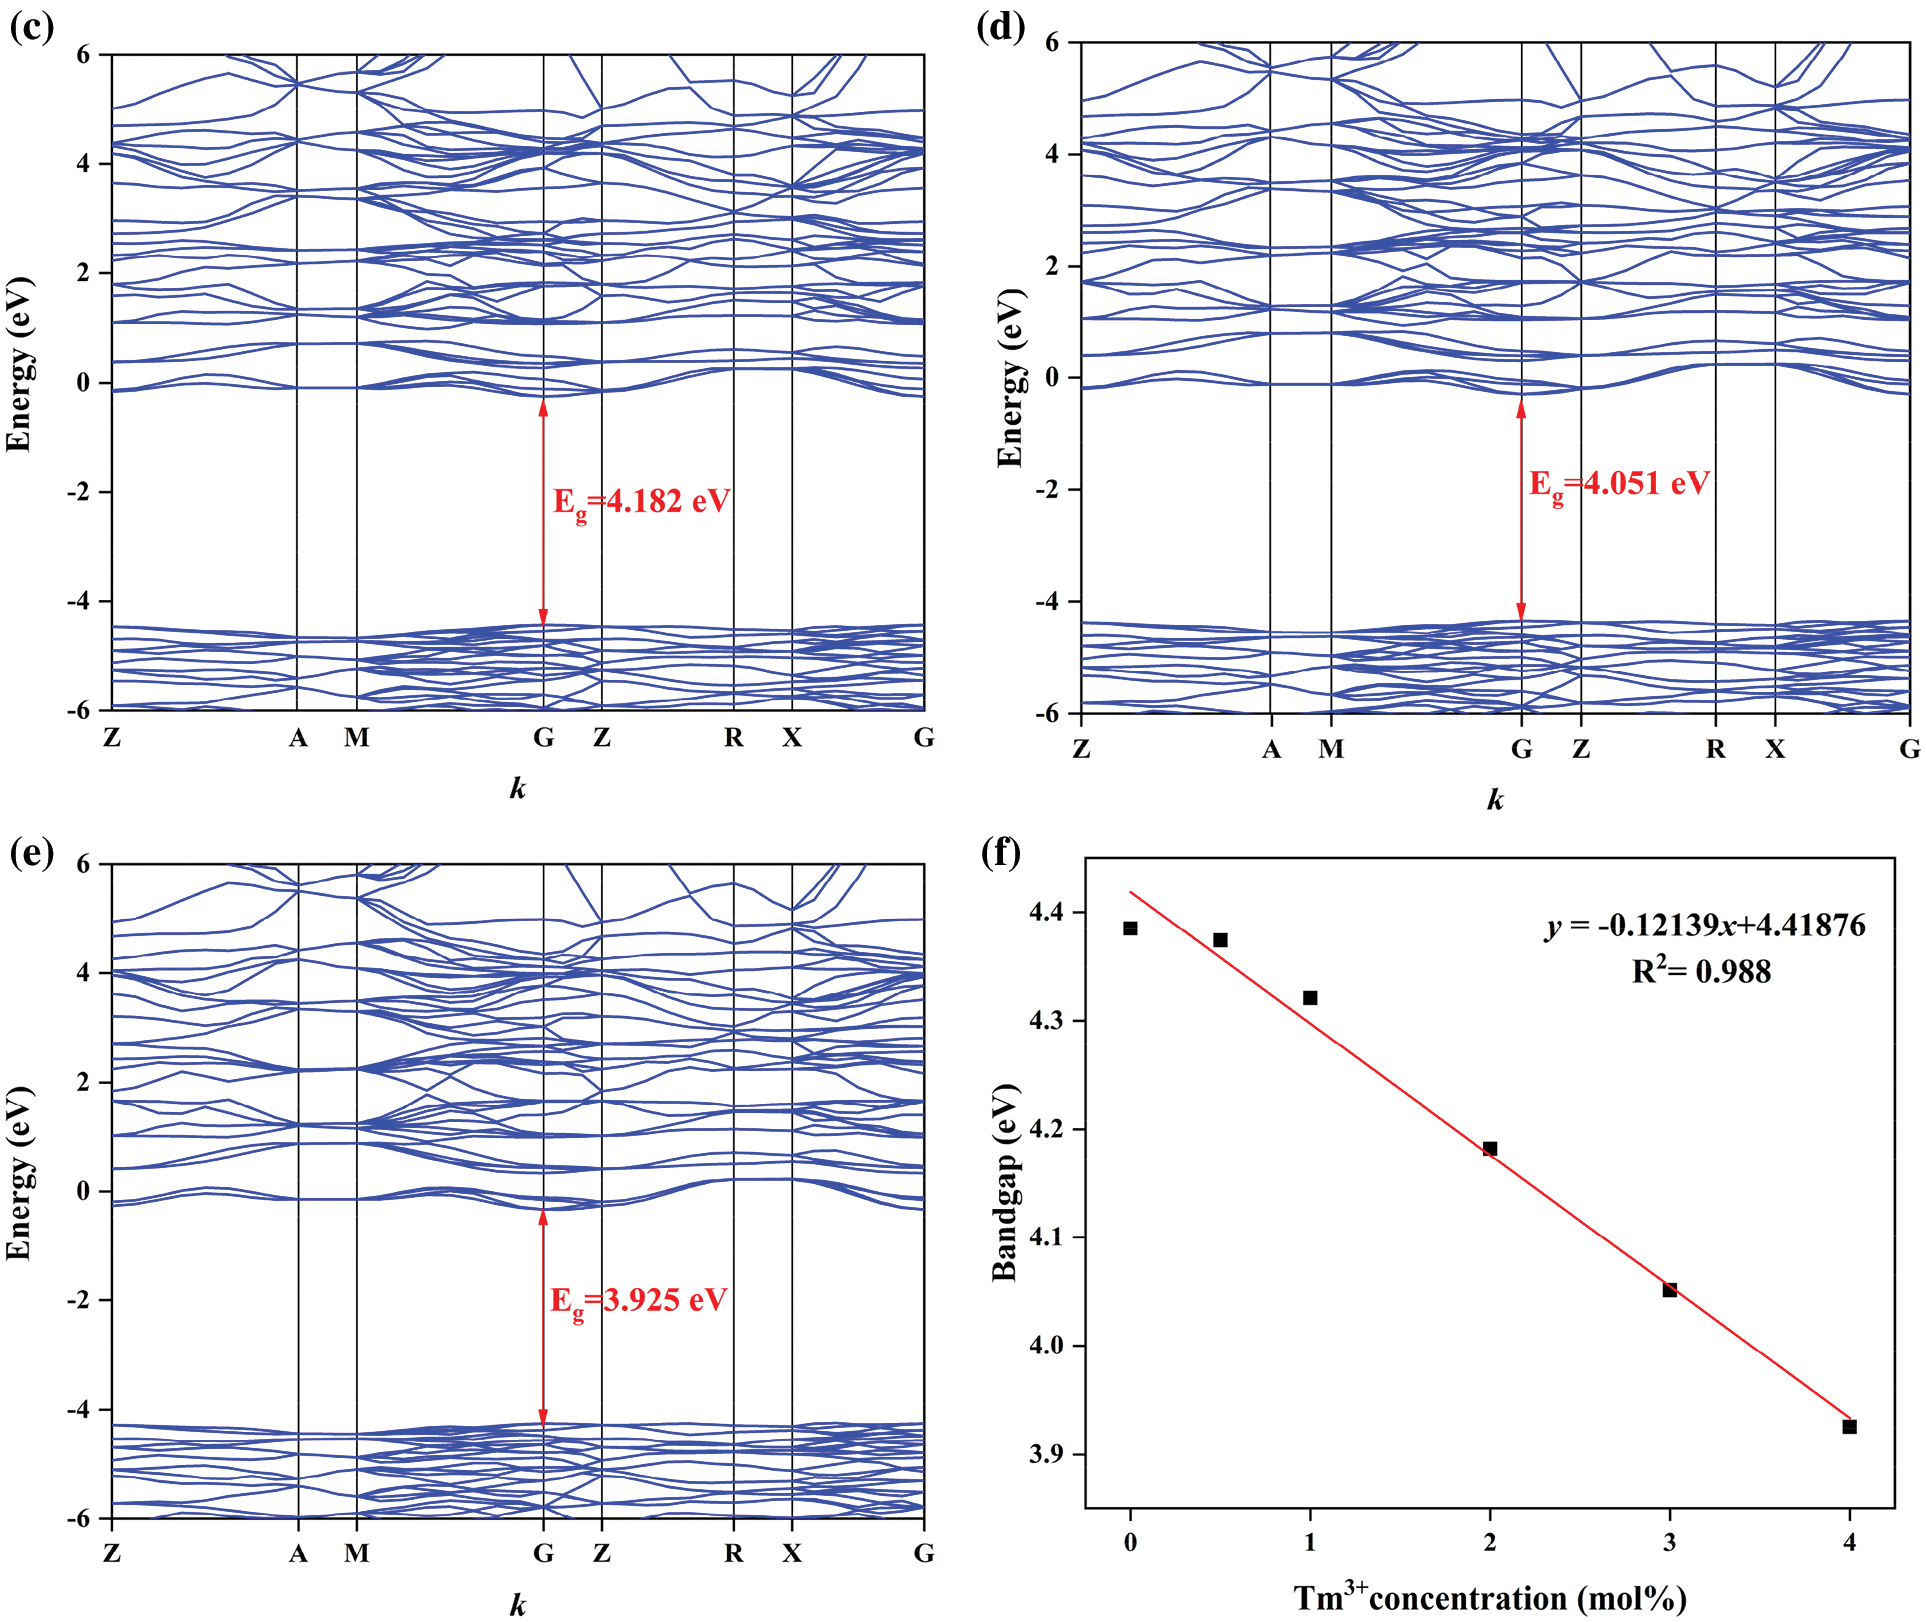
Figure S2: Band structures of BaWO4: 0.03Dy3+, yTm3+, (a) y = 0.005, (b) y = 0.01, (c) y = 0.02, (d) y = 0.03, (e) y = 0.04, and (f) the dependence of band gaps on y
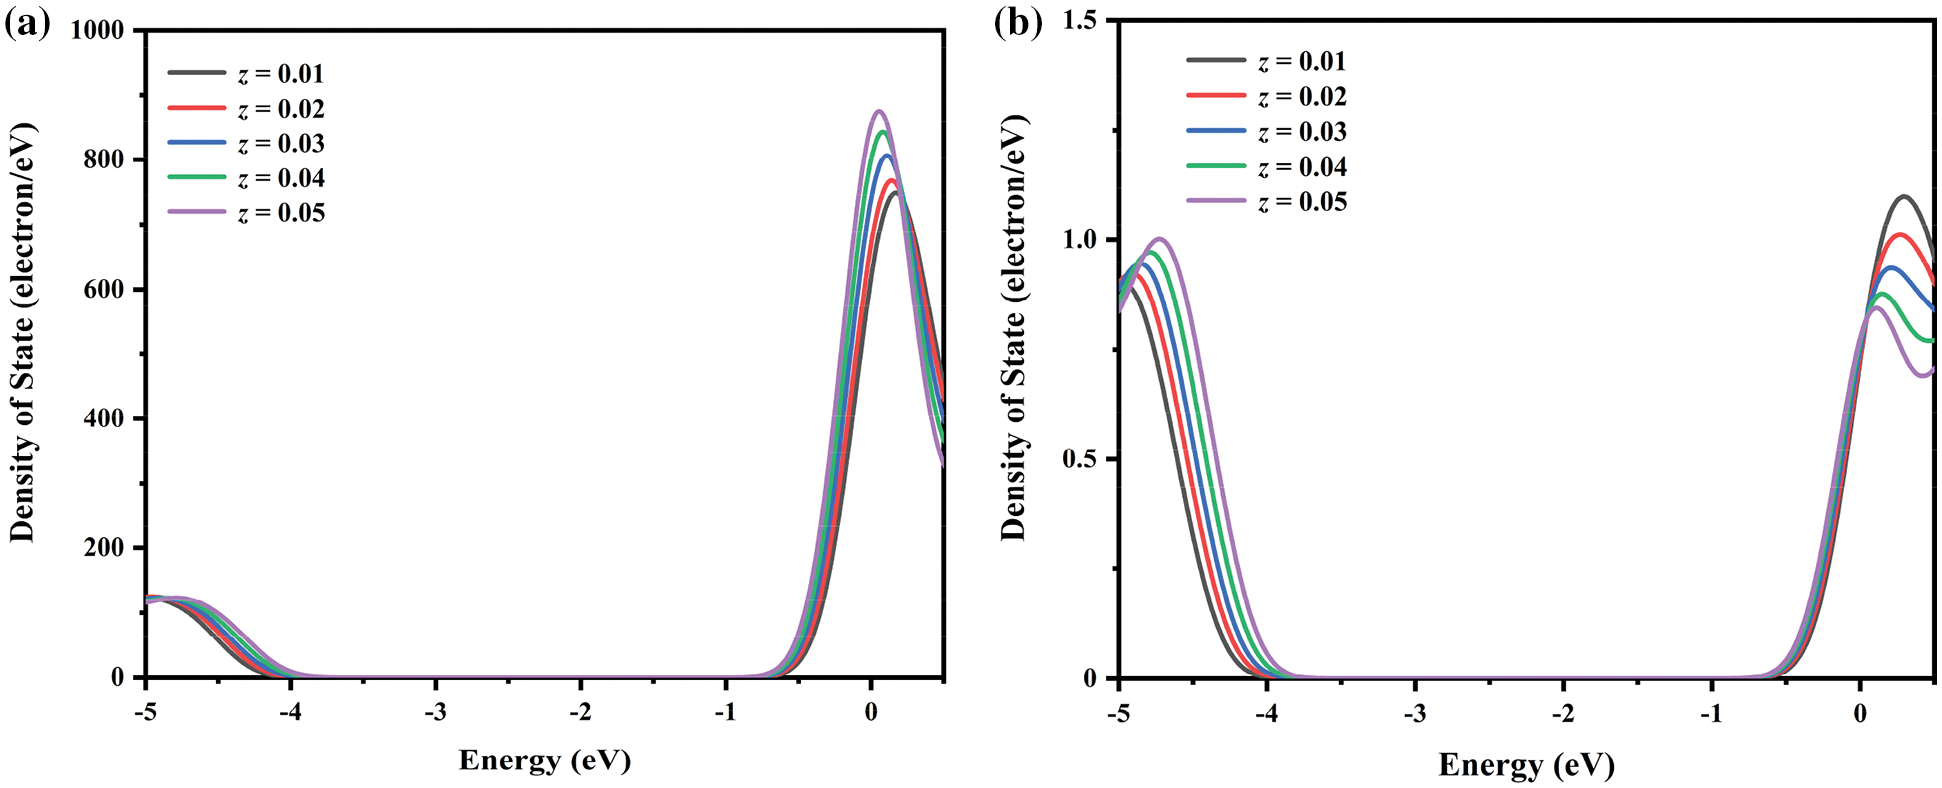
Figure S3: Respectively, (a) p and (b) f orbital populations around the fermi level in BaWO4: 0.03Dy3+, 0.01Tm3+, zEu3+ (z = 0.01 − 0.05)
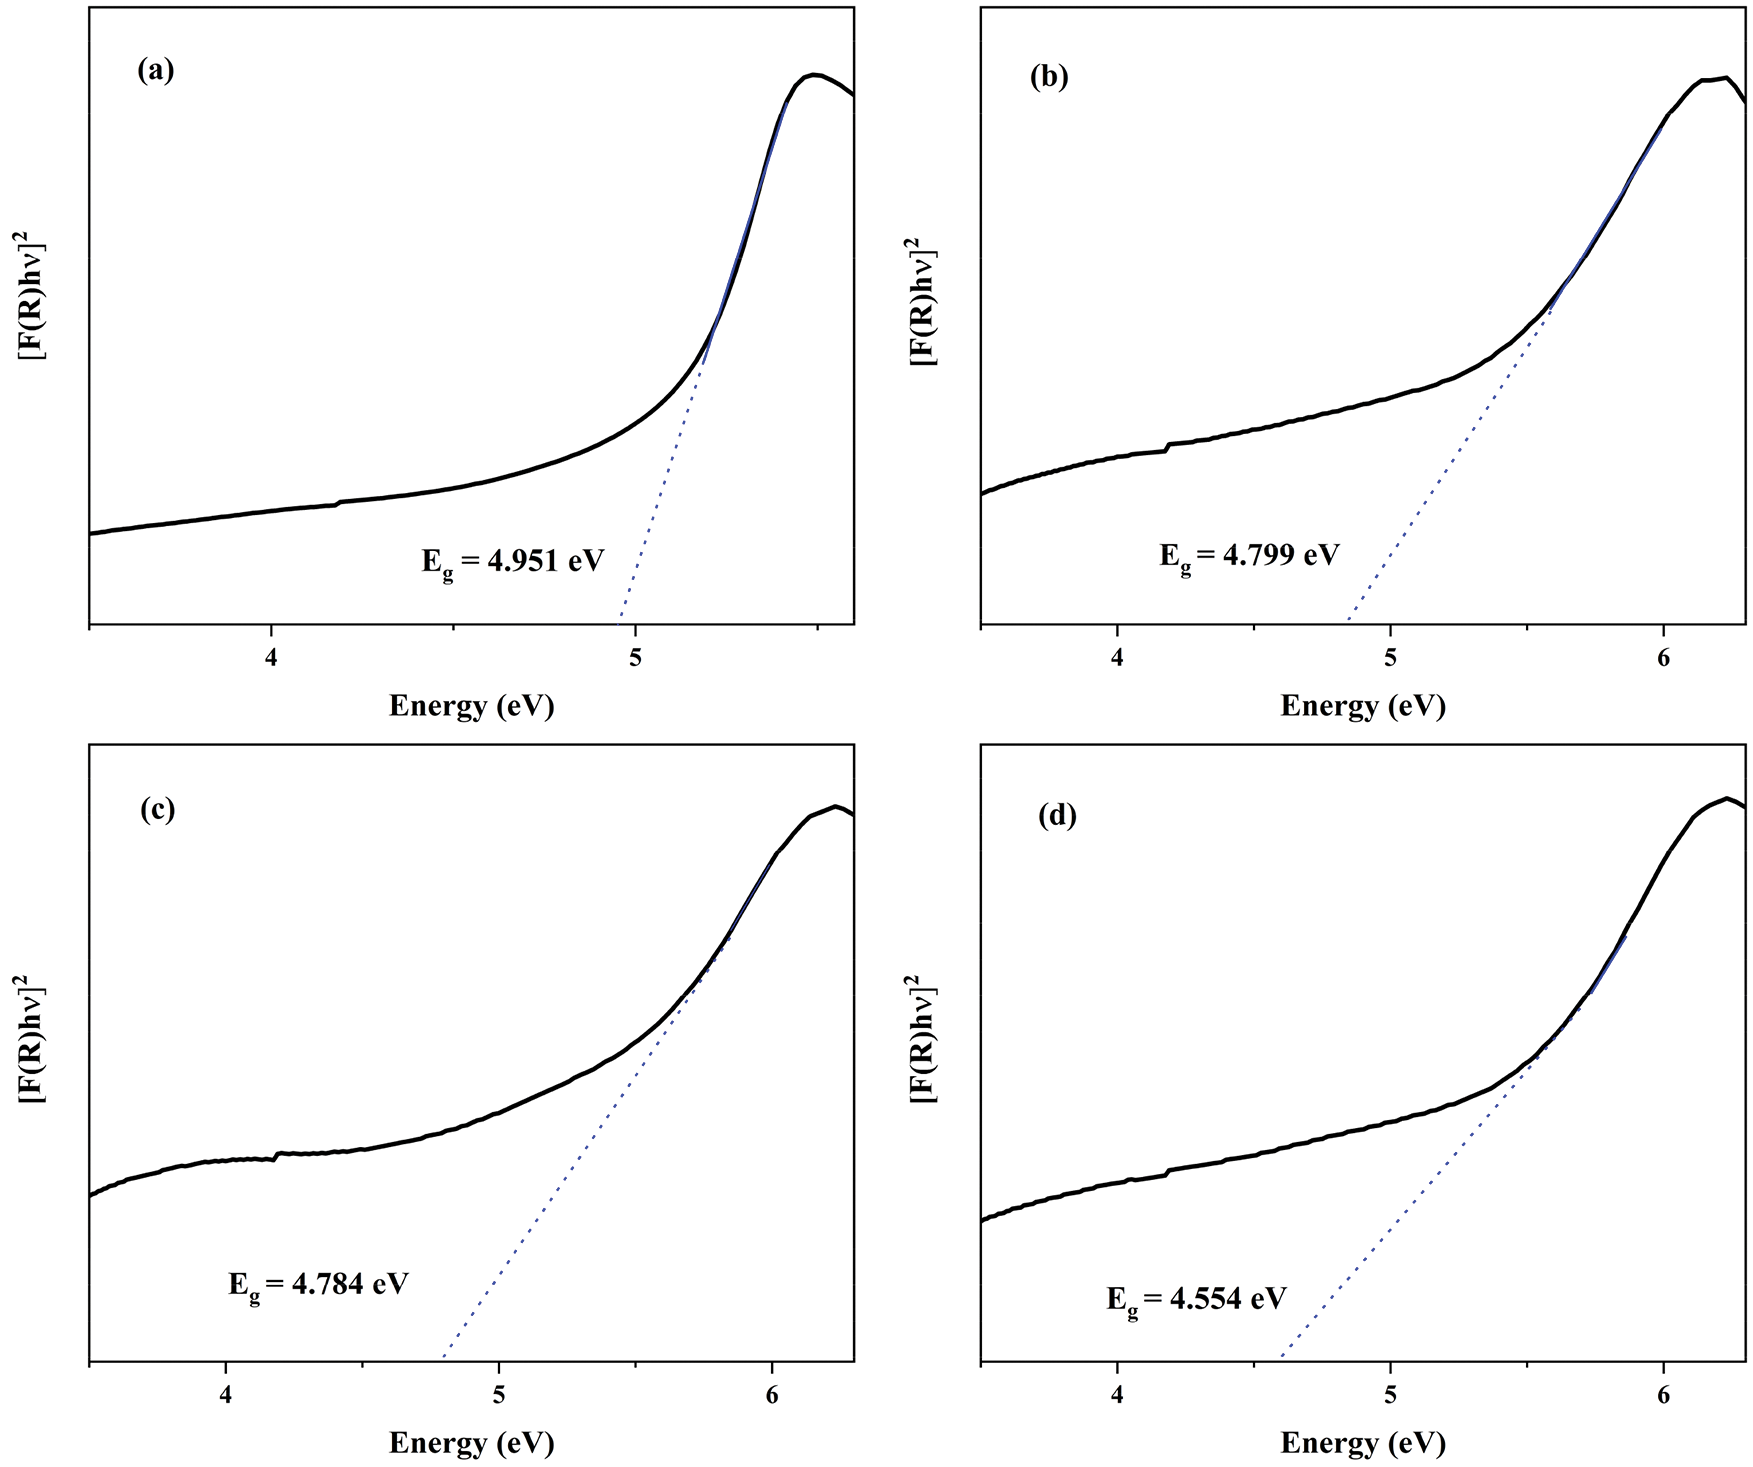
Figure S4: UV-visible absorption spectra for phosphors, (a) BaWO4, (b) BaWO4: 0.03Dy3+, (c) BaWO4: 0.03Dy3+, 0.01Tm3+, (d) BaWO4: 0.03Dy3+, 0.01Tm3+, 0.03Eu3+
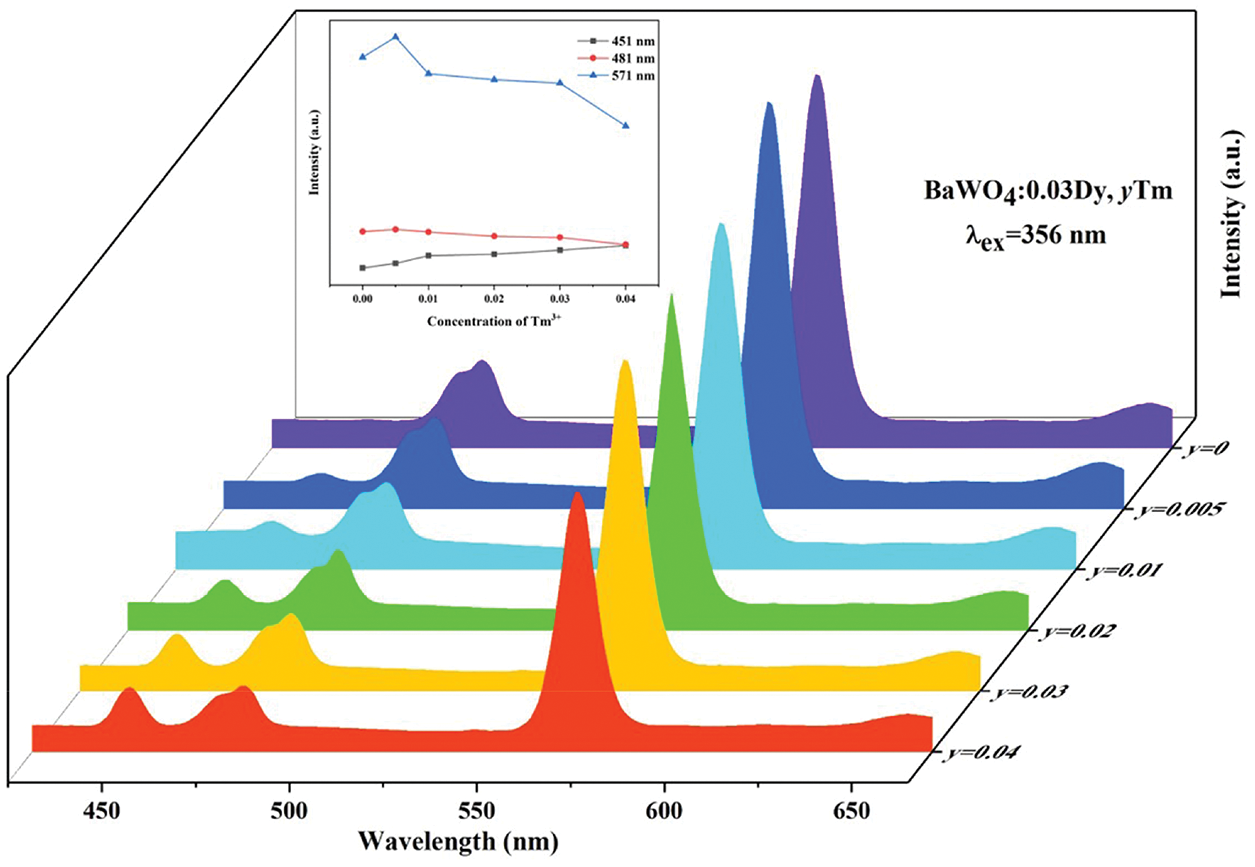
Figure S5: PL spectra of BaWO4: 0.03Dy3+, yTm3+ with different Tm3+ doping concentrations excited at 365 nm. Inset shows dependence of emission intensity peaking at 451, 481 and 571 nm
 | This work is licensed under a Creative Commons Attribution 4.0 International License, which permits unrestricted use, distribution, and reproduction in any medium, provided the original work is properly cited. |