| Journal of Renewable Materials |
DOI: 10.32604/jrm.2022.021282
ARTICLE
Effects of Mineral Admixtures on Chloride Diffusion in Environment-Friendly Coral Aggregate Concrete
1School of Civil Engineering and Architecture, Xi’an University of Technology, Xi’an, 710048, China
2College of Civil Engineering, Xi’an University of Architecture & Technology, Xi’an, 710055, China
3School of Civil Engineering, Lanzhou University of Technology, Lanzhou, 730050, China
*Corresponding Authors: Daguan Huang. Email: hdg0505@163.com; Li Su. Email: suli9290@outlook.com
Received: 06 January 2022; Accepted: 08 February 2022
Abstract: Coral materials can replace concrete aggregates and achieve material self-sufficiency for reducing the construction costs of island projects. This paper studies the effects of different mineral admixtures on the properties of coral aggregate concrete (CAC). The chloride concentration of CAC after different erosion times is measured using the potentiometric method, and the porosity of the CAC is calculated using thermogravimetric and drying methods. The chloride concentration of the CAC presents a two-phases distribution. The peak chloride concentration followed a power function, increasing with the erosion time. The chloride diffusion coefficient of CAC is 7.9%–37.5% larger than that of ordinary aggregate concrete, and the addition of 15% fly ash and 5% silica fume can significantly reduce the chloride diffusion coefficient, with a maximum reduction of 45.0%. The porosity obtained via the thermogravimetric and drying methods is well correlated. The porosity has a strong negative correlation with the compressive strength and a strong positive correlation with the chloride diffusion coefficient.
Keywords: Tidal zone; coral aggregate concrete; chloride diffusion behavior; porosity; correlation analysis
In the past few years, countries have performed large-scale infrastructure construction on islands to develop marine resources and protect territorial waters, leading to a significant increase in the demand for concrete raw materials, such as gravel and river sand. However, most islands are far from the mainland, and conventional construction materials are not available on the islands. Long-distance sea transportation will significantly increase the construction cost [1,2]. Therefore, it is necessary to develop a new type of concrete to address the current situation in which conventional concrete is both uneconomical and time-consuming for island infrastructure construction. Researchers have found that in tropical and subtropical marine areas, most of the islands are coral islands. Coral reefs are a special type of rock abundant on islands [3]. Coarse and fine aggregates prepared from coral reefs can replace gravel and river sand in conventional concrete. Therefore, the use of coral aggregates extracted during the construction of dredging piers and oil wells to prepare concrete can reduce the economic and environmental costs of island construction, which is beneficial for island construction and environmental protection [4–6].
Coral aggregate has a rough surface and is light weight, porous, and highly absorbent. Researchers have shown that coral aggregate concrete (CAC) can be prepared using coral aggregate [7,8]. Rick [7] investigated CAC buildings on Bikini Island and found that the compressive strength of the CAC was approximately 20 MPa. Yuan [8] optimized the mix ratio of CAC and prepared CAC with a strength grade of C55, thus, the strength of CAC satisfies the structural strength requirements. Current research on CAC has primarily focused on its mechanical properties. Owing to the low strength of coral aggregate itself, many researchers have improved the performance of concrete by optimizing the mix ratio and adding admixtures [9,10] or fibers [11–14] into concrete, which effectively enhances the mechanical properties of CAC. Cheng et al. [9] found that metakaolin was more effective than fly ash (FA) and slag for improving the compressive strength of CAC. Zhu et al. [10] triple-blended 5% metakaolin, 15% FA, and 15% slag powder in CAC, resulting in a 21% increase in the compressive strength of the CAC. Liu et al. [11] studied the shear performance of CAC with different carbon fiber admixtures and found that with an increase in the carbon fiber content, the peak shear stress first increased and then decreased, and the optimal carbon-fiber content of the concrete was determined. Fu et al. [13] showed that the appropriate amount of basalt fibers can effectively improve the impact resistance of CAC.
The service environment of CAC is a harsh marine environment with abundant corrosive ions, such as chloride and sulfate ions [15]. Researchers have found that traditional steel reinforcement is prone to rust in CAC—particularly in tidal areas where the performance of reinforced-concrete structures is severely degraded. Thus, CAC must have excellent mechanical properties and durability. Studies have indicated that the addition of mineral admixtures or fibers to concrete can effectively improve its durability. Cheng et al. [9] founded that the chloride diffusion coefficient (Da) of CAC is larger than that of ordinary aggregate concrete (OAC). However, Dou et al. [16] investigated the chloride transport law in CAC using the natural diffusion method, and concluded that the chloride erosion resistance CAC is significantly lower than that of OAC. Huang et al. [17] performed dry-wet cycle acceleration experiments to simulate the marine tidal zone, and concluded that the Da of CAC was 21.3% larger than that of OAC, but the addition of appropriate amount FA or basalt fiber can improve the chloride erosion resistance of CAC. Research on the effects of different mineral admixtures on chloride migration in CAC in marine tidal areas is scarce, which hinders the application and development of CAC.
Thus, in the present study, by simulating the environment of ocean tidal area, the effects of different mineral admixtures on the compressive strength, chloride concentration, and Da of CAC were analyzed via an accelerated drying-wetting cycle tests. The variation law of the peak chloride concentration with exposed time is studied. The porosity of the CAC is calculated via drying and thermogravimetric methods, and the correlation between porosity and Da or compressive strength are explored.
P.O 42.5R ordinary Portland cement (OPC), fly ash (FA), granulated blast furnace slag (BFS), and silica fume (SF) are used in this study. The chemical properties of the cementitious materials are presented in Table 1. The polycarboxylate superplasticizer (PBS) had a water reduction rate more than 30%. The coral aggregate used in this study is obtained from the South China Sea. Natural corals are not suitable for use as aggregates and mixed directly into concrete. Natural corals are crushed using a crusher and divided into coarse and fine aggregates, as shown in Fig. 1. The surface of coral aggregate is porous, and a scanning electron microscopy image is shown in Fig. 2. The 24-h water absorption rates of the coral coarse and fine aggregates are 15.0% and 16.7%, respectively, and the physical properties and chemical compositions of the coral aggregate can be found in [18].
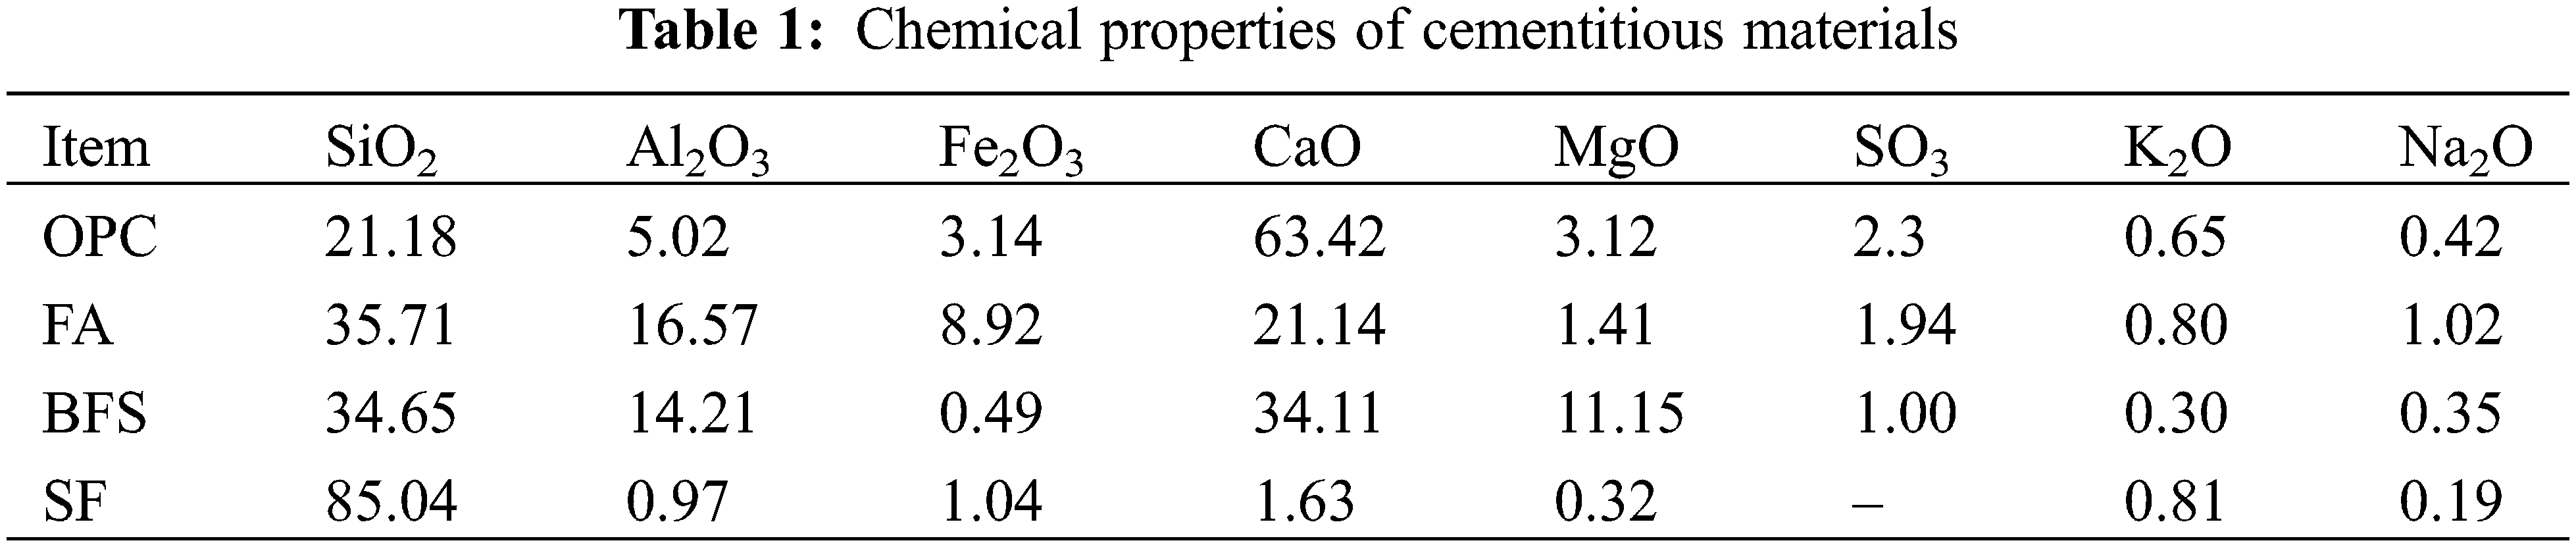
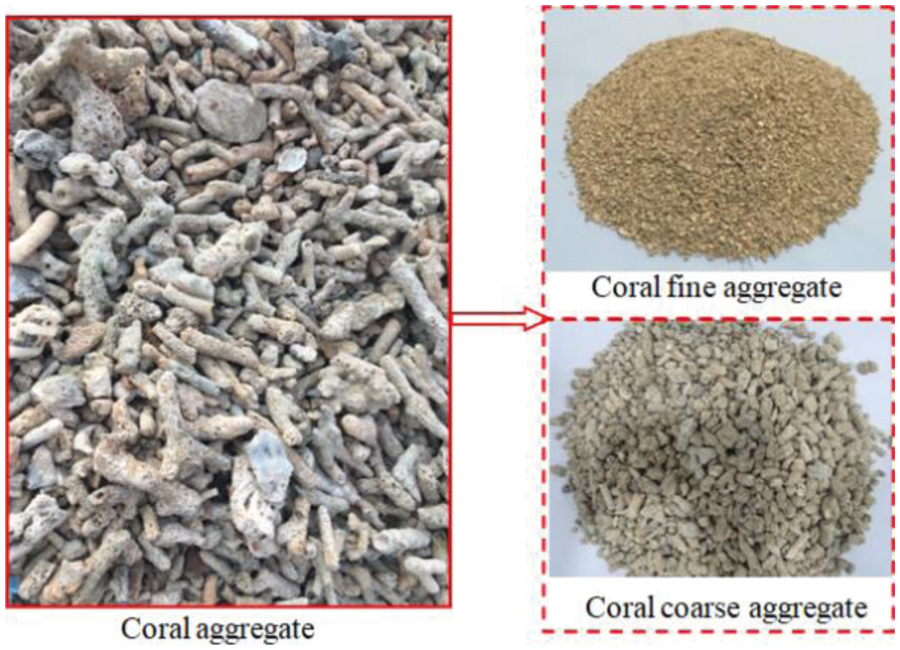
Figure 1: Coral aggregate
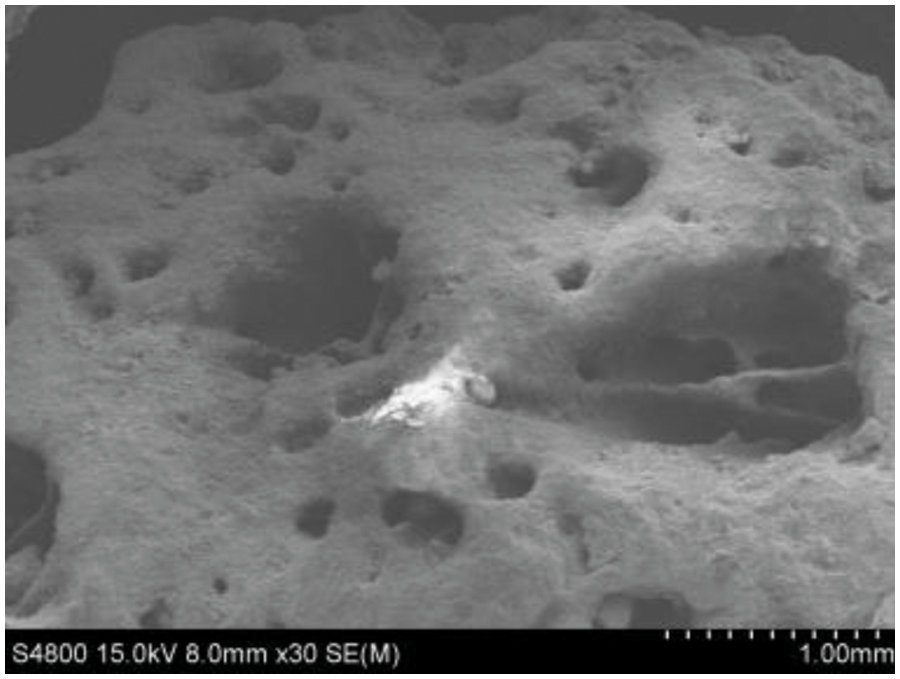
Figure 2: SEM of coral aggregate
The design level for the concrete strength is C30. O30 represents OAC, and C30 represents the CAC reference group. C30F15 and C30B15 denote the CAC with 15% FA and 15% BFS, respectively. C30F15S5 denotes the CAC with 15% FA and 5% SF. The details mixtures are presented in Table 2. Because of the high porosity and high water absorption of coral aggregates, they usually pre-wetted before preparation. The CAC mixing process is shown in Fig. 3. When the coral aggregates are mixed, the pre-wetting water is sprayed evenly on the surface of the aggregate, and the mixer continues to rotate. The pre-wetting water is sprayed for 3 min, and then the aggregate is left to stand for 5 min.
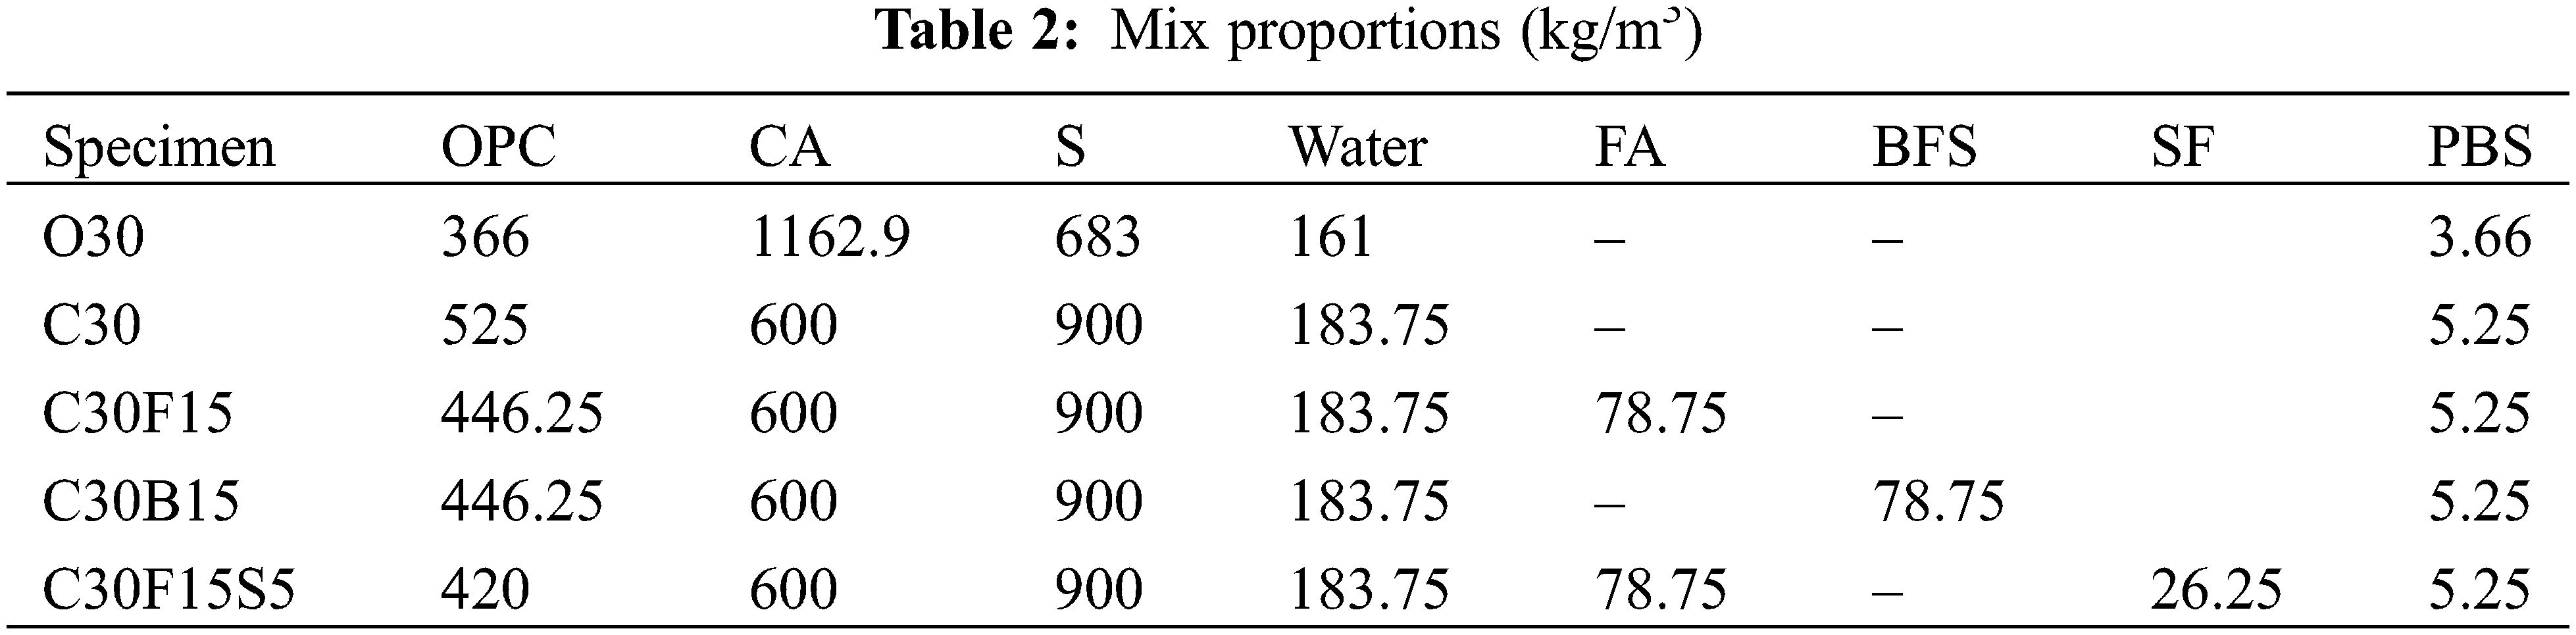
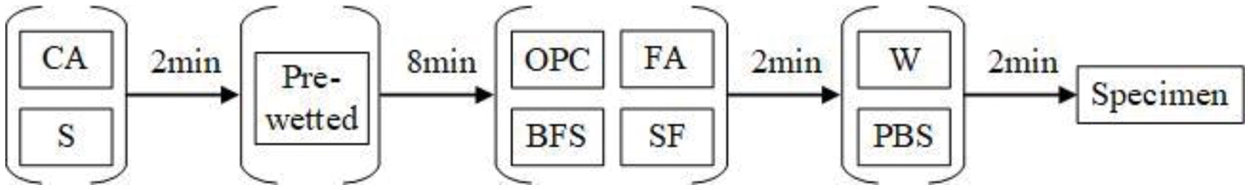
Figure 3: Schematic diagram of the mixing procedure for CAC
The compressive strength is tested using a cube specimen with the size of 100 mm. The test is carried out in accordance with the standard for test method of mechanical properties on ordinary concrete (GB 50081-2002), all specimens are tested after 28 days curing.
Drying-wetting cycles are used to accelerate the experiment. Five surfaces of the specimen are sealed with epoxy resin, and only the remaining surface is exposed. A schematic of the drying-wetting cycles is shown in Fig. 4. The exposure times of the test are 30, 60, 90, 120 and 180 d [19].
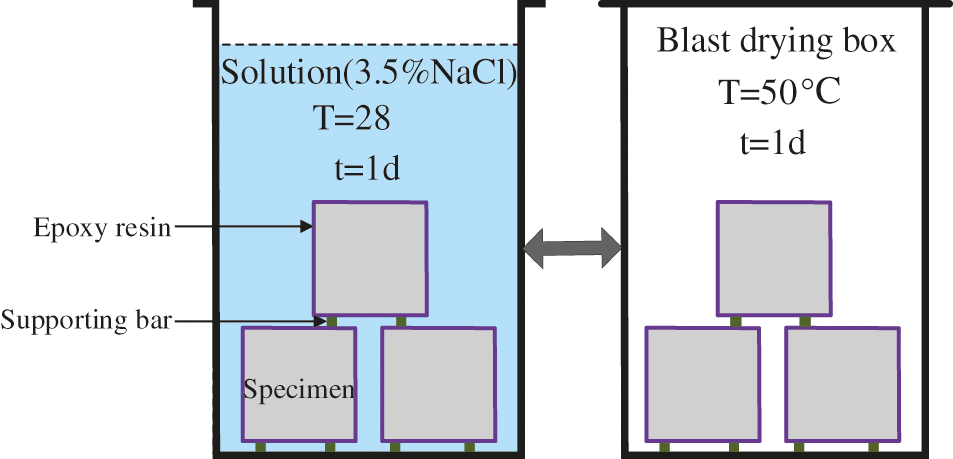
Figure 4: Schematic diagram of chloride erosion test
After the specimens reached the exposure time, the specimens are placed indoors for 7 d and then placed in a drying oven at 60°C for 24 h. A schematic of the chloride test process is shown in Fig. 5. The free chloride content in concrete can be calculated using Eq. (1) [17].
where W[Cl−]% is the percentage of free chloride ions in hardened CAC relative to the mass of CAC powder (%), M[Cl−]% is the molar mass of chloride (35.45 g/mol), and G is the mass of CAC powder used for soaking (g).
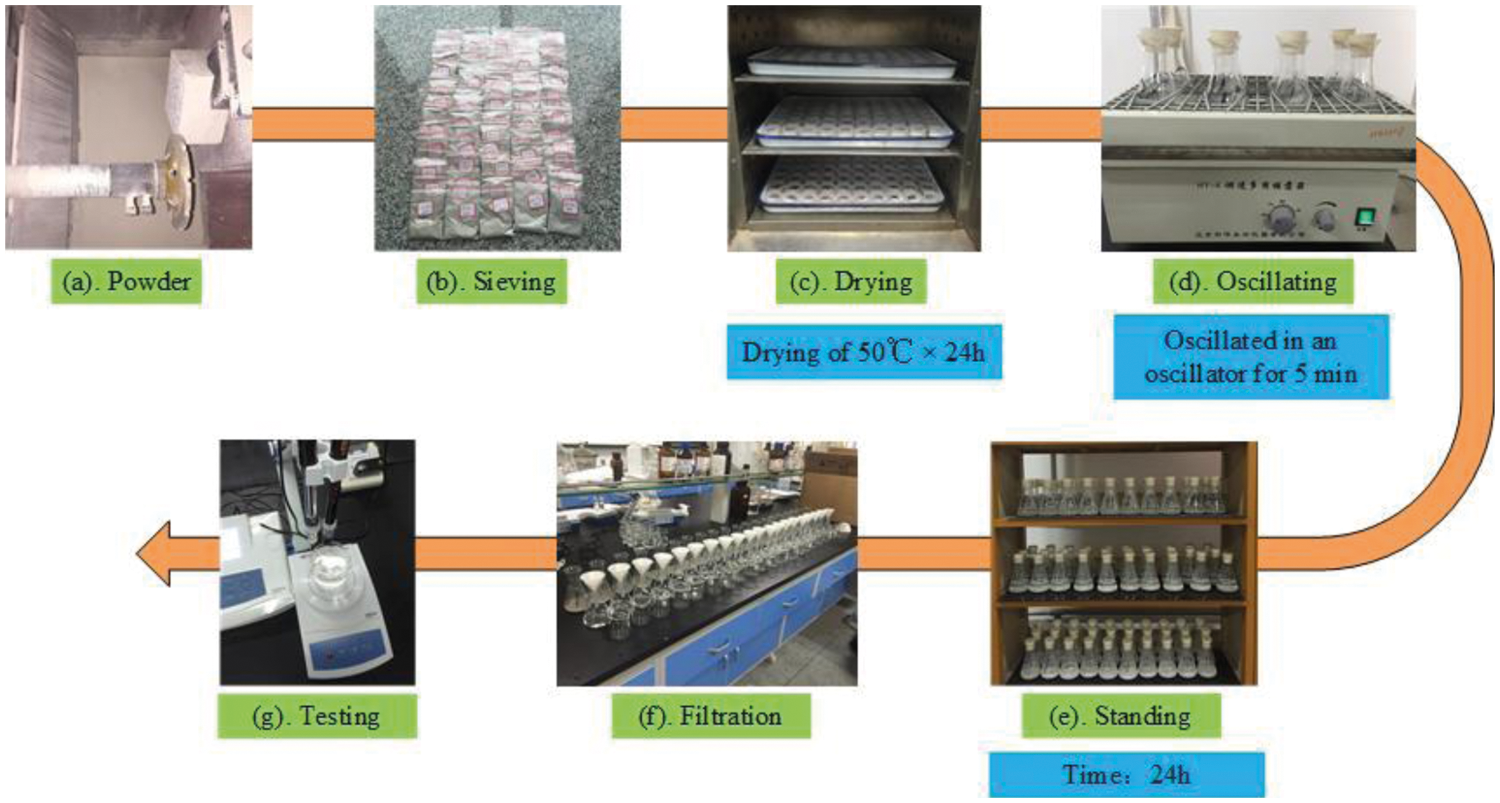
Figure 5: Schematic diagram of chloride test
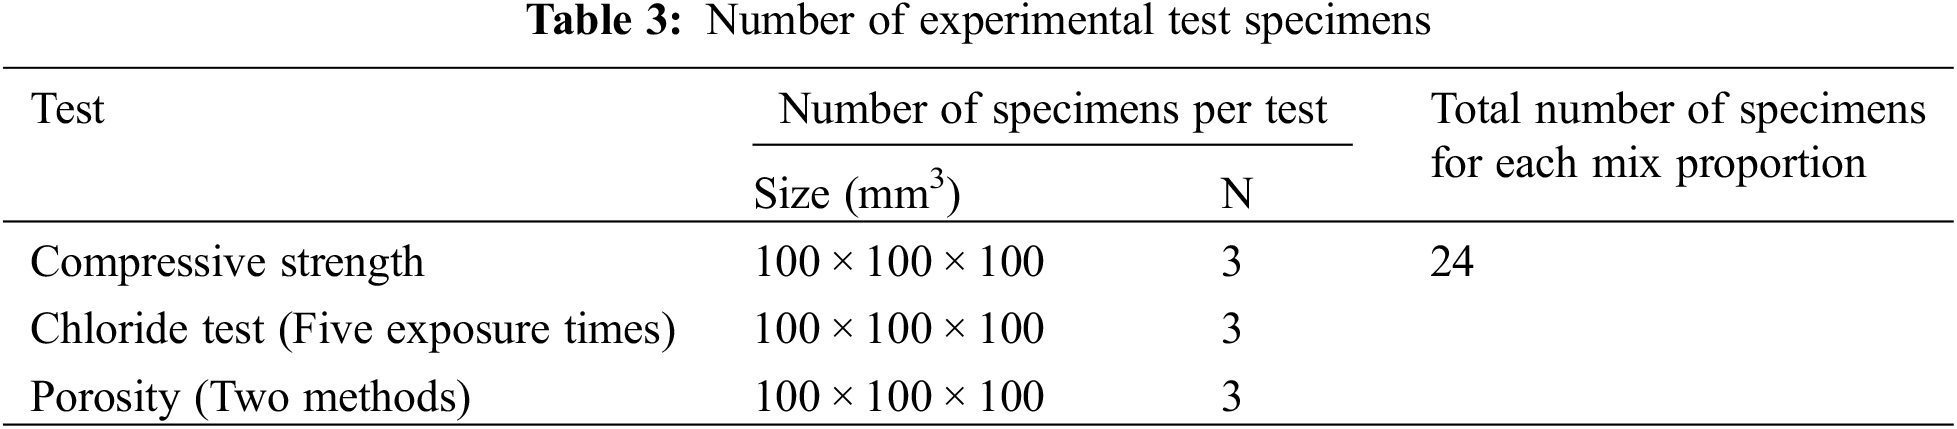
Table 3 summarizes the number of specimens per test and the total number of specimens for each mix proportion. A total of 120 specimens are used for the tests in this study.
3 Experimental Results and Discussion
3.1 Compressive Strength and Slump
The compressive strengths and slumps of the CAC are shown in Fig. 6. When the FA content is 15%, the compressive strength of C30F15 is 0.7% lower than that of the reference concrete C30, and the compressive strengths of C30B15 and C30F15B5 are 7.5% and 14.4% higher than that of C30, respectively. This is because FA has a strong surface protective film structure, which leads to its low pozzolanic activity in the early hydration stage and contributes little to the concrete strength, whereas BFS and SF exhibit a strong pozzolanic effect in the early hydration stage and contribute to the compressive strength of CAC [20]. The incorporation of both FA and BFS into the CAC improved its fluidity, and the slumps of C30F15 and C30B15 are 9.9% and 11.8% higher, respectively, than that of C30. This is because most FA particles are spherical glass beads, which can reduce the friction between the slurry and the aggregate, and play a bearing role at the contact point of the aggregate, improving the fluidity of CAC. The surface structure of BFS is smoother than that of OPC, which can reduce the yield stress of the new companion concrete, thus reducing the water consumption of the standard consistency of the cementitious material system, so as to improve the fluidity of the concrete. The slump of C30F15B5 is 6.8% lower than that of C30B15, owing to the large specific surface area of SF and the large water demand during the mixing. When the water consumption remained unchanged, the addition of SF to the concrete reduced the slump. The relative density of SF is low. When it is added to the concrete, the solid phase volume is increased, and the volume of water is reduced, thus the slurry of the cementitious material becomes viscous, and the fluidity is reduced.
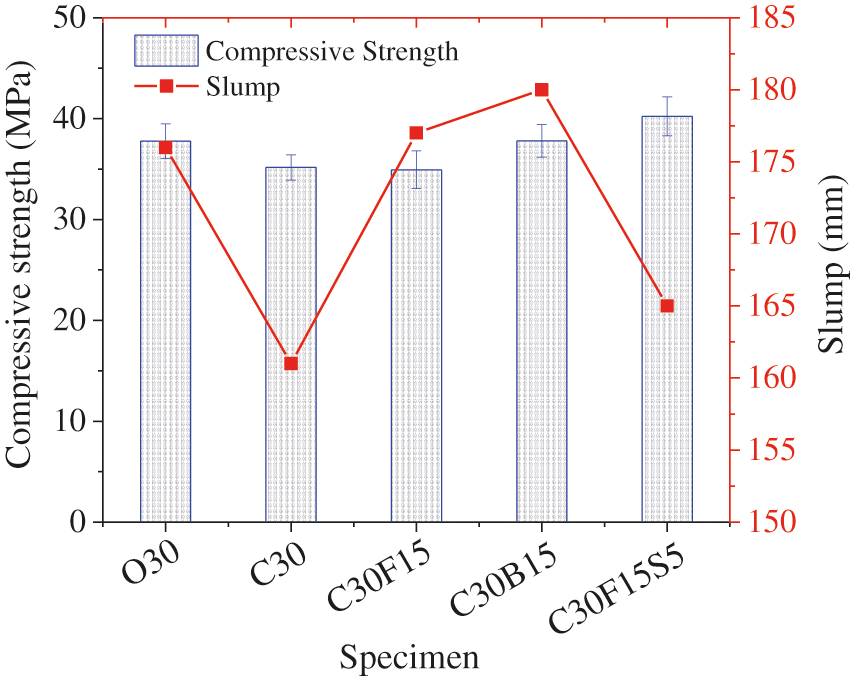
Figure 6: Compressive strength and slump of concrete
3.2 Chloride Diffusion Performance
3.2.1 Chloride Concentration of Concrete
Fig. 7 shows the chloride concentration (Cc) of concrete after different erosion times. The Cc of concrete presents a “two-stage” distribution: first increase and then decrease. In addition, the increase of Cc is relatively small in the late stage. This is because as the erosion proceeds, the continuous hydration densifies the pore structure and reduces the chloride ingress rate [21,22]. The Cc of O30 is lower than that of C30, and the maximum Cc of O30 is 0.52%, whereas that of C30 is 0.79%. The Cc of O30 stabilized after the erosion depth reached 14 mm, whereas that of C30 had not stabilized even at erosion depth of 20 mm. As shown in Figs. 7b–7d, the chloride concentrations of C30F15 and C30B15 are lower than that of C30, indicating that the addition of 15% FA or BFS to CAC can reduce the Cc. As indicated by Figs. 7b and 7e, the Cc of C30F15S5 is significantly lower than that of C30, indicating that the combining of FA and SF can effectively improve the chloride erosion resistance of CAC. The microaggregate effect of FA and BFS can optimize the pore structure of CAC and improve its interface property, enhancing its resistance to chloride penetration. SF exhibits a stronger filling behavior owing to its smaller particle size, which makes the internal structure of CAC denser, effectively blocks the chloride transport channels and reduces the Cc.
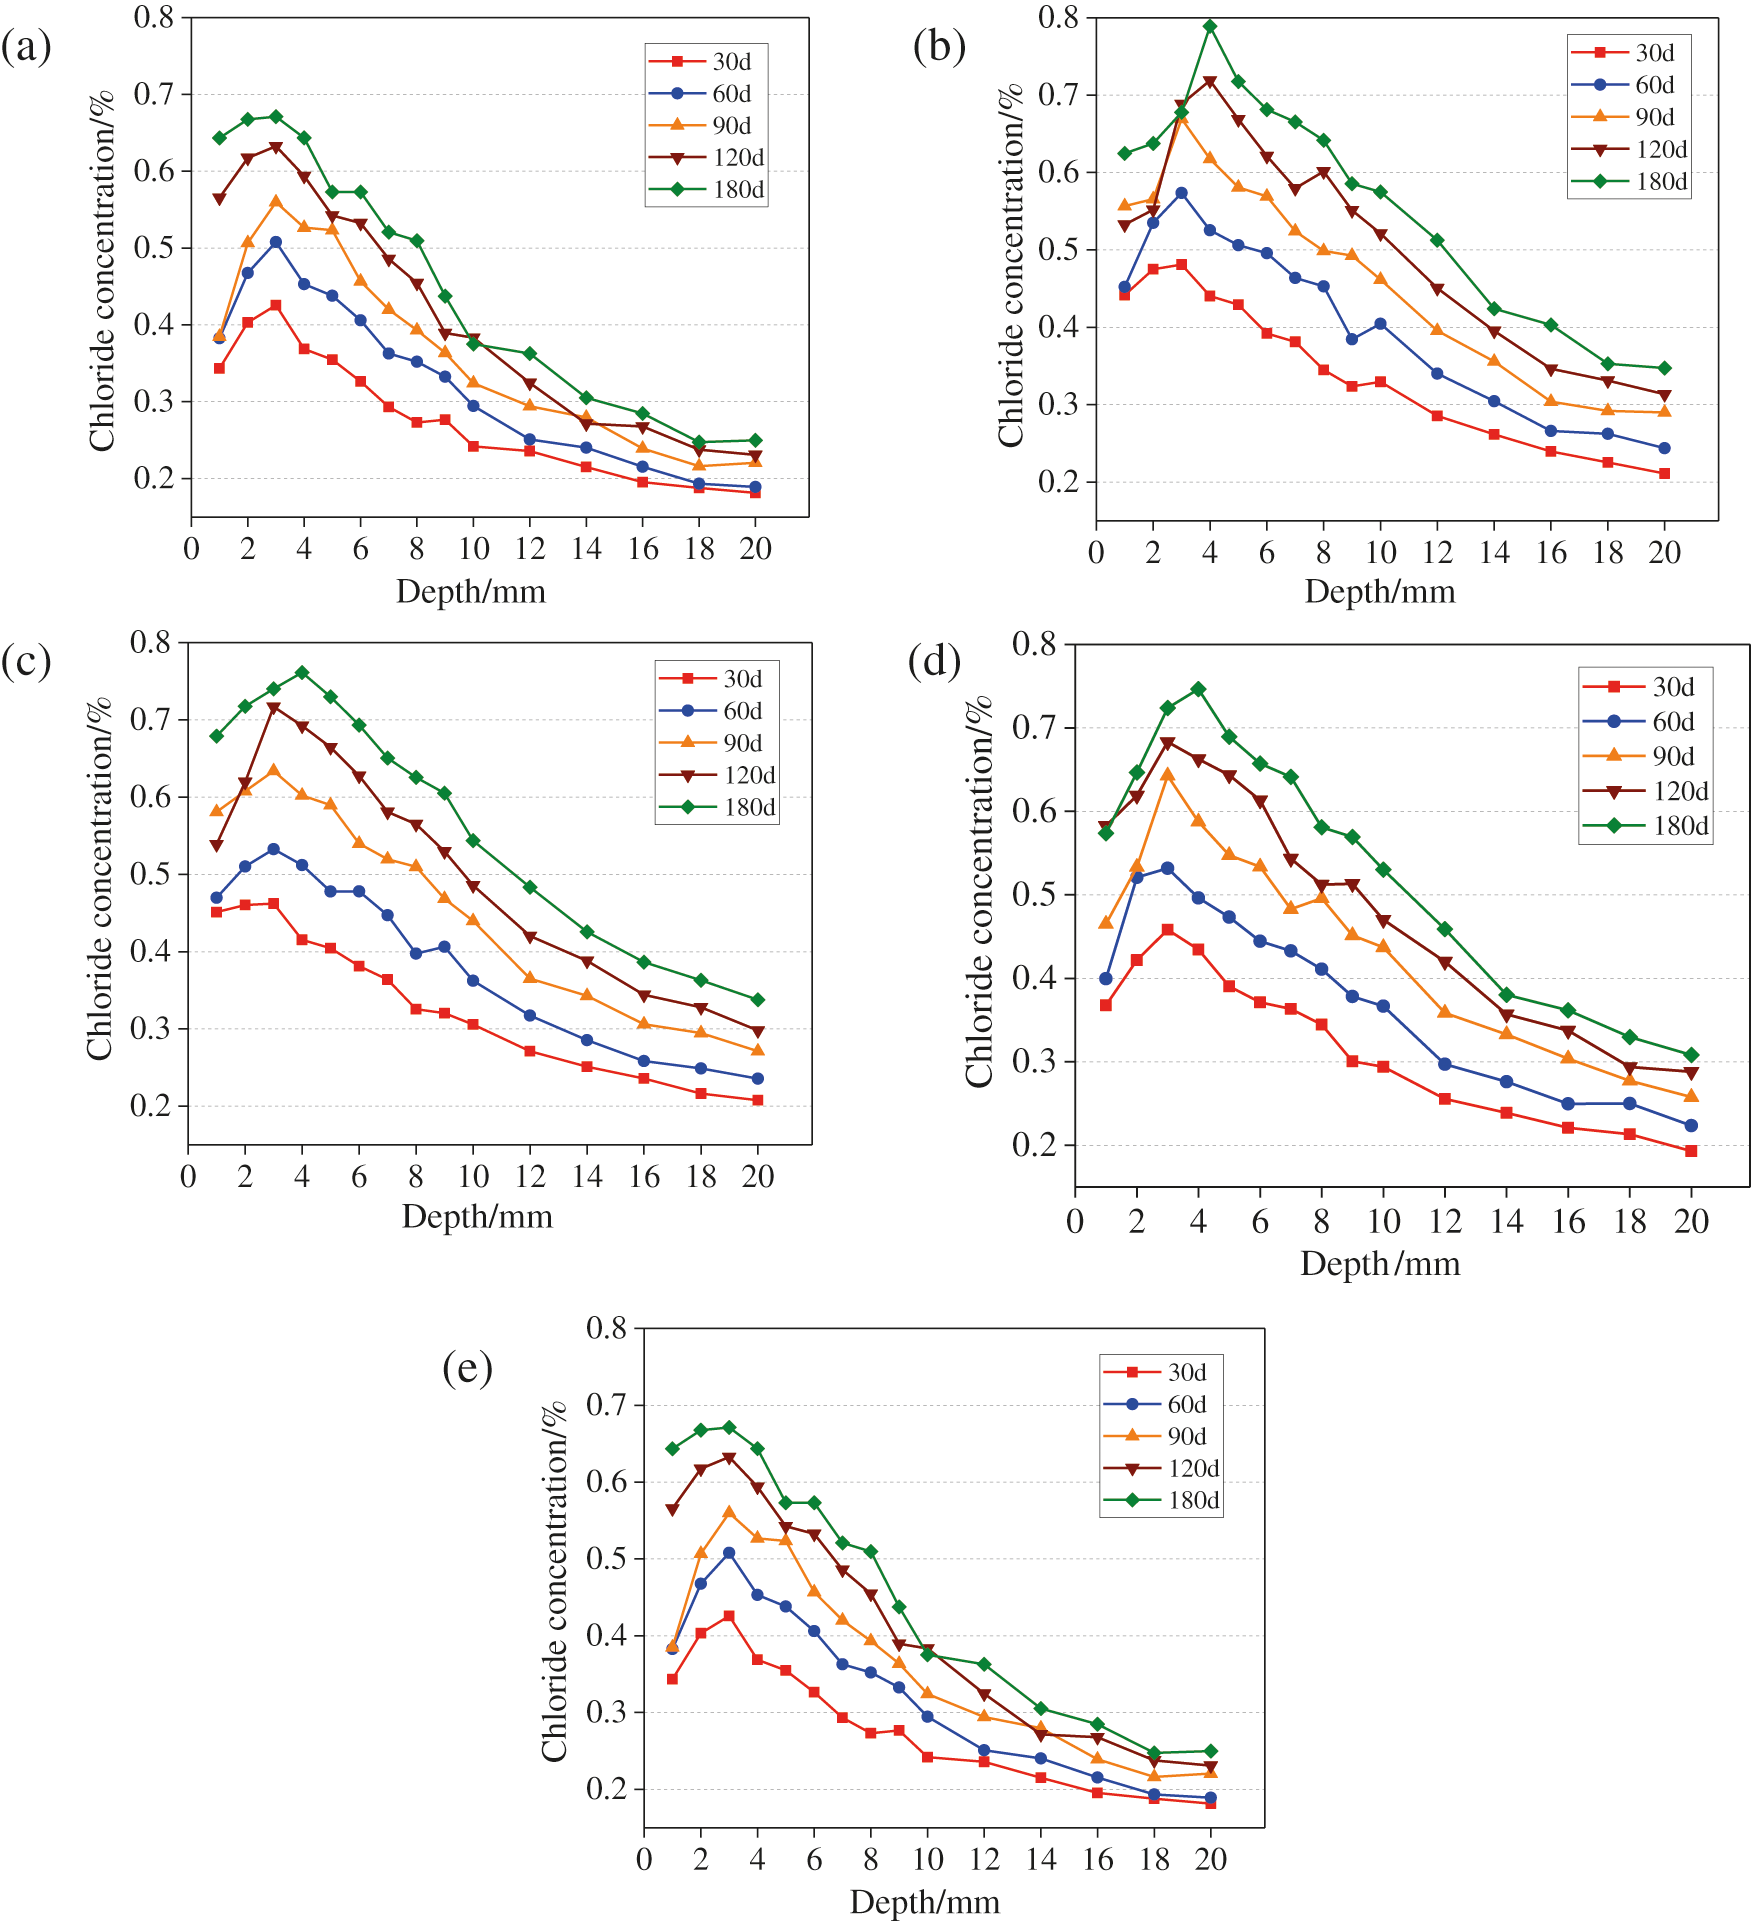
Figure 7: Chloride concentration curve in concrete. (a) O30; (b) C30; (c) C30F15; (d) C30B15; (e) C30F15S5
3.2.2 Peak Chloride Concentration
In the marine tidal area, the peak chloride concentration (Cp) appeared in the concrete. The variations of Cp at different erosion times are presented in Fig. 8. As shown, with the increasing erosion time, the Cp gradually increased, and the increase rate in the early state is high. The Cp of O30 is 25.9%–33.9% lower than that of C30. The coral aggregate contains chlorides, and CAC has a larger porosity; thus, more chlorides enter the CAC. At the same erosion time, the Cp of C30F15, C30B15, and C30F15S5 are all lower than that of C30, with C30F15S5 having the lowest Cp (4.7%–11.9% lower than that of C30). The concrete surface layer in the marine tidal area is a region of coupled convection and diffusion action, where chloride erosion and accumulation processes are complex, and the diffusion mechanism is dominant within the Cp. As shown in Fig. 8, the Cp clearly exhibited time-varying law. Typically, the variation law of the surface chloride concentration described using power function [23,24]. Therefore, in this study, the power function is selected to fit the variation law of the Cp of the CAC, and the results are presented in Fig. 9. As shown, the correlation coefficients of the five groups of concrete fits are all greater than 0.965, indicating that the power-function model can accurately describe the time-varying law of the Cp of CAC in marine tidal area.
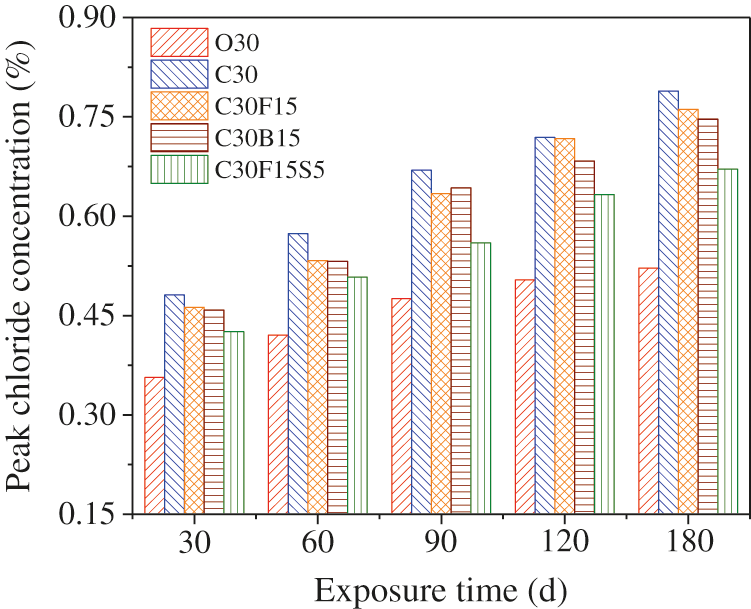
Figure 8: Peak chloride concentration of CAC at different exposure times
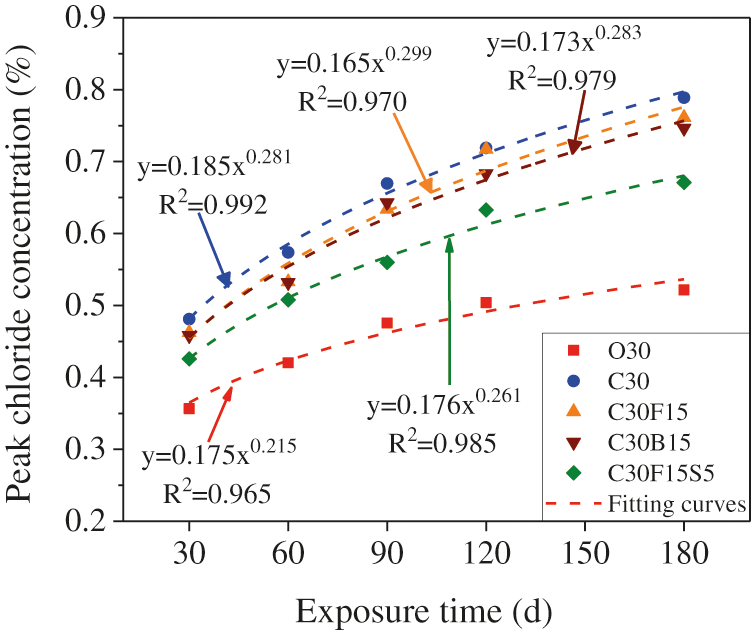
Figure 9: Fitting curves of peak chloride concentration
3.2.3 Chloride Diffusion Coefficient
The variation law of the chloride diffusion coefficient (Da) of the CAC is presented in Fig. 10. As shown, with the increasing erosion time, the Da decreased for all the groups of concrete as the erosion time increases. This is because concrete is a hydraulic material and as the hydration process continues, more cementation products are generated, which fill the pores of concrete and make it more compact. Moreover, ions that diffuse into the concrete accumulate inside and hinder chloride diffusion [25]. At the same erosion time, the Da of O30 is 7.5%–27.3% smaller than that of C30. This is because coral is a porous material which leads to a high internal porosity of the concrete, adversely affecting its chloride permeability resistance. The Da of C30F15 and C30B15 are 6.7%–11.8% and 7.0%–14.1% smaller than that of C30, respectively, indicating that the addition of both FA and BFS can reduce the Da and improve the chloride erosion resistance of CAC. The Da of C30F15S5 is 42.5%–45.0% smaller than that of C30, indicating a significant reduction. SF has a strong filling and pozzolanic effects [20]. Physically, it fills the pores, making the concrete more compact, and blocks the channels for chloride transmission. Chemically, it can improve the composition of concrete hydration products and the ability of concrete to bind chloride, so as to enhance the chloride erosion resistance of CAC.
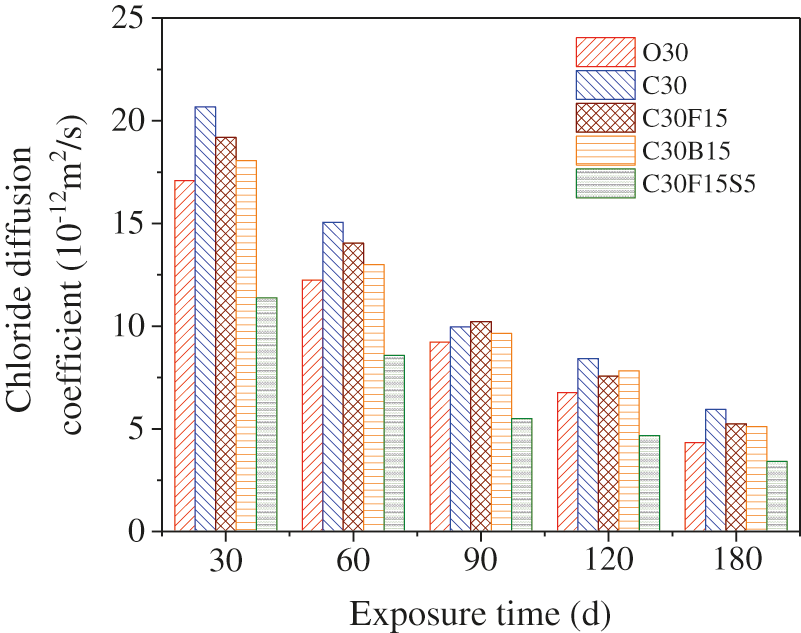
Figure 10: Chloride diffusion coefficient of concrete at different erosion times
The chloride corrosion resistance of concrete usually depends on its microstructure, particularly its porosity. The drying method [26] and thermogravimetric method [27] are used to calculate the porosity of the CAC. The drying method is used to calculate the porosity P1 of the CAC according to Eq. (2):
where: mSD is the mass of concrete specimen after vacuum water saturation; mOD is the mass of concrete specimen after complete drying; mFD is the floating weight of concrete specimen after vacuum water saturation.
The theoretical porosity P2 can be calculated by the TG data obtained from the thermogravimetric test, as shown in Eq. (3):
Eq. (3) is applied to mortar specimens. For the theoretical porosity of CAC, Eq. (4) can be used to calculate:
where P2 is the theoretical porosity; Vpore represents pores formed by evaporation of free water in CAC; Vwater represents the volume of mixing water; Vsolid represents the volume of other components in concrete (including cement, FA, BFS, SF, coral coarse aggregate and coral fine aggregate); Mwater represents the mass of mixing water; BW is the content of bound water and 1.3 is the average density of chemical bound water; Mcement, Mcoarse, Mfine, MFA, MBFS and MSF represent the mass of cement, coral coarse aggregate, coral fine aggregate, FA, BFS and SF, respectively; ρcement, ρcoarse, ρfine, ρFA, ρBFS and ρSF represents the density of cement, coral coarse aggregate, coral fine aggregate, FA, BFS and SF, respectively.
The CAC porosity values calculated using the drying and thermogravimetric methods are shown in Fig. 11. As shown, the variation trends of the porosity are similar between the two calculation methods. The result of correlation analysis is presented in Fig. 12. As shown, there is a strong correlation between the results of the two test methods, confirming their accuracy. The porosity of C30F15 is 11.8% higher than that of C30, mainly because the pozzolanic effect of FA is low, and the hydration rate is slower in the early stage of the hydration process. The cementitious materials produced could not fill the pores inside the concrete well, resulting in a high porosity of the CAC. However, FA also exhibits a strong microaggregate effect. The fine FA particles are uniformly dispersed within the cement paste, which helped to fill and refine the capillary pores, optimized the pore structure of the concrete, and increase the complexity of the pores, slowing the chloride diffusion. This may be why the porosity of C30F15 concrete is higher than that of C30, but the chloride diffusion coefficient of C30F15 is smaller than that of C30 [20]. The porosity of C30B15 is 14.1% lower than that of C30, indicating that the addition of 15% BFS to CAC can reduce its porosity. This is due to the stronger pozzolanic effect of BFS and faster early hydration, which reduces the coarse crystallization and unstable hydration products, and the secondary hydration generates calcium silicate hydrates. Thus, the porosity of the CAC is reduced. The porosity of C30F15S5 is 27.1% lower than that of C30, because the SF particle size is far smaller than those of FA and BFS. When SF is mixed with cement in addition to FA, it has a strong filling effect, which optimizes the pore structure of the CAC, making the concrete structure more compact and reducing the porosity.
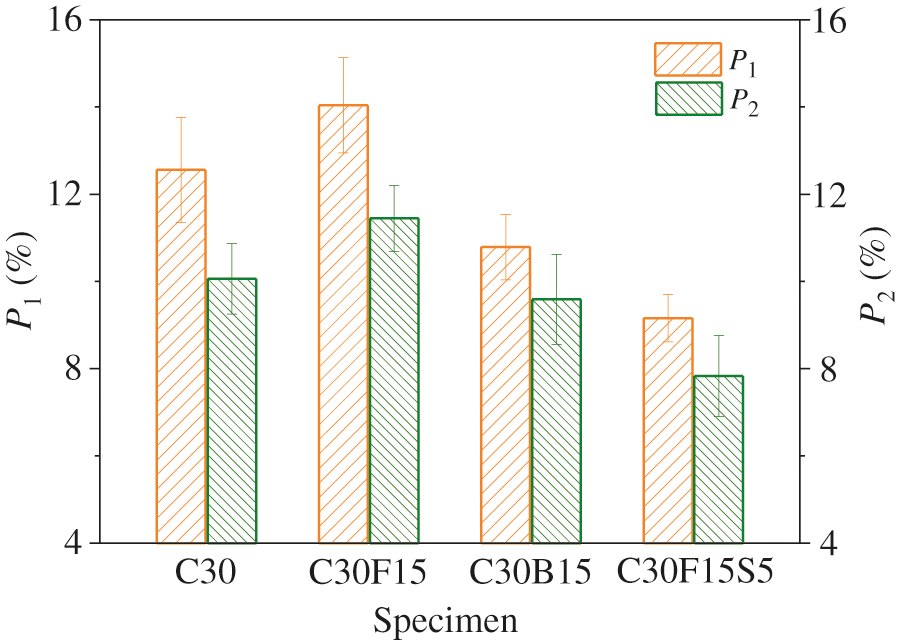
Figure 11: Porosity of CAC
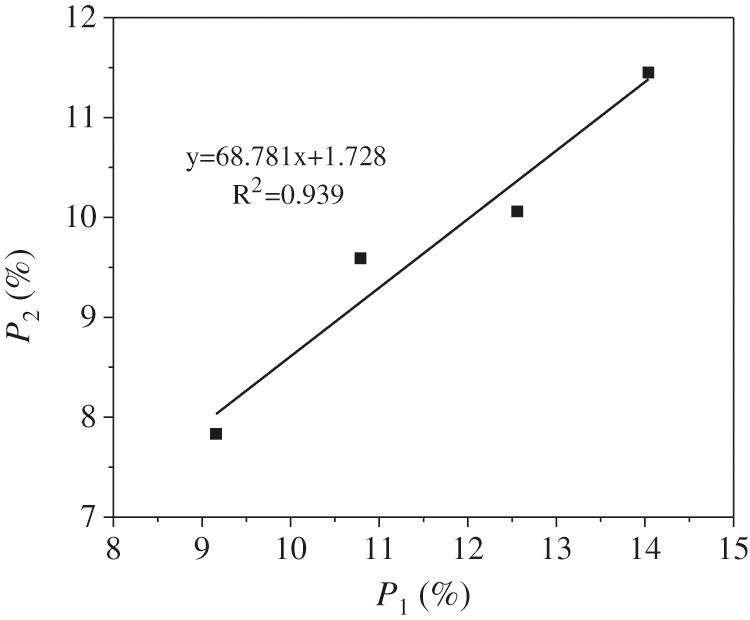
Figure 12: Porosity correlation analysis
The correlation between the porosity and the compressive strength of the CAC is analyzed, and the results are presented in Fig. 13. As shown, there is a strong negative correlation between the porosity and the compressive strength; i.e., a higher porosity of the CAC corresponded to a lower compressive strength. The pore structure of concrete is an important aspect of its microstructure and affects its mechanical properties of concrete. When BFS and SF are added to CAC to reduce its porosity, the matrix becomes more compact, and the compressive strength of the concrete is improved. As shown in Fig. 14, there is a strong positive correlation between the porosity and the Da; i.e., a higher porosity of the CAC corresponded to a larger Da. As the porosity of the concrete increases, the number of internal connecting pores increases, which provides new channels for chloride transport, increasing the Da.
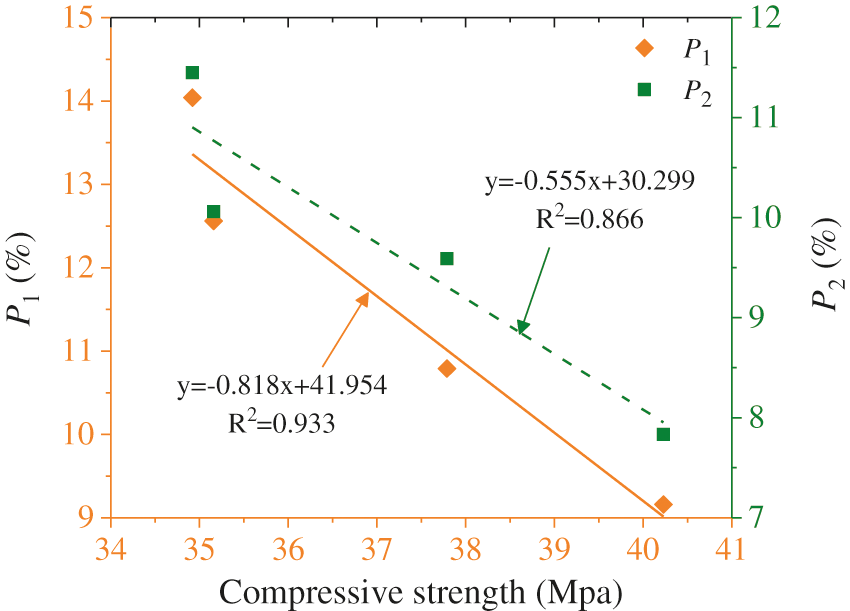
Figure 13: Relationship between compressive strength and porosity
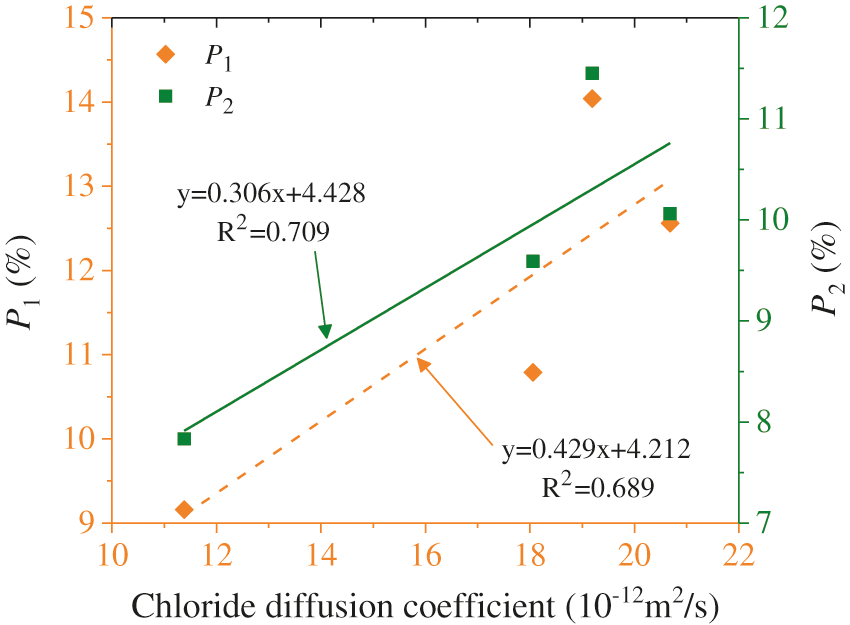
Figure 14: Relationship between chloride diffusion coefficient and porosity
Coral materials can replace concrete aggregates and achieve material self-sufficiency, reducing the construction costs of island projects. In actual engineering, the low chloride penetration resistance of CAC may lead to rusting of the internal reinforcement of concrete and reduce the service life of the structure. However, the addition of appropriate amounts of mineral admixtures to CAC can effectively improve its chloride penetration resistance. According to the results of this study, a maximum reduction in the Da of 45.0% is achieved by adding 15% FA and 5% SF to CAC, which effectively improved the chloride erosion resistance of the CAC. The time required for chloride to reach the surface of the reinforcement is reduced accordingly, which prolongs the service life of the structure. In addition, because of the high concentration of chloride in CAC, it is recommended to add rust inhibitors for reinforcement or to use corrosion-resistant reinforcement.
The effects of different mineral admixtures on the chloride diffusion properties of CAC in marine tidal areas are investigated. The following conclusions are as drawn:
1. The compressive strength of CAC can be improved by adding BFS alone or by combining FA and SF, and the largest improvement is 14.4% when combining 15% FA and 5% SF.
2. The Cc of CAC exhibits a “two-stage” distribution pattern; i.e., as the erosion depth increases, the Cc first increases and then decreases, resulting in a CP of the concrete. The addition of mineral admixtures to CAC can reduce the Cc, and in this study, the reduction is largest when combining with 15% FA and 5% SF.
3. The CP of CAC followed a power function, increasing with the exposure time. The CP of OAC is 25.9%–33.9% lower than that of CAC, whereas the CP is reduced by 4.7%–11.9% when combining with 15% FA and 5% SF.
4. The Da of CAC decreased with the increasing exposure time. The maximum reduction in the Da is 14.1% when FA or BFS is mixed alone and 45.0% when 15% FA and 5% SF are added.
5. There is a strong negative correlation between the porosity and the compressive strength of CAC, and a strong positive correlation between the porosity and the Da.
Funding Statement: This study was supported by the National Natural Science Foundation of China (No. 51590914).
Conflicts of Interest: The authors declare that they have no conflicts of interest to report regarding the present study.
1. Ma, H. Y., Wu, Z. Y., Yu, H. F., Zhang, J. H., Yue, C. J. (2020). Experimental and three-dimensional mesoscopic investigation of coral aggregate concrete under dynamic splitting-tensile loading. Materials and Structure, 53(1), 12.1–12.20. DOI 10.1617/s11527-020-1447-5. [Google Scholar] [CrossRef]
2. Zhou, L. L., Guo, S. C., Zhang, Z. H., Shi, C. J., Jin, Z. Q. et al. (2021). Mechanical behavior and durability of coral aggregate concrete and bonding performance with fiber-reinforced polymer (FRP) bars: A critical review. Journal of Cleaner Production, 289, 125652. DOI 10.1016/j.jclepro.2020.125652. [Google Scholar] [CrossRef]
3. Chu, Y. J., Wang, A. G., Zhu, Y. C., Wang, H., Liu, K. W. et al. (2021). Enhancing the performance of basic magnesium sulfate cement-based coral aggregate concrete through gradient composite design technology. Composites Part B: Engineering, 227, 109382. DOI 10.1016/j.compositesb.2021.109382. [Google Scholar] [CrossRef]
4. Huang, D. G., Niu, D. T., Su, L., Liu, Y. H., Guo, B. B. et al. (2022). Diffusion behavior of chloride in coral aggregate concrete in marine salt-spray environment. Construction and Building Materials, 316, 125878. DOI 10.1016/j.conbuildmat.2021.125878. [Google Scholar] [CrossRef]
5. Ying, J. W., Huang, Y. J., Qin, L., Gao, X., Wang, Z. K. (2021). Axial compressive behavior of GFRP tube confined seawater coral aggregate concrete reinforced with epoxy-coated bars. Composite Structures, 266, 113807. DOI 10.1016/j.compstruct.2021.113807. [Google Scholar] [CrossRef]
6. Liang, X. Z., Yin, S. P., Hu, C. S. (2021). Environmental reduction factors of BFRP bars in coral aggregate concrete in high temperature and high humidity environments. Structures, 33, 3017–3024. DOI 10.1016/j.istruc.2021.06.021. [Google Scholar] [CrossRef]
7. Rick, E. (1991). Coral concrete at bikini atoll. Concrete International, 13, 19–24. [Google Scholar]
8. Yuan, Y. F. (2015). Mix design and property of coral aggregate concrete. Nanjing University of Aeronautics and Astronautics, China. [Google Scholar]
9. Cheng, S. K., Shui, Z. H., Sun, T., Yu, R., Zhang, G. Z. et al. (2017). Effects of fly ash, blast furnace slag and metakaolin on mechanical properties and durability of coral sand concrete. Applied Clay Science, 141, 111–117. DOI 10.1016/j.clay.2017.02.026. [Google Scholar] [CrossRef]
10. Zhu, S. Y., Shui, Z. H., Yu, R., Cheng, S. K., Wang, X. P. (2017). Influence of mineral admixtures on the properties of coral sand concrete. Bulletin of the Chinese Ceramic Society, 36(12), 3951–3957. DOI 10.16552/j.cnki.issn1001-1625.2017.12.001. [Google Scholar] [CrossRef]
11. Liu, B., Geng, S. Y., Li, Z., Guo, J. H., Deng, Z. H. et al. (2021). Experimental and modeling research on compression-shear behavior of carbon fiber reinforced coral concrete. Construction and Building Materials, 301, 124347. DOI 10.1016/j.conbuildmat.2021.124347. [Google Scholar] [CrossRef]
12. Liu, B., Zhou, J. K., Wen, X. Y., Hu, X., Deng, Z. H. (2020). Mechanical properties and constitutive model of carbon fiber reinforced coral concrete under uniaxial compression. Construction and Building Materials, 263, 120649. DOI 10.1016/j.conbuildmat.2020.120649. [Google Scholar] [CrossRef]
13. Fu, Q., Xu, W. R., He, J. Q., Su, L., Song, H. et al. (2021). Dynamic strength criteria for basalt fibre-reinforced coral aggregate concrete. Composites Communications, 28, 100983. DOI 10.1016/j.coco.2021.100983. [Google Scholar] [CrossRef]
14. Chen, M., Sun, Z. H., Tu, W. L., Yan, X., Zhang, M. Z. (2021). Behaviour of recycled tyre polymer fibre reinforced concrete at elevated temperatures. Cement and Concrete Composites, 124, 104257. DOI 10.1016/j.cemconcomp.2021.104257. [Google Scholar] [CrossRef]
15. Li, T. Y., Liu, X. Y., Zhang, Y. M., Yang, H., Li, Z. H. et al. (2020). Preparation of sea water sea sand high performance concrete (SHPC) and serving performance study in marine environment. Construction and Building Materials, 254, 119114. DOI 10.1016/j.conbuildmat.2020.119114. [Google Scholar] [CrossRef]
16. Dou, X. M., Yu, H. F., Ma, H. Y., Da, B., Mi, R. J. et al. (2017). Experiment on chloride diffusion coefficient of coral concrete expose to marine environment. Ocean Engineering, 35, 129–135. DOI 10.16483/j.issn.1005-9865.2017.01.015. [Google Scholar] [CrossRef]
17. Huang, D. G., Niu, D. T., Su, L., Fu, Q. (2021). Chloride diffusion behavior of coral aggregate concrete under drying-wetting cycles. Construction and Building Materials, 270, 121485. DOI 10.1016/j.conbuildmat.2020.121485. [Google Scholar] [CrossRef]
18. Niu, D. T., Su, L., Luo, Y., Huang, D. G., Luo, D. G. (2020). Experimental study on mechanical properties and durability of basalt fiber reinforced coral aggregate concrete. Construction and Building Materials, 237, 117628. DOI 10.1016/j.conbuildmat.2019.117628. [Google Scholar] [CrossRef]
19. Wang, J. B. (2016). Study of deterioration law and mechanism of shotcrete durability performance. Xi’an University of Architecture and Technology, China. [Google Scholar]
20. Hu, H. M., Ma, B. G. (2016). Concrete mineral admixture. China: China Electric Power Press. [Google Scholar]
21. Da, B., Yu, H. F., Ma, H. Y., Tan, Y. S., Mi, R. J. et al. (2016). Chloride diffusion study of coral concrete in a marine environment. Construction and Building Materials, 123, 47–58. DOI 10.1016/j.conbuildmat.2016.06.135. [Google Scholar] [CrossRef]
22. Cheng, S. K., Shui, Z. H., Sun, T., Yu, R., Zhang, G. Z. (2018). Durability and microstructure of coral sand concrete incorporating supplement cementitious materials. Construction and Building Materials, 171, 44–53. DOI 10.1016/j.conbuildmat.2018.03.082. [Google Scholar] [CrossRef]
23. Kassir, M. K., Ghosn, M. (2002). Chloride-induced corrosion of reinforced concrete bridge decks. Cement and Concrete Research, 32(1), 139–143. DOI 10.1016/S0008-8846(01)00644-5. [Google Scholar] [CrossRef]
24. Pack, S. W., Jung, M. S., Song, H. W., Kin, S. H., Ann, K. Y. (2010). Prediction of time dependent chloride transport in concrete structures exposed to a marine environment. Cement and Concrete Research, 40(2), 302–312. DOI 10.1016/j.cemconres.2009.09.023. [Google Scholar] [CrossRef]
25. Da, B. (2017). Research on the preparation technology, durability and mechanical properties of concrete members of high strength coral aggregate seawater concrete. Nanjing University of Aeronautics and Astronautics, China. [Google Scholar]
26. Diamond, S. (2000). Mercury porosimetry–An inappropriate method for the measurement of pore size distributions in cement-based materials. Cement and Concrete Research, 30(10), 1517–1525. DOI 10.1016/S0008-8846(00)00370-7. [Google Scholar] [CrossRef]
27. Luo, D. M., Niu, D. T. (2021). Gas transportation properties of internal cured concrete under different moisture conditions. Journal of Building Materials, 42(8), 193–203. DOI 10.14006/j.jzjgxb.2020.C390. [Google Scholar] [CrossRef]
 | This work is licensed under a Creative Commons Attribution 4.0 International License, which permits unrestricted use, distribution, and reproduction in any medium, provided the original work is properly cited. |