| Journal of Renewable Materials |
DOI: 10.32604/jrm.2022.021251
ARTICLE
Research on Dynamic and Static Test Methods for Evaluating the Poisson’s Ratio of Oriented Strand Board
College of Materials Science and Engineering, Nanjing Forestry University, Nanjing, 210037, China
*Corresponding Author: Zheng Wang. Email: wangzheng63258@163.com
Received: 14 February 2022; Accepted: 24 March 2022
Abstract: In this article, dynamic method and static method of testing Poisson’s ratio of OSB (Oriented Strand Board) were proposed. Through modal and static numerical analyses, the position where the transverse stress is equal to zero was determined. The binary linear regression method was applied to express the gluing position of the strain gauge as a relational expression that depended on the length-width ratio and width-thickness ratio of the cantilever plate. Then the longitudinal and transverse Poisson’s ratios of OSB were measured by the given dynamic and static methods. In addition, the test results of OSB Poisson’s ratio were analyzed with the probability distribution of random variables. The results showed that using the proposed dynamic method and static method, the test results for longitudinal and transverse Poisson’s ratios of OSB were quite consistent, despite the gluing position of the strain gauges being different. And these OSB Poisson’s ratios were accorded with that obtained by the axial tensile method and the four-point bending method. OSB longitudinal and transverse Poisson’s ratios followed Weibull distribution.
Keywords: OSB; Poisson’s ratio; cantilever plate; dynamic test; static test
OSB is currently recognized as a three-layer structure board with mature technology, fast development, and application prospects. Since it came out in the late 1970s, it has been widely used in many fields such as construction, packaging, furniture, and decoration because of its good stability, low material consumption, high strength, and environmental protection. The production process of OSB can be described as follows. Firstly, wood is sawed along the grain direction to obtain flat, narrow and long chips with certain size (generally 40–100 mm in length, 5–20 mm in width, 0.3–0.7 mm in thickness). Then adhesives and additives were applied to these dried and screened wood chips. And finally these chips were oriented and hot pressed to form a three-layer structure board [1,2].
In the outer layer and core layer of OSB, the texture direction of the wood chips is usually parallel and perpendicular to the longitudinal axis of the board. From the observation of the board surface, it can be found that the shape and size of the chips are irregular, and the laying direction of some chips deviates from the longitudinal direction of the board, which means there is a certain randomness in the shape, size and laying direction of the chips in the outer layer. In addition, sometimes there are even small holes or blisters in the board. The above factors have led to the non-uniformity of OSB.
Elastic modulus, shear modulus and Poisson’s ratio are the basic parameters to characterize the mechanical properties of materials, which need to be tested [3–6]. Wang et al. [7] applied the free plate torsional mode method to test the longitudinal elastic modulus, transverse elastic modulus, and in-plane shear modulus of OSB. The test results showed that, the longitudinal elastic modulus was 2.89 times the transverse elastic modulus. The in-plane shear modulus of OSB longitudinal and transverse cantilever specimens were almost equal. For OSB, parameters such as bending, tensile, and shear are more conventional to be obtained, while the data of Poisson’s ratio is scarce [8–11]. Therefore, it is necessary to explore methods that can accurately test Poisson’s ratio.
Fan et al. [12] used the axial stretching method to test OSB Poisson’s ratio in the longitudinal and transverse directions, and also at ±45° to the longitudinal direction. Thomas [13] used the axial tensile method to test OSB principal Poisson’s ratio (referred to as the longitudinal and transverse Poisson’s ratio in this article). Fan and Thomas adopted the same test method (axial stretching method), but the obtained OSB Poisson’s ratio values are quite different. The reason is worth exploring, which enlightens researchers to develop other methods to test OSB Poisson’s ratio. Kang [14] and Kumpenza et al. [15] applied static tensile method, combined with optical and digital image techniques to measure the displacement under load. Poisson’s ratios of poplar (Populus tomentosa Carr.) and the six principal Poisson’s ratios of spruce (Picea abies (L.) Karst.) were obtained. The feasibility of measuring Poisson’s ratio of wood using optical method was explored, however, the error of measured values was large. For instance, the results of EL, ER, ET, νLR, νLT, νRL, νRT, νTL, νTR (E is the elastic modulus, ν is the Poisson’s ratio, and L, R, T in the subscript represent the three main directions of wood: longitudinal, radial and tangential; refer to note in Table 1 for more details) measured by Kumpenza did not satisfy that the flexibility matrix elements in the principal in-plane stress-strain relationship of LR, LT and RT must be symmetrical with respect to the diagonal, and there was a considerable deviation from symmetry. Therefore, the test results were not successful. Aydin et al. [16] calculated the six principal Poisson’s ratios by measuring the elastic modulus and shear modulus of the 10-year black pine (Pinus nigra Arnold.) and the result was verified by compression test. Wang et al. [17] took Sitka spruce (Picea sitchensis (Bong.) Carr.) as the specimen, and dynamically tested the principal Poisson’s ratio of the spruce longitudinal section and transverse section by gluing the longitudinal and transverse strain gauges on the middle of the cantilever plate. The results showed that if using the strain method to test the OSB Poisson’s ratio, it was particularly important to fully consider the non-uniformity of the OSB material when verifying the effectiveness of the strain gauge gluing position.
The purpose of this study is to explore the applicability of dynamic and static methods for testing OSB longitudinal and transverse Poisson’s ratios. Based on the previous researches [18–21], this study took the cantilever plate as the specimen and glued the strain gauges on the surface of the cantilever plate. The gluing position is where the transverse stress is equal to zero when the cantilever plate performing first-order bending or static bending. Then the dynamic and static tests were carried out, using the cantilever plate first-order bending mode method (referred to as the dynamic method in this article) and the cantilever plate static bending method (referred to as the static method in this article).
2 Simulation Analysis for OSB Poisson’s Ratio
2.1 Stress and Strain Analysis
The ANSYS 12.1 modal and static bending program blocks were used to analyze the static and dynamic stress and strain of the cantilever plate specimens. The ANSYS calculation used Solid 45 units and 50 × 10 network division. The input material constants are shown in Table 1.
The stress and strain calculation of OSB cantilever plate first-order bending mode adopted ANSYS modal program blocks. And that of OSB cantilever plate static bending adopted ANSYS static bending program blocks. For the static method, load was a concentrated force acting on the middle of the free end of the cantilever plate; its value was 10 N, and the direction was perpendicular to the plate surface downward.
σx, σy, εx, and εy were the output parameters of ANSYS calculation. σ is the stress component, ε is the strain component, and the subscripts represent the direction.
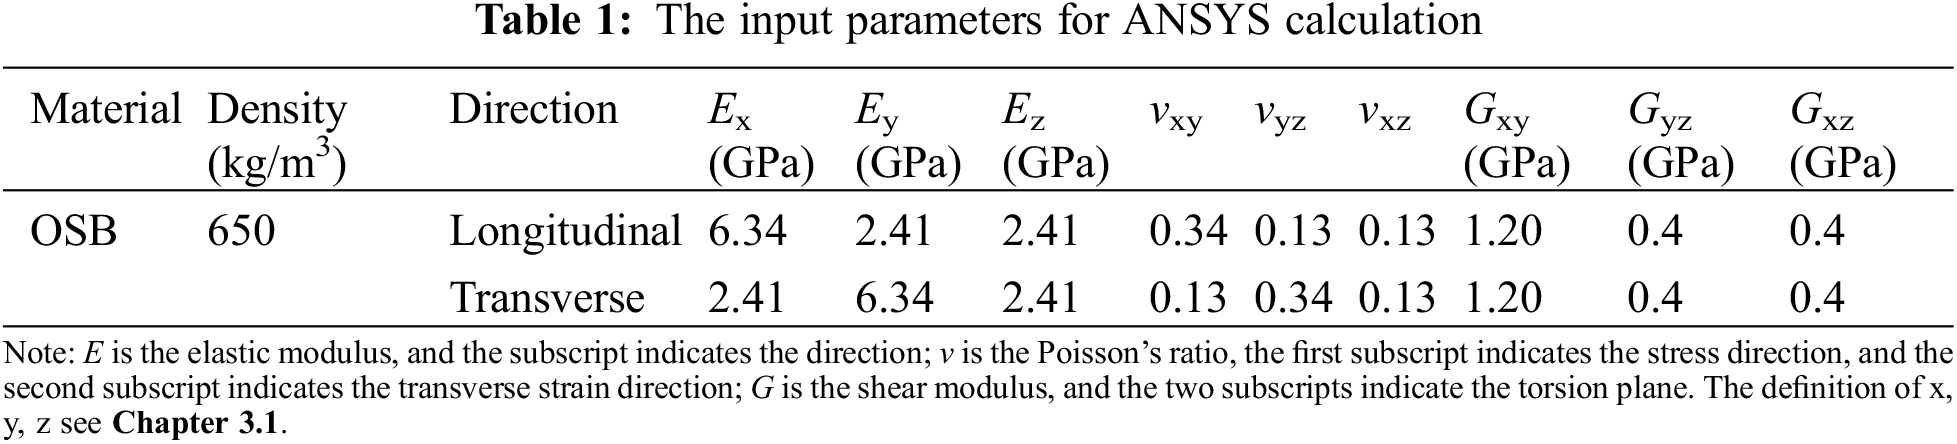
The stress and strain calculation results of OSB cantilever plate first-order bending mode and static bending showed: during the first-order bending and the static bending vibration of OSB cantilever plate, there were points where the transverse stress was equal to 0. Although the positions of the points were different, the absolute value of the ratio of the transverse strain to the longitudinal strain was equal to the value of Poisson’s ratio inputted in ANSYS (Figs. 1, 2 and Table 1).
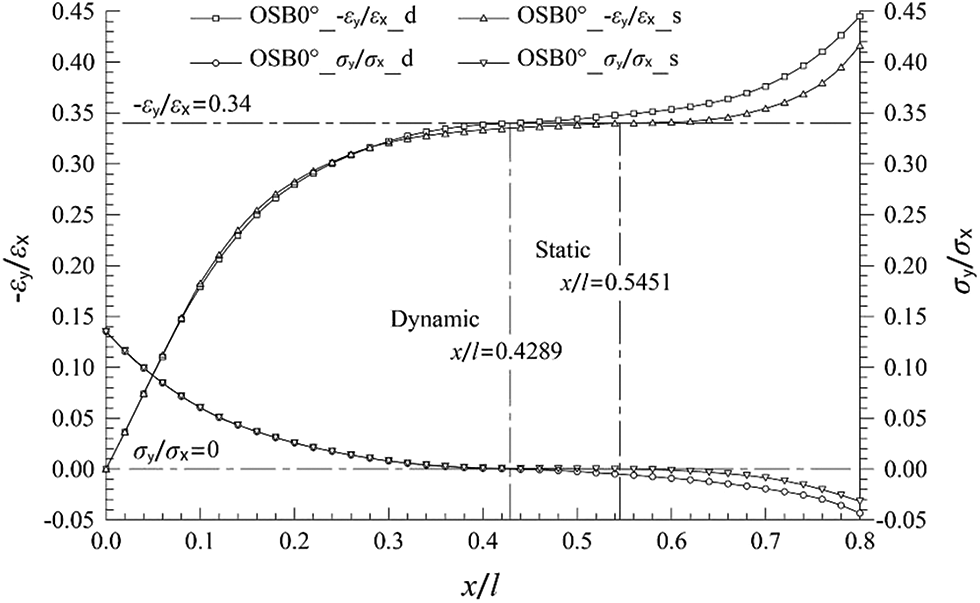
Figure 1: Dynamic and static curves −εy/εx − x/l, σy/σx − x/l of OSB longitudinal cantilever plate
Figure 2: Dynamic and static curves −εy/εx − x/l, σy/σx − x/l of OSB transverse cantilever plate
Figs. 1 and 2 respectively show the stress and strain on the midline of OSB cantilever plates (334 mm × 74 mm × 9.75 mm, Table 2) along the x-axis. Whether it was on OSB longitudinal or transverse cantilever plate, under dynamic test or static test, there was always a position of transverse stress σy = 0 on the midline. This position varied with the length-width ratio and width-thickness ratio of the cantilever plates, as well as dynamic test or static test. The value of −εy/εx at position σy = 0 was equal to the Poisson’s ratio value inputted in ANSYS calculation.
In Fig. 1, OSB0°_−εy/εx_d represents the absolute value of the ratio of the transverse dynamic strain to the longitudinal dynamic strain of the point on the midline, which changing along the longitudinal direction x/l of the plate during the first-order bending vibration of OSB longitudinal cantilever plate; OSB0°_σy/σx_d represents the value of the ratio of the transverse dynamic stress to the longitudinal dynamic stress of the point on the midline during the first-order bending vibration; OSB0°_−εy/εx_s represents the absolute value of the ratio of the transverse static strain to the longitudinal static strain of the point on the midline during the static bending; OSB0°_σy/σx_s represents the value of the ratio of the transverse static stress to the longitudinal static stress of the point on the midline during the static bending.
For the transverse specimens in Fig. 2, just change 0° to 90°, the meanings of the icon are the same.
2.2 The Gluing Position of Strain Gauges
The material Poisson’s ratio is defined as the absolute value of the ratio of the transverse strain to the longitudinal strain of the specimen under axial tension. In the axial tension state, the specimen is subjected to a unidirectional stress state, which means only the longitudinal stress σx exist in the specimen, and the transverse stress σy = 0. Since the cantilever plate has a position of σy = 0 in both condition of static bending and first-order bending vibration, if the transverse and longitudinal strain gauges are glued at this position, the absolute value of the ratio of the transverse strain to the longitudinal strain obtained by the test can be regarded as Poisson’s ratio. Its effectiveness needs to be verified by other test methods, such as the axial tension method or the four-point bending method.
The positions where the transverse stress is equal to 0 in dynamic and static conditions had been calculated from totally 48 calculation schemes, using OSB longitudinal and transverse cantilever plates with length-width ratio l/b = 3, 4, 5, 6 and width-thickness ratio b/h = 4, 7, 10. Then the binary linear regression calculation on b/l and h/b was applied to obtain the gluing position of the strain gauges for testing OSB Poisson’s ratio.
The gluing position of strain gauges for dynamic test of OSB Poisson’s ratio was:
Longitudinal:
Transverse:
The gluing position of strain gauges for static test of OSB Poisson’s ratio was:
Longitudinal:
Transverse:
In Eqs. (1)–(4), r is the correlation coefficient; n is the number of specimens.
2.3 Calculation for Poisson’s Ratio
Dynamic test: the definition of Poisson’s ratio in the frequency domain is the ratio of the linear spectral amplitude of the transverse strain to that of the longitudinal strain at the first-order bending frequency on the cantilever plate spectrum diagram, which is:
Static test: the definition of Poisson’s ratio is the absolute value of the ratio of the transverse strain increment to the longitudinal strain increment during the static bending of the cantilever plate, which is:
The direction of the length of OSB for the test is longitudinal (0°), which is taken as the x-axis. The direction of the width is transverse (90°), which is taken as the y-axis. And the direction of the thickness is taken as the z-axis. The positive x, y, and z axes follow the right-hand spiral rule.
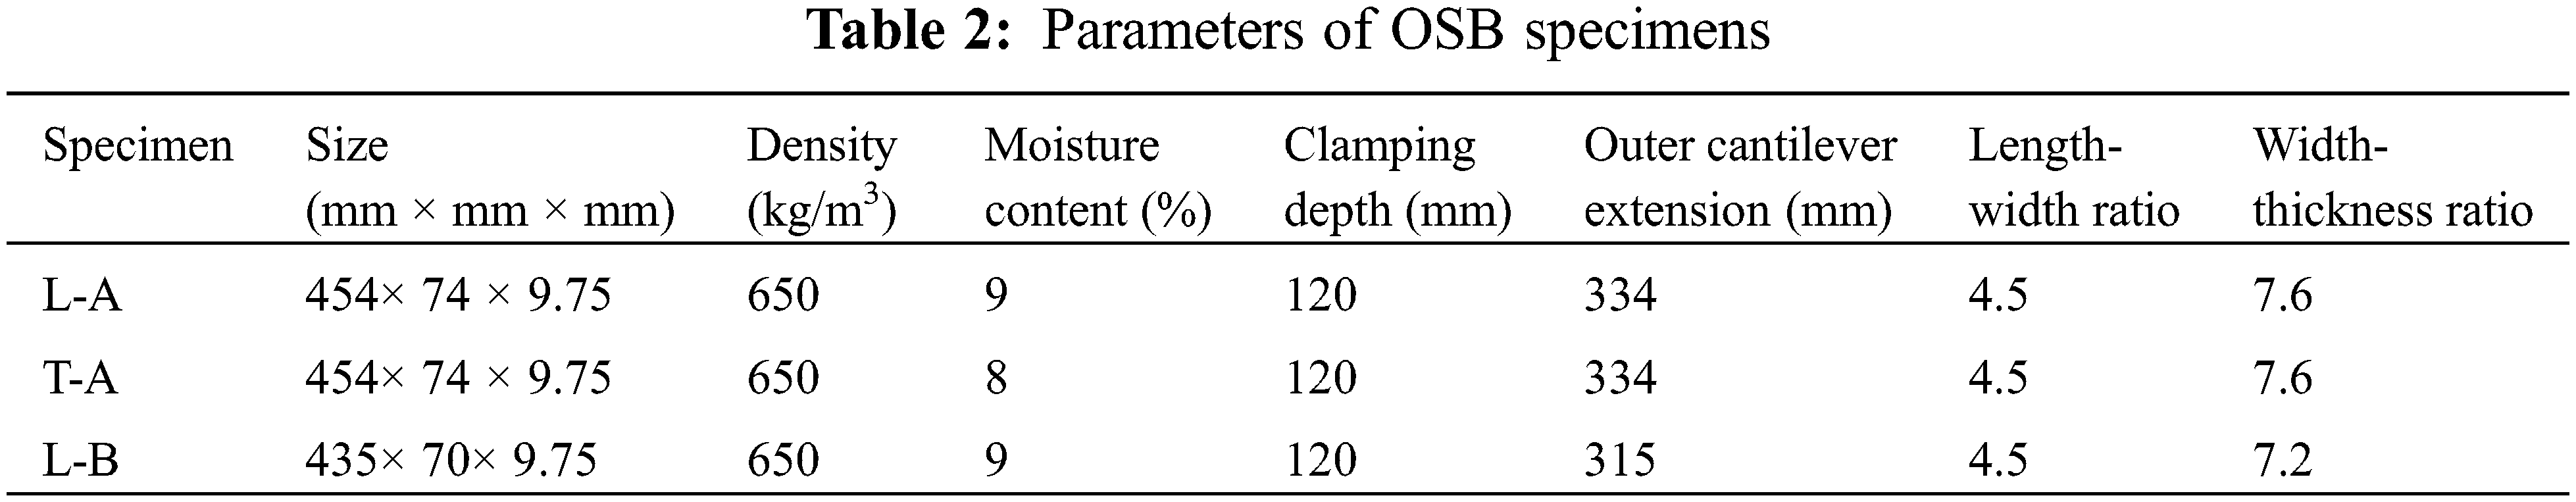
OSB (made in China) was purchased from Tianshen New Material Co., Ltd., China. The strands were made of pine (Pinus sylvestris Linn.), and the methylene diphenyl diisocyanate (MDI) was used as the adhesive. An entire OSB was sawed along the x-axis to make longitudinal specimens (L-A, L-B). Then the board was sawed along the y-axis to make transverse specimens (T-A). Poisson’s ratio obtained by the longitudinal specimen called the OSB longitudinal Poisson’s ratio, and that obtained by the transverse specimen called the OSB transverse Poisson’s ratio. The parameters of these specimens are shown in Table 2.
Test instruments and accessories: CRAS vibration and dynamic signal acquisition and analysis system, including signal conditioning instrument, AZ acquisition box and supporting analysis software; YD-28A dynamic strain indicator; cantilever plate holding device; tensile test device; four-point bending test device; BX120-10AA strain gauges (sensitivity coefficient 2.08%, strain grid 10 mm × 5 mm); bridge boxes; force hammer; glue; several weights; several wires.
3.2 Dynamic and Static Tests of OSB Poisson’s Ratio
After the surface of the board was smoothed with wood sandpaper, the strain gauges would be glued on the position as specified in Chapter 2.2. OSB material were processed into homogeneous material (Chapters 3.2.1, 3.2.2) and heterogeneous material (Chapter 3.2.3), and the experimental schemes was designed, respectively. The purpose of this design was to verify the validity of Eqs. (1)–(4).
3.2.1 Dynamic and Static Tests of OSB Longitudinal Poisson’s Ratio (Specimen L-A)
For OSB longitudinal specimen L-A (334 mm × 74 mm × 9.75 mm), according to Eq. (1), the gluing position for dynamic test of longitudinal Poisson’s ratio should be x/l = 0.4371 (x = 146 mm). And according to Eq. (3), the gluing position for static test of the longitudinal Poisson’s ratio should be x/l = 0.5387 (x = 180 mm). The schematic diagram of the gluing position of upper and lower surfaces is shown in Fig. 3.
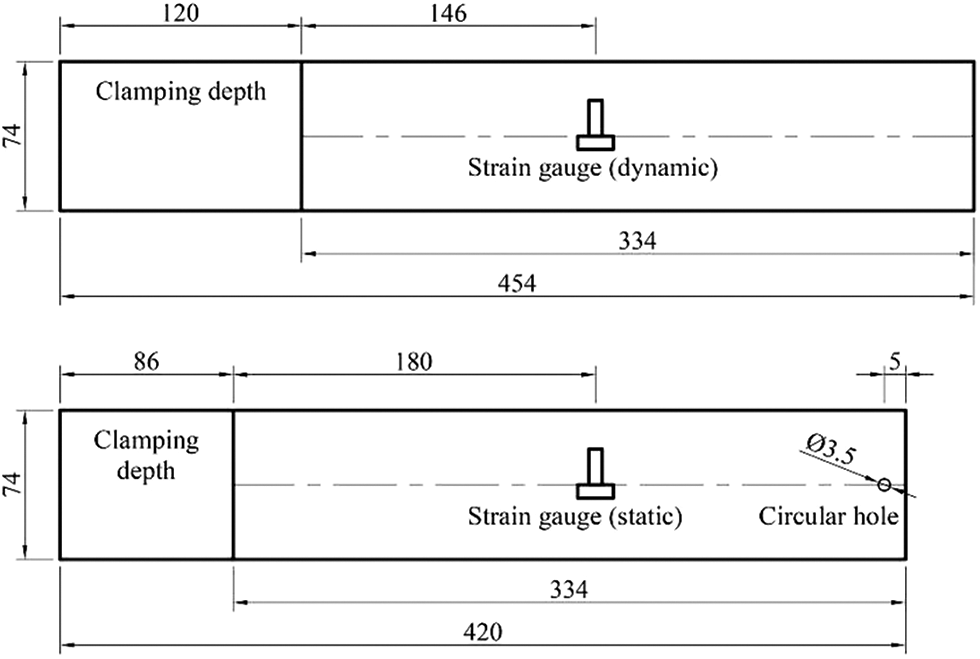
Figure 3: Schematic diagram of the gluing position of the strain gauges of dynamic and static tests of OSB longitudinal Poisson’s ratio on specimen L-A
Considering the randomness of the size and laying direction of the OSB wood chips, the specimen was sawed 34 mm from its free end after the dynamic test of the longitudinal Poisson’s ratio to illustrate the correctness of Eq. (3). The extension of the cantilever was still 334 mm, and the strain gauges were located 180 mm from the fixed edge of the cantilever plate (Fig. 3). It was used for static test of the longitudinal Poisson’s ratio. In addition, a circular hole was obtained with a ϕ3.5 mm drill bit for loading weights, and the center of the circular hole was 5 mm away from the free end.
When applying this processing method to dynamic and static tests of Poisson’s ratio, the state of the wood chips where the strain gauges were glued did not change. But the position of the strain gauges on the cantilever plate of the same span (334 mm) had changed. This change was determined by the Eqs. (1) and (3).
3.2.2 Dynamic and Static Tests of OSB Transverse Poisson’s Ratio (Specimen T-A)
For OSB transverse specimen T-A (334 mm × 74 mm × 9.75 mm), according to Eq. (2), the gluing position for dynamic test of the transverse Poisson’s ratio should be x/l = 0. 3409 (x = 114 mm). And according to Eq. (4), the gluing position for static test of the transverse Poisson’s ratio for should be x/l = 0. 5438 (x = 182 mm).
Similar to Chapter 3.2.1, the specimen was sawed 68 mm from its free end after the dynamic test of the transverse Poisson’s ratio. The extension of the cantilever was still 334 mm, and the strain gauges were located 182 mm from the fixed edge of the cantilever plate. It was used for static test of the transverse Poisson’s ratio. A circular hole was obtained with a ϕ3.5 mm drill bit for loading weights, and the center of the circular hole was 5 mm away from the free end.
3.2.3 Dynamic and Static Tests of OSB Longitudinal Poisson’s Ratio on the Same Specimen (Specimen L-B)
In Chapter 3.2.1, Chapter 3.2.2, the strain gauges were glued on the same position of the cantilever plate, and the extension of the cantilever in the static test was kept the same as that in dynamic test through sawing the specimen. The same strain gauges were used for both dynamic and static tests of OSB Poisson’s ratio.
In this chapter, for OSB longitudinal specimen L-B (315 mm × 70 mm × 9.75 mm), the gluing position was calculated according to Eqs. (1) and (3). The dynamic strain gauges (138 mm from the fixed edge of the cantilever plate) and the static strain gauges (170 mm from the fixed edge) were glued on the upper and lower surfaces of the plate, respectively (Fig. 4). Then the dynamic and static tests of OSB longitudinal Poisson’s ratio were performed.
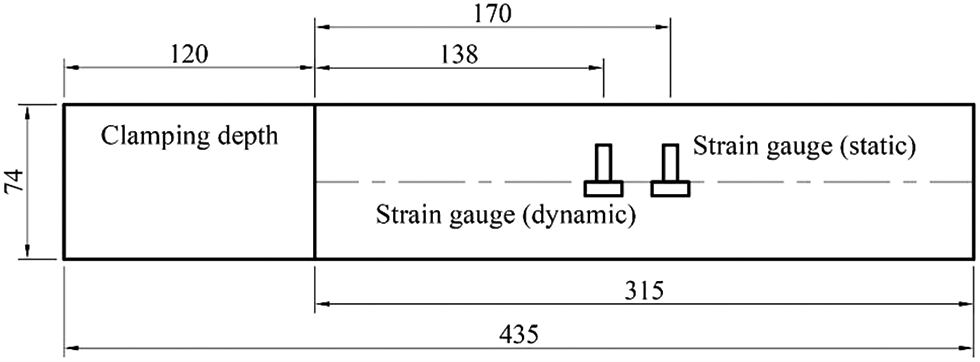
Figure 4: Schematic diagram of the gluing position of the strain gauges of dynamic and static tests of OSB longitudinal Poisson’s ratio on specimen T-B
The test process is shown in Figs. 5 and 6, using dual-channel measurement. The longitudinal strain gauges (0°) on the upper and lower surfaces of the cantilever plate were adopted the half-bridge wiring method, occupying a channel of the dynamic strain indicator. And the transverse strain gauges (90°) on the upper and lower surfaces were also adopted the half-bridge wiring method, occupying another channel of the dynamic strain indicator.
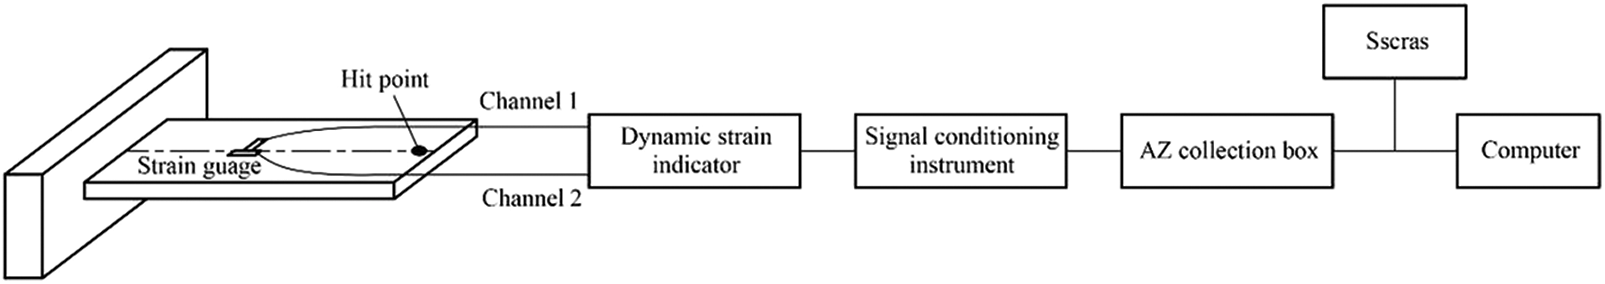
Figure 5: Test block diagram for dynamic test of OSB Poisson’s ratio
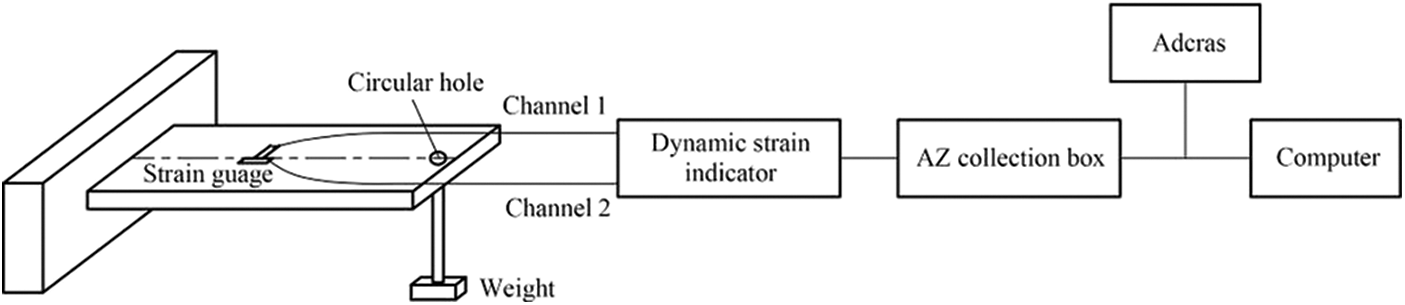
Figure 6: Test block diagram for static test of OSB Poisson’s ratio
When performing the dynamic test of OSB Poisson’s ratio (Fig. 5), the output signal of the Dynamic strain indicator was amplified and filtered by the signal conditioning instrument, then the output signal was converted into digital signals by AZ collection box, and finally it was processed by the signal analysis software (Sscras) and computer to show the frequency spectrum of the cantilever plate specimen. The filter frequency of the signal conditioning instrument was set to only display the first-order bending frequency.
When performing the static test of OSB Poisson’s ratio (Fig. 6), the output signal of the dynamic strain gauge was directly converted into digital signals by AZ collection box, and then processed by the signal analysis software (Adcras) and computer to show the acquired sinusoidal waveform. The average strain was taken to calculate Poisson’s ratio.
The method of loading weights was used to perform the static test, and each specimen was tested three times with using two-level loading increment. The mean value of −∆εy/∆εx calculated from the last two tests was taken as the test result of OSB Poisson’s ratio. As shown in Fig. 6, the circular hole near the free end was used to load weights. The filter frequency of the Dynamic strain indicator was set to 10 Hz. The loading increment for OSB longitudinal Poisson’s ratio was 8.33 N, and that for OSB transverse Poisson’s ratio was 4.62 N.
3.3.1 Axial Tensile Test of OSB Longitudinal Poisson’s Ratio
The longitudinal specimens L-A for dynamic test were sawed into tensile specimens (360 mm × 36 mm × 9.75 mm), and the longitudinal and transverse strain gauges were located at the midpoint of the midline. In order to avoid bending strain caused by the misalignment of the clamped specimen, the longitudinal and transverse strain gauges on the upper and lower surfaces of the specimen are connected in series, respectively. Then the strain gauges were connected to two bridge boxes according to the 1/4-bridge wiring method.
The initial load was 0.8 kN, and the end load was 1.8 kN. The transverse and longitudinal strain increments within the load range were used to calculate the Poisson’s ratio. Each specimen was subjected to axial tensile tests three times. The last two test data was taken to calculate the Poisson’s ratio, and the calculation equation is same as Eq. (6).
3.3.2 Four-Point Bending Test of OSB Transverse Poisson’s Ratio
The transverse specimens T-A were sawed into four-point bending specimens (280 mm × 28 mm × 9.75 mm). The longitudinal and transverse strain gauges on the upper and lower surfaces were located in the middle of the specimens. Then the half-bridge wiring method was adopted to measure the transverse and longitudinal strain increments (using loading weights, with loading increment 2.0825 N), and OSB transverse Poisson’s ratio was obtained. Each specimen was subjected to four-point bending test three times, and Poisson’s ratio was also calculated from the last two test data according to Eq. (6).
4.1 Calculation Example of OSB Poisson’s Ratio
The frequency spectrums obtained in dynamic test of OSB longitudinal specimen T-A-4 are shown in Figs. 7 and 8. The linear spectral amplitudes of the longitudinal and transverse strains from the first-order bending frequency on the spectrum were used to calculate the OSB Poisson’s ratio.
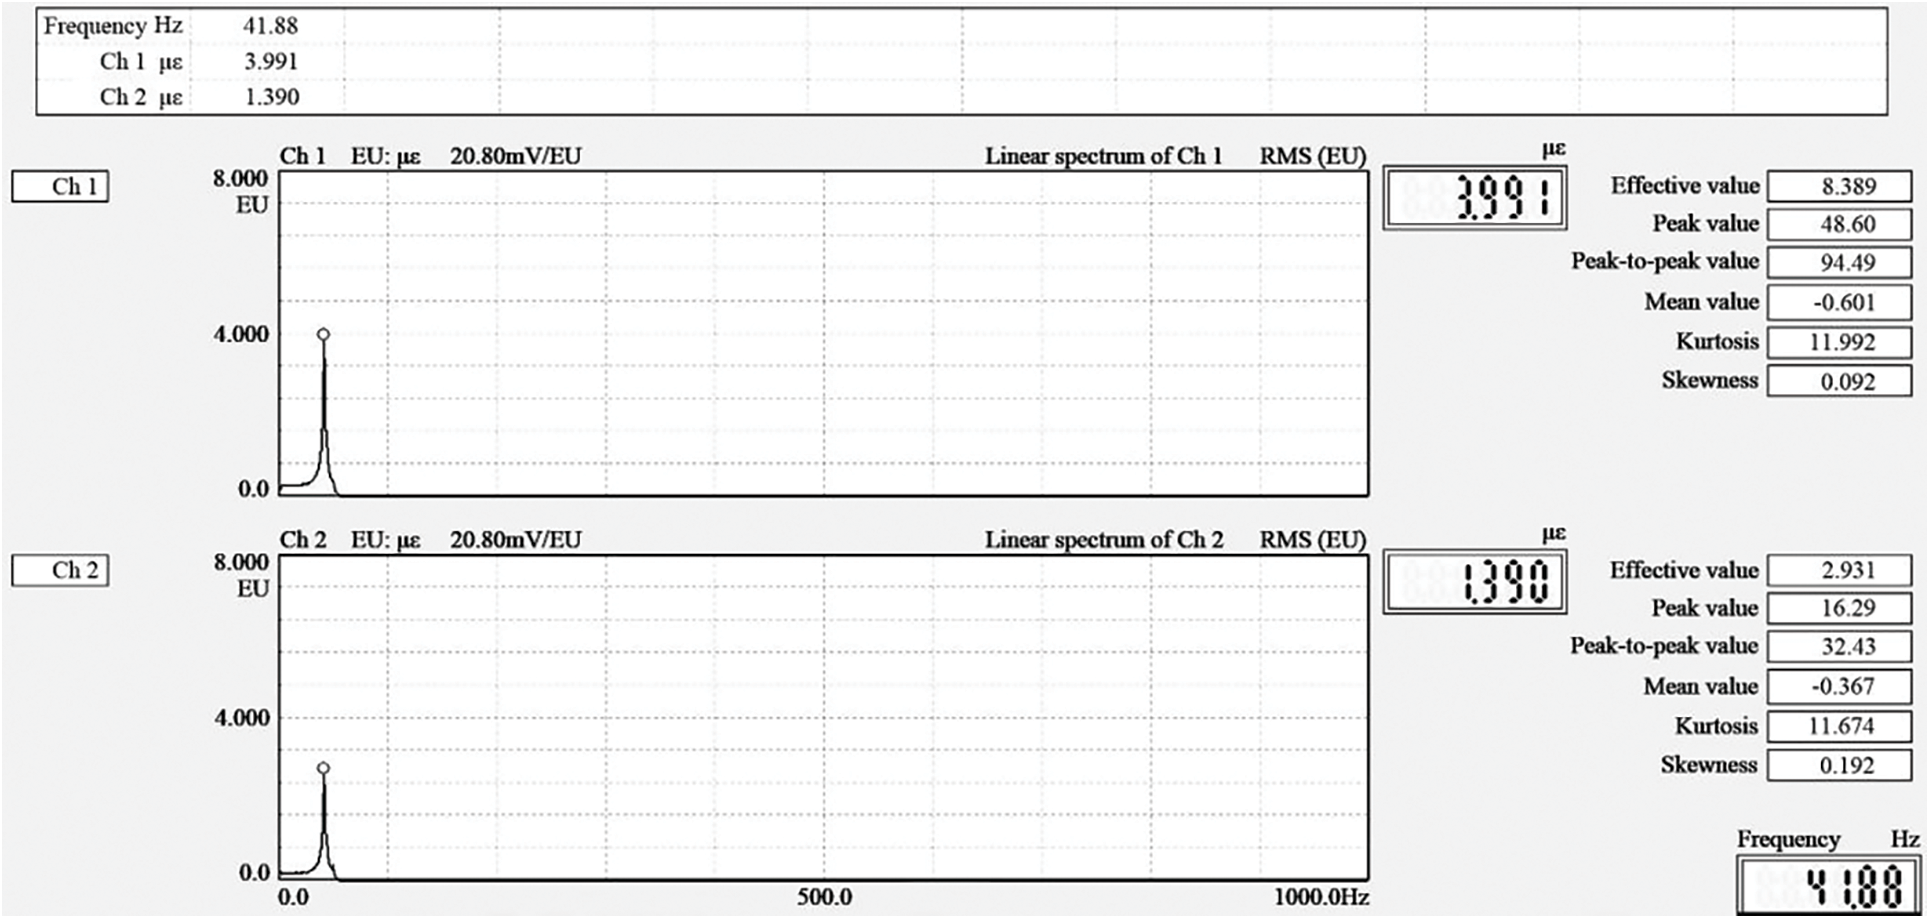
Figure 7: Spectrum of T-A-4
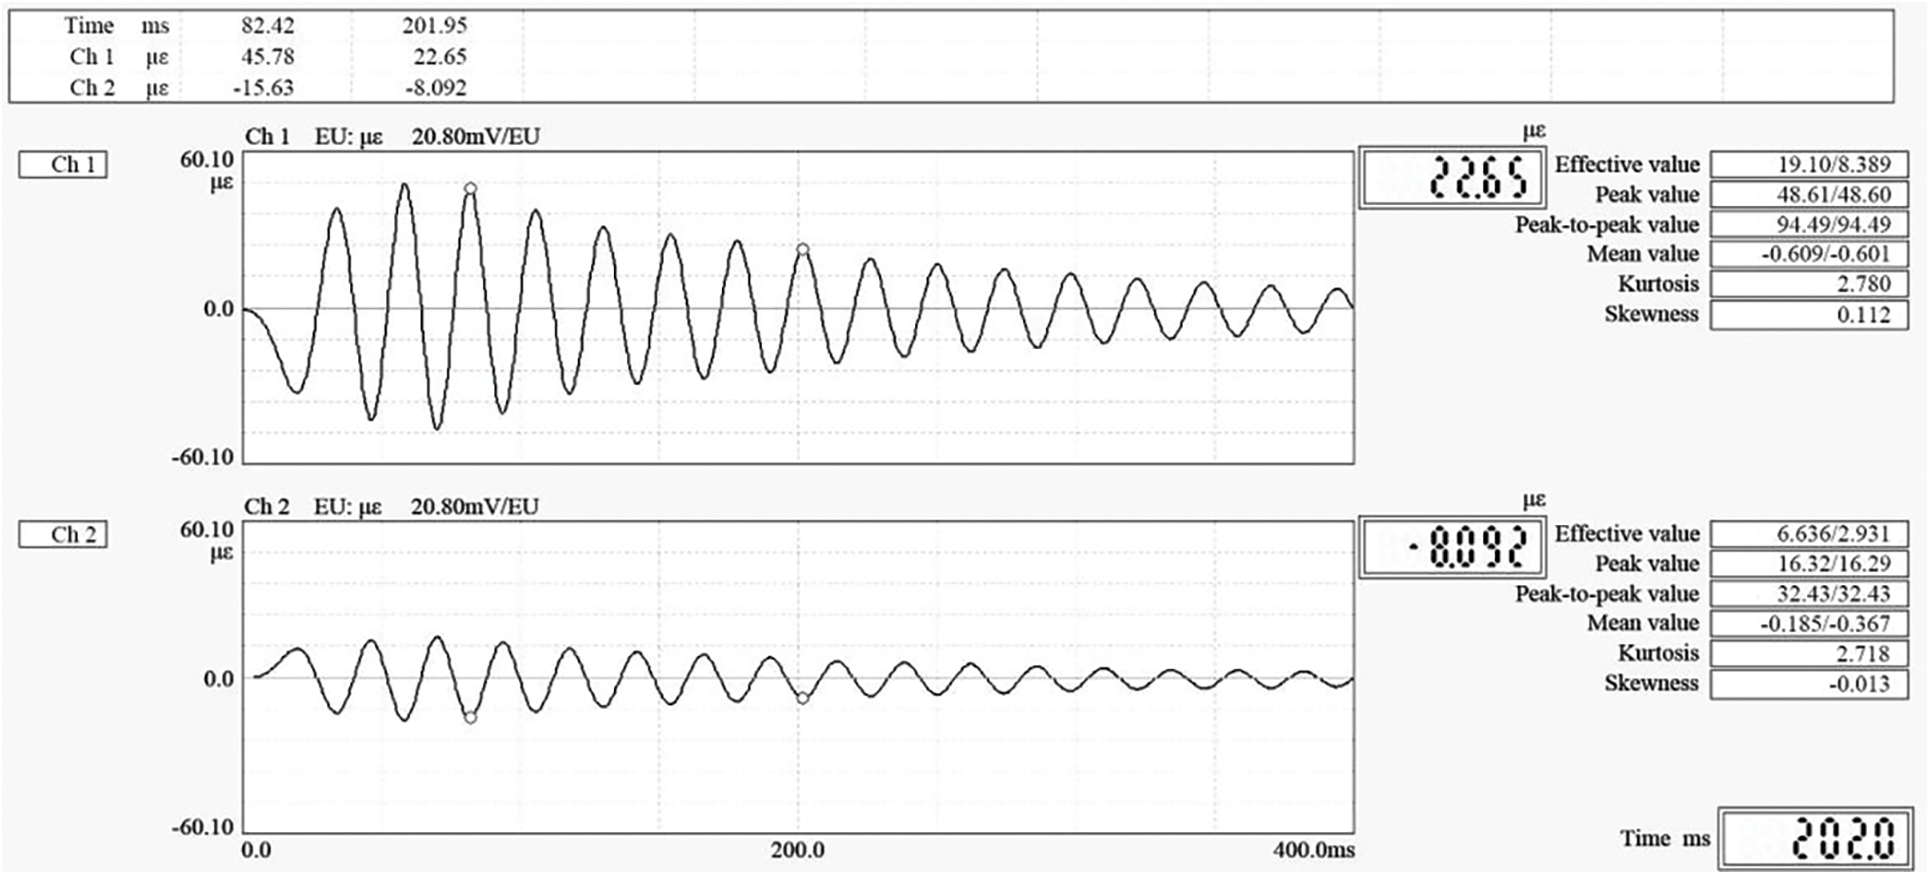
Figure 8: Longitudinal and transverse strain waveforms of fundamental frequency of T-A-4
The first-order bending frequency of the cantilever plate of T-A-4 was 41.88 Hz; the transverse strain linear spectral amplitude was 1.39 με; the longitudinal strain linear spectral amplitude was 3.99 με; and OSB longitudinal Poisson’s ratio ν = 1.39/3.99 = 0.348.
The peak value of the longitudinal strain waveform and that of the transverse strain waveform at the fundamental frequency of T-A-4 were in opposite sign. Poisson ratio calculated at 82.42 ms was −εy/εx = 0.341, while that was 0.357 at 201.95 ms. OSB longitudinal Poisson’s ratio measured in the time domain (0.341, 0.357) was quite consistent with that measured in the frequency domain (0.348).
4.2.1 OSB Longitudinal and Transverse Poisson’s Ratios of L-A and T-A
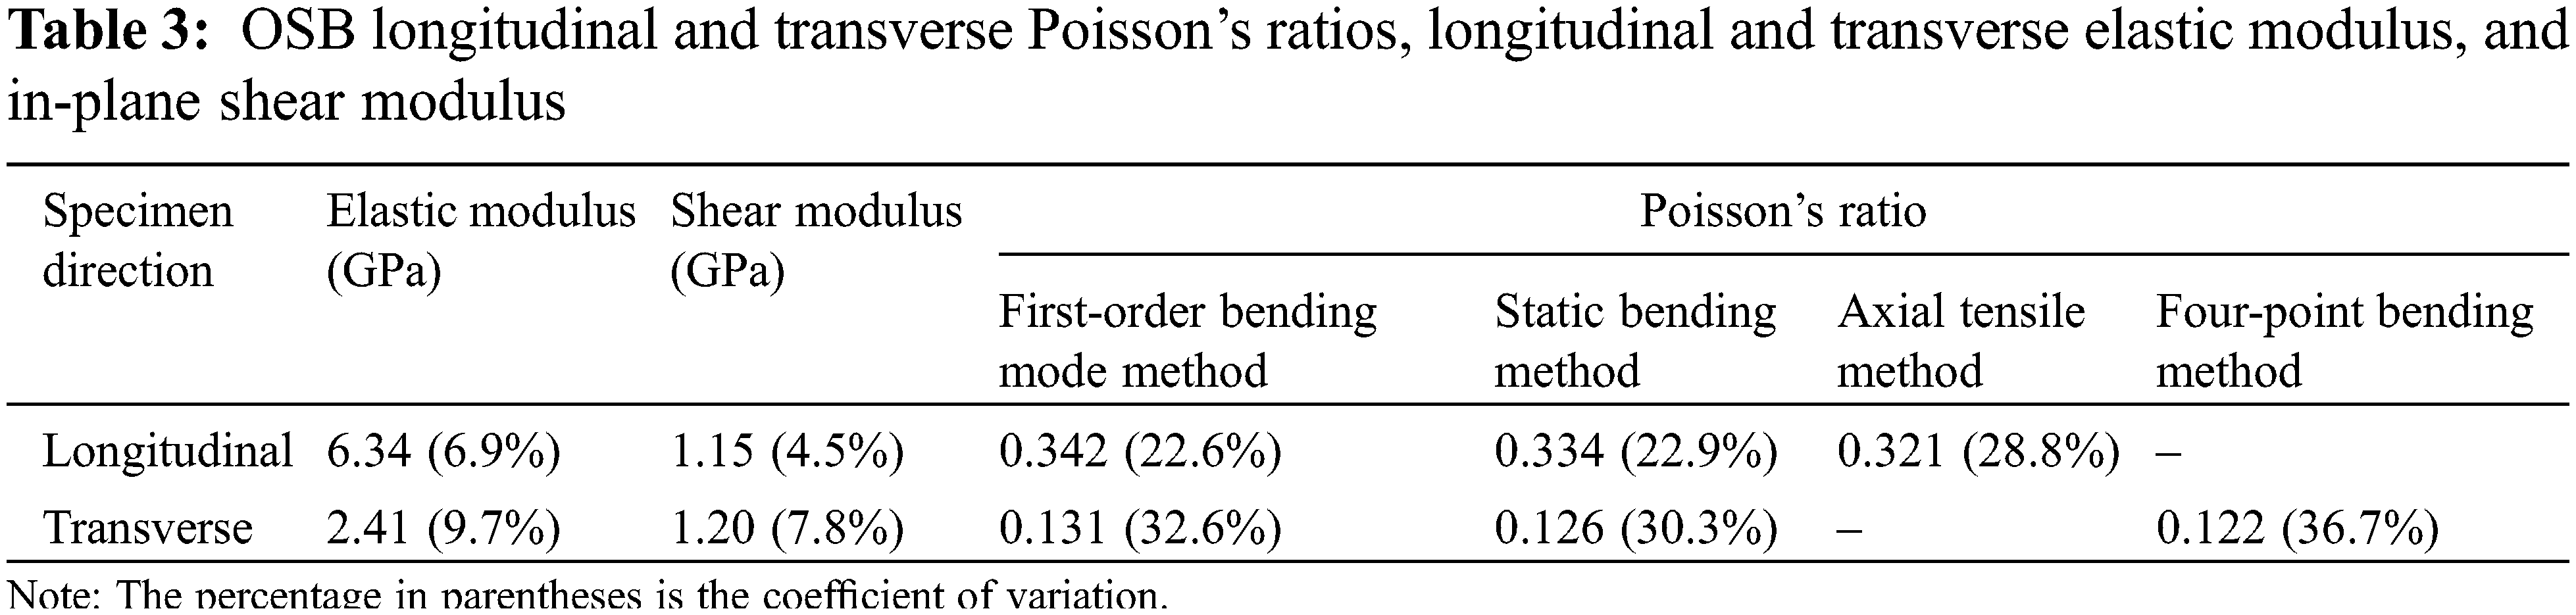
For Specimens L-A and T-A, OSB longitudinal and transverse elastic modulus and in-plane shear modulus were tested using the free plate torsional mode method proposed in article [7]. The results are shown in the 2nd and 3rd columns of Table 3. The 4th, 5th, 6th, and 7th columns of Table 3 show OSB longitudinal and transverse Poisson’s ratios obtained by the cantilever plate first-order bending mode method, the cantilever plate static bending method, the axial tensile method, and the four-point bending method, respectively.
4.2.2 OSB Longitudinal Poisson’s Ratios of L-B
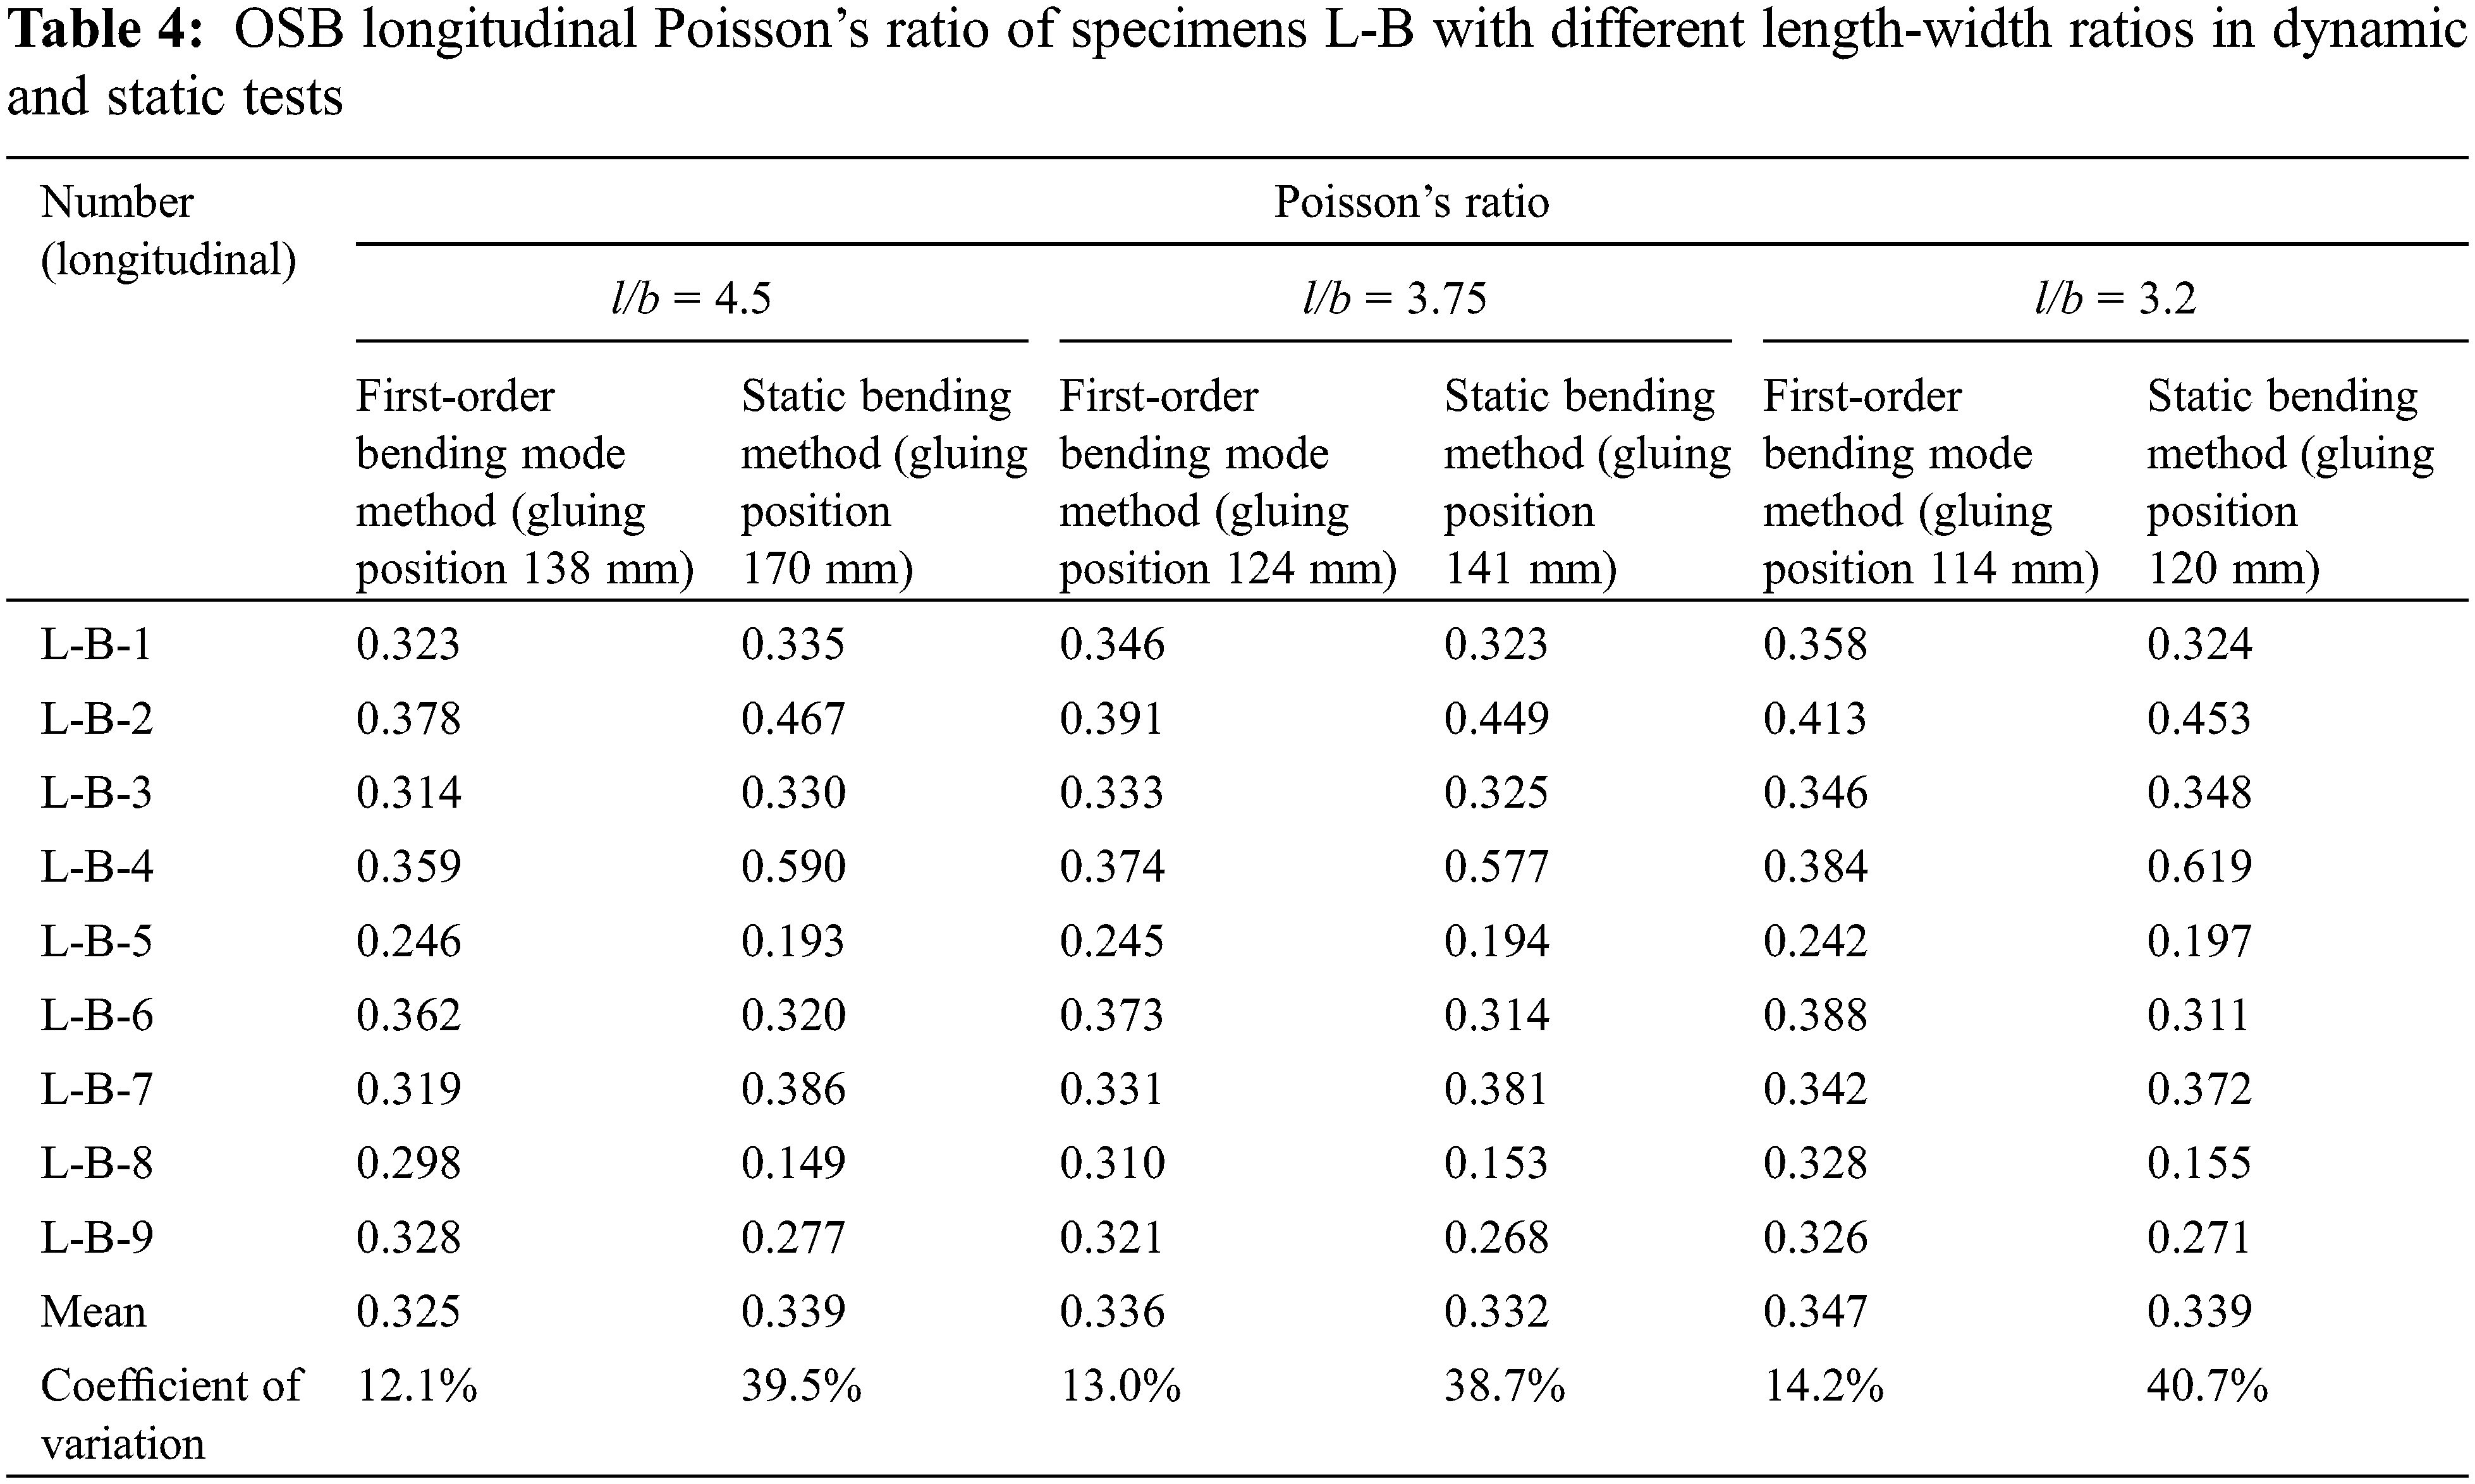
For specimens T-B (315 mm × 70 mm × 9.75 mm, l/b = 4.5), OSB longitudinal Poisson’s ratio obtained by the cantilever plate first-order bending mode method and the cantilever plate static bending method, are shown in the 2nd and 3rd columns of Table 4, respectively.
In order to verify the applicability of Eqs. (1) and (3) for specimens with different length-width ratios, the longitudinal B specimens were sawed to get specimens with l/b = 3.75 and l/b = 3.2. These specimens were also subjected to the dynamic and static tests of the OSB longitudinal Poisson’s ratio. The results are shown in the 4th, 5th 6th and 7th columns of Table 4.
4.3.1 Analysis of Effectiveness of Patch Method with Transverse Stress Equal to 0
The cantilever plate first-order bending mode method and static bending method were both based on the patch method with the transverse stress of the cantilever plate equal to 0, which was described as Eqs. (1)–(4) in this article. Its validity was verified as follows:
Firstly, according to the size of the cantilever plate, Eqs. (1)–(4) were applied to calculate the gluing position of the strain gauges on the cantilever plate. After the gauges were glued, the dynamic and static tests were performed to obtain the OSB longitudinal and transverse Poisson’s ratio. Then the results of the OSB Poisson’s ratio obtained by the cantilever plate first-order bending mode method and the cantilever plate static bending method were compared with those obtained by the axial tensile method and the four-point bending method. It could be seen from the comparison that:
1. For cantilever plates with the same length-width ratio and width-thickness ratio, the difference between OSB longitudinal and transverse Poisson’s ratios obtained by the cantilever plate first-order bending mode method and the cantilever plate static bending method, was within 4.1% (Tables 3 and 4).
2. OSB longitudinal Poisson’s ratio obtained by the cantilever plate first-order bending mode method increased slightly (about 6.8%) as the length-width ratio of the specimen decreased, and that obtained by the cantilever plate static bending method basically did not change with the length-width ratio (Table 4).
3. OSB Poisson’s ratios obtained by the cantilever plate first-order bending mode method and the cantilever plate static bending method were quite consistent with that obtained by the axial tensile method and the four-point bending method. The relative errors of OSB longitudinal and transverse Poisson’s ratios obtained by two proposed methods and two confirmatory methods were all within 7.4% (Table 3).
In summary, the patch method with the transverse stress of the cantilever plate equal to 0 (Eqs. (1)–(4)) could be effectively used to test OSB longitudinal and transverse Poisson’s ratios.
4.3.2 Analysis of the Relationship between OSB Elastic Modulus, Shear Modulus and Poisson’s Ratio
Refer to Table 3, the dynamic test value of OSB longitudinal and transverse elastic modulus was 6.34 GPa, and 2.41 GPa, respectively. OSB longitudinal and transverse Poisson’s ratios obtained by the first-order bending mode method was 0.342 and 0.131, respectively. It could be seen from these four data, the product of OSB longitudinal elastic modulus and transverse Poisson’s ratio, was approximately equal to the product of OSB transverse elastic modulus and longitudinal Poisson’s ratio. This result just satisfied the symmetry rule of the elements of the flexibility matrix relative to the main diagonal elements in the stress-strain relationship of orthotropic materials.
Whether it was analyzed from OSB longitudinal elastic modulus, longitudinal Poisson’s ratio and related shear modulus obtained by the longitudinal cantilever plate test, or from OSB transverse elastic modulus, transverse Poisson’s ratio and related shear modulus obtained by the transverse cantilever plate test, there did not seem to exist a consistent relationship, G = E/2(1 + ν), between E, G and ν [22].
For example, Table 3 lists the longitudinal elastic modulus 6.34 GPa, the shear modulus 1.15 GPa, the longitudinal Poisson’s ratio 0.342. So the longitudinal elastic modulus/shear modulus equal to 5.513, which was far away from 2 × (1 + 0.342) = 2.684. Similarly, the transverse elastic modulus was 2.41 GPa, the shear modulus was 1.20 GPa, the transverse Poisson’s ratio was 0.131. And the transverse elastic modulus /shear modulus equal to 2.008, the difference with 2 × (1 + 0.131) = 2.262 was 12.6%.
4.3.3 Analysis of Influencing Factors of OSB Poisson’s Ratio
The product quality of OSB mainly depends on wood species, glue composition, orientation of wood chips, relative thickness between layers, and pressure applied during processing. These factors will inevitably affect the performance parameters of OSB.
During the study of the dynamic and static test methods of OSB Poisson’s ratio, it was found that the ratio of the transverse strain εy to the longitudinal strain εx on the upper and lower plate surfaces at the same longitudinal position of the cantilever plate, had a large difference sometimes. For example, for the longitudinal B specimen No. 2, at a distance of 138 mm from the fixed support edge (the strain guage gluing position for the dynamic test of OSB longitudinal Poisson’s ratio), the test value of −εy/εx on the upper plate surface was 0.269. And the test value of −εy/εx on the lower surface was 0.497, which was close to twice the value of that on the upper surface.
This non-uniformity of OSB material made it difficult to verify the validity of Eqs. (1)–(4) of the strain gauge gluing position. However, the experimental design described in Chapter 3.2 had overcome this difficulty. It was precisely in consideration of the randomness of the shape, size and laying direction of OSB outer layer wood chips during the manufacturing process, the analysis of OSB Poisson’s ratio test data adopted the probability distribution method of random variables.
In the test, OSB specimens made in China were used first. It was found that the dispersion of OSB Poisson’s ratio test values was related to the size and laying direction of the outer layer wood chips of OSB where the strain gauges were glued. If the strain gauges were glued on large-size wood chips or those whose laying direction deviated from the longitudinal direction of the board, the test value of OSB Poisson’s ratio obtained would be too small or too large, resulting in a greater dispersion of OSB Poisson’s ratio.
To illustrate this phenomenon, 10 longitudinal specimens and 8 transverse specimens were sawed from an entire OSB made in Canada (purchased from Norbord Inc., Canada, with poplar (Populus euramericana (Dode.) Guinier.) as raw material, and MDI as adhesive), with a width of 70 mm and a thickness of 10.4 mm. The results of OSB longitudinal and transverse Poisson’s ratios obtained by the cantilever plate first-order bending mode method are shown in the 2nd, 3rd and 4th columns of Table 5. And the 5th column of Table 5 also lists the test results of the four-point bending method.
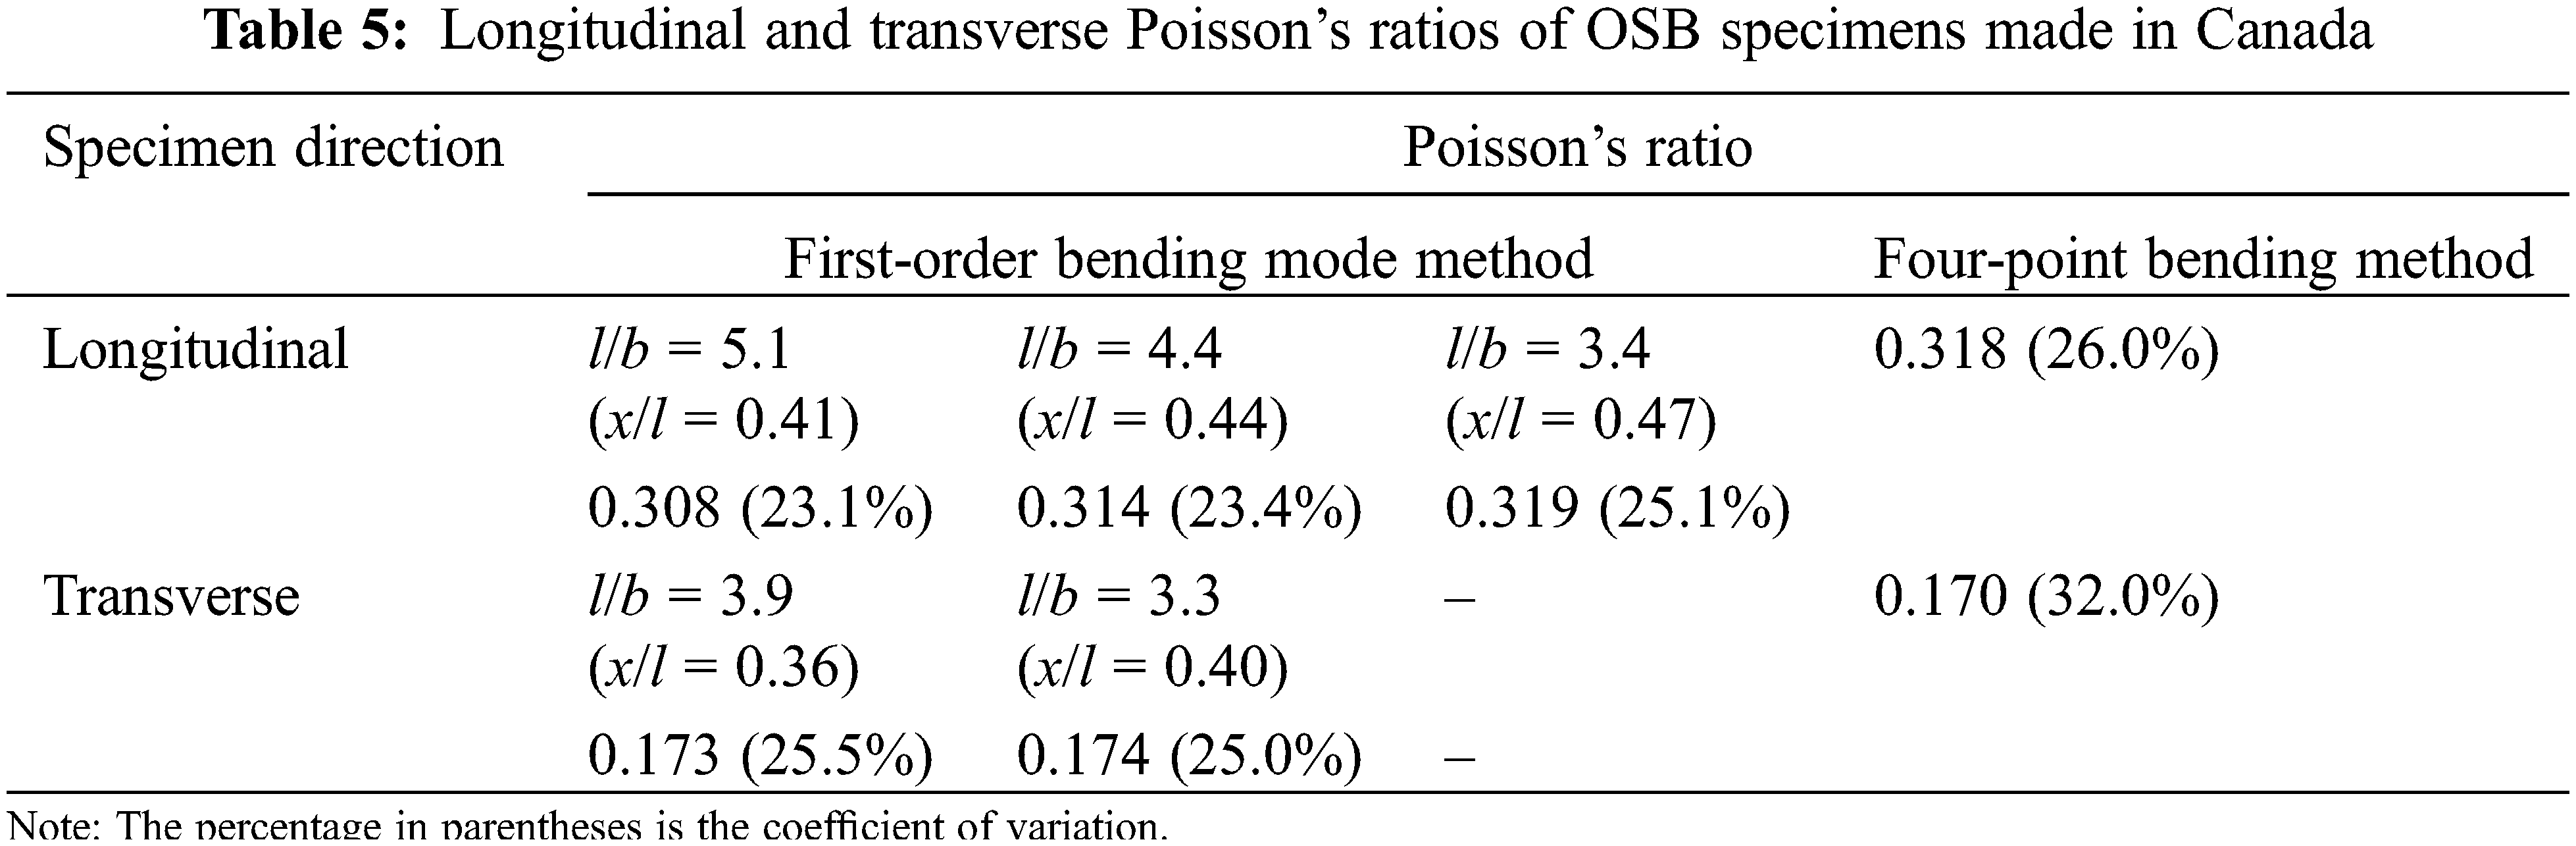
Table 5 shows that the longitudinal and transverse Poisson’s ratios of OSB made in Canada increased slightly as the length-to-width ratio of the cantilever plate specimen decreased. The relative error of the longitudinal Poisson’s ratio obtained by the cantilever plate first-order bending mode method and the cantilever plate four-point bending method did not exceed 3.1%, and that of the transverse Poisson’s ratio did not exceed 2.4%.
The longitudinal and transverse Poisson’s ratios obtained by OSB specimens from China and Canada was summarized as shown in Table 6.
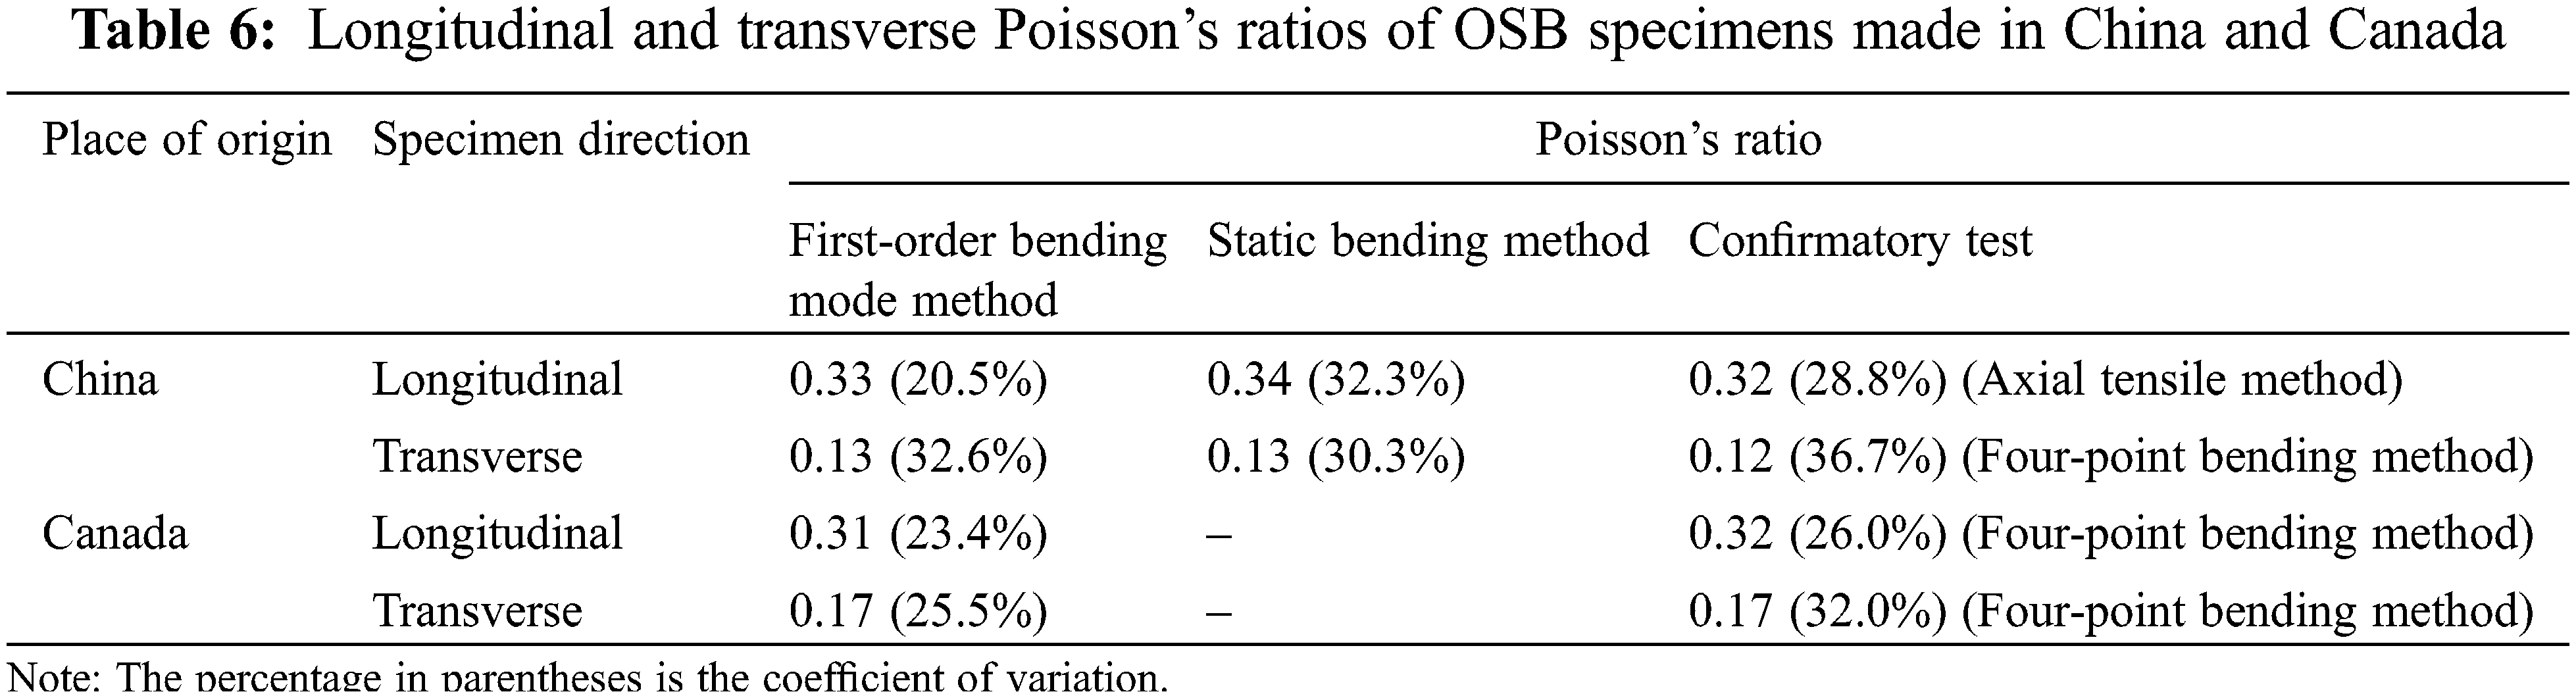
Table 6 shows that when the first-order bending mode method was used for test, the mean values of OSB longitudinal Poisson’s ratios were 0.33 and 0.31, respectively, and the data dispersion of test result of OSB made in Canada was larger than that made in China; the mean values of OSB transverse Poisson’s ratio were 0.13 and 0.17, respectively, and the data dispersion of test result of OSB made in Canada is smaller than that made in China. OSB longitudinal and transverse Poisson’s ratios obtained by the first-order bending mode method and the static bending method were consistent. The effectiveness of these two methods were also verified by the axial tension method and the four-point bending method. In other words, the patch method with cantilever plate transverse stress = 0 (Eqs. (1)–(4)) had been successfully applied to the test of OSB Poisson’s ratio.
4.3.4 Probability Distribution of OSB Longitudinal and Transverse Poisson’s Ratios
OSB longitudinal Poisson’s ratios of specimens L-A (9 pieces) and L-B (9 pieces) were dynamically tested. And the total 18 test data were arranged from small to large to get the order statistics νi (i = 1, 2, …, 18) of OSB longitudinal Poisson’s ratio. According to the principle that the order statistics distribution followed the empirical distribution
From the phenomenon that the test points basically fell on a straight line, it could be considered that OSB longitudinal Poisson’s ratio test values conformed to the Weibull distribution.
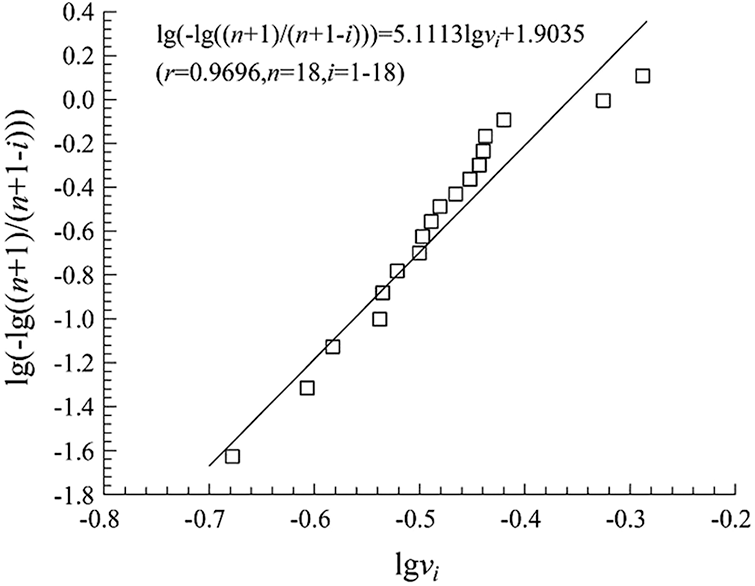
Figure 9: Fitting checkout of Weibull distribution of OSB longitudinal Poisson’s ratios of specimens L-A and L-B
The shape parameter m = 5.1113 was obtained according to the slope of the straight line. The scale parameter ν0 = 0.3604 was obtained according to the intercept (1.9035) of the straight line and the longitudinal axis. Therefore,
The distribution function of longitudinal Poisson’s ratio:
The probability density function of longitudinal Poisson’s ratio:
Figs. 10 and 11 show that OSB longitudinal Poisson’s ratio obeyed Weibull distribution with two parameters. When the probability density function took the maximum value, Poisson’s ratio value was 0.345, which was slightly larger than the mean value 0.335. The probability density function was slightly asymmetric with respect to the maximum value. The probability that OSB longitudinal Poisson’s ratio larger than 0.5 was 0.5%, and that less than 0.2 was 4.8%. The probability that OSB longitudinal Poisson’s ratio within the range of [0.2, 0.5) was 94.7%. The probability that OSB longitudinal Poisson’s ratio within one standard deviation of its mean value ν ϵ (0.265, 0.402) was 77.2%, while the probability that a random variable obeyed the normal distribution within one standard deviation of its mean value was 68.3%. Therefore, OSB longitudinal Poisson’s ratio followed Weibull distribution and was different from the normal distribution.
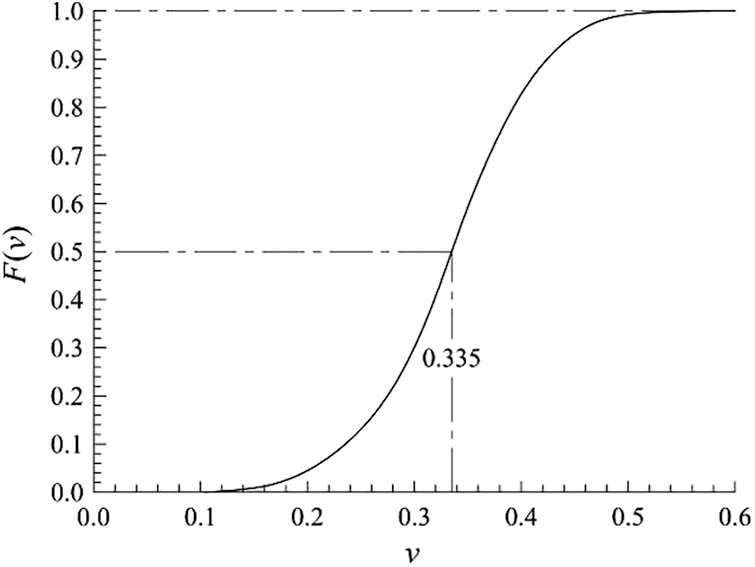
Figure 10: The distribution function of longitudinal Poisson’s ratio
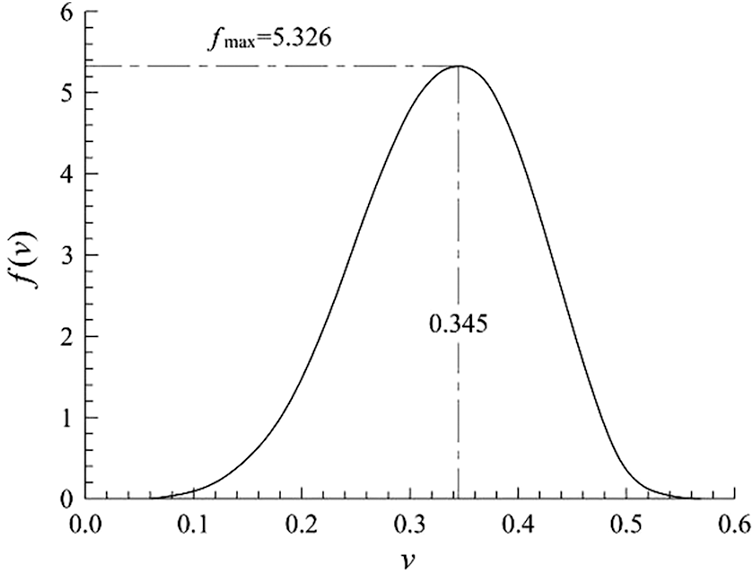
Figure 11: The probability density function of longitudinal Poisson’s ratio
For OSB transverse Poisson’s ratios of specimens T-A (8 pieces), a graph (Fig. 12) could be obtained similarly to Fig. 9, and the probability distribution analysis is as follows:
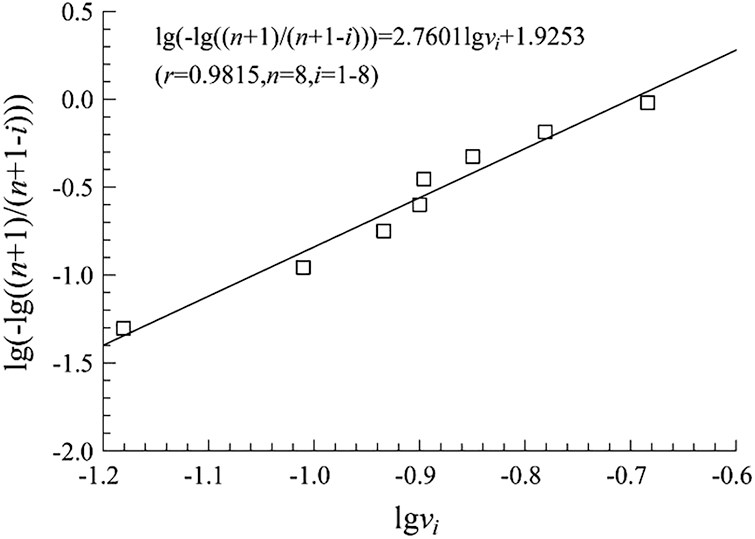
Figure 12: Fitting checkout of Weibull distribution of OSB transverse Poisson’s ratios of specimens T-B
The shape parameter m = 2.7601 was obtained according to the slope of the straight line. The scale parameter ν0 = 0.1483 was obtained according to the intercept (1.9253) of the straight line and the longitudinal axis. Therefore:
The distribution function of transverse Poisson’s ratio:
The probability density function of transverse Poisson’s ratio:
Figs. 13 and 14 show that OSB transverse Poisson’s ratio obeyed Weibull distribution with two parameters. When the probability density function took the maximum value, Poisson’s ratio value was 0.126, which was different from the mean value 0.131. The probability density function was slightly asymmetric with respect to the maximum value. The probability that OSB transverse Poisson’s ratio larger than 0.2 was 10.2%, and that less than 0.06 was 7.9%. The probability that OSB transverse Poisson’s ratio within the range of [0.06, 0.2) was 81.9%. The probability that OSB transverse Poisson’s ratio within one standard deviation of its mean value ν ϵ (0.088, 0.174) was 61.2%, while the probability that a random variable obeyed the normal distribution within one standard deviation of its mean value was 68.3%. So OSB transverse Poisson’s ratio also followed Weibull distribution and was different from the normal distribution.
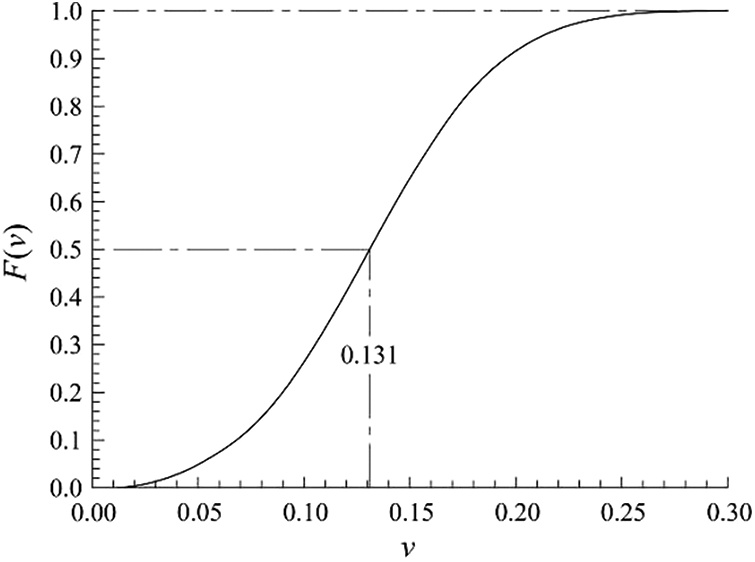
Figure 13: The distribution function of transverse Poisson’s ratio
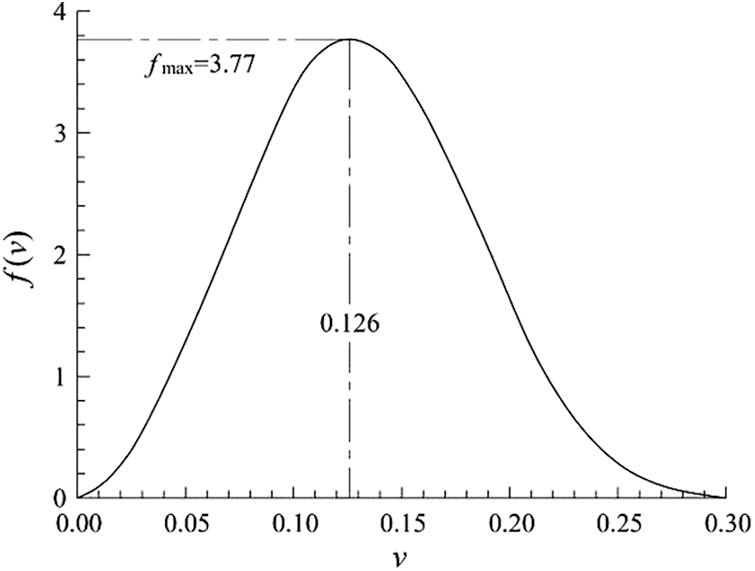
Figure 14: The probability density function of transverse Poisson’s ratio
To explore the applicability of dynamic and static methods for testing OSB longitudinal and transverse Poisson’s ratios, the following studies were carried out in this paper: Firstly, ANSYS was used to analyze the stress and strain of the OSB cantilever plate specimens with different length-width ratio and width-thickness ratio. Secondly, the position where the transverse stress is equal to zero obtained in above ANSYS calculation was applied as the gluing position of the strain gauge, and it was expressed as a formula that depends on the length-width ratio and the width-thickness ratio of the cantilever plate through binary linear regression. Thirdly, OSB longitudinal and transverse Poisson’s ratios were measured dynamically and statically using the methods proposed. Fourthly, the axial tensile test and the four-point bending test were also performed to verify the effectiveness of the strain gauge gluing position. Fifthly, the probability distribution of Poisson’s ratio test values was expounded. The main conclusions are as follows:
1. The cantilever plate first-order bending mode method (dynamic method) and the cantilever plate static bending method (static method) for testing OSB longitudinal and transverse Poisson’s ratios had a reliable theoretical basis through simulation analysis.
2. OSB longitudinal and transverse Poisson’s ratios obtained by the cantilever plate first-order bending mode method and the cantilever plate static bending method were consistent, with the difference less than 4.1%.
3. OSB longitudinal and transverse Poisson’s ratios obtained by the cantilever plate first-order bending mode method and the cantilever plate static bending method, were quite consistent with those obtained by the axial tensile method and the four-point bending method.
4. The patch method with the transverse stress of the cantilever plate equal to 0 (Eqs. (1)–(4)), was effective for testing OSB longitudinal and transverse Poisson’s ratios.
5. OSB longitudinal and transverse Poisson’s ratios test values followed Weibull distribution, with characteristics: (1) the probability density functions of the longitudinal and transverse Poisson’s ratios were asymmetric with respect to their maximum values; (2) the probability that the longitudinal and transverse Poisson’s ratios was within one standard deviation of their mean values were 77.2% and 61.2%, respectively.
Funding Statement: This research was sponsored by the Science and Technology Project for Policy Guidance of Jiangsu Province (SZ-LYG 2020016).
Conflicts of Interest: The authors declare that they have no conflicts of interest to report regarding the present study.
1. Meng, Q. F., Chen, W. S., Hao, H., Cui, J., Shi, Y. C. et al. (2018). Failure behaviors of oriented strand board material under quasi-static and dynamic loads. Journal of Materials in Civil Engineering, 30(3), 4017297. DOI 10.1061/(ASCE)MT.1943-5533.0002172. [Google Scholar] [CrossRef]
2. Direske, M., Bonigut, J., Krug, D. (2018). Effects of MDI content on properties of thermally treated oriented strand board (OSB). European Journal of Wood and Wood Products, 76(3), 823–831. DOI 10.1007/s00107-017-1256-x. [Google Scholar] [CrossRef]
3. Hedayati, R., Sadighi, M., Zadpoor, A. A. (2016). Mechanical properties of additively manufactured thick honeycombs. Materials, 9(8), 613. DOI 10.3390/ma9080613. [Google Scholar] [CrossRef]
4. Yang, D., Li, H. T., Wei, D. D., Lorenzo, R., Corbi, I. et al. (2021). Length effect on bending properties and evaluation of shear modulus of parallel bamboo strand lumber. European Journal of Wood and Wood Products, 79(6), 1507–1517. DOI 10.1007/s00107-021-01714-1. [Google Scholar] [CrossRef]
5. Zhang, H., Li, H. T., Li, Y. J., Xiong, Z. H., Zhang, N. N. et al. (2021). Effect of nodes on mechanical properties and microstructure of laminated bamboo units. Construction and Building Materials, 304(6), 124427. DOI 10.1016/j.conbuildmat.2021.124427. [Google Scholar] [CrossRef]
6. Wang, Q., Liu, Z. Z., Zhong, X. M., Gao, Z. N., Liu, F. Q. (2021). Dynamic elastic modulus and damping ratio of lignin-modified loess. Journal of Renewable Materials, 9(3), 523–540. DOI 10.32604/jrm.2021.014114. [Google Scholar] [CrossRef]
7. Wang, Z., Xie, W. B., Lu, Y., Li, H. T., Wang, Z. H. et al. (2019). Dynamic and static testing methods for shear modulus of oriented strand board. Construction and Building Materials, 216(4), 542–551. DOI 10.1016/j.conbuildmat.2019.05.004. [Google Scholar] [CrossRef]
8. Thomas, W. H. (1996). Bending behaviour of OSB decking under concentrated load (Ph.D. Thesis). University of Surrey, Guildford, UK. [Google Scholar]
9. Karacabeyli, E., Lau, P., Henderson, C. R., Meakes, F. V. (1996). Design rated oriented strand board in CSA standards. Canadian Journal of Civil Engineering, 23(2), 431–443. DOI 10.1139/l96-047. [Google Scholar] [CrossRef]
10. Thomas, W. H. (2001). Mechanical properties of structural-grade oriented strand board. Holz als Roh- und Werkstoff, 59(6), 405–410. DOI 10.1007/s00107-001-0247-z. [Google Scholar] [CrossRef]
11. Dauda, J. A., Silva, L. C., Lourenco, P. C., Luorio, O. (2021). Out-of-plane loaded masonry walls retrofitted with oriented strand boards: Numerical analysis and influencing parameters. Engineering Structures, 243(3), 112683. DOI 10.1016/j.engstruct.2021.112683. [Google Scholar] [CrossRef]
12. Fan, W. Y., Shen, F. M. (1992). Testing of elastic modulus and Poisson’s ratio of oriented particleboard. Forestry Science and Technology Development, 3, 39–40. DOI 10.13360/j.issn.1000-8101.1992.03.022. [Google Scholar] [CrossRef]
13. Thomas, W. H. (2003). Poisson’s ratios of an oriented strand board. Wood Science and Technology, 37(3–4), 259–268. DOI 10.1007/s00226-003-0171-y. [Google Scholar] [CrossRef]
14. Kang, L. (2017). Non-destructive testing and application performance of wood pallet and lath (Master Thesis). Beijing Forestry University, Beijing, China. [Google Scholar]
15. Kumpenza, C., Matz, P., Halbauer, P., Grabner, M., Steiner, G. et al. (2018). Measuring Poisson’s ratio: Mechanical characterization of spruce wood by means of non-contact optical gauging techniques. Wood Science and Technology, 52(6), 1451–1471. DOI 10.1007/s00226-018-1045-7. [Google Scholar] [CrossRef]
16. Aydin, M., Aydin, T. Y. (2020). Moisture dependent elastic properties of naturally aged black pine wood. Construction and Building Materials, 262(1), 120752. DOI 10.1016/j.conbuildmat.2020.120752. [Google Scholar] [CrossRef]
17. Wang, Z., Gu, L. L., Gao, Z. Z., Liu, B., Wang, Y. L. (2015). Experimental study on Poisson’s ratio of lumber by dynamic testing. Scientia Silvae Sinicae, 51, 102–107. DOI 10.11707/j.1001-7488.20150512. [Google Scholar] [CrossRef]
18. Wang, Z. H., Gao, Z. Z., Wang, Y. L., Cao, Y., Wang, G. G. et al. (2015). A new dynamic testing method for elastic, shear modulus and Poisson’s ratio of concrete. Construction and Building Materials, 100(1), 129–135. DOI 10.1016/j.conbuildmat.2015.09.060. [Google Scholar] [CrossRef]
19. Gao, Z. Z., Zhang, X., Wang, Y. L., Yang, R. C., Wang, G. G. et al. (2016). Measurement of Poisson’s ratio of materials based on bending mode of cantilever plate. BioResources, 11(3), 5703–5721. DOI 10.15376/biores.11.3.5703-5721. [Google Scholar] [CrossRef]
20. Wang, Z. H., Wang, Y. L., Cao, Y., Wang, Z. (2016). Measurement of shear modulus of materials based on the torsional mode of cantilever plate. Construction and Building Materials, 124(1), 1059–1071. DOI 10.1016/j.conbuildmat.2016.08.104. [Google Scholar] [CrossRef]
21. Cao, Y., Wang, Y. L., Wang, Z., Li, M. M. (2017). Dynamic testing of medium density fiberboard elastic constants and damping ratios. Journal of Forest and Environment, 37(3), 292–296. DOI 10.13324/j.cnki.jfcf.2017.03.007. [Google Scholar] [CrossRef]
22. Liu, H. W. (2015). Mechanics of materials (5th Edition). Beijing, China: Higher Education Press. [Google Scholar]
23. Wang, Z. H., Ghanem, R. (2021). An extended polynomial chaos expansion for PDF characterization and variation with aleatory and epistemic uncertainties. Computer Methods in Applied Mechanics and Engineering, 382(1–4), 113854. DOI 10.1016/j.cma.2021.113854. [Google Scholar] [CrossRef]
 | This work is licensed under a Creative Commons Attribution 4.0 International License, which permits unrestricted use, distribution, and reproduction in any medium, provided the original work is properly cited. |