| Journal of Renewable Materials |
DOI: 10.32604/jrm.2022.020516
ARTICLE
Modeling and Optimization of the Shear Strength of Cassava Starch-Based Adhesives Using Artificial Intelligence Methods
College of Engineering, Nanjing Agricultural University, Nanjing, 210031, China
*Corresponding Author: Chunxia He. Email: chunxiahe@tom.com
Received: 28 November 2021; Accepted: 15 February 2022
Abstract: With the exponential growth of the computing power, machine learning techniques have been successfully used in various applications. This paper intended to predict and optimize the shear strength of single lap cassava starch-based adhesive joints for comparison with the application of artificial intelligence (AI) methods. The shear strength was firstly determined by the experiment with three independent experimental variables (starch content, NaOH concentration and reaction temperature). The analysis of range (ANORA) and analysis of variance (ANOVA) were applied to investigate the optimal combination and the significance of each factor for the shear strength based on the orthogonal experiment. The performance of all AI models was characterized by mean absolute error (MAE), root mean square error (RMSE) and regression coefficient (R2) compared with the experimental ones. The GA-optimized ANN model was combined with the genetic algorithm (GA) to find the optimal combination of factors for the finalized optimized cassava starch adhesives (CSA-OP). The physicochemical properties of the cassava starch and CSA-OP were determined by the FTIR, TGA and SEM-EDS, respectively. The results showed that the numerical optimized condition of the GA-optimized ANN model was superior to the orthogonal experimental optimized condition. The sensitivity analysis revealed that the relative importance of variables was consistent with the results from ANOVA. FTIR results showed that there were high hydroxyl groups in cassava starch. TGA results showed that the residue of CSA-OP was higher than the cassava starch. SEM-EDS results showed that both the cassava starch and CSA-OP had abundant carbon and oxygen functional groups. Consequently, the obtained results revealed that the use of AI methods was an adequate approach to model and optimize the experimental variables of the shear strength of single lap cassava starch-based adhesive joints.
Keywords: Cassava starch; shear strength; adhesives; artificial intelligence; orthogonal experiment
For many years, conventional adhesives were prepared based on fossil based resources, including formaldehyde-based and petroleum-based [1]. Moreover, the volatile and toxic emissions from petrochemicals are harmful for environment and health. Therefore, it is emergency to obtain biodegradable adhesives from the renewable and inexpensive bio-materials. Starch is one of the most abundant natural polymers, which are obtained from rich botanical sources and the most promising bio-material for starch-based adhesive applications [1–3]. For better use as starch-based adhesives, many methods have been considered to modify the starch molecules, including oxidation, graft copolymerization, cross-linkers, epoxidation and hydrolyzing [1–2,4].
Response surface methodology (RSM) technique is commonly used for the design of experiments. It can develop a relationship affected by multiple process variables with a combination of mathematical and statistical ways. Until the present, the starch adhesive mechanical properties optimization studies were primarily based on response surface methodology (RSM) [3]. Nevertheless, RSM is local approximation generalization, which can be coupled with a global optimization method such as genetic algorithm (GA). In recent years, RSM and ANN models coupled with GA have been applied successfully to optimize the resistant starch content using a fitness function from RSM and ANN [5,6].
Adhesively bonded joints were composed of two substrates and an adhesive layer, which were commonly used in various applications [7,8]. The performance of adhesive joints have been generally analyzed by the conventional approaches, such as experimental, analytical and numerical solutions [7,9]. Because there are no appropriate conventional approaches to accurately reproduce a certain phenomenon, machine learning methods can be employed to establish data-driven models [8,10]. In recently studies, artificial intelligence (AI) methods were used to replace the conventional methods to analyze the strength of adhesive joints for making predictive models [8,11,12]. This excellent method can help to reduce the needed number of experiments to obtain the optimal solution, and importantly cut down the cost [13]. Artificial neuron network (ANN) is one of the most popular AI methods, which can be used to model complex relationships between variables [8]. ANN was applied by experimental test data to investigate the effect of the length and width of bond area for the failure load of the adhesive joints [13]. Clustering analysis was applied to study the damage modes of adhesive composite joints using acoustic emissions [14]. Adaptive neuro-fuzzy inference system (ANFIS) was applied to determine the bond strength of joints [15]. Several AI methods, such as random forest, support vector machines and artificial neural network, were employed to predict the tensile shear strength of bonded wood joints [16].
Although machine learning techniques have been applied in analysis of adhesive lap joints, the current studies are mostly limited to the commercial adhesives and single machine learning method. To the best of our knowledge, AI methods rarely have been systematically used to estimate the shear strength of single lap cassava starch-based adhesive joints for comparison. Hence, this study aimed to develop four AI models for modelling and optimizing the shear strength of the cassava starch adhesives developed by the randomized experiment in MATLAB environment. Based on the results, the cassava starch and finalized optimized cassava starch adhesives (CSA-OP) were further characterized by FTIR, TGA and SEM-EDS, respectively.
Cassava starch of food-grade was purchased from Guangxi Hongfeng Starch Co., Ltd., China. Sodium hydroxide (NaOH) of reagent-grade was bought from Wuxi Yatai United Chemical Co., Ltd., China.
2.2 Preparation of the Adhesives
A quantity of starch (% w/v) were completely dissolving in the 50 ml deionized water with the agitator for 5 min. Then the corresponding NaOH concentration (% w/w) based on the quality of starch in the 50 ml deionized water was adding at the mechanical agitation for 10 min at 750 rpm. The evenly stable emulsion in a beaker were placed in a water bath with the corresponding reaction temperature (°C) for 20 min. Ultimately, the beaker with starch adhesives was removed from the water bath and cooled to room temperature.
2.3 Shear Strength Test of the Adhesives
The shear strength of the adhesive specimens was tested according to the industry standard HG/T2727−2010 (China, 2010). The bonding area of the specimens were firstly cleaned using distilled water and then dried. The adhesive at room temperature was applied to a single side of the overlapping layer of specimens with the aid of a brush. Woven jute/poly (lactic acid) (PLA) composite laminates with the bonding area of 20 mm × 20 mm were under a static pressure of 0.05∼0.1 MPa at 25°C for 24 h. The single-lap composite joint specimens were shown in Fig. 1. The test specimens were stored at room temperature for approximately 48 h, then they were determined through SANS (CMT 6104) universal testing machine with a crosshead speed of 2 mm/min. All tests were examined 3 times and reported the average values. The shear strength was calculated according to the Eq. (1).
where τ was the shear strength, MPa; F was maximum shear force, N; A was adhesive area, mm2.
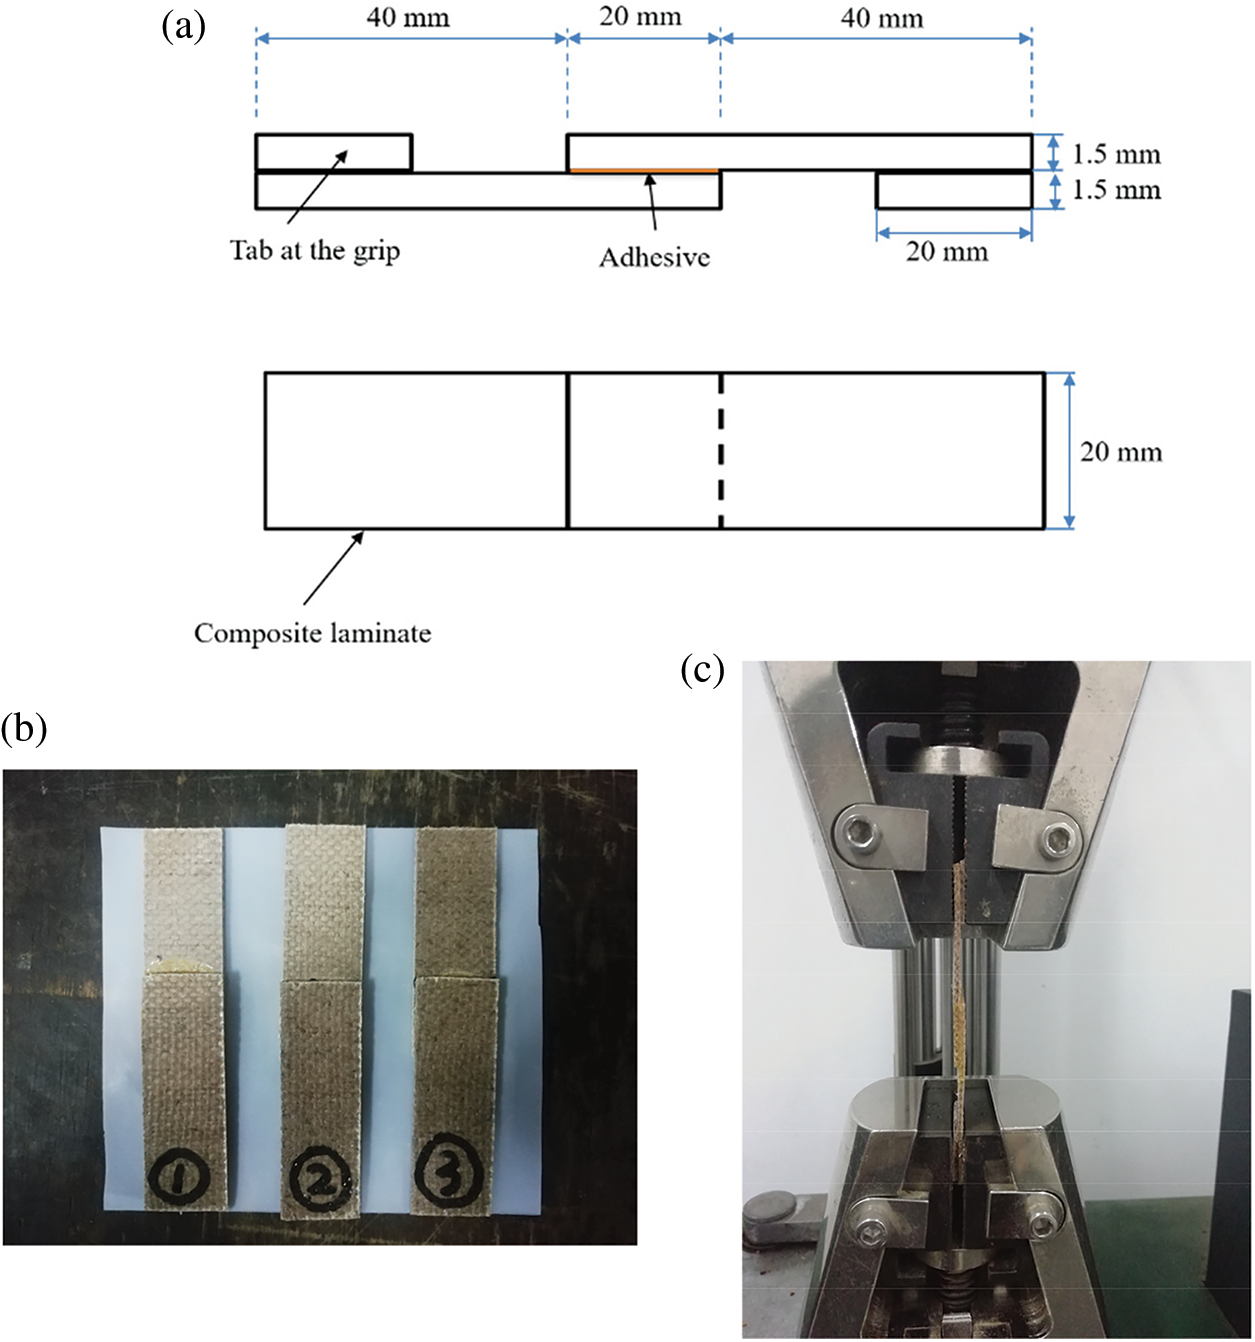
Figure 1: Shear strength tests of (a) specimen dimensions; (b) specimens preparation; and (c) testing
2.4 Fourier Transform Infrared Spectroscopy (FTIR)
Before testing, the cassava starch and adhesive samples were first dried to constant weight in the oven at 80°C. Then dry cassava starch or adhesive sample of 2 mg were ground and mixed with KBr of 200 mg, and finally pressed into a tablet in the mold under a pressure of 20 MPa for 10 min. Fourier transform infrared spectroscopy was conducted by Nicolet iS-10 (Thermo Fisher Scientific, Waltham, MA, USA). The resolution was 4 cm−1 and scanned 16 times in the range from 4000 to 400 cm−1.
2.5 Thermo-Gravimetric Analysis (TGA)
In order to study the thermal decomposition characteristics of the specimens, thermo-gravimetric analysis (TGA) was carried out by using a thermos-gravimetric analyzer (STA449 F3, NETZSCH, Shanghai, China). Before testing, the cassava starch and adhesive samples were first dried to constant weight in the oven at 80°C. Each dry specimen with about 8 mg was placed in an Al2O3 crucible. Experiments were performed with the temperature range of 25°C to 800°C at the heating rate of 20 K⋅min−1 in a argon atmosphere (Balance chamber flow rate = 20 cm3/minute, furnace flow rate = 60 cm3/minute).
2.6 Scanning Electron Microscopy-Energy Dispersive Spectroscopy (SEM-EDS)
Scanning electron microscopy-energy dispersive spectroscopy (SEM-EDS) analyses of samples were performed using an S-4800 scanning electron microscope (Hitachi, Ltd., Tokyo, Japan) equipped with an energy-dispersive spectrometer (Bruker AXS, Germany) for elemental analysis. Before observation, all the samples were dried to constant weight and sputter coated with gold (model e-1045; Hitachi, Ltd., Tokyo, Japan). Images and elemental data were collected under high vacuum at the acceleration voltage of 15 kV.
2.7 Artificial Intelligence Models and Performance
In this work, four well-known artificial intelligence (AI) methods were used to model the shear strength for cassava starch adhesives. Firstly, the following equation was applied to normalize the raw data to [−1, 1] [17]:
where x, xmin and xmax were actual, minimum and maximum values, respectively.
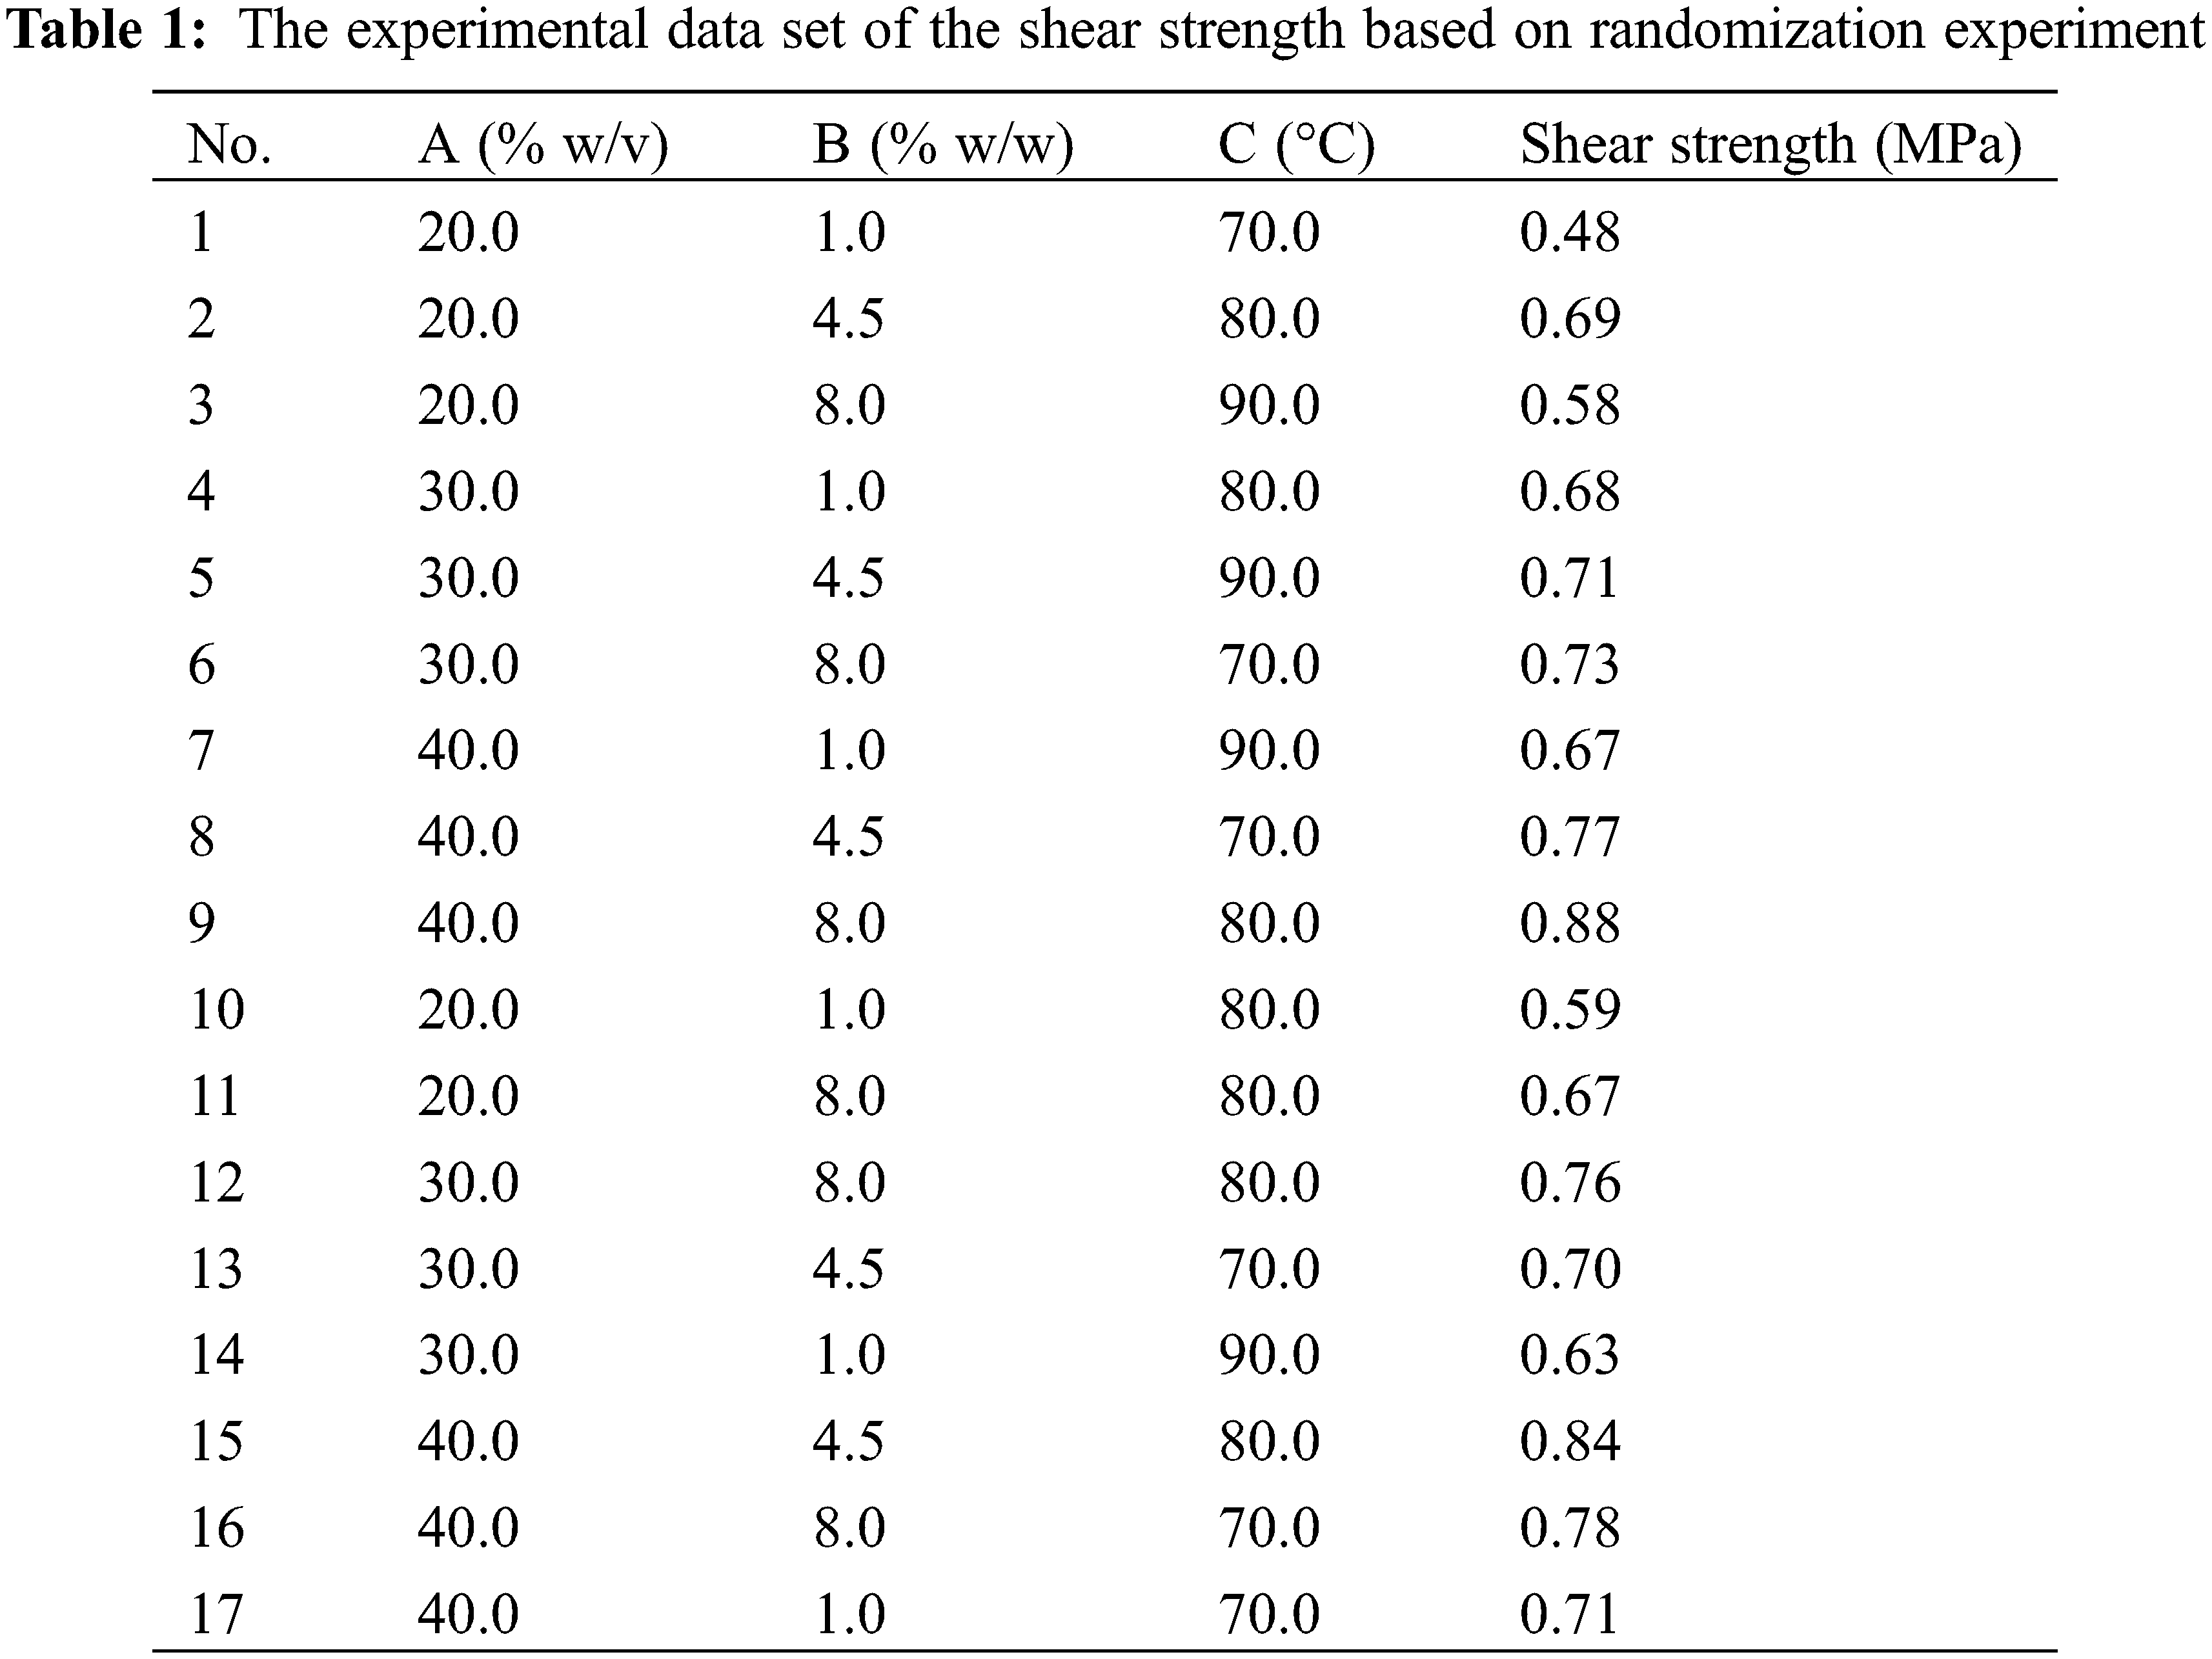
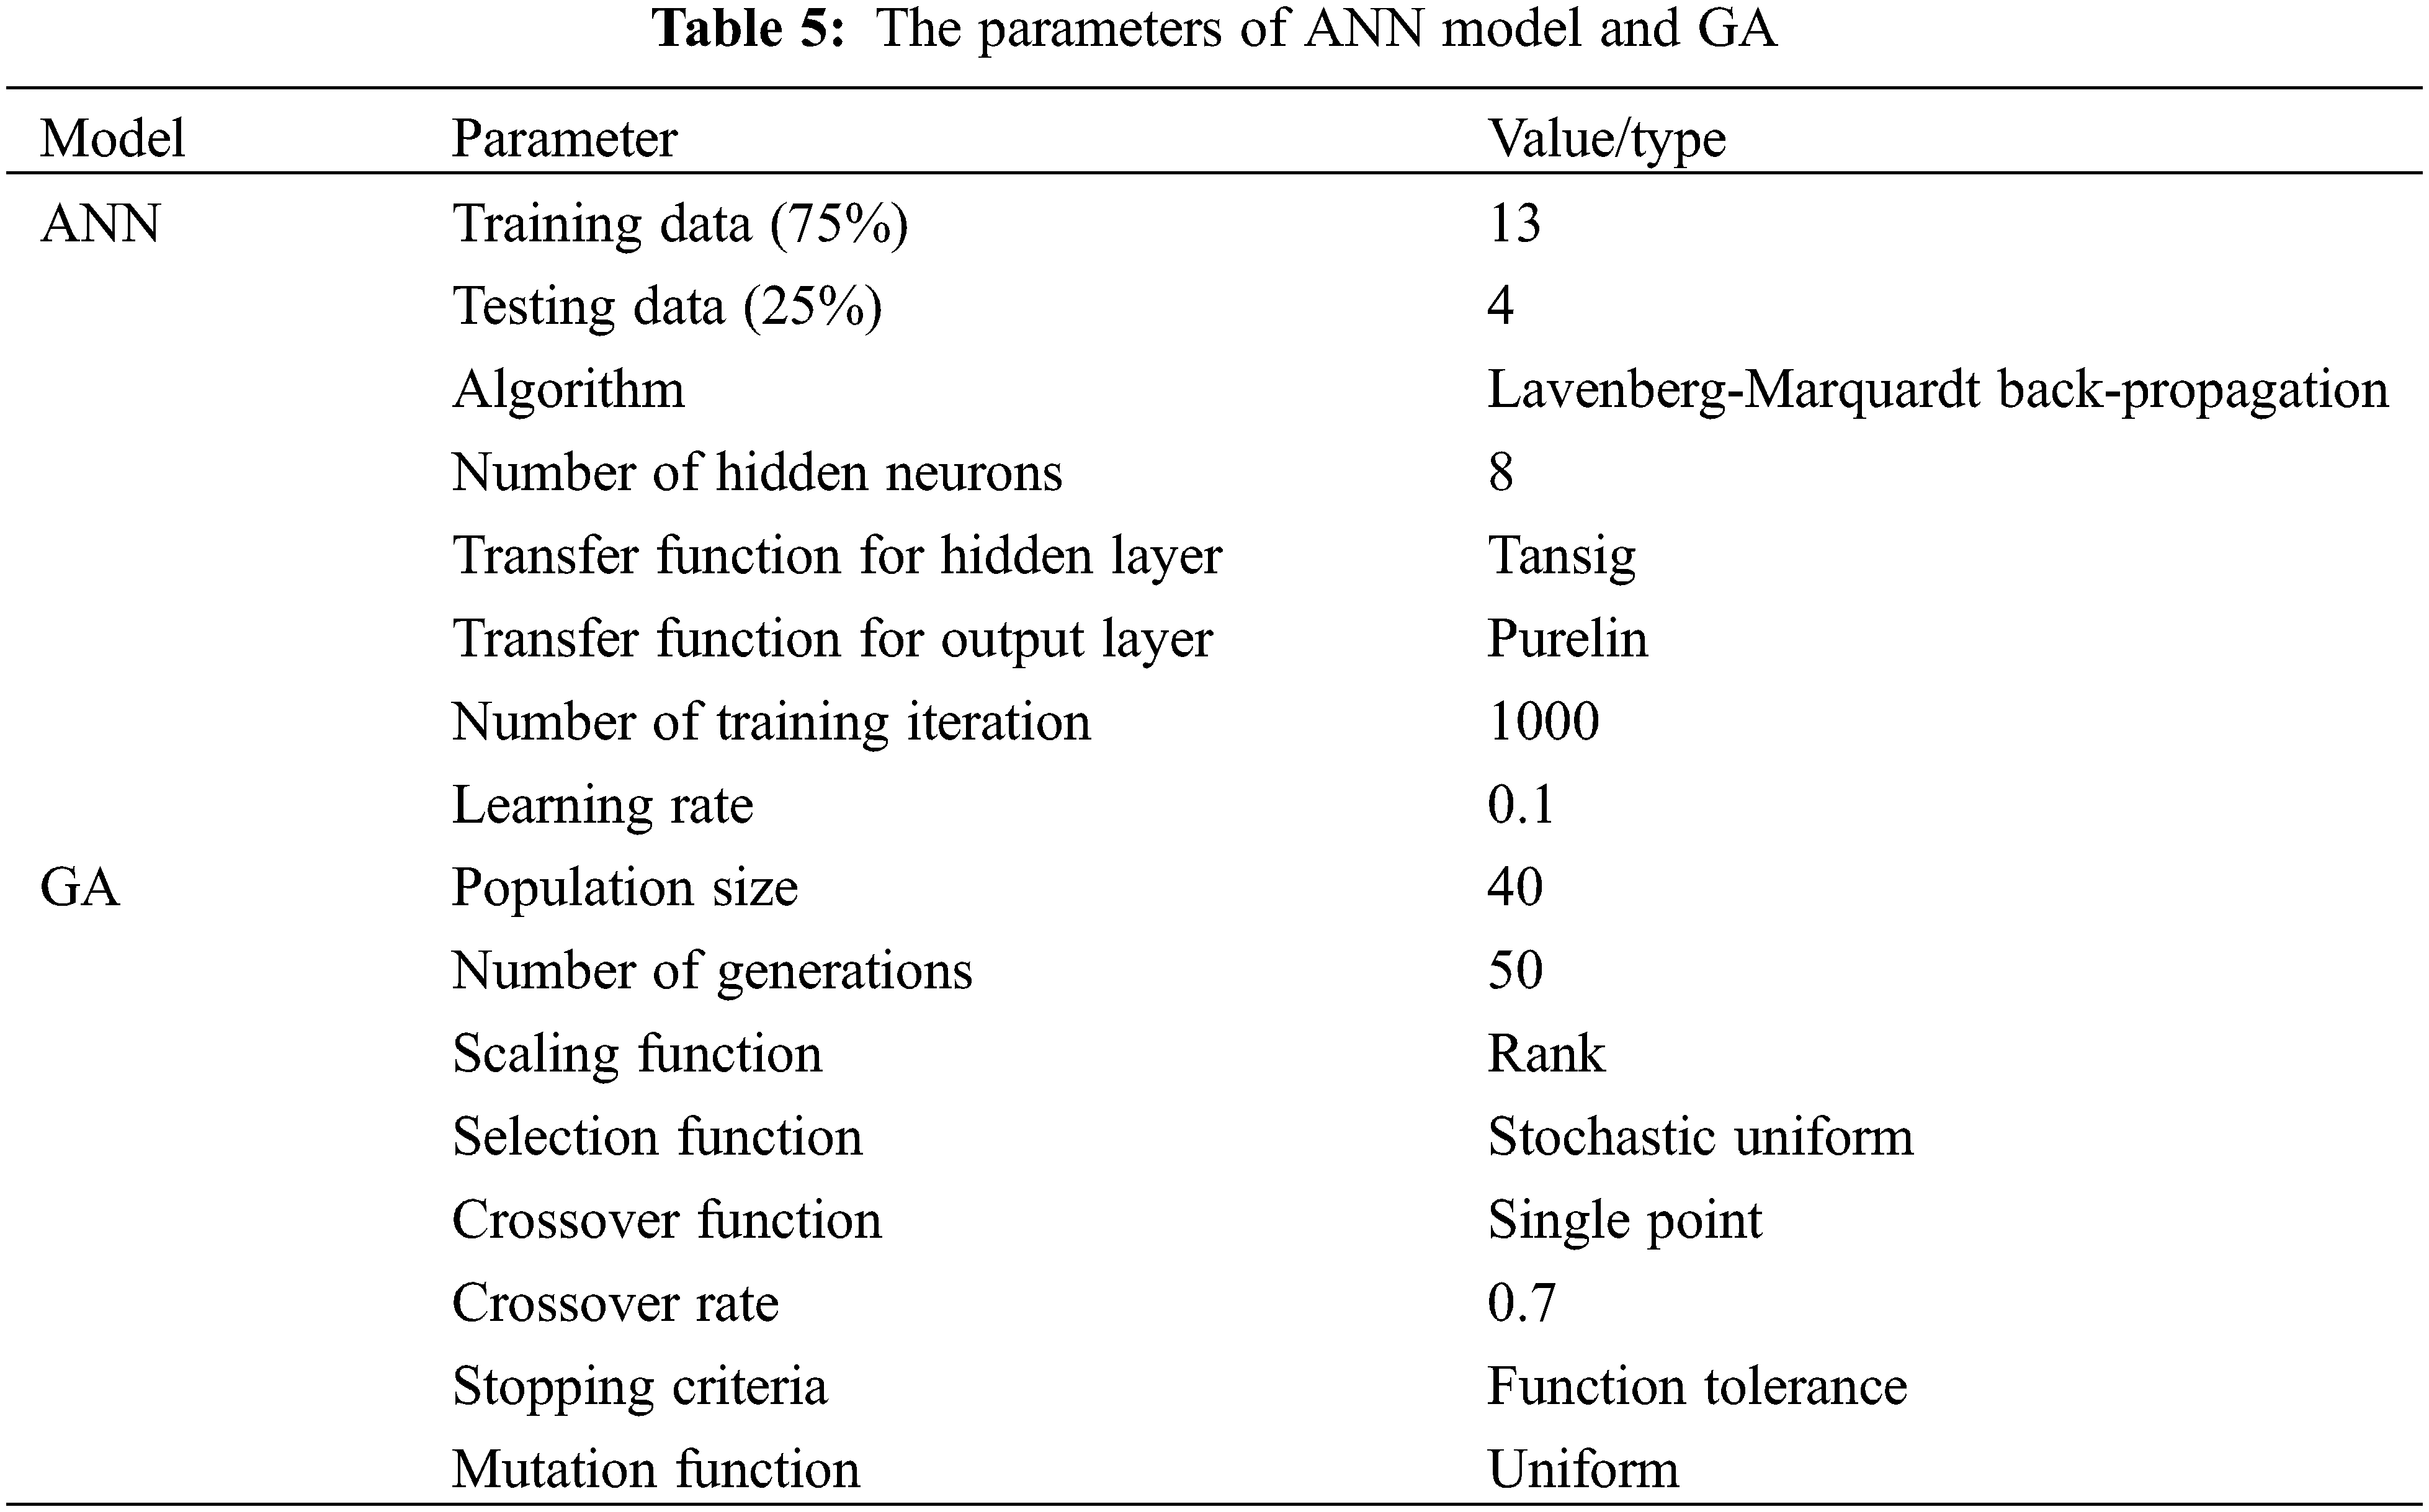
Many researchers have used about 80% of the data points for training the proposed computational model and the remaining data were used for testing the efficacy of the model [18,19]. Hence, we followed the same method in the experiment, i.e., the experimental data set used for artificial intelligence (AI) models were randomly divided into a training data set (75%) and testing data set (25%) as shown in Table 1 (randomization experiment). In the Table 1, symbol A represented the starch content (% w/v), B represented the NaOH concentration (% w/w), and C represented the reaction temperature (°C).
In addition, three statistical indices of root mean square error (RMSE), mean absolute error (MAE) and the coefficients of determination (R2) were used to estimate the performance of the artificial intelligence models [20,21]. The least RSME and MAE values, and maximum R2 value in the testing process were the criteria to obtain the best AI model. These statistical indices correlated the predicted and actual values were determined using the Eqs. (3)∼(5), respectively.
where n is the number of data points, x is the actual value, and y is the predicted output value.
3.1 Range and Variance Analysis Based on the Orthogonal Experiment Design
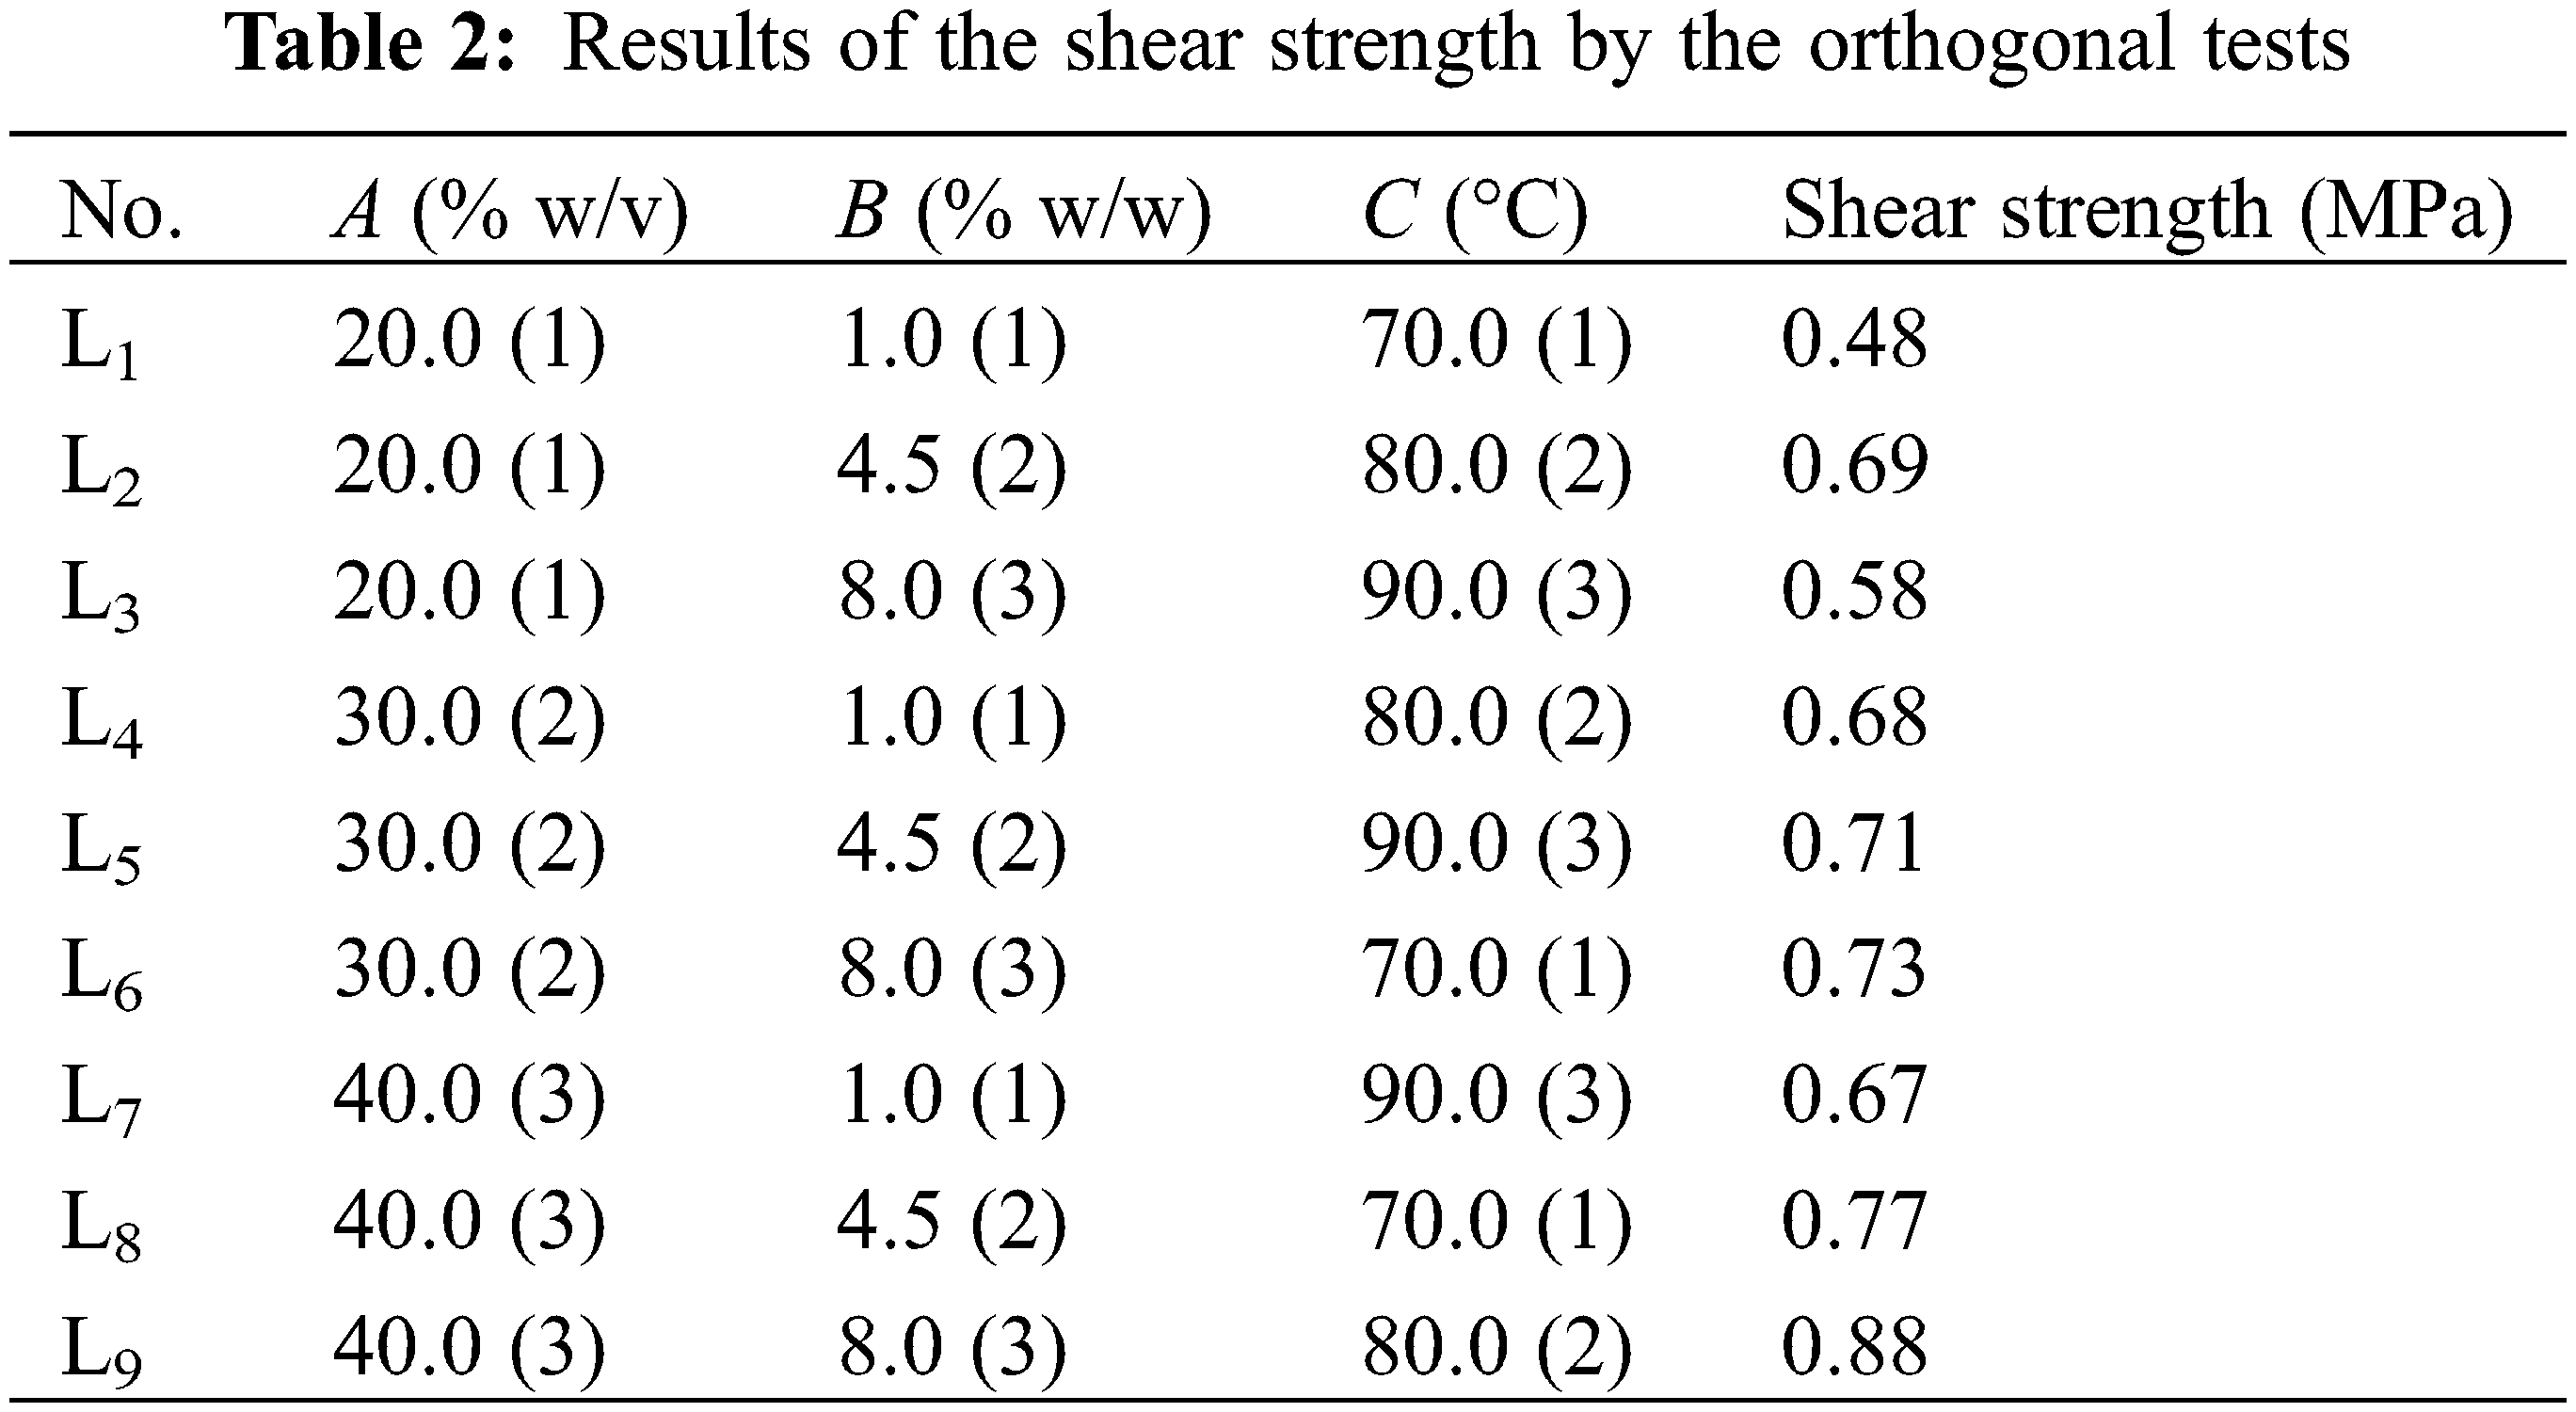
Orthogonal experimental design is widely used to explore the influence law of multivariate and multilevel factors [22,23]. Therefore, the shear strength of the cassava starch adhesives were firstly designed and implemented by the orthogonal experiment. The experimental scheme with the L9(34) orthogonal array considering three-factor and three-level was designed without interaction as shown in Table 2. In the Table 2, the value in the parentheses represented their levels.
The analysis of range (ANORA) is commonly used in determining the key influential factors and optimal combination in the multiple-factor orthogonal test. The range calculation equation is shown as follows:
where Rj is the range of the factor j, and the larger Rj, the larger significance of the factor j; kjm is the average response value of the level m corresponding to the factor j.
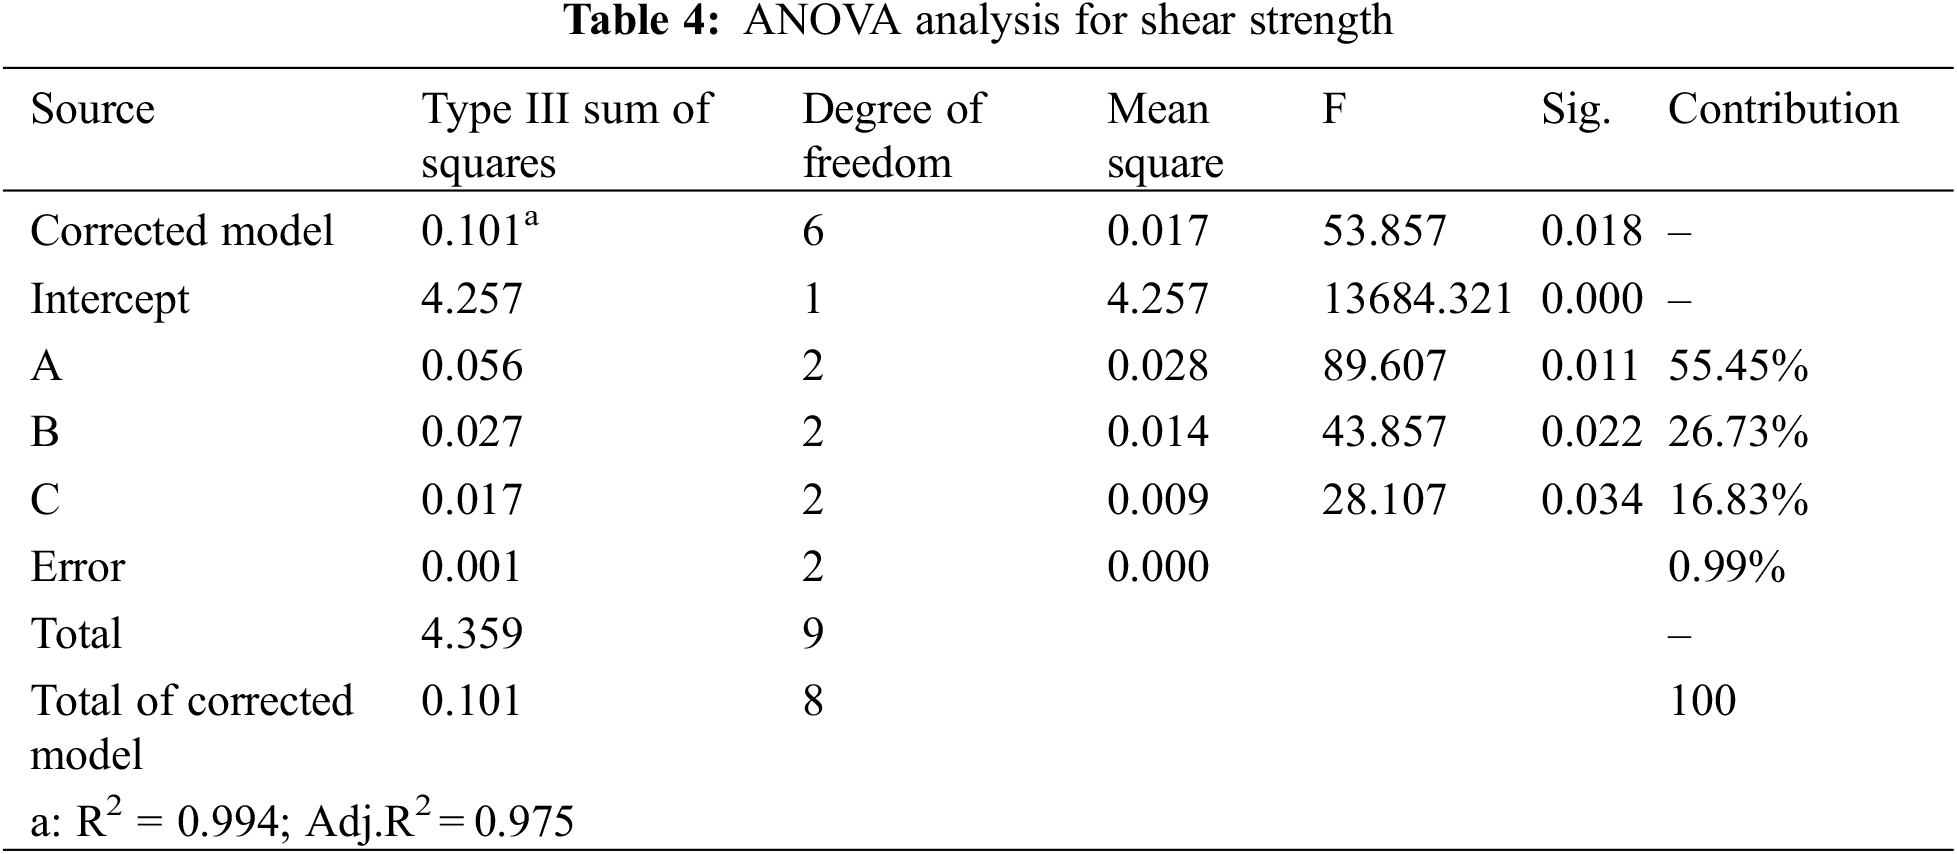
Analysis of variance (ANOVA) was introduced to judge the influence of each factor on the shear strength of the cassava starch adhesives more accurately. Moreover, the percentage contribution of each factor (%) in the shear strength value was calculated by Eq. (7) [24,25]:
where Pj is the percentage contribution for the factor j, SSj is the sum of squares for the factor j and SST is total sum of squares.
Using experimental data from Table 2 and combined with SPSS software [26], the results of ANORA and ANOVA were shown in Tables 3 and 4, respectively. The Rj value is commonly used to judge the relative importance of each factor, and the larger Rj, the larger significance of the factor.
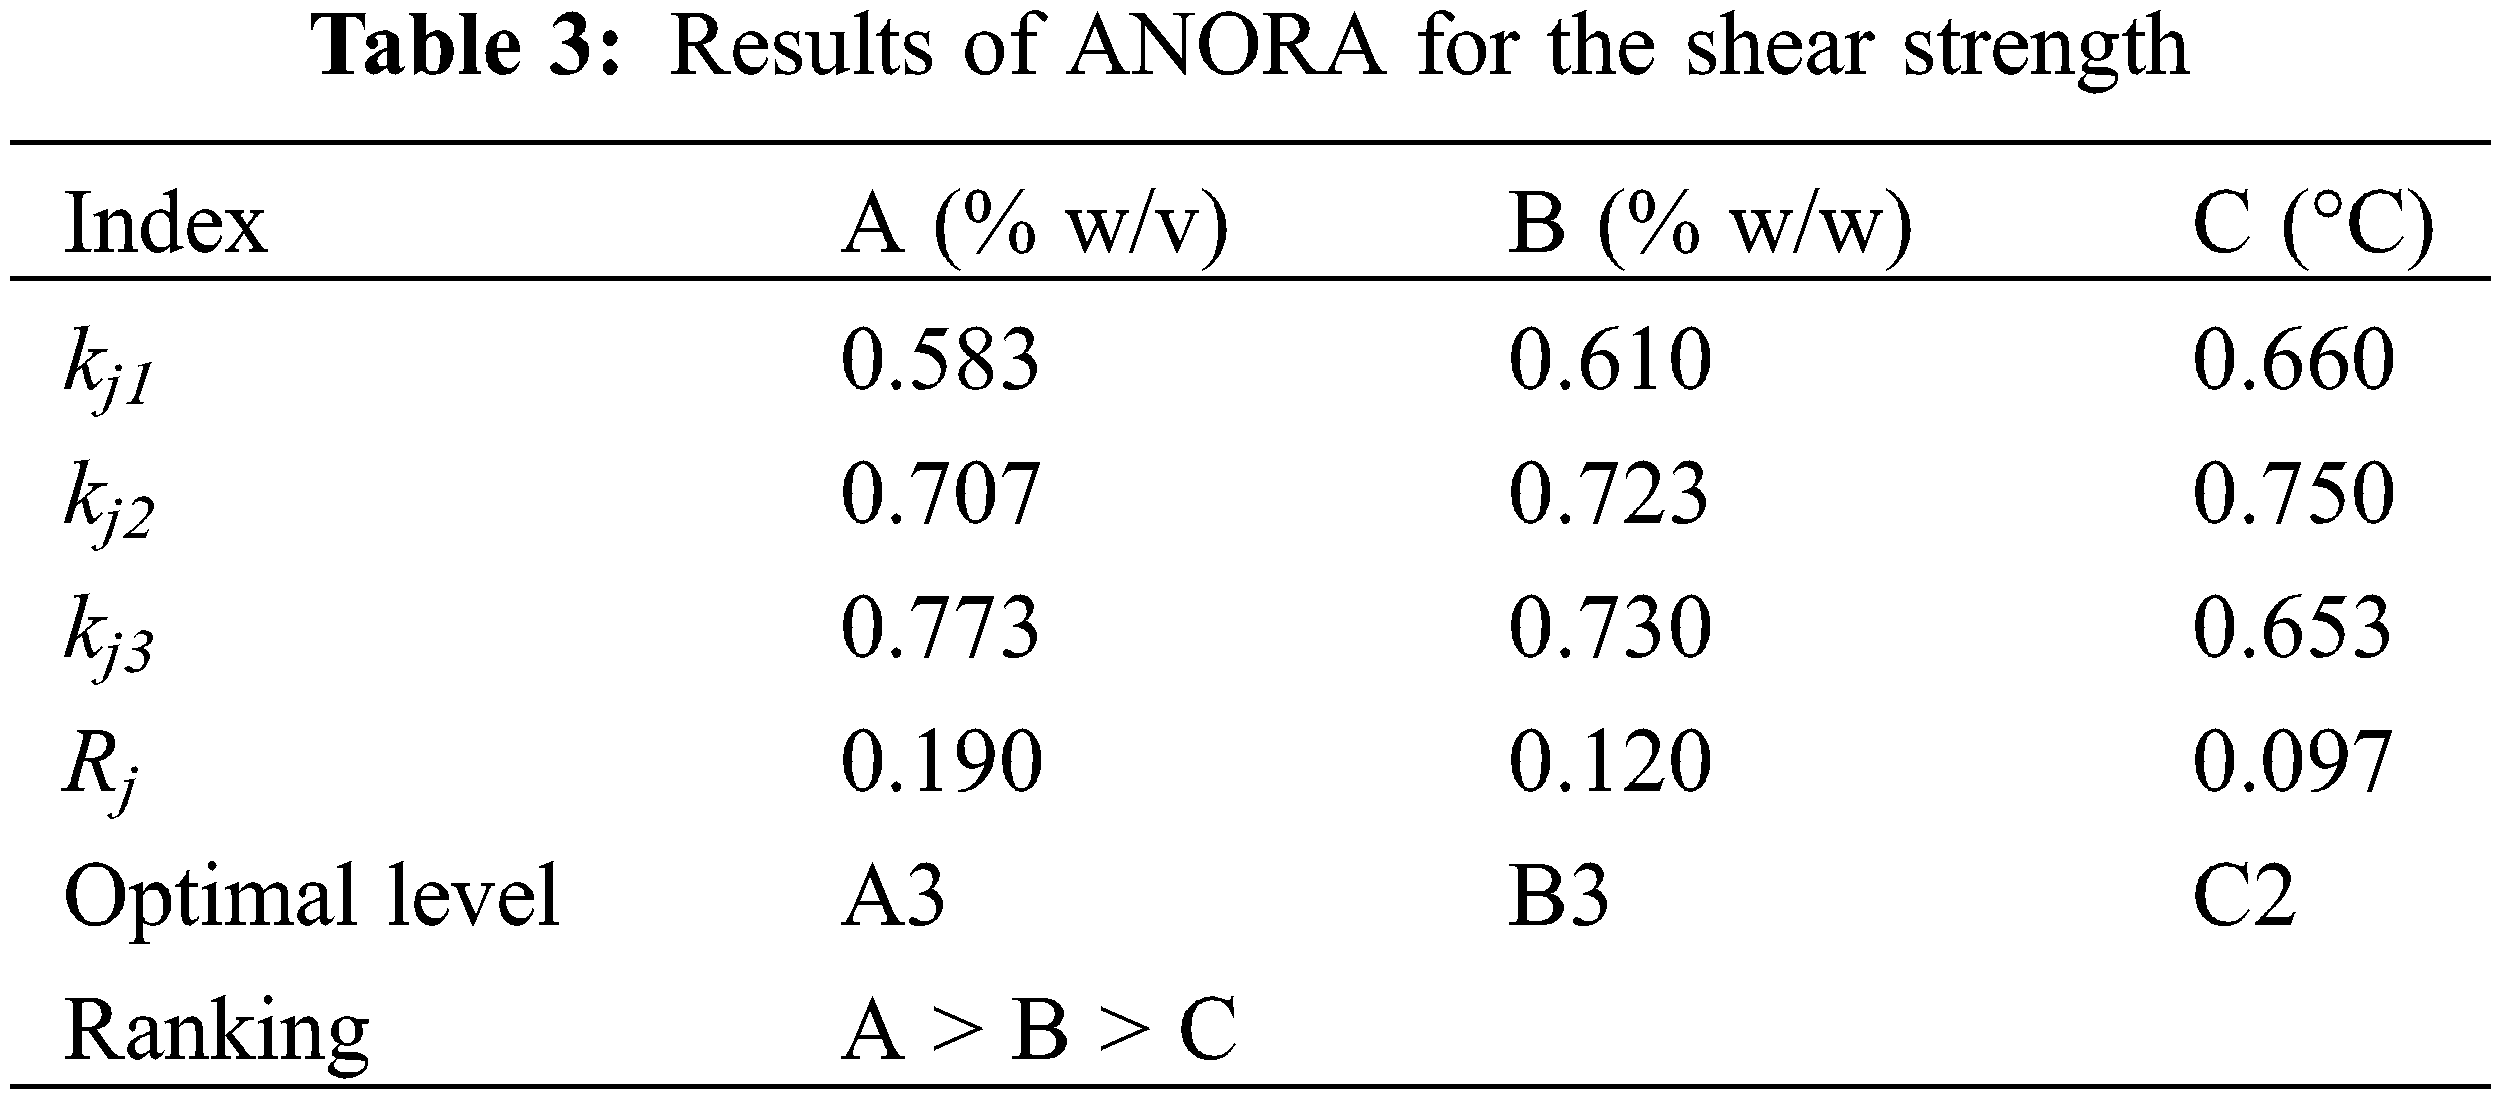
In terms of the value of R for the shear strength in Table 3, it can be seen that the influence degree of three factors for the shear strength was ordered as follows: starch percentage, NaOH percentage and reaction temperature. Based on the ANORA in Table 3, the relationship between the factor level and average shear strength was plotted in Fig. 2, which showed that the optimal combination of factor-level to maximize the shear strength were as follows: the starch content was 40% w/v, the NaOH concentration was 8% w/w, and the reaction temperature was 80°C (A3B3C2, No. 9).
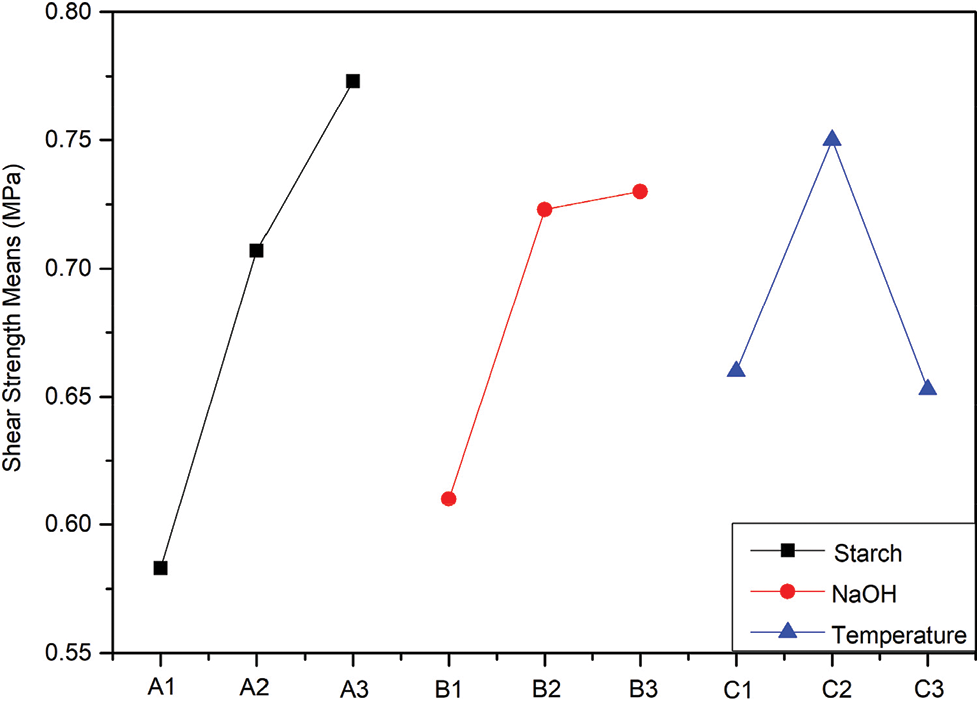
Figure 2: Effect curves for the shear strength
Moreover, in order to obtain the accurate significance estimation on the factors, the ANOVA was performed. It can be seen from Table 4 that the significance of starch content, NaOH concentration and temperature were all less than 0.05, indicating that the each factor had a significant impact on shear strength. The most critical variable was also evaluated by calculating the percentage contribution of each factor. According to Eq. (7), the most contributing process variable was A with a percentage of 55.45%, followed by B with 26.73% and C with 16.83% for the shear strength of cassava starch adhesives as shown in Table 4.
3.2 Artificial Neural Network (ANN)
Artificial neural network, a feedforward, back-propagation multilayered perception (MLP) network is one of the popular artificial intelligence technology, which is able to deal with linear and nonlinear functions in surrogate models [5,27]. The Levenberg-Marquardt function (trainlm function) was used for training the ANN network by MATLAB R2018a software in a Windows 10 environment [17,24].
It should be pointed out that the quantity of neurons in the hidden layer is largely significance for the neural network structure [20,28]. However, there is no specific formula to evaluate the number of neurons [29]. Thus, in this study a trial and error method was set to select the optimal neurons in the hidden layer. Due to random initialization of the weights and biases, each ANN model was iterated 8 times. It was found that eight neurons in the hidden layer provided the best data. Hence, the ANN based model was structured with three neurons in the input layer (i.e., starch content, NaOH concentration and temperature), eight neurons in the hidden layer, and one neuron in the output layer (i.e., shear strength). The network architecture considered in this work was 3 × 8 × 1 as shown in Fig. 3. The hyperbolic tangent sigmoid function (tansig) and pure-liner were chosen for the hidden and output layers, respectively [17]. The properties of the ANN modeling were shown in Table 5.
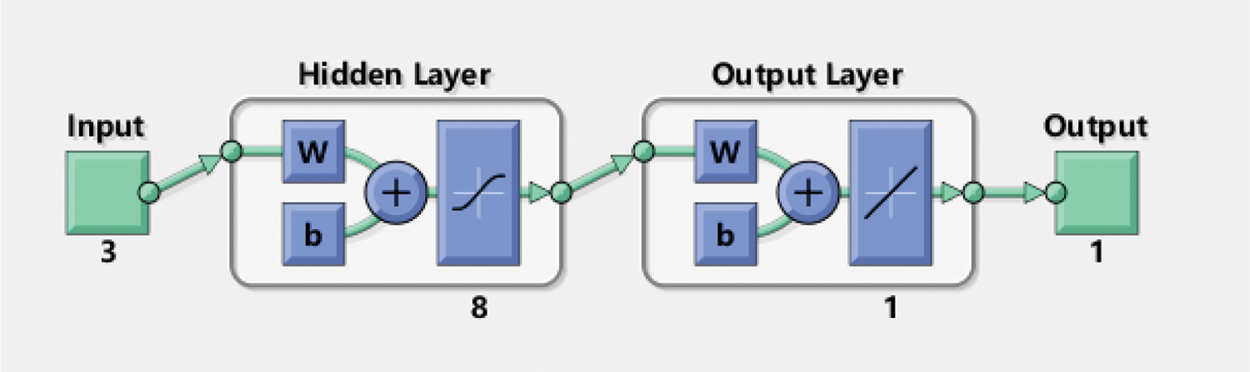
Figure 3: ANN structure of 3 × 8 × 1
3.3 GA-Optimized ANN Algorithm
A hybrid artificial neural network optimized by genetic algorithm (GA-optimized ANN) mainly included three parts: the establishment of ANN, the optimization of the weights and bias of ANN by genetic algorithm and the prediction by optimized ANN [29,30]. In this work, the establishment of GA-optimized ANN was based on the MATLAB R2018a platform. The parameters of the ANN model and genetic algorithm were shown in Table 5. The ANN training errors were used as the fitness values to obtain the optimal weights and bias of the corresponding ANN through several iterations. Finally, the optimized ANN was employed as the prediction function. Fig. 4 showed the flowchart of ANN using GA optimization.
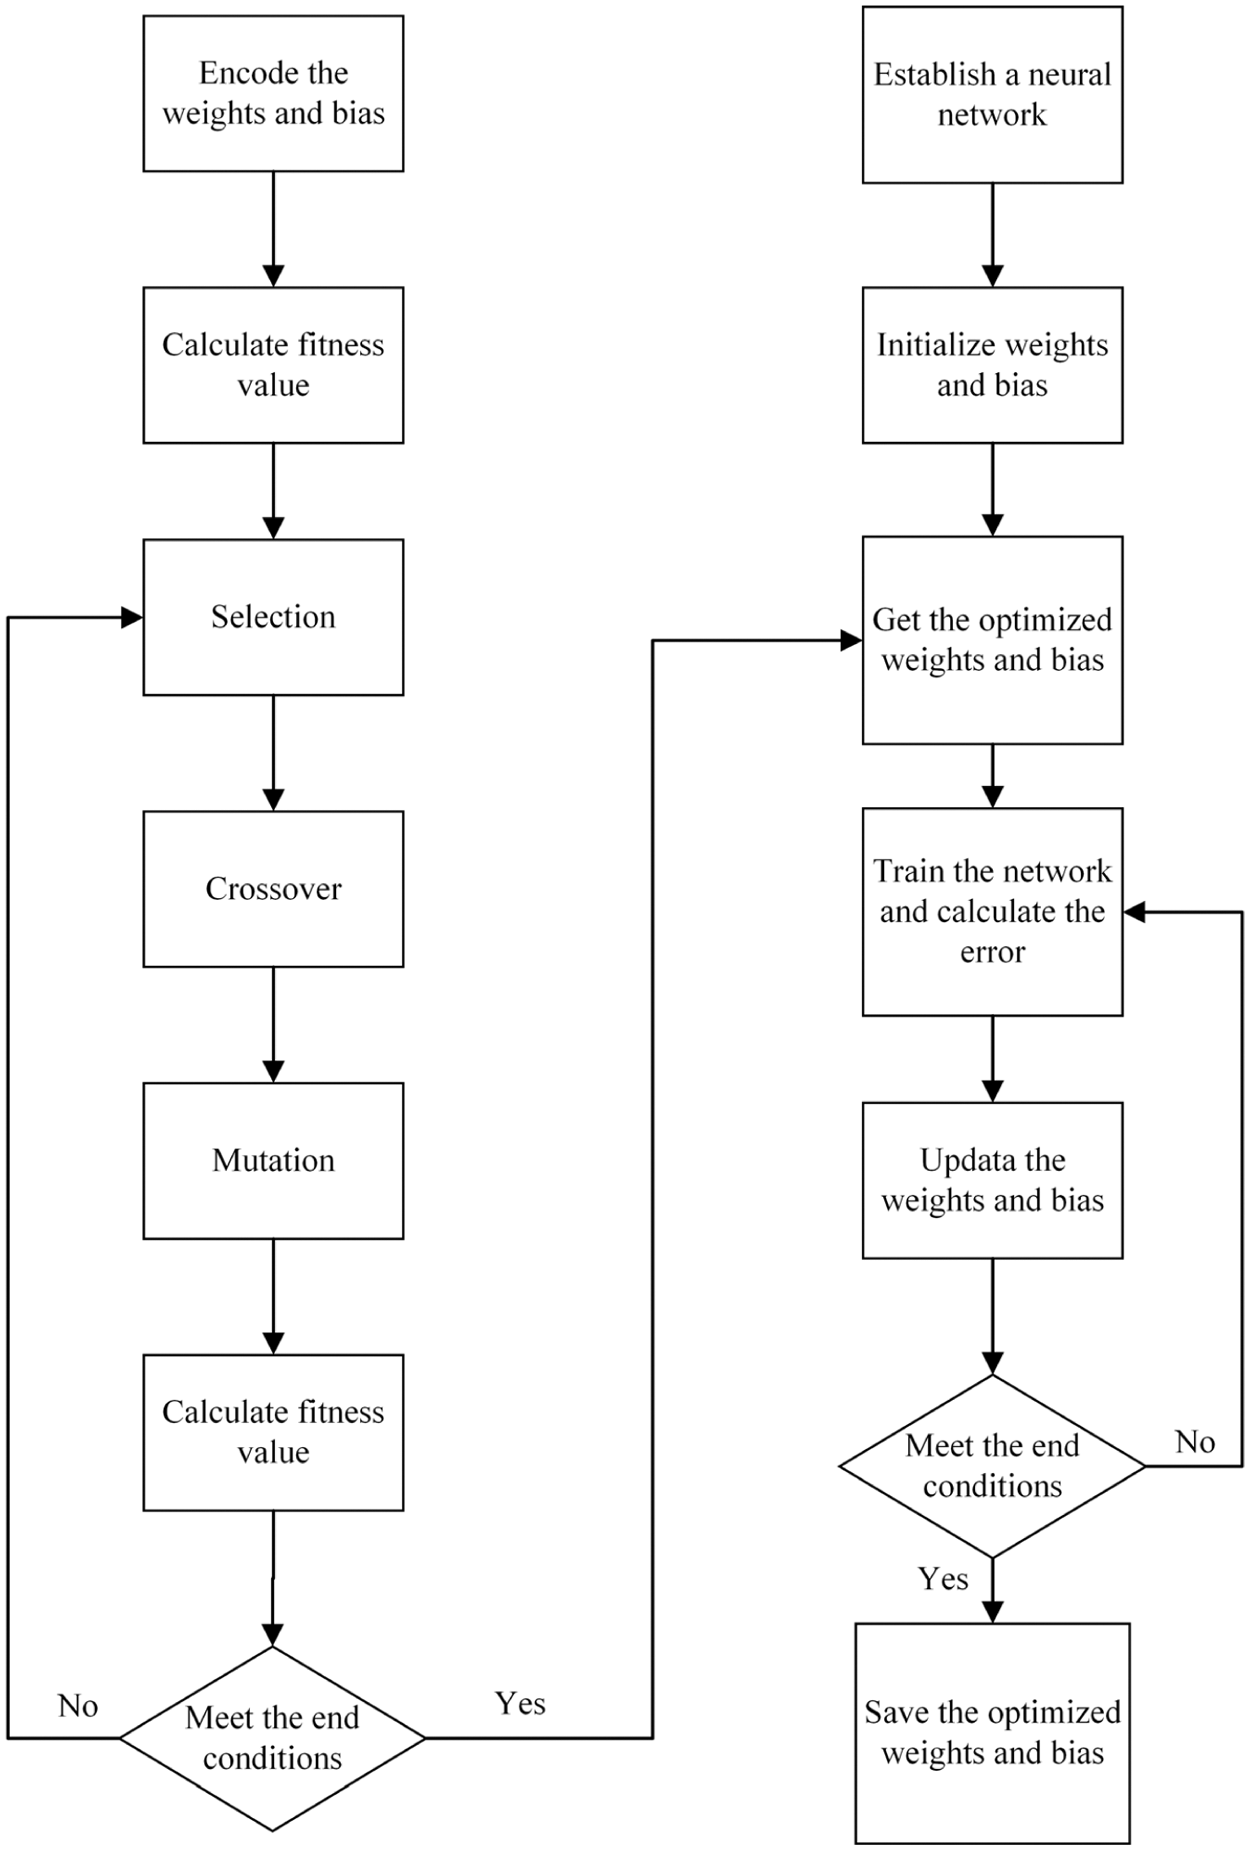
Figure 4: Flow chart of artificial neural network optimized by genetic algorithm
3.4 Support Vector Regression (SVR)
Support vector classification (SVC) and support vector regression (SVR) were two main machine learning methods in Support Vector Machines (SVMs) [31]. The epsilon-SVR with the library for support vector machine (LIBSVM) package was employed in this study [32]. The use of LIBSVM involved two steps: firstly, training a dataset to obtain a model and secondly, using the model to predict information of a testing dataset [32].
Given a set of training data{(xi, di), xi ∈ Rz, di ∈ R, i = 1, 2, ⋅ ⋅ ⋅ , n}, which xi and di was the z-dimensional feature vector and the corresponding target output, respectively. The regression function was considered as follows [33]:
where w and b were weight vector and bias respectively and ϕ(x) was the nonlinear function.
The SVR model was to find the minimum error for the desired space. Hence, the minimized objective function and the constraints were as follows:
where C was regularization constant; ξi and
The dual Lagrange form was acquired by the Lagrange multipliers
where K(xi, xj) = ϕ(xi)Tϕ(xj)
After solving the above equation, the approximate function can be given by:
Radial basis function (RBF) was one of the most common kernels in the SVM model [33]. Radial basis function (RBF) was defined as follows:
where γ was the hyperparameters.
The regularization constant C, epsilon ε, kernel type and hyperparameters γ strongly affected the performance of the SVM model. In this study, the RBF kernel with γ = 0.25, C = 218 and ε = 0.01 obtained the best performance by the grid search method [33,35].
3.5 Adaptive Neuro Fuzzy Inference System (ANFIS)
Adaptive neuro-fuzzy inference system (ANFIS) is a hybrid of neural networks and fuzzy inference system (FIS), which includes the advantages of ANN and fuzzy logic [36,37]. An ANFIS toolbox in the MATLAB R2018a is used to train and develop the proposed ANFIS model, which is based on the Takagi-Sugeno FIS procedure [19,38].
In this study, an FIS was generated using Subtractive Clustering (SC) method, which assumed that each data point was a potential cluster center and calculated the potential for each data point based on the density of surrounding data points. Then a hybrid of the least squares and back-propagation method was applied to train the FIS by constructing a Gaussian membership function (MF) [39]. The optimum values of the SC model parameters were obtained through trial and error approach. Finally, the values for the range of influence and squash factor were considered as 0.5 and 1.25, respectively. The values of the accepted ratio and rejected ratio parameters were considered 0.5 and 0.15, respectively. The various setting parameters for training ANFIS models were listed in Table 6. ANFIS architecture was presented in Fig. 5.
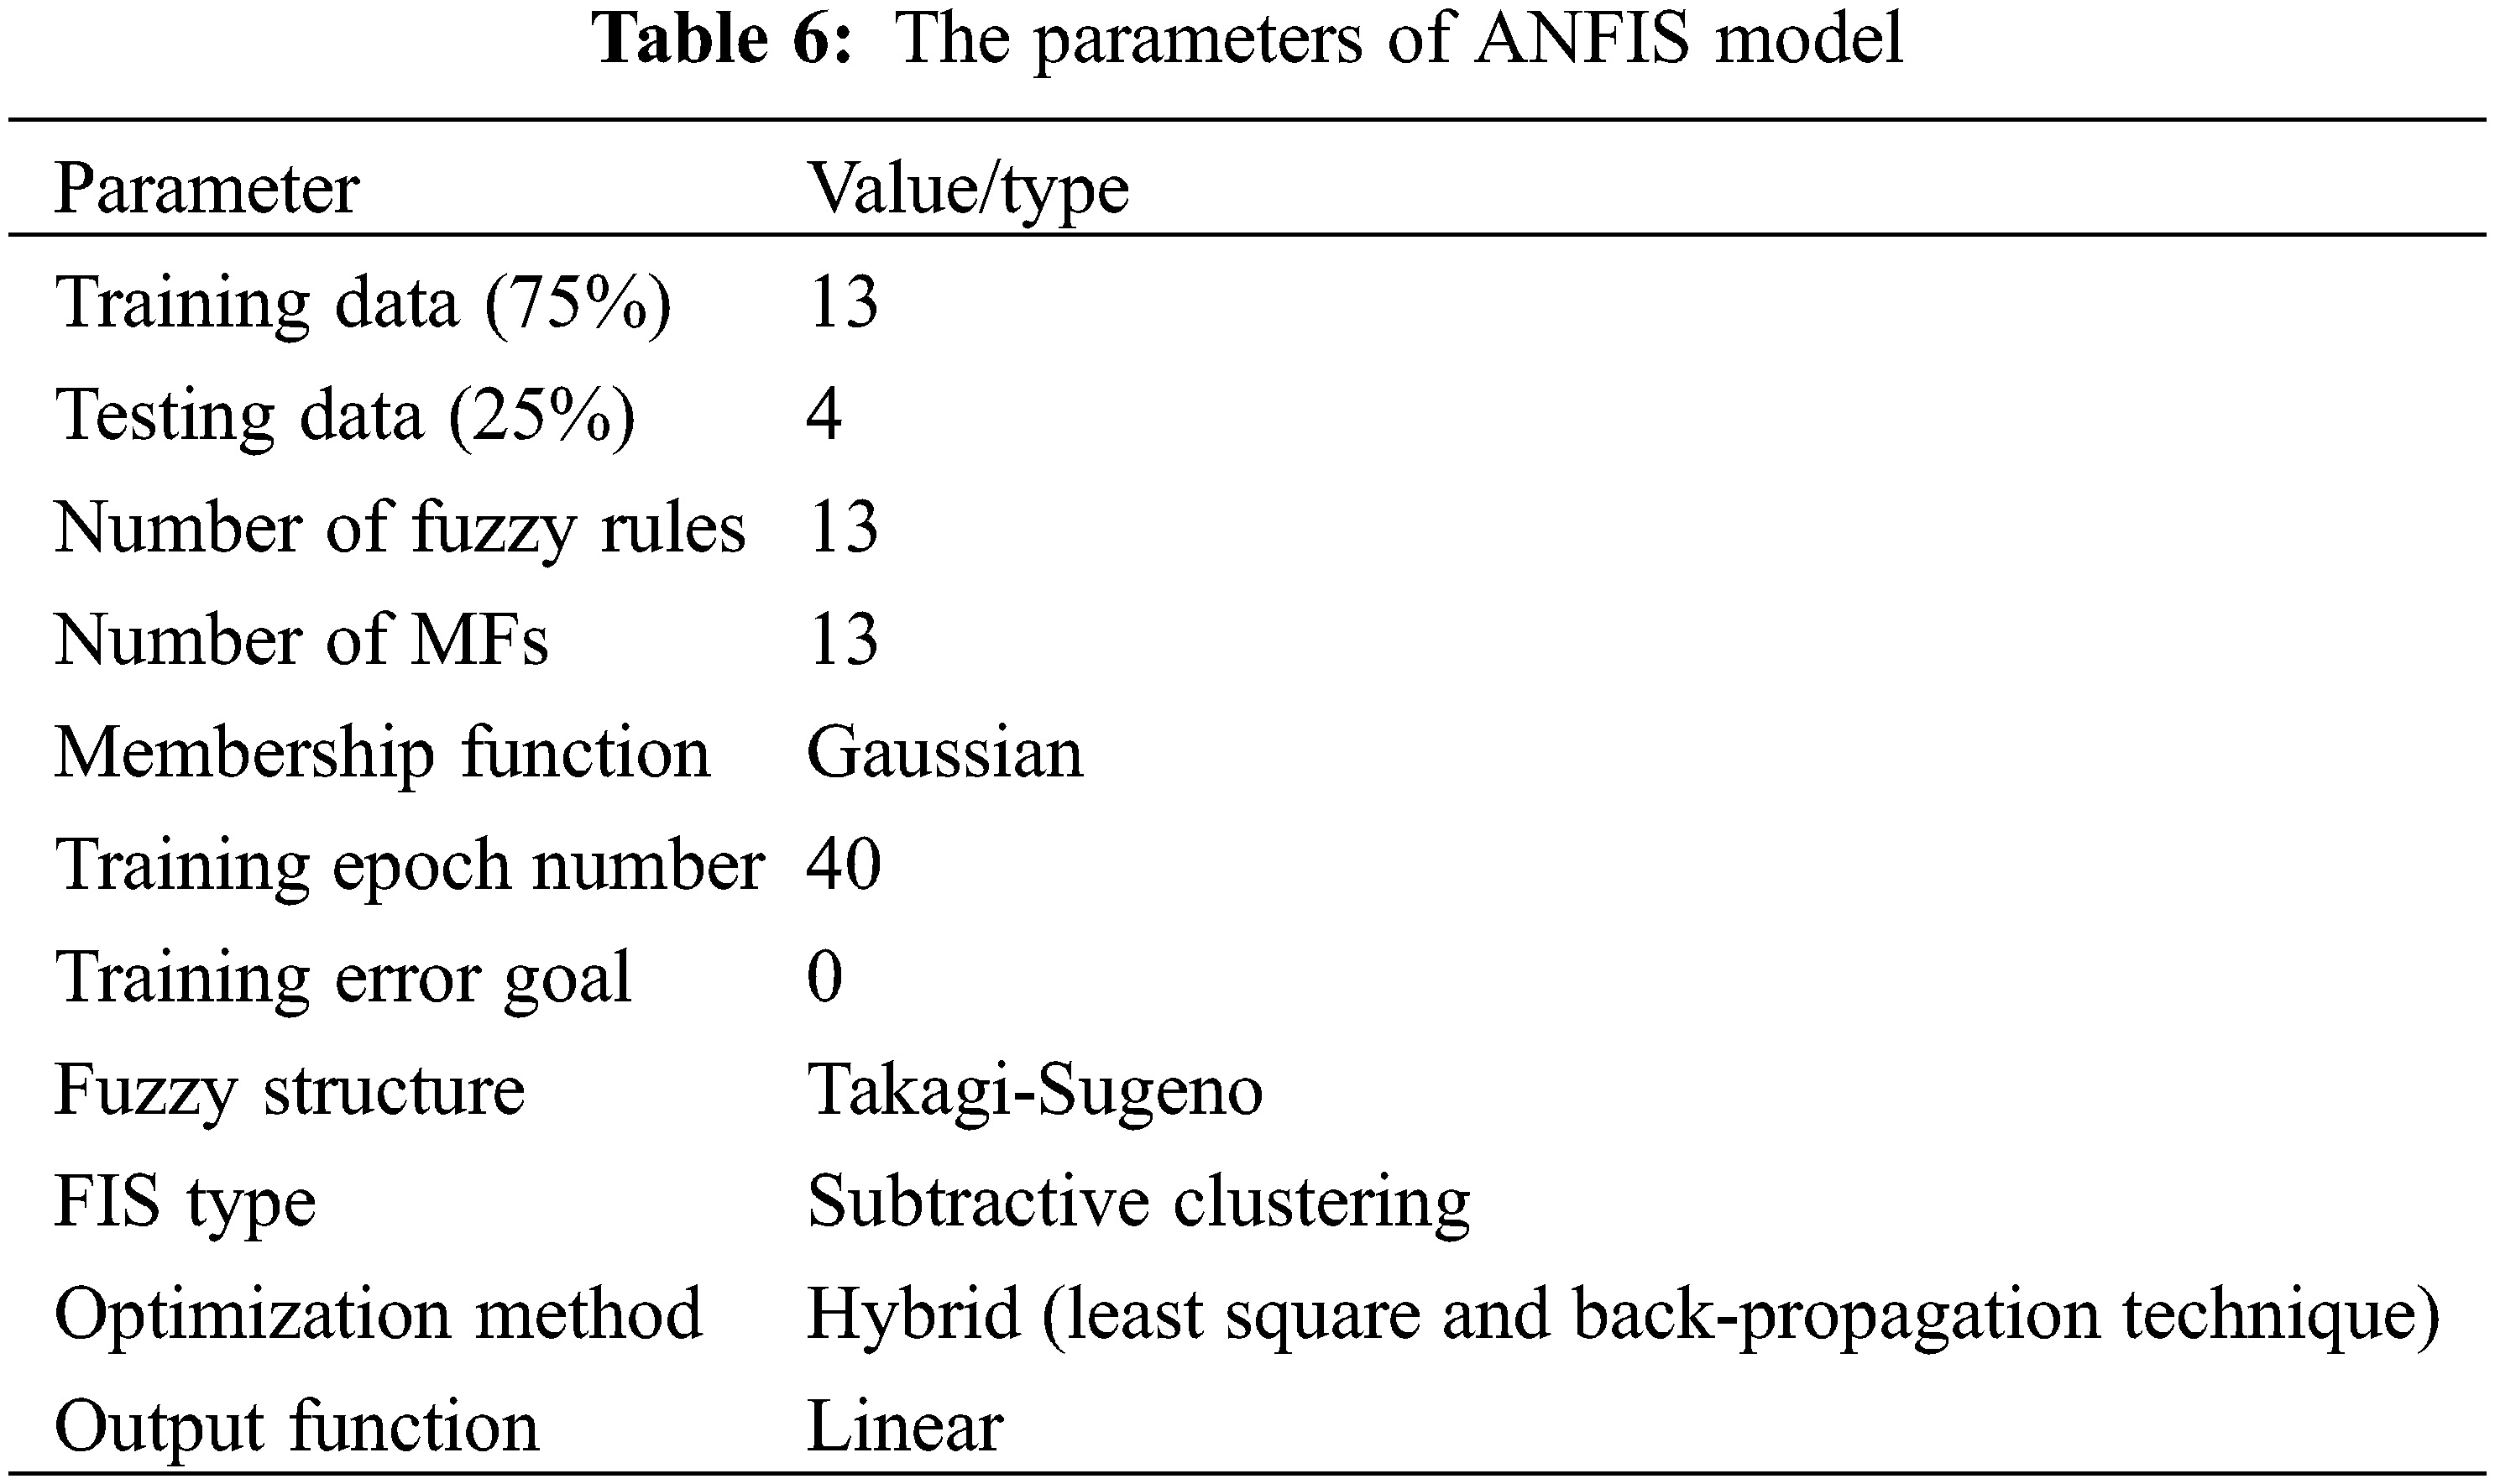
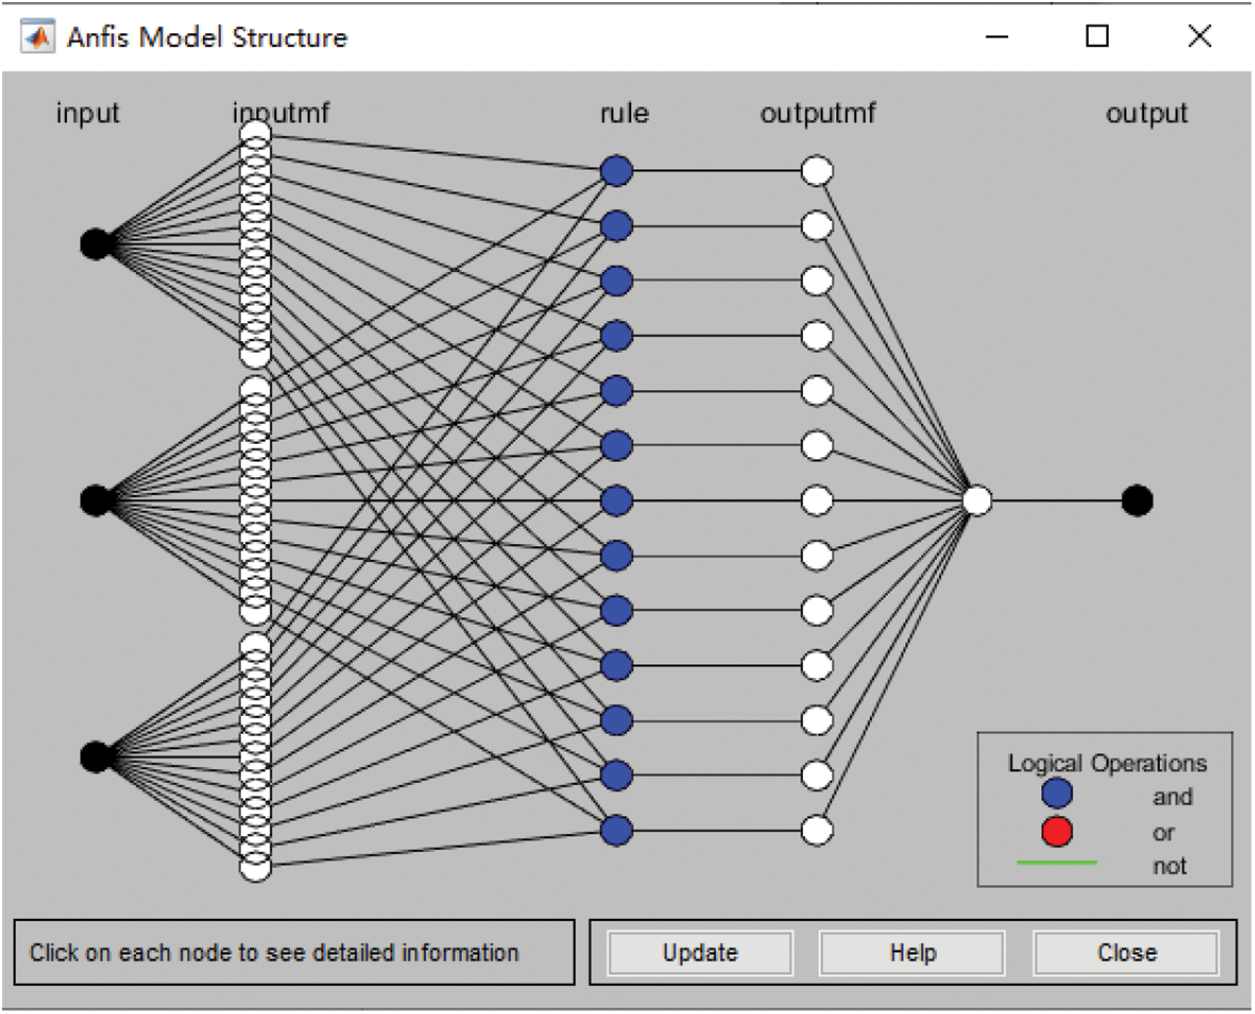
Figure 5: ANFIS architecture for three inputs and single output
3.6 Comparisons of Experimental and Predicted Values for Four AI Approaches
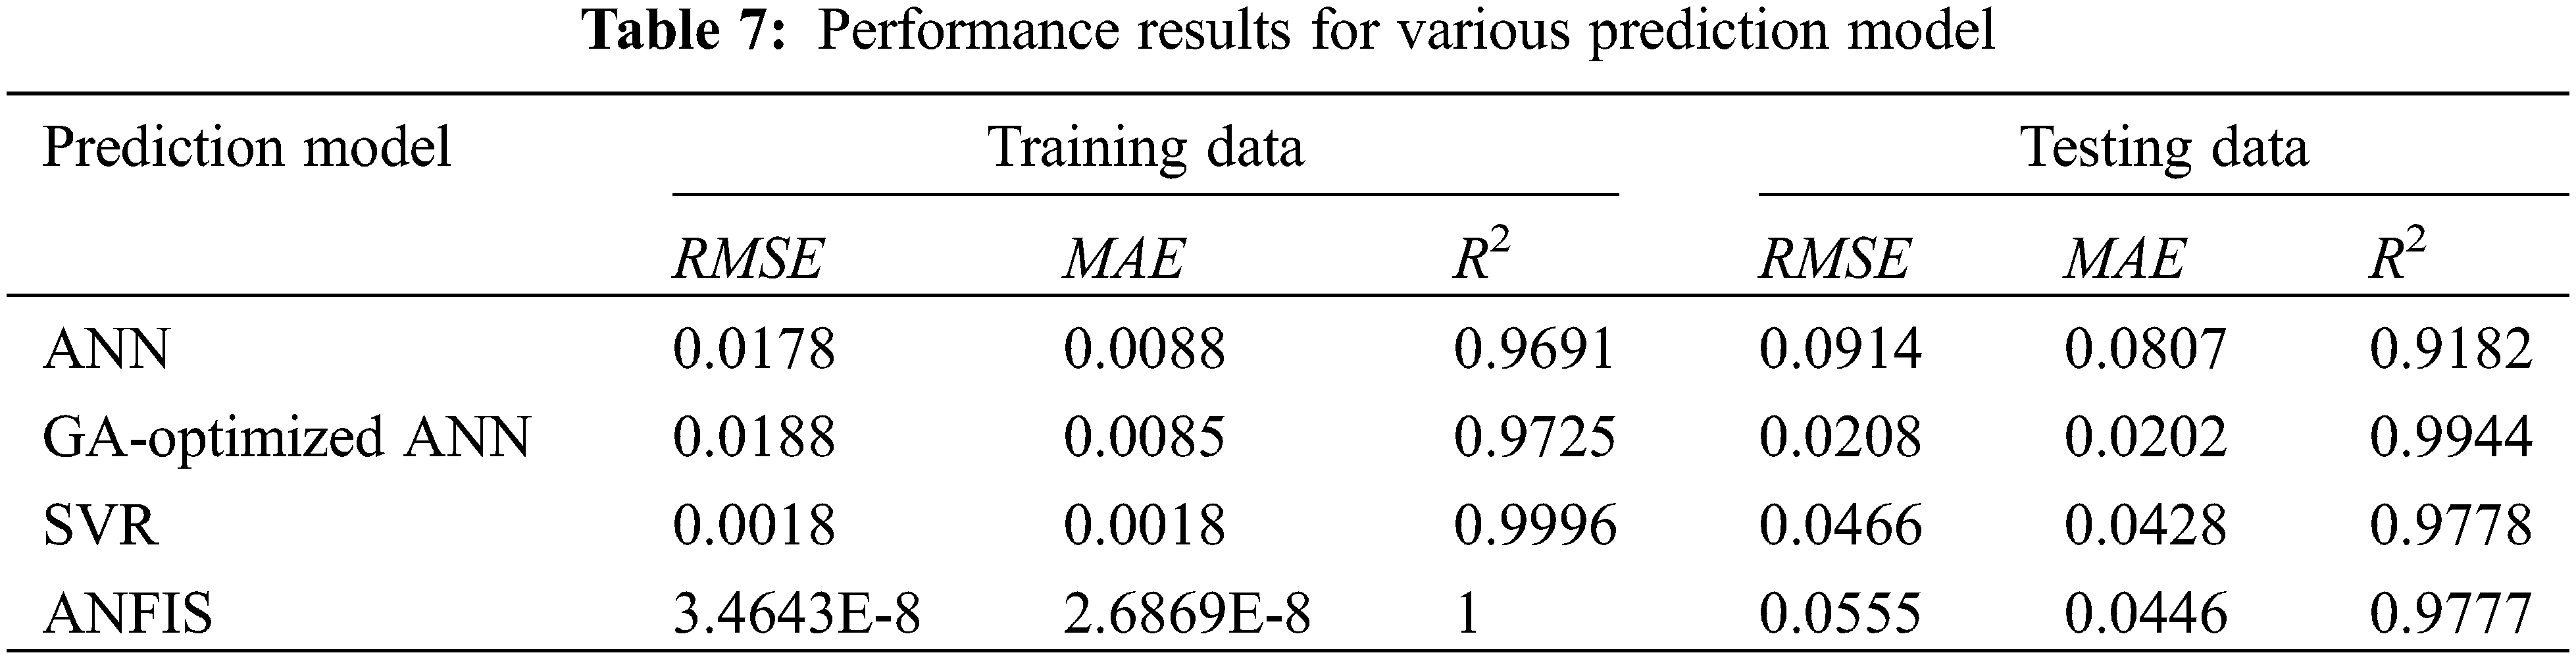
The plots for experimental and predicted values by the AI models using ANN, GA-optimized ANN, SVR and ANFIS were graphically illustrated in Fig. 6. The coefficient of determination (R2) for AI models were all above 95% in training data sets, which indicated all the AI models had superior performance. In case of testing datasets, the (R2) values were in the order: GA-optimized ANN > SVR > ANFIS > ANN. Table 7 showed the performances of the four AI methods for the shear strength. From Table 7, the value of R2 in the testing datasets was highest for GA-optimized ANN followed by SVR model (i.e., 0.9944 and 0.9778, respectively). The values of RMSE and MAE in the testing datasets were lowest for GA-optimized ANN followed by SVR and ANFIS model, respectively. The prediction results of the GA-optimized ANN model were satisfactory compared with the performances of the other AI methods. Hence, the GA-optimized ANN model will be combined with the genetic algorithm (GA) to find the optimal combination of factors in the next section.
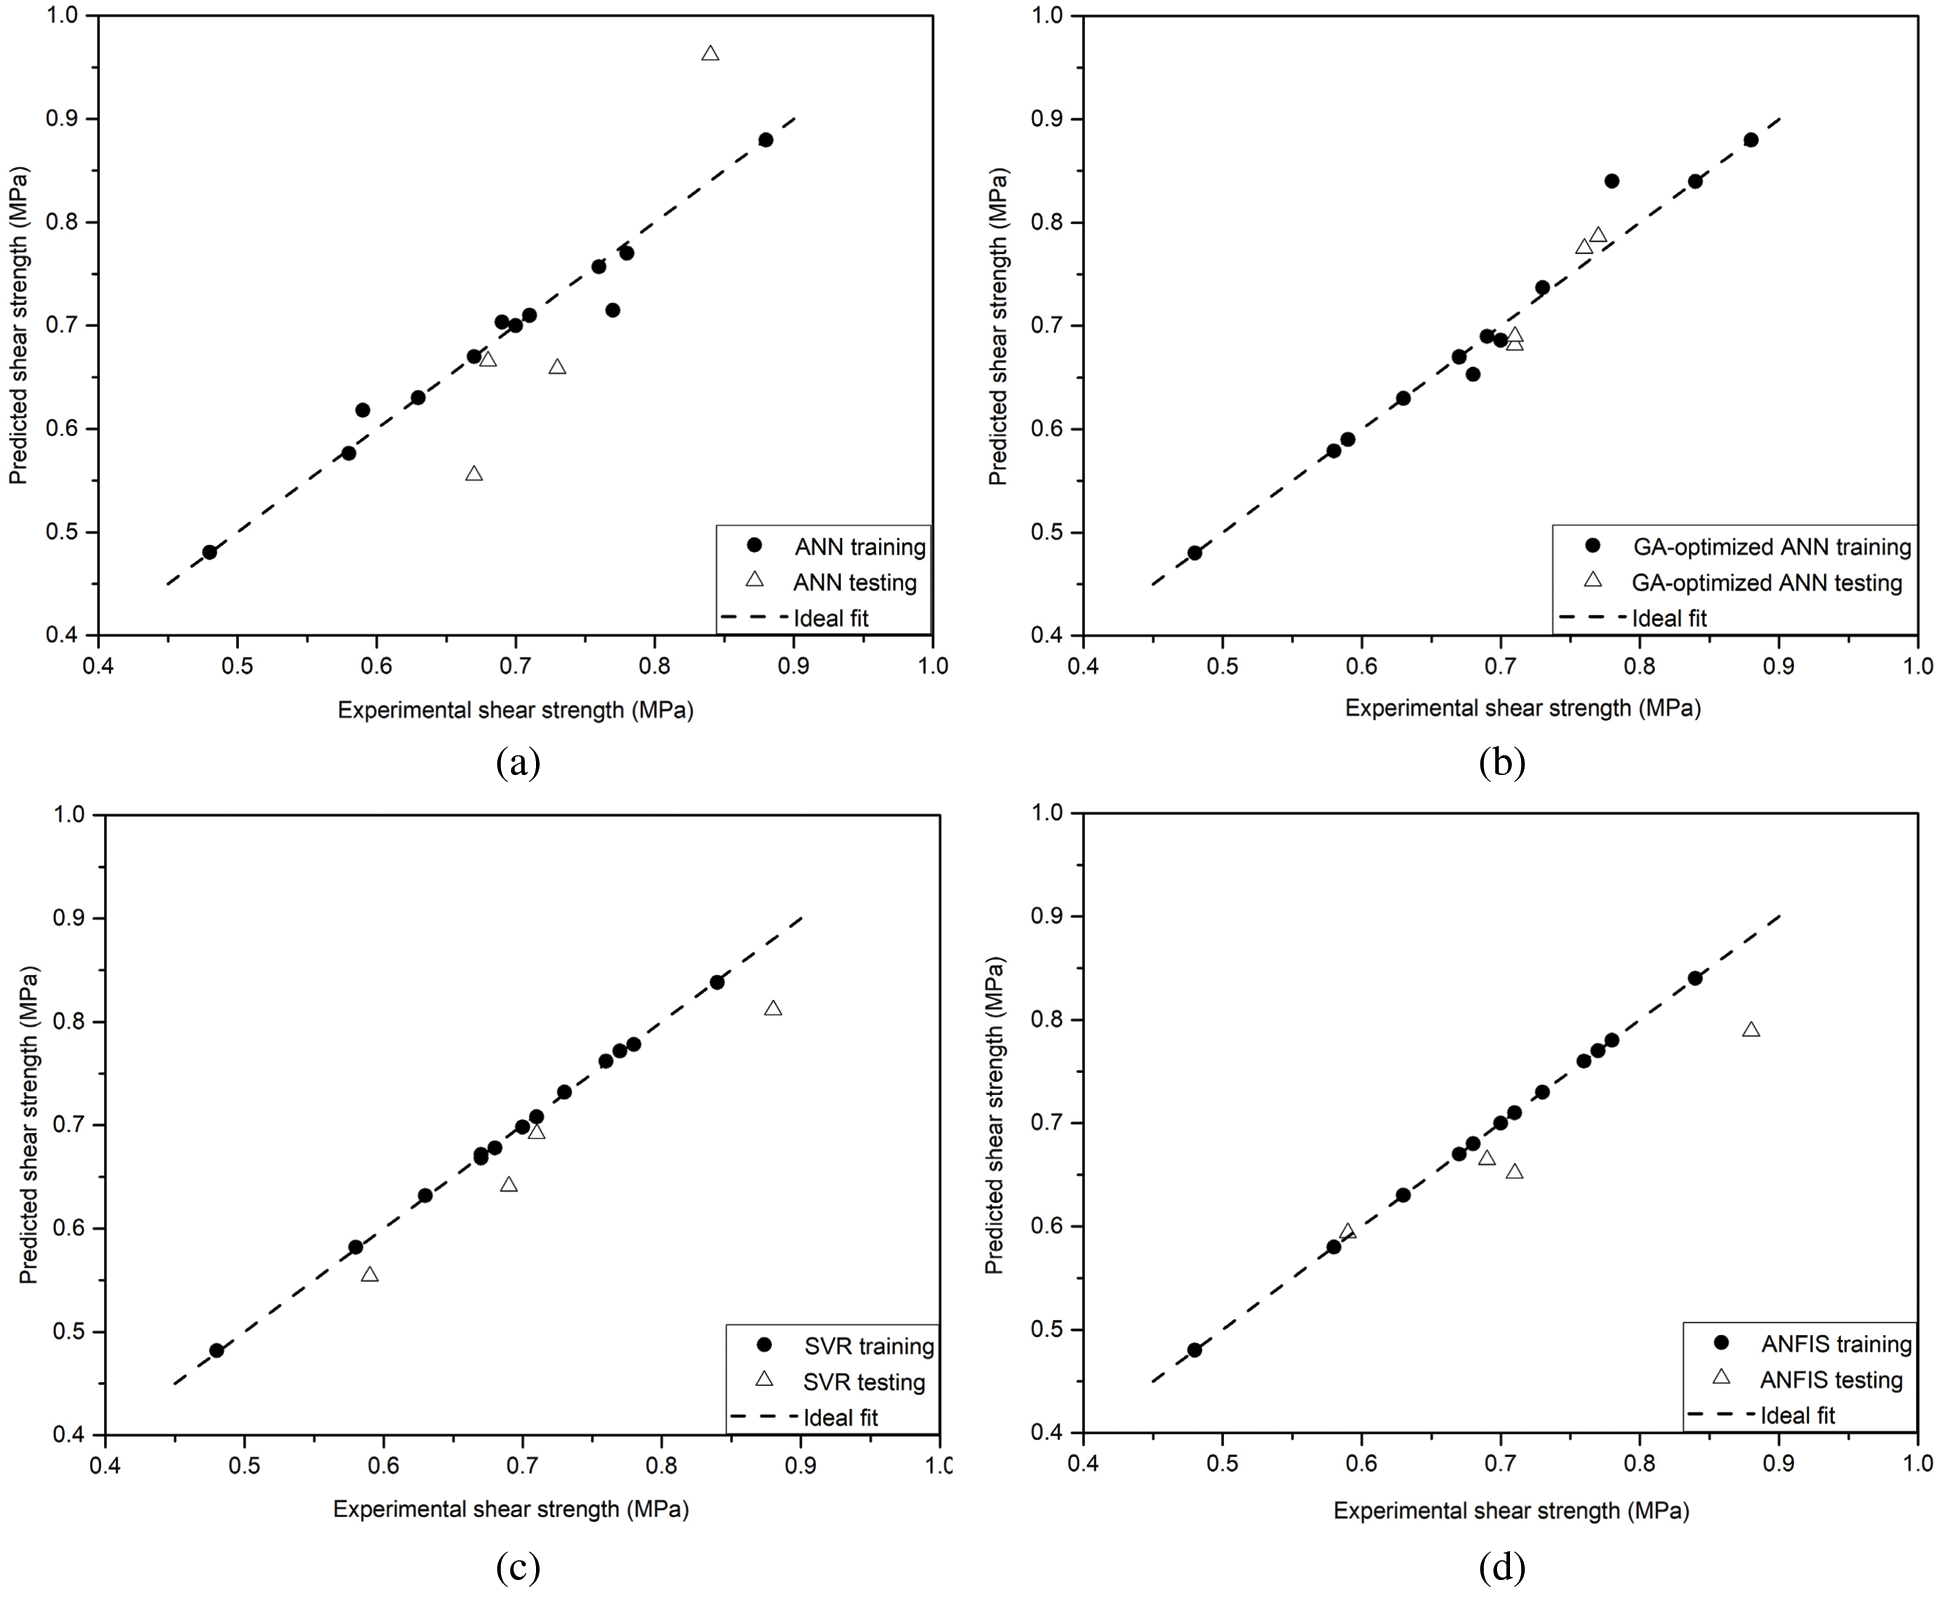
Figure 6: Comparison of actual and predicted results for shear strength using (a) ANN, (b) GA-optimized ANN, (c) SVR, and (d) ANFIS
3.7 Numerical Optimization and Sensitivity Analysis of the Process Variables
Though, ANORA adequately predicted the optimization conditions, which falling into local convergence. Therefore, researchers have developed an optimization tool that can be capable of predicting the optimization conditions globally [6]. The optimization of the three process variables investigated to maximize the shear strength of the cassava starch adhesive was performed using the GA tool kit in MATLAB R2018a (MathWorks Inc., Natick, USA).
The pre-trained GA-optimized ANN model was used as the fitness function for the Genetic algorithm program, which was used for the optimization. The objective of the GA optimization algorithm was the maximization of the shear strength. The upper and lower levels of the experimental input variables were used as the constraints of the NSGA-II algorithm. The properties of the GA used in the optimization process were shown in Table 8. In Fig. 7, it was observed that during the selection of the best fitness value almost 88 generation were analyzed by globally genetic algorithm (GA) approach and reached to the maximum shear strength value of 0.90 MPa. The values obtained from the GA optimization were validated by conducting the experiments for repeating 3–5 times with a comparison between reported average values and predicted values. Adhesion tests indicated that the shear strength of 0.92 MPa under the numerical optimal combination (i.e., the starch content of 40% (w/v), NaOH concentration of 6% (w/w), and the reaction temperature of 80°C) was better than that of 0.88 MPa under the orthogonal experimental optimized condition. The relative error between the adhesion test result and numerical optimized value of the shear strength were found as 2.17%. Moreover, a NaOH concentration of 6% (w/w) was considered as the best content in terms of economy. Therefore, the finalized optimized cassava starch adhesives (CSA-OP) was obtained by a combination of GA-optimized ANN and GA.
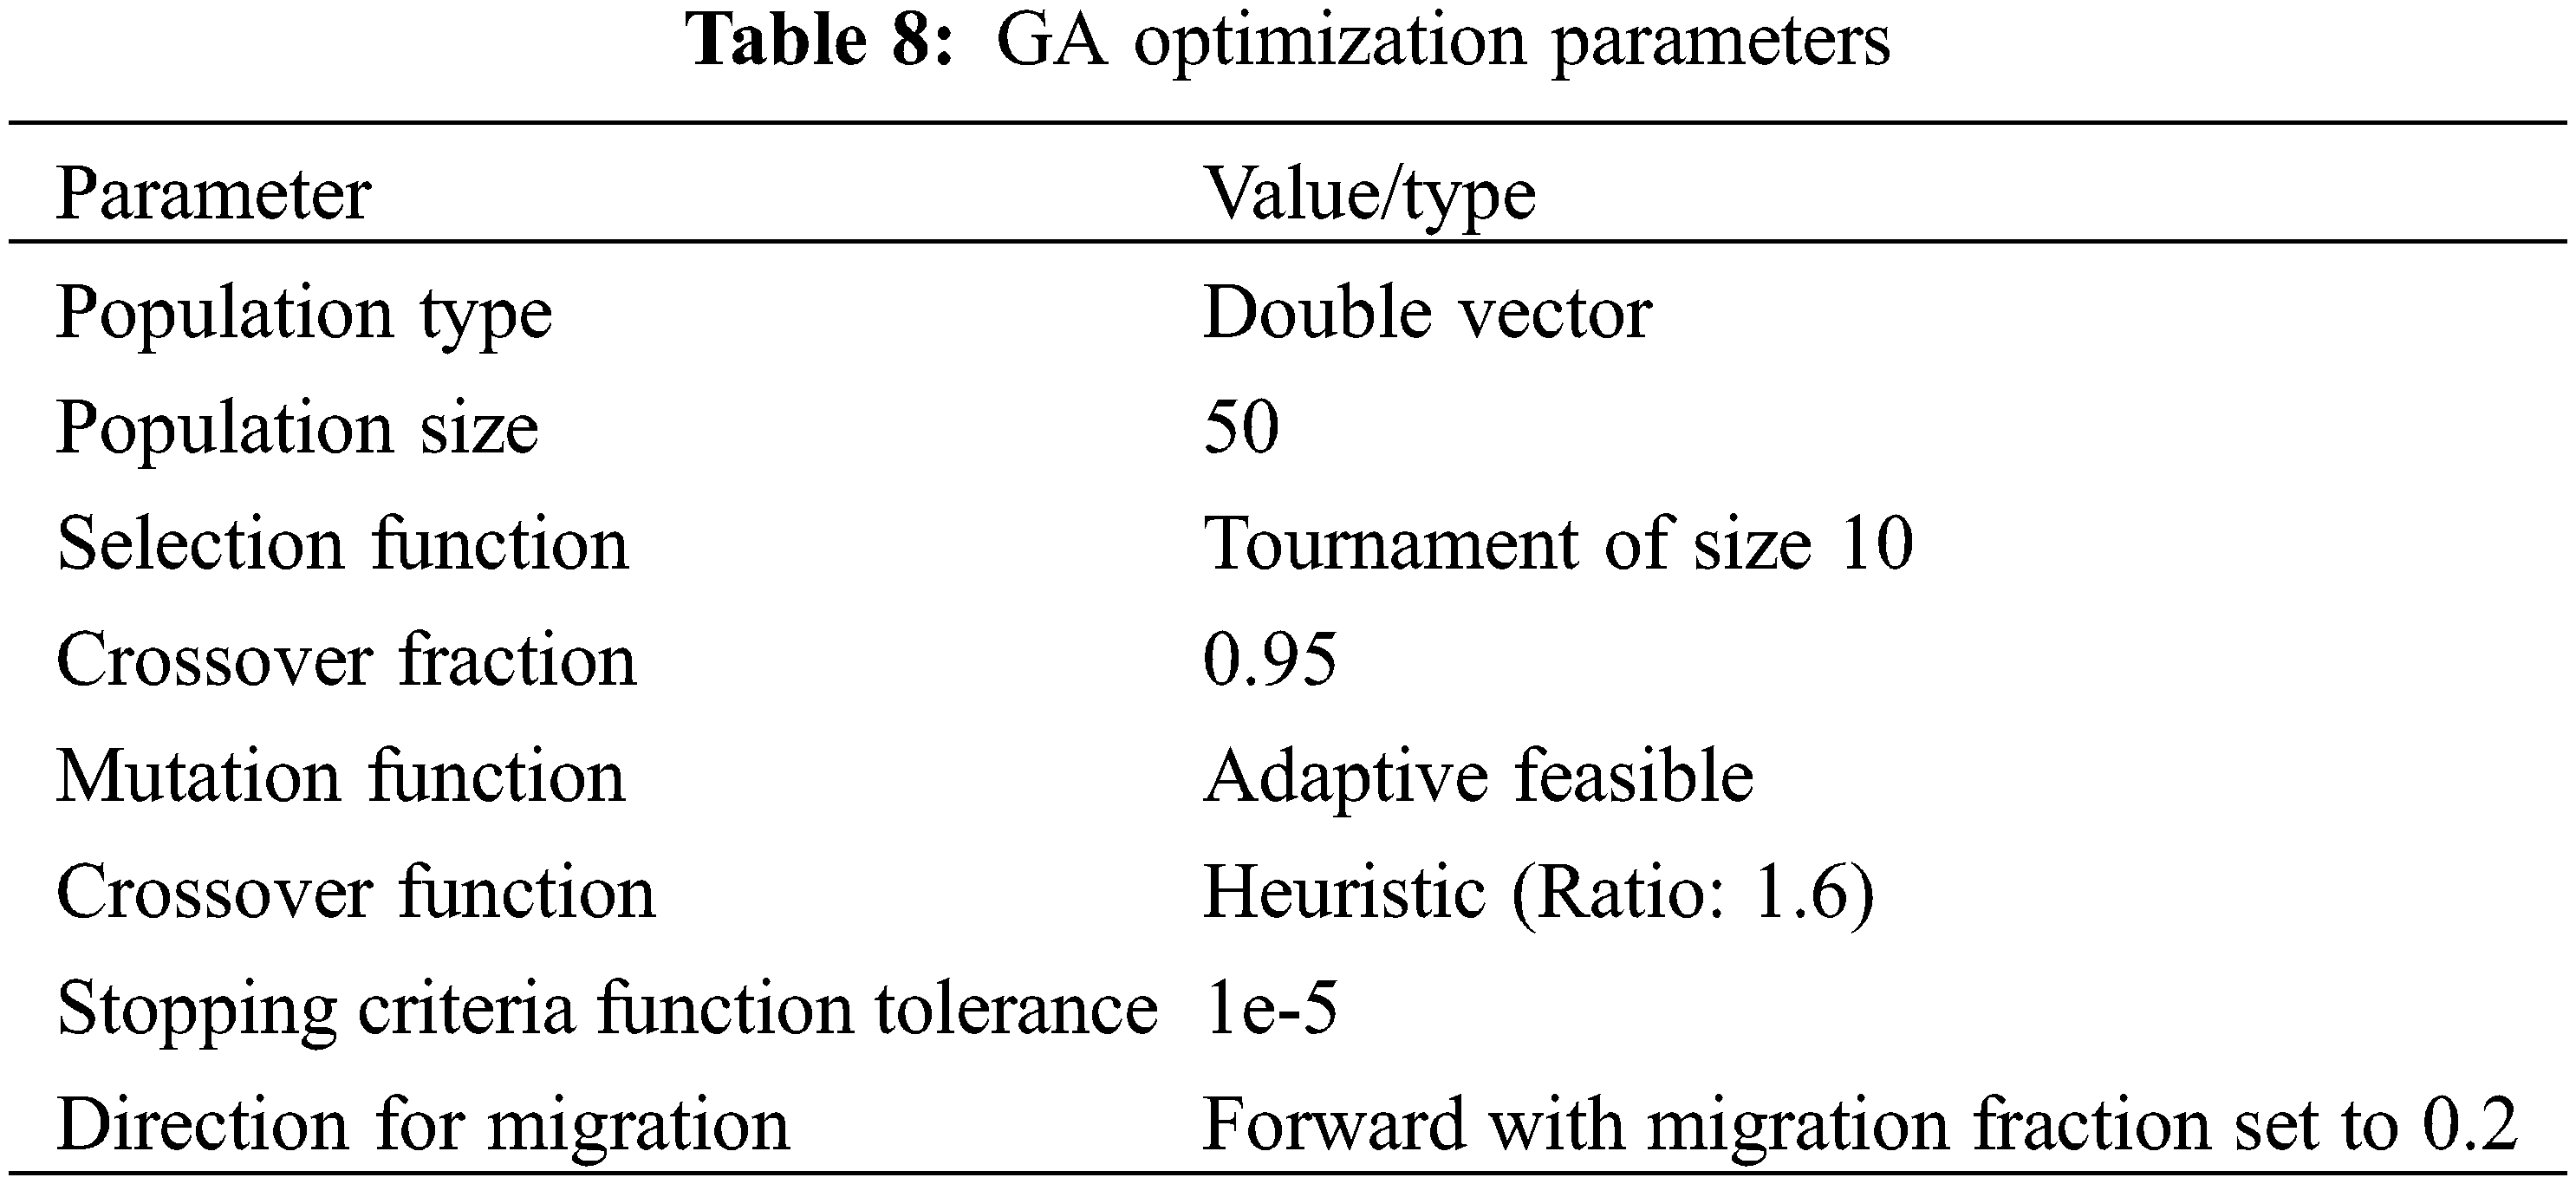
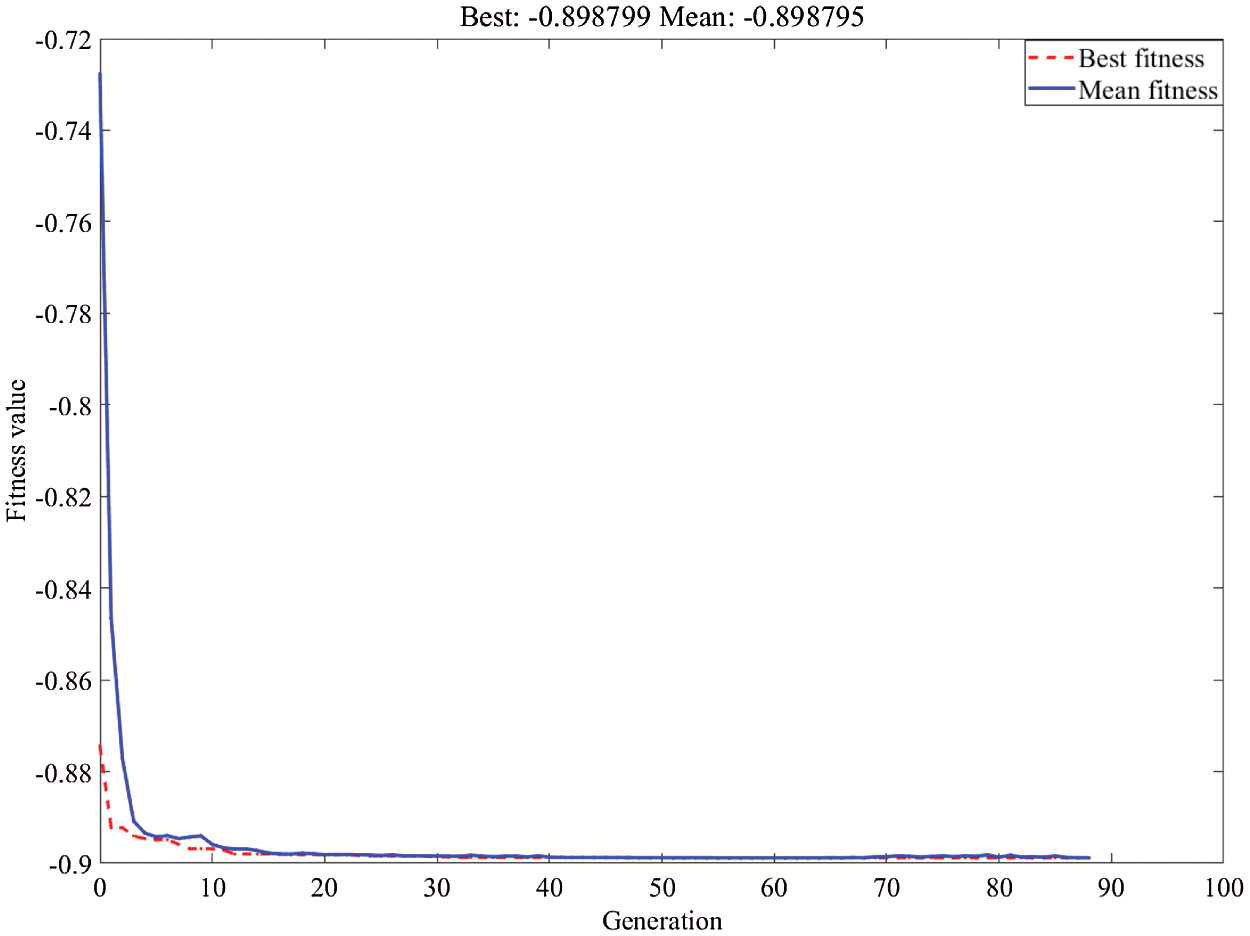
Figure 7: Fitness plot of GA-optimized ANN model coupled genetic algorithm optimization
The sensitivity analysis determined the relative importance of each input variable on the output variation [28]. In this study, sensitivity analysis on the GA-optimized ANN model was using the method proposed by Chakrabarty et al. (Eq. (13)), which was based on neural network weight matrices [40,41]. Considering a well-trained MLP model (m × n × 1), the relative importance of input variables can be calculated as follows [42]:
Step 1. A row vector, M (1 × n), is the interconnection weights between the hidden layer nodes (n nodes) and the output layer nodes.
Step 2. An m × n matrix, W, is the interconnection weights between the input layer nodes (m) and the hidden layer nodes (n).
Step 3. Calculate the row vector, R = MWT, and R = [r1 r2 r3…rm].
Step 4. The relative importance RIi of each input node i (i = 1 to m) was calculated as follows:
The relative importance RI can be used to estimate the comparative significance of each input variable on the shear strength. After conducting the above method presented in Eq. (13), the relative importance (RI) of three variables for the shear strength by GA-optimized ANN was estimated. RI values of 52.54%, 34.91% and 12.55% were obtained for the starch content, NaOH concentration and reaction temperature, respectively. The obtained results were in good agreement with ANOVA results.
3.8 FTIR Analysis of the Cassava Starch and CSA-OP
The infrared spectra of the cassava starch and CSA-OP were shown in Fig. 8. The FTIR spectra of the cassava starch and CSA-OP were very similar, and the intensities of the peaks were apparently decreased for the CSA-OP, which may be due to the amylolysis of the starch [43]. The characteristic peak at about 3400 cm−1 was −O−H stretching vibration of amylose and amylopectin [44]. In this band, the location of the absorption peak changed from 3391 to 3432 cm−1, which may be attributed to the hydrogen bonds dissociation [45]. Furthermore, the absorption peak intensity of cassava starch was higher than that of the CSA-OP. The stronger and wider absorption peak at 3391 cm−1 for cassava starch demonstrated high proportion of amylopectin and hydroxyl groups in cassava starch [46]. The characteristic peak at 2927 cm−1 was caused by the antisymmetric vibration of −CH2 groups [47,48]. The characteristic peak at 1650 cm−1 was due to C−O stretching vibration and the water molecules absorbed in the amorphous region [44–45,47,49]. Moreover, the characteristic peak at 1160 cm−1 was attributed to glucosidic C−O−C vibration, 1080 cm−1 was corresponded to D-glucopyranose and hydroxyl-linked C−O stretching and vibration [50]. The characteristic peaks at around 928 cm−1 and 764 cm−1 were due to glycoside bonds vibrations and C–C stretch [51], respectively. The characteristic peaks at 859 cm−1 and 578 cm−1 represented the alkyl C−H swing vibration of the starch [49].
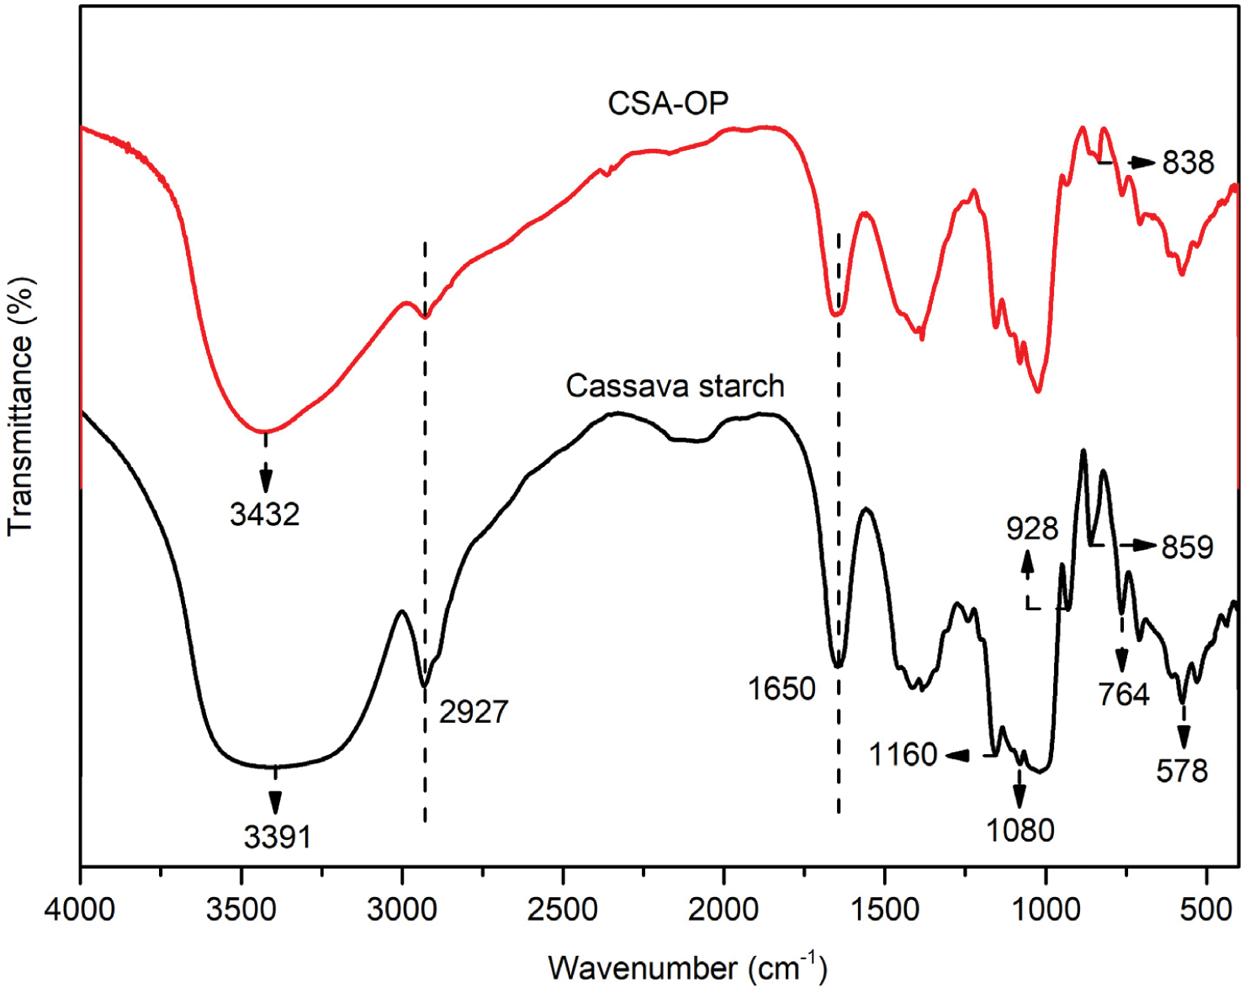
Figure 8: FTIR of the cassava starch and CSA-OP
3.9 TGA Analysis of the Cassava Starch and CSA-OP
The thermal stability of the cassava starch and CSA-OP were evaluated by the thermos-gravimetric analysis (TGA). The thermo-gravimetric (TG) and corresponding differential thermos-gravimetric (DTG) curves were shown in Figs. 9a and 9b, respectively.
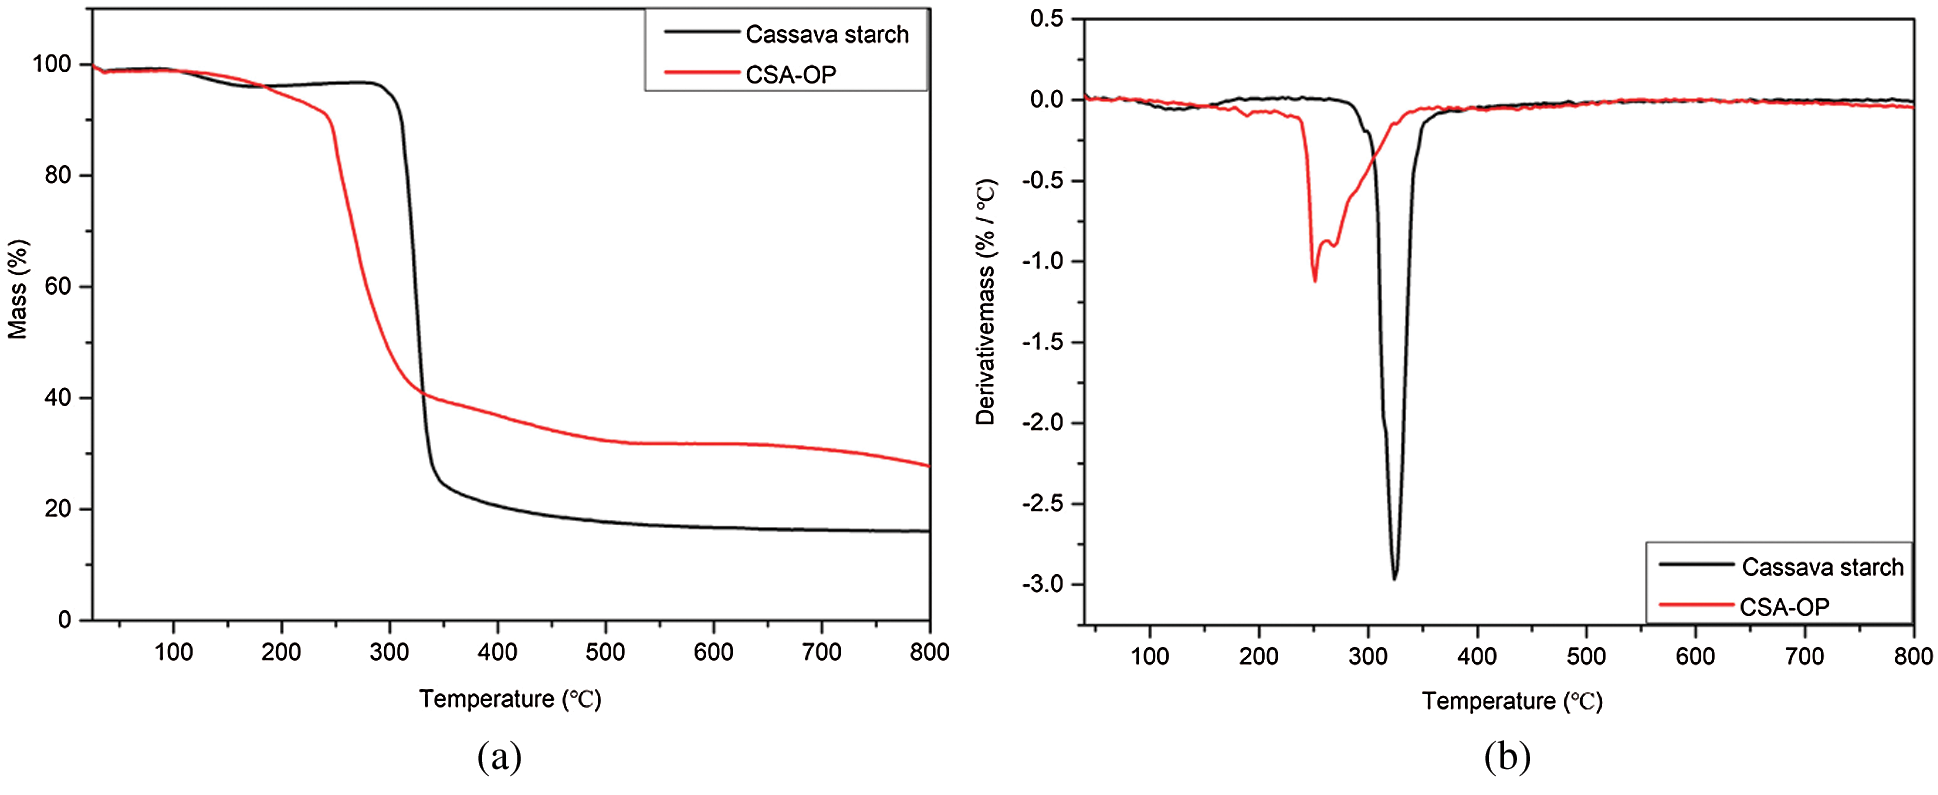
Figure 9: TGA results of the cassava starch and CSA-OP: (a) TG curves; (b) DTG curves
The thermos-gravimetric curves of the cassava starch in Fig. 9a can be separated into three stages at 25∼150°C, 150∼500°C, and 500∼800°C, respectively. The mass loss rate below about 150°C was mainly caused by the evaporation of free water [45–47,49]. The large mass loss rate of the main decomposition stage (150∼500°C) was attributed to the starch thermal decomposition. As shown in Table 9, the residue of cassava starch was lower than that of CSA-OP due to the cassava starch had more hydroxyl groups according to the results of FTIR. During the thermal decomposition, the hydroxyl groups were the source of H2O, H2, CO2, and CH4 gases and so resulting in the reduction of residue for cassava starch [46].
The mass loss of CSA-OP showed three stages. The first stage was 25∼240°C, the second stage was 240∼500°C and the third stage was 500∼800°C. The mass loss rate of the first stage were caused by the evaporation of water and monomers [48]. The second stage between 240°C and 500°C was the main decomposition stage. The mass loss rate with about 240°C and 500°C was due to the dehydration of starch molecular chains and the complete decomposition of adhesive residues [48,52]. The mass loss rate decreased slowly in the third stage.
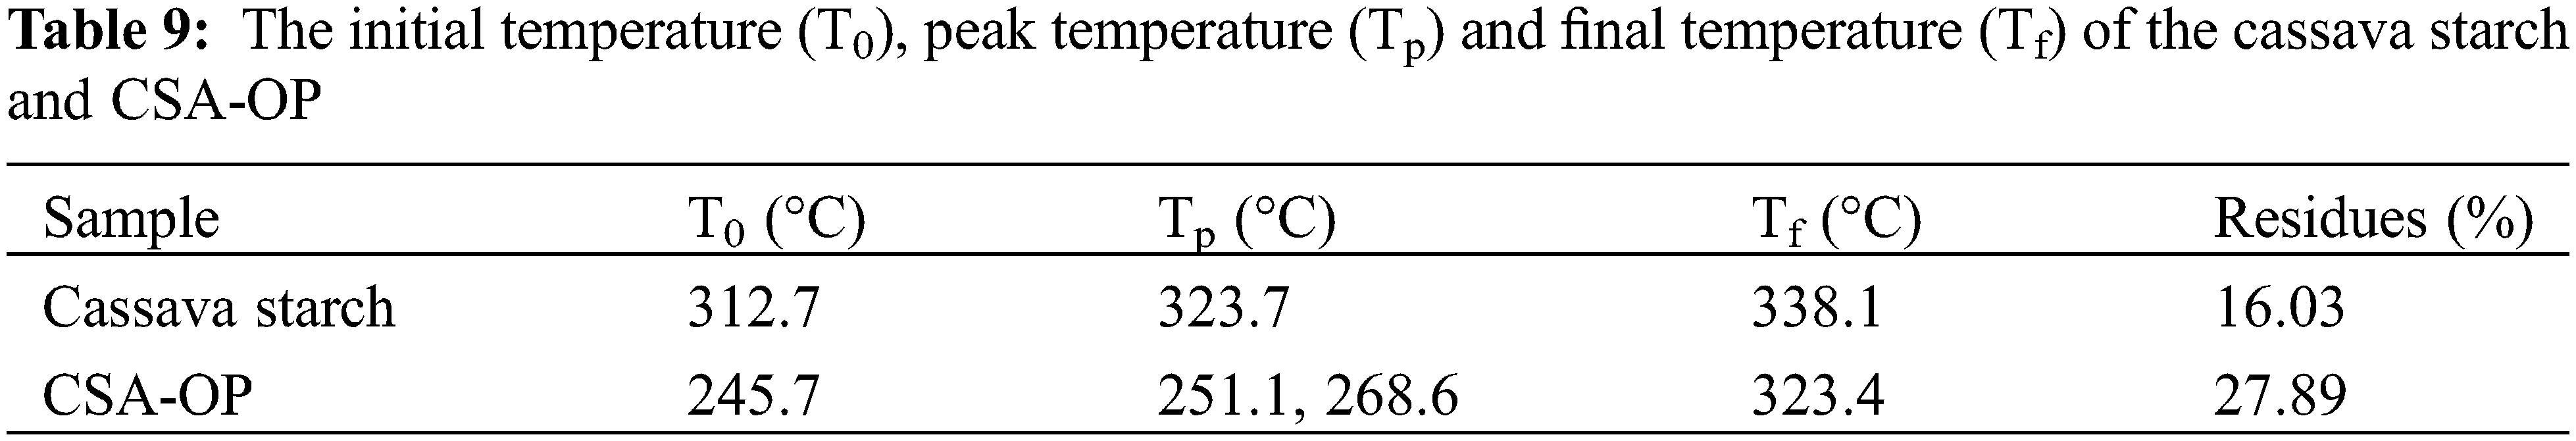
The peak of decomposition temperature (Tp) was the temperature when the weight loss rate attained the maximum value, which can be obtained from the peaks in the DTG curves. There was only one peak in the DTG curve of the cassava starch as shown in Fig. 9b, and the value of Tp was 323.7°C. However, there were two peaks in the DTG curve of CSA-OP.
The initial decomposition temperature (T0) and the peak of decomposition temperature (Tp) of cassava starch were higher than that of CSA-OP as shown in Table 9. The reason of this phenomenon may be that the hydrogen bonds between starch molecules were broken in NaOH solution [43,48], which was consistent with the results of FTIR. As shown in Fig. 9b, the CSA-OP had the lower peak height than that of the cassava starch. Furthermore, the final temperature (Tf) of CSA-OP were close to that of the cassava starch. The reason of this phenomenon may be that the crosslinking reaction inhibited the decomposition of adhesive residues, which can be verified by the improvement of adhesive residues [4,48,53].
3.10 SEM-EDS Analysis of the Cassava Starch and CSA-OP
The SEM images of the cassava starch and CSA-OP were shown in Fig. 10. From the Fig. 10a, it can been seen that the cassava starch granules were regular and spherical. Cassava starch could be easily gelatinized to obtain uniform glues due to the higher amylopectin content [4,46]. As can be seen in Fig. 10b, the surface of the CSA-OP was smooth and compact, indicating that the starch molecules were tightly bonded together and uniform [48].
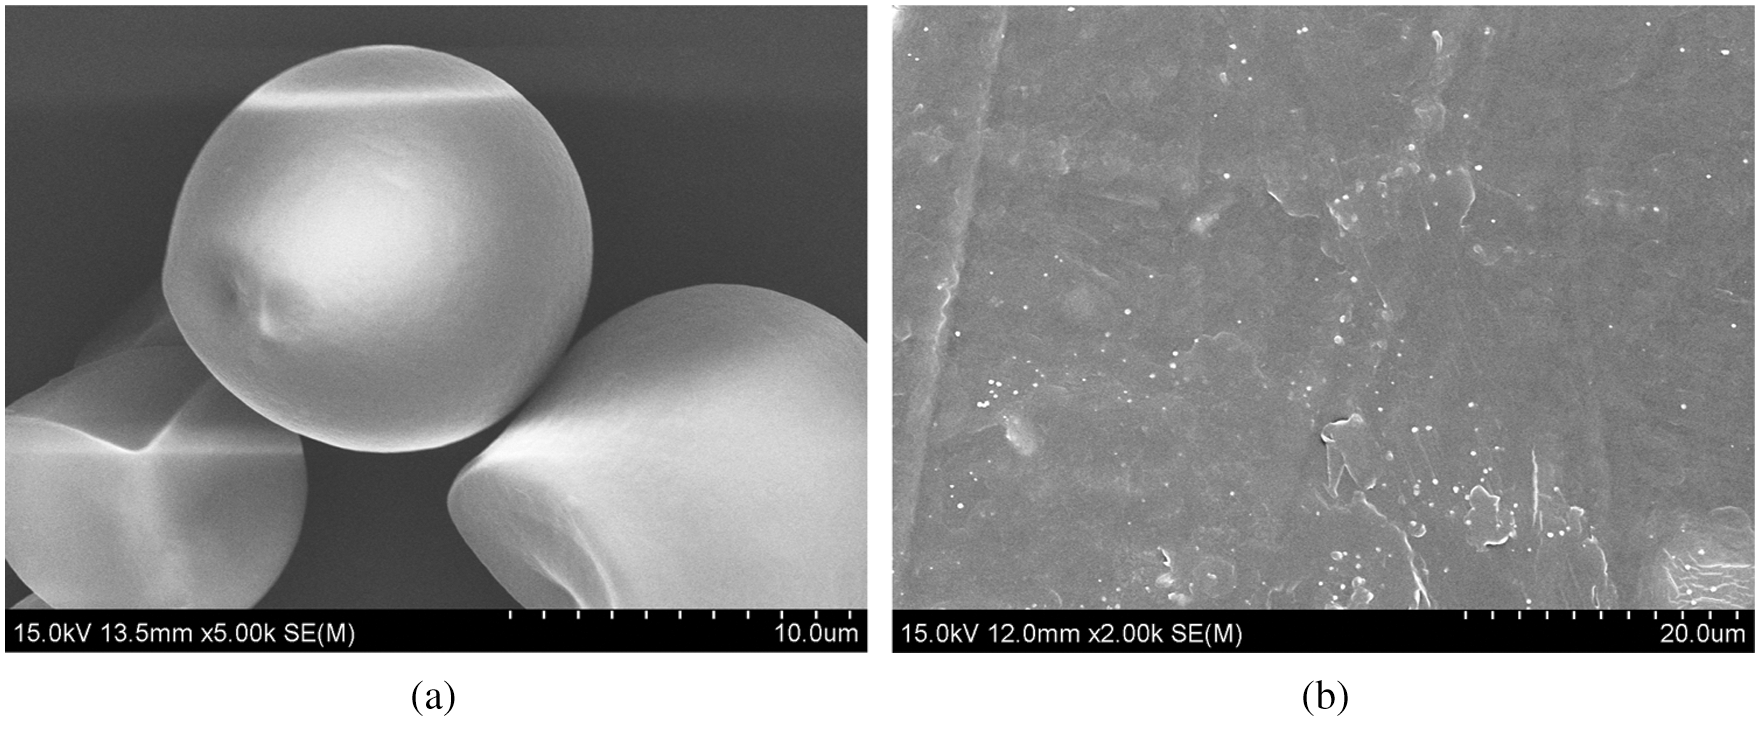
Figure 10: The SEM images of (a) cassava starch and (b) CSA-OP
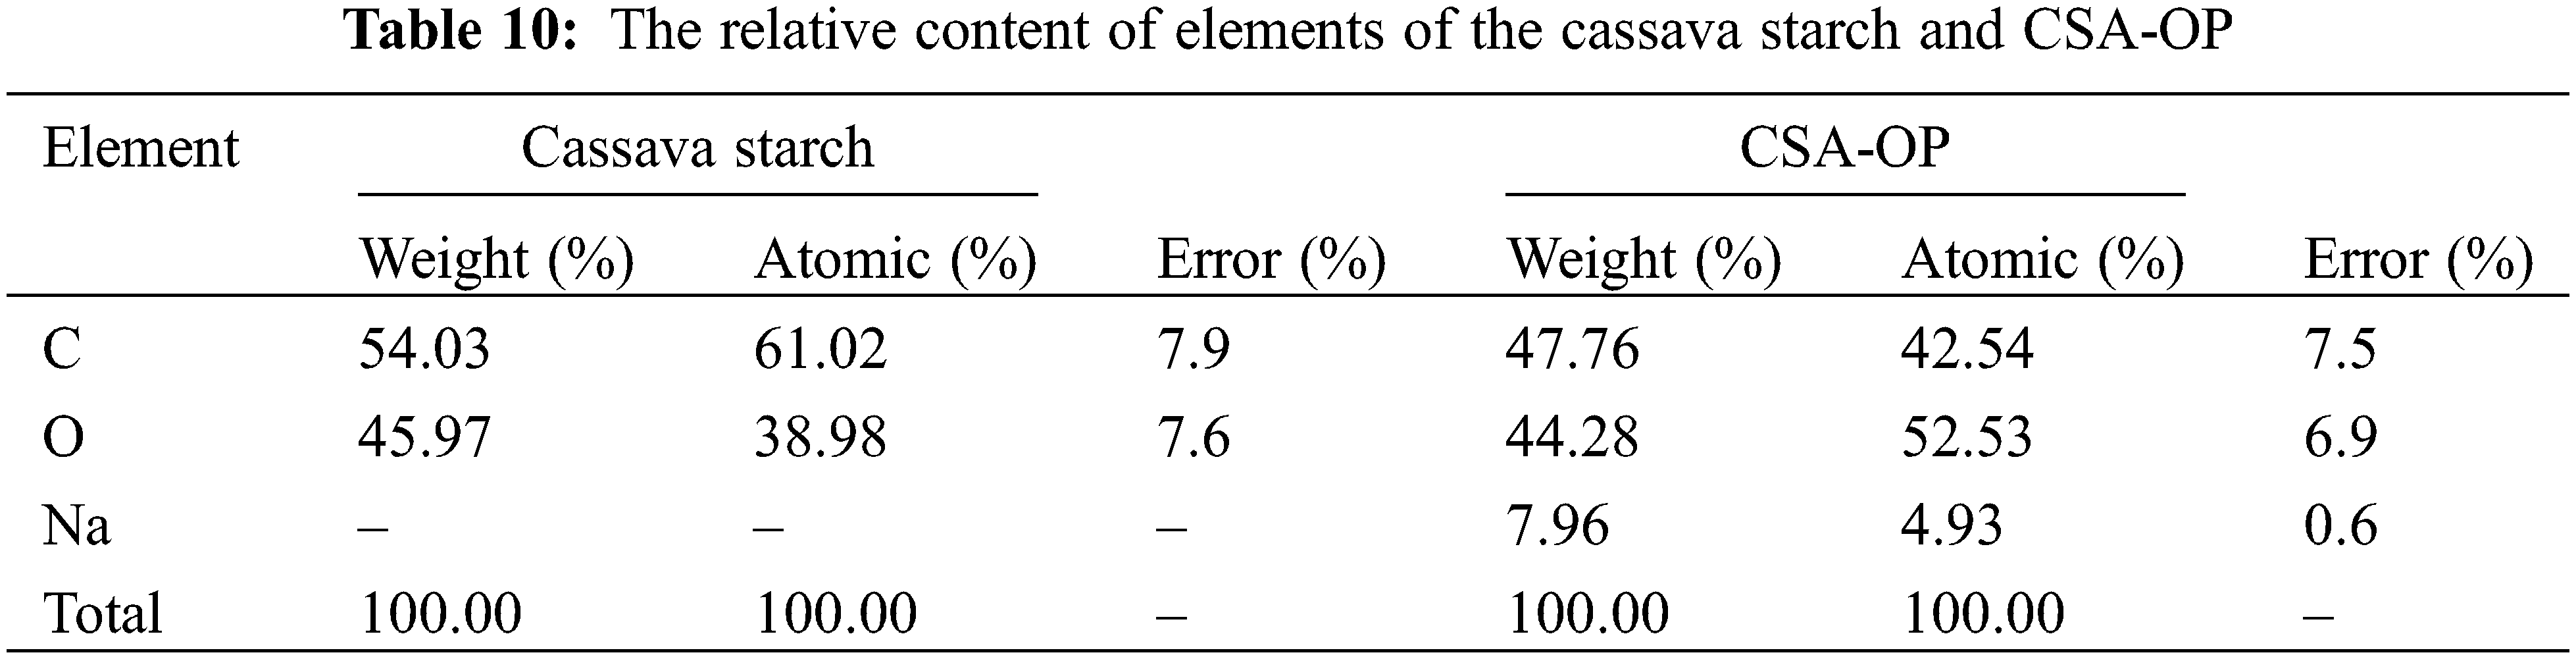
The relative content of major elements of samples from the EDS analysis (Fig. 11) were shown in Table 10. The main components were C and O, which indicated that the cassava starch and CSA-OP mainly contained abundant carbon and oxygen functional groups as shown in FTIR analysis. It was also found that the mass fraction of main components of the cassava starch was relatively higher than that of the CSA-OP, while the content of oxygen atom of the CSA-OP was higher than that of the cassava starch. The reason of this phenomenon may be that the starch molecules were amylolysis in NaOH solution [43], which given rise to an increase in the content of oxygen atom. Besides, the NaOH can react with the hydroxyl groups to weaken the hydrogen bonds, and make the adhesives having appropriate fluidity and adhesion [43].
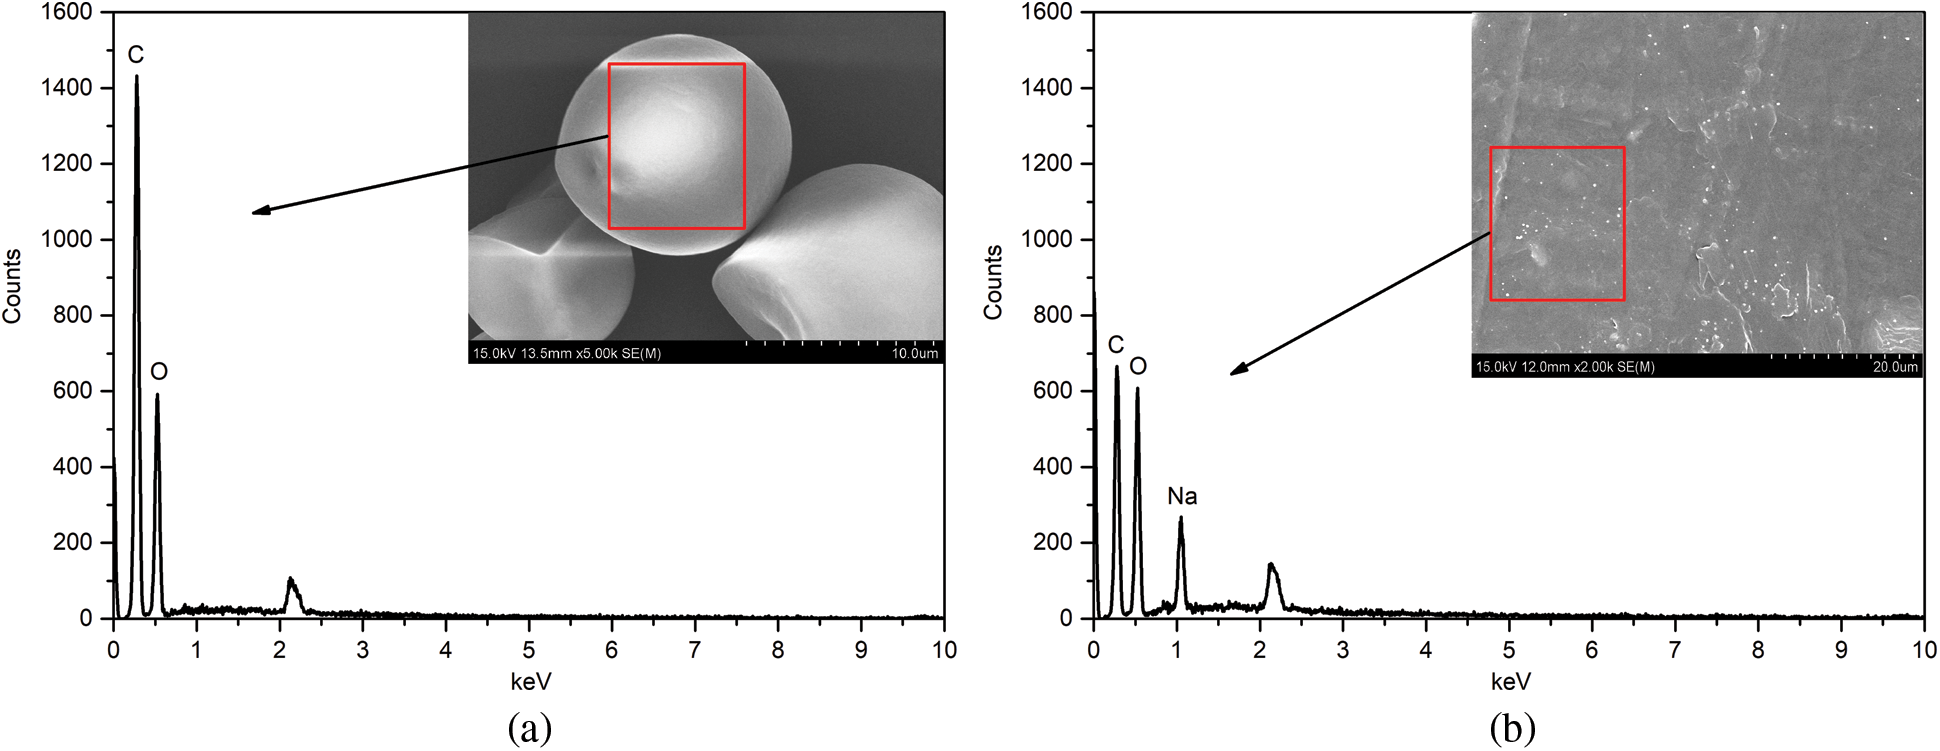
Figure 11: SEM micrograph and EDS plot of (a) the cassava starch, (b) CSA-OP
In this research, four artificial intelligence (AI) models, namely artificial neural network (ANN), artificial neural network optimized by genetic algorithm (GA-optimized ANN), support vector regression (SVR), and adaptive neuro fuzzy inference system (ANFIS) were successfully applied to predict and optimize the shear strength in preparation of the CSA-OP. By means of ANORA and ANOVA based on the orthogonal experiment design, the optimal combination and the degree of influence of three experimental variables were obtained. While the genetic algorithm (GA) integrated with the GA-optimized ANN model was used to optimize the experimental variables, which was better than that of ANORA results based on the orthogonal experimental. In addition, the sensitivity analysis indicated that the starch content had the most significant effect on the shear strength, followed by NaOH concentration and reaction temperature, which was in agreement with ANOVA results. FTIR results showed that the hydroxyl groups of the cassava starch was higher than that of the CSA-OP. TGA results showed that the residue of the CSA-OP was higher than the cassava starch. SEM-EDS results showed that there were abundant carbon and oxygen functional groups in the cassava starch and CSA-OP. In conclusion, the obtained results revealed that the use of AI methods was an adequate approach to model and optimize the experimental variables of the shear strength of cassava starch adhesives though the process of adhesives still needed to be improved.
Funding Statement: This work was supported by the Fundamental Research Funds for the Central Universities (Y0201800586) and the Regional Cooperative Innovation in Autonomous Region (2019E0241).
Conflicts of Interest: The authors declare that they have no conflicts of interest to report regarding the present study.
1. Tratnik, N., Kuo, P., Tanguy, N. R., Gnanasekar, P., Yan, N. (2020). Biobased epoxidized starch wood adhesives: Effect of amylopectin and amylose content on adhesion properties. ACS Sustainable Chemistry & Engineering, 8(49), 17997–18005. DOI 10.1021/acssuschemeng.0c05716. [Google Scholar] [CrossRef]
2. Ortiz-Fernandez, A., Rios-Soberanis, C. R., Chim-Chi, Y. A., Moo-Huchin, V. M., Estrada-Leon, R. J. et al. (2020). Optimization of biodegradable starch adhesives using response surface methodology. Polymer Bulletin, 78(7), 3729–3749. DOI 10.1007/s00289-020-03297-y. [Google Scholar] [CrossRef]
3. Ortiz-Fernandez, A., Carrillo-Sanchez, F. A., May-Hernandez, L. H., Estrada-Leon, R. J., Carrillo-Escalante, H. J. et al. (2017). Design of experiments for optimization a biodegrable adhesive based on ramon starch (Brosimum alicastrum Sw.). International Journal of Adhesion and Adhesives, 73, 28–37. DOI 10.1016/j.ijadhadh.2016.11.004. [Google Scholar] [CrossRef]
4. Zhang, Y., Guo, Z., Chen, X., Ma, Y., Tan, H. (2020). Synthesis of grafting itaconic acid to starch-based wood adhesive for curing at room temperature. Journal of Polymers and the Environment, 29(3), 685–693. DOI 10.1007/s10924-020-01912-7. [Google Scholar] [CrossRef]
5. Olawoye, B., Gbadamosi, S. O., Otemuyiwa, I. O., Akanbi, C. T. (2020). Improving the resistant starch in succinate anhydride-modified cardaba banana starch: A chemometrics approach. Journal of Food Processing and Preservation, 44(9),e14686. DOI 10.1111/jfpp.14686. [Google Scholar] [CrossRef]
6. Srivastava, G., Paul, A. K., Goud, V. V. (2018). Optimization of non-catalytic transesterification of microalgae oil to biodiesel under supercritical methanol condition. Energy Conversion and Management, 156, 269–278. DOI 10.1016/j.enconman.2017.10.093. [Google Scholar] [CrossRef]
7. Sharma, S., Awasthi, R., Sastry, Y. S., Budarapu, P. R. (2021). Physics-informed neural networks for estimating stress transfer mechanics in single lap joints. Journal of Zhejiang University-Science A, 22(8), 621–631. DOI 10.1631/jzus.A2000403. [Google Scholar] [CrossRef]
8. Lyathakula, K. R., Yuan, F. (2021). A probabilistic fatigue life prediction for adhesively bonded joints via ANNs-based hybrid model. International Journal of Fatigue, 151, 106352. DOI 10.1016/j.ijfatigue.2021.106352. [Google Scholar] [CrossRef]
9. Paygozar, B., Banea, M. D., Sadigh, M. A. S., da Silva, L. F. M. (2020). Adhesively bonded aluminium double-strap joints: Effects of patch part on failure load. Journal of the Brazilian Society of Mechanical Sciences and Engineering, 42(11), 589. DOI 10.1007/s40430-020-02679-7. [Google Scholar] [CrossRef]
10. Silva, G. C., Beber, V. C., Pitz, D. B. (2021). Machine learning and finite element analysis: An integrated approach for fatigue lifetime prediction of adhesively bonded joints. Fatigue & Fracture of Engineering Materials & Structures, 44(12), 3334–3348. DOI 10.1111/ffe.13559. [Google Scholar] [CrossRef]
11. Gajewski, J., Golewski, P., Sadowski, T. (2021). The Use of neural networks in the analysis of dual adhesive single Lap joints subjected to uniaxial tensile test. Materials, 14(2), 419. DOI 10.3390/ma14020419. [Google Scholar] [CrossRef]
12. Birecikli, B., Karaman, Ö. A., Çelebi, S. B., Turgut, A. (2020). Failure load prediction of adhesively bonded GFRP composite joints using artificial neural networks. Journal of Mechanical Science and Technology, 34(11), 4631–4640. DOI 10.1007/s12206-020-1021-7. [Google Scholar] [CrossRef]
13. Tosun, E., Çalık, A. (2016). Failure load prediction of single lap adhesive joints using artificial neural networks. Alexandria Engineering Journal, 55(2), 1341–1346. DOI 10.1016/j.aej.2016.04.029. [Google Scholar] [CrossRef]
14. Xu, D., Liu, P. F., Li, J. G., Chen, Z. P. (2019). Damage mode identification of adhesive composite joints under hygrothermal environment using acoustic emission and machine learning. Composite Structures, 211, 351–363. DOI 10.1016/j.compstruct.2018.12.051. [Google Scholar] [CrossRef]
15. Naderpour, H., Mirrashid, M., Nagai, K. (2020). An innovative approach for bond strength modeling in FRP strip-to-concrete joints using adaptive neuro-fuzzy inference system. Engineering with Computers, 36(3), 1083–1100. DOI 10.1007/s00366-019-00751-y. [Google Scholar] [CrossRef]
16. Schubert, M., Kläusler, O. (2019). Applying machine learning to predict the tensile shear strength of bonded beech wood as a function of the composition of polyurethane prepolymers and various pretreatments. Wood Science and Technology, 54(1), 19–29. DOI 10.1007/s00226-019-01144-6. [Google Scholar] [CrossRef]
17. Sindhanai Selvan, S., Saravana Pandian, P., Subathira, A., Saravanan, S. (2018). Artificial neural network modeling-coupled genetic algorithm optimization of supercritical methanol transesterification of aegle marmelos oil to biodiesel. Biofuels, 12(7), 797–805. DOI 10.1080/17597269.2018.1542567. [Google Scholar] [CrossRef]
18. Guo, Y., Feng, Y., Qu, F., Zhang, L., Yan, B. et al. (2020). Prediction of hepatitis E using machine learning models. PLoS One, 15(9), e0237750. DOI 10.1371/journal.pone.0237750. [Google Scholar] [CrossRef]
19. Shah, M. I., Abunama, T., Javed, M. F., Bux, F., Aldrees, A. et al. (2021). Modeling surface water quality using the adaptive neuro-fuzzy inference system aided by input optimization. Sustainability, 13(8), 4576. DOI 10.3390/su13084576. [Google Scholar] [CrossRef]
20. Bui, X. N., Muazu, M. A., Nguyen, H. (2019). Optimizing Levenberg–Marquardt backpropagation technique in predicting factor of safety of slopes after two-dimensional OptumG2 analysis. Engineering with Computers, 36(3), 941–952. DOI 10.1007/s00366-019-00741-0. [Google Scholar] [CrossRef]
21. Valarmathi, T. N., Palanikumar, K., Sekar, S., Latha, B. (2020). Investigation of the effect of process parameters on surface roughness in drilling of particleboard composite panels using adaptive neuro fuzzy inference system. Materials and Manufacturing Processes, 35(4), 469–477. DOI 10.1080/10426914.2020.1711931. [Google Scholar] [CrossRef]
22. Zhang, W. Q., Li, A. G., Zhou, M., Gao, R., Yin, Y. F. (2021). Flow characteristics and structural parametric optimisation design of rectangular plenum chambers for HVAC systems. Energy and Buildings, 246, 111112. DOI 10.1016/j.enbuild.2021.111112. [Google Scholar] [CrossRef]
23. Guo, X. Q., Liu, J., Dai, L. M., Huang, L., Wei, A. C. et al. (2021). Orthogonal wear experiment of 13Cr-L80 tubing string in high-yield gas wells and analysis of its influencing factors. Engineering Failure Analysis, 125, 105432. DOI 10.1016/j.engfailanal.2021.105432. [Google Scholar] [CrossRef]
24. Pirmoradi, N., Ghaneian, M. T., Ehrampoush, M. H., Salmani, M. H., Hatami, B. (2021). The conversion of poultry slaughterhouse wastewater sludge into biodiesel: Process modeling and optimization. Renewable Energy, 178, 1236–1249. DOI 10.1016/j.renene.2021.07.016. [Google Scholar] [CrossRef]
25. Yilbaşi, Z., Yesilyurt, M. K., Arslan, M. (2021). The production of methyl ester from industrial grade hemp (Cannabis sativa L.) seed oil: A perspective of Turkey—The optimization study using the taguchi method. Biomass Conversion and Biorefinery, 11, 1–21. DOI 10.1007/s13399-021-01751-z. [Google Scholar] [CrossRef]
26. Wang, J. Z., Du, C. F., Wang, Y. (2021). Study on the influence of ventilation parameters on the airflow temperature in excavation roadway and ventilation duct. Case Studies in Thermal Engineering, 28, 101387. DOI 10.1016/j.csite.2021.101387. [Google Scholar] [CrossRef]
27. Zhao, P., Zhang, J., Dong, Z., Huang, J., Zhou, H. et al. (2020). Intelligent injection molding on sensing, optimization, and control. Advances in Polymer Technology, 2020, 1–22. DOI 10.1155/2020/7023616. [Google Scholar] [CrossRef]
28. de Luna, M. D. G., Sablas, M. M., Hung, C. M., Chen, C. W., Garcia-Segura, S. et al. (2020). Modeling and optimization of imidacloprid degradation by catalytic percarbonate oxidation using artificial neural network and Box-Behnken experimental design. Chemosphere, 251, 126254. DOI 10.1016/j.chemosphere.2020.126254. [Google Scholar] [CrossRef]
29. Li, X., Dong, S., Mohamed, H. S., Al Aqel, G., Pirhadi, N. (2020). Prediction of tubular T/Y-joint SIF by GA-BP neural network. KSCE Journal of Civil Engineering, 24(9), 2706–2715. DOI 10.1007/s12205-020-1200-1. [Google Scholar] [CrossRef]
30. Han, J. X., Ma, M. Y., Wang, K. (2021). Product modeling design based on genetic algorithm and BP neural network. Neural Computing & Applications, 33(9), 4111–4117. DOI 10.1007/s00521-020-05604-0. [Google Scholar] [CrossRef]
31. Liu, J., Kang, X., Luan, X., Gao, L., Tian, H. et al. (2020). Performance and membrane fouling behaviors analysis with SVR-LibSVM model in a submerged anaerobic membrane bioreactor treating low-strength domestic sewage. Environmental Technology & Innovation, 19, 100844. DOI 10.1016/j.eti.2020.100844. [Google Scholar] [CrossRef]
32. Chang, C. C., Lin, C. J. (2011). LIBSVM: A library for support vector machines. ACM Transactions on Intelligent Systems and Technology, 2(3), 1–27. DOI 10.1145/1961189.1961199. [Google Scholar] [CrossRef]
33. Yeganefar, A., Niknam, S. A., Asadi, R. (2019). The use of support vector machine, neural network, and regression analysis to predict and optimize surface roughness and cutting forces in milling. The International Journal of Advanced Manufacturing Technology, 105(1–4), 951–965. DOI 10.1007/s00170-019-04227-7. [Google Scholar] [CrossRef]
34. Yan, Y. (2010). Application of support vector regression in regional logistics requirement forecasting. 3rd IEEE International Conference on Computer Science and Information Technology, 2, 321–324. Chengdu, China. [Google Scholar]
35. Xiong, B., Zhao, X. P., Hu, Y. F., Huang, H. Y., Liu, Y. et al. (2021). Machine learning assisted empirical formula augmentation. Materials & Design, 210, 110037. DOI 10.1016/j.matdes.2021.110037. [Google Scholar] [CrossRef]
36. Najafi, B., Faizollahzadeh Ardabili, S., Shamshirband, S., Chau, K., Rabczuk, T. (2018). Application of ANNs, ANFIS and RSM to estimating and optimizing the parameters that affect the yield and cost of biodiesel production. Engineering Applications of Computational Fluid Mechanics, 12(1), 611–624. DOI 10.1080/19942060.2018.1502688. [Google Scholar] [CrossRef]
37. Emiroğlu, M., Beycioğlu, A., Yildiz, S. (2012). ANFIS and statistical based approach to prediction the peak pressure load of concrete pipes including glass fiber. Expert Systems with Applications, 39(3), 2877–2883. DOI 10.1016/j.eswa.2011.08.149. [Google Scholar] [CrossRef]
38. Jalal, F. E., Xu, Y., Iqbal, M., Javed, M. F., Jamhiri, B. (2021). Predictive modeling of swell-strength of expansive soils using artificial intelligence approaches: ANN. ANFIS and GEP. Journal of Environment Management, 289, 112420. DOI 10.1016/j.jenvman.2021.112420. [Google Scholar] [CrossRef]
39. Mirrashid, M. (2014). Earthquake magnitude prediction by adaptive neuro-fuzzy inference system (ANFIS) based on fuzzy C-means algorithm. Natural Hazards, 74(3), 1577–1593. DOI 10.1007/s11069-014-1264-7. [Google Scholar] [CrossRef]
40. Lacerda, L. S., Junior, P. R., Peruchi, R. S., Chicco, G., Rocha, L. C. S. et al. (2020). Microgeneration of wind energy for micro and small businesses: Application of ANN in sensitivity analysis for stochastic economic feasibility. IEEE Access, 8, 73931–73946. DOI 10.1109/access.2020.2988593. [Google Scholar] [CrossRef]
41. Rotela Junior, P., Fischetti, E., Araújo, V. G., Peruchi, R. S., Aquila, G. et al. (2019). Wind power economic feasibility under uncertainty and the application of ANN in sensitivity analysis. Energies, 12(12), 2281. DOI 10.3390/en12122281. [Google Scholar] [CrossRef]
42. Chakrabarty, S., Boksh, F. I. M. M., Chakraborty, A. (2013). Economic viability of biogas and green self-employment opportunities. Renewable and Sustainable Energy Reviews, 28, 757–766. DOI 10.1016/j.rser.2013.08.002. [Google Scholar] [CrossRef]
43. Chen, F., Guo, Y., Jiang, T., Wang, S., Zheng, F. (2018). Development and mechanism analysis of a highly efficient binder in pelletizing of ilmenite used in electric furnace. Journal of Iron and Steel Research International, 25(12), 1232–1236. DOI 10.1007/s42243-018-0060-0. [Google Scholar] [CrossRef]
44. Rahaman, A., Kumari, A., Zeng, X. A., Adil Farooq, M., Siddique, R. et al. (2021). Ultrasound based modification and structural-functional analysis of corn and cassava starch. Ultrasonics Sonochemistry, 80, 105795. DOI 10.1016/j.ultsonch.2021.105795. [Google Scholar] [CrossRef]
45. Yang, C., Lin, Y., Cheng, F., Zhou, M., Tan, L. et al. (2019). Synthesis and characterization of corn starch phthalate by a semidry method. Starch-Stärke, 71(9–10), 1800315. DOI 10.1002/star.201800315. [Google Scholar] [CrossRef]
46. Chen, X. J., Yao, W. R., Gao, F. F., Zheng, D. Y., Wang, Q. et al. (2021). Physicochemical properties comparative analysis of corn starch and cassava starch, and comparative analysis as adhesive. Journal of Renewable Materials, 9(5), 979–992. DOI 10.32604/jrm.2021.014751. [Google Scholar] [CrossRef]
47. Zuo, Y., He, X., Li, P., Li, W., Wu, Y. (2019). Preparation and characterization of hydrophobically grafted starches by in situ solid phase polymerization. Polymers, 11(1). DOI 10.3390/polym11010072. [Google Scholar] [CrossRef]
48. Xing, J. C., Li, T. T., Yu, Y. X., Chen, C., Chang, J. M. (2018). Development and characterization of a new bio-adhesive for wood using cassava starch and bio-oil. International Journal of Adhesion and Adhesives, 87, 91–97. DOI 10.1016/j.ijadhadh.2018.09.005. [Google Scholar] [CrossRef]
49. Sun, J., Li, L., Cheng, H., Huang, W. (2017). Preparation, characterization and properties of an organic siloxane-modified cassava starch-based wood adhesive. The Journal of Adhesion, 94(4), 278–293. DOI 10.1080/00218464.2016.1268958. [Google Scholar] [CrossRef]
50. Zuo, Y., Gu, J., Yang, L., Qiao, Z., Tan, H. et al. (2013). Synthesis and characterization of maleic anhydride esterified corn starch by the dry method. International Journal of Biological Macromolecules, 62, 241–247. DOI 10.1016/j.ijbiomac.2013.08.032. [Google Scholar] [CrossRef]
51. Dankar, I., Haddarah, A., Omar, F. E. L., Pujola, M., Sepulcre, F. (2018). Characterization of food additive-potato starch complexes by FTIR and X-ray diffraction. Food Chemistry, 260, 7–12. DOI 10.1016/j.foodchem.2018.03.138. [Google Scholar] [CrossRef]
52. Wang, Z. J., Gu, Z. B., Hong, Y., Cheng, L., Li, Z. F. (2011). Bonding strength and water resistance of starch-based wood adhesive improved by silica nanoparticles. Carbohydrate Polymers, 86(1), 72–76. DOI 10.1016/j.carbpol.2011.04.003. [Google Scholar] [CrossRef]
53. Gu, Y., Cheng, L., Gu, Z., Hong, Y., Li, Z. et al. (2019). Preparation, characterization and properties of starch-based adhesive for wood-based panels. International Journal of Biological Macromolecules, 134, 247–254. DOI 10.1016/j.ijbiomac.2019.04.088. [Google Scholar] [CrossRef]
 | This work is licensed under a Creative Commons Attribution 4.0 International License, which permits unrestricted use, distribution, and reproduction in any medium, provided the original work is properly cited. |