| Journal of Renewable Materials |
DOI: 10.32604/jrm.2022.021752
ARTICLE
Utilization of Bitter Orange Seed as a Novel Pectin Source: Compositional and Rheological Characterization
1Department of Sport, Exercise and Nutrition, Atlantic Technological University, ATU Galway City, Galway, H91 T8NW, Ireland
2Department of Food Science and Technology, Tarbiat Modares University, Tehran, 14115-336, Iran
3Department of Food Chemistry and Technology, Teagasc Moorepark Food Research Centre, Fermoy, Co. Cork, P61 C996, Ireland
4Department of Engineering, INSTM RU, University of Rome ‘Niccolò Cusano’, Rome, 00166, Italy
*Corresponding Authors: Mohammad Nejatian. Email: mnejaatian@gmail.com; Farhad Garavand. Email: farhad.garavand@teagasc.ie
Received: 02 February 2022; Accepted: 14 April 2022
Abstract: The seeds from bitter orange, the by-product of juice making units, hold the potential to facilitate novel, easy yet high-quality pectin extraction. To test this hypothesis, orange seed pectin (OSP) was extracted by distilled water and its compositional parameters and rheological behavior were then evaluated. Results showed that galacturonic acid was the major component of OSP (∼425 mg/g) confirming the purity of the extracted pectin, followed by glucose and some minor neutral sugars. The Mw (weight-average molar mass), Rn (number average molar mass), and Rz (z-average molar mass) values for the OSP were 4511.8 kDa, 61 nm, and 61.1 nm, respectively. Rheological measurements showed a shear-thinning behavior for OSP so that the viscosity of the gum decreased by increasing the temperature from 5 to 45°C. The Power-law model fitted as the best rheological model describing the flow behavior of OSP. The strain sweep dynamic rheological measurements confirmed an entangled network structure for OSP and the NaCl addition to the gum dispersion decreased the consistency coefficient from 35.6 to 23.18 Pa.sn, while the flow behavior index remained unchanged. These results demonstrate that the OSP can be used as a new source of pectin, with likely a wide range of applications in the food industry.
Keywords: Biopolymers; waste management; sugar composition; molecular weight; rheological models
Hydrocolloids are water-soluble biopolymers with a wide application in the food industry. They are commonly used to improve the food’s textural properties acting as gelation and viscosity improving agents [1]. Pectin, one of the major hydrocolloids in the food processing industry, is a polysaccharide with 1, 4-galacturonic acid units and some of its carboxyl groups can be substituted with methyl esters or amide groups [2]. It is widely used as an ingredient for providing specific textural and rheological properties to processed food either as a gelling/thickening agent or as an emulsion stabilizer for acidified dairy drinks [3]. The source of pectin, the extraction procedures, the particle size distribution, the patterns of acylation, the degree of esterification (DE), and the nature and position of the neutral sugars play a great impact on the specifications of pectin from various origins [4]. Pectin is considered a valuable by-product of the citrus processing industry so that about 85% of the globally commercial pectin is sourced from citrus waste which can be produced from fresh or processed peels of lemon, grapefruit, and oranges [5].
Disadvantages associated with the pectin extraction from citrus peels include the use of corrosion mineral acid, high temperature and extended extraction time. Together these aspects may affect the pectin quality and moreover damage the equipment. Furthermore, the steps of filtration, discoloration and concentration of pectin solution before alcohol precipitation are associated with both high cost and waste of time [6]. Therefore, new extraction processes, as well as innovative pectin sources, characterized by lower extraction time and production costs, are both economically and technologically appealing [7]. In this regard, the extraction and physicochemical properties of pectin from the heads of sunflowers were studied by Peng et al. [8]. Asgari et al. [9] studied walnut processing waste as a novel source of pectin. Gharibzahedi et al. [10] evaluated the pectin extracted from Fig (Ficus carica L.) skin. Chaliha et al. [11] extracted pectin from Terminalia ferdinandiana, a native Australian fruit. The possibility of using Palmyra Palm (Borassus aethiopum Mart.) fruit was also evaluated by Assoi et al. [12].
It is necessary to understand the rheological properties and to determine the sugar composition of pectin from new sources to evaluate their thickener potential. The flow behavior of hydrocolloids solutions is important to assess the processing parameters, textural properties of formulated foods, design of unit operations and development of product engineering [13,14]. Among the possible pectin sources, the bitter orange (Citrus aurantium) seeds have been proposed as a novel and promising matrix. The bitter orange differs from the orange by several characteristics including the acidic pulp and bitterer albedo [15]. It is commonly used for the production of essential oils in the perfume industry, and in marmalade production. In the Middle East, the juice of the ripened fruit can be used as a salad dressing or as a flavouring [16].
To date, to the best of our knowledge, there is no report on the extraction of pectin from the orange seeds, as well as its compositional and functional properties. Therefore, the main objective of this research was to extract and characterize the sugar composition, molecular weight, and rheological properties of the pectin extracted from bitter orange seeds.
2.1 Materials and Extraction Method
The used bitter orange fruit (Citrus aurantium L.) was collected from trees growing in Mazandaran Province of Iran during October and November 2020 according to the permission and the national guidelines of the Agricultural Research Education and Extension Organization of Iran. Phenotypic identification of the specimen was done by Dr. Saeid Hazrati, the academic member of Shahid Madani University of Tabriz, Iran.
The seeds were collected from bitter oranges during the juice extraction. Seeds were washed with tap water to remove the fruit pulp, completely drained to remove the water excess, soaked in distilled water (pH = 7) in a seed ratio of 6:1 at 70 ± 1°C, and stirred for 30 min (solid/liquid ratio selected on the basis of preliminary tests). Afterwards, the pectin coats were removed from the seeds by passing through a 600 μm sieve and collected in a flask. The extracted solution was mixed with three volumes of 96% v/v ethanol and placed in the fridge (4°C). After 24 h, the flocculated pectin was collected and dried in an oven with circulating air at 30°C. The dehydrated pectin (OSP) was pulverized with a miller, packed, and kept in cool and dry condition prior to the tests.
The standards of monosaccharides (galacturonic acid, glucose, arabinose, galactose, rhamnose, and fucose) and trifluoracetic acid (TFA) with the purity of ≥99% were purchased from Merck (Darmstadt, Germany).
The total ash content and moisture content of dried OSP samples were evaluated using AOAC (Association of Official Agricultural Chemists) standard methods of 938.08 and 925.46, respectively (AOAC, 2016). For the total ash content, 2 g of pectin samples were incinerated in a furnace at 550°C for 24 h and the residues were measured for the total ash content calculation. Moisture content was calculated by drying 2 g of sample in an oven at 105°C overnight. The total protein content of samples was determined using the Kjeldal method with the nitrogen value of 6.25 [17].
In order to hydrolyze the polysaccharides into monosaccharides, the acid hydrolysis method using TFA was used. To do this, 4 g/L of OSP was hydrolyzed using TFA (2 M) for 2 h at 121°C. The monosaccharide composition of hydrolyzed samples was analyzed by high-performance anion-exchange chromatography equipped with a pulsed amperometric detector (DECADE Elite). The separations were carried out in a CarboPac PA1 (4 mm × 250 mm) column (Dionex Corp., Sunnyvale, CA). Samples were passed through a 0.22 μm filter prior to injection into the column. The monosaccharides separation through the column was performed according to the method reported in [18].
2.3 Degree of Esterification (DE)
The titration method proposed by Chaharbaghi et al. [19] was used for the DE determination of the pectin sample. To do this, 100 mg of sample dried powder was added to 2 mL ethanol and dissolved in 20 mL deionized water at 40°C. Afterwards, 5 mL of phenolphthalein reagent was added to the solution and titrated with NaOH (0.1 M). The amount of NaOH used for titration was recorded as Vi. Afterwards, 10 mL of NaOH was added to the solution and mixed for 30 min for complete hydrolysis. 10 mL of HCl (0.1 M) was introduced to the solution and vigorously mixed to completely disappear the pink color. After the addition of phenolphthalein drops, the excessive amount of HCl was titrated with NaOH to obtain a pale pink color and the volume of NaOH was recorded as Vf. The DE of pectin was calculated according to the following equation [20]:
2.4 Determination of Molecular Parameters
Molecular weight averages (Mn, Mw, Mz) of the OSP were determined by using a size exclusion chromatography system (flow rate of 0.4 mL/min with 0.15 M NaNO3 and 0.02% NaN3) and equipped with a TSK G5000 PW column (7.5 mm × 600 mm; Toso Biosep, Montgomeryville, PA, USA) joint to a UV detector (Waters, 2487), multi-angle laser light scattering (HELEOS; Wyatt Technology Corp, Santa Barbara, CA, USA) and a refractive index detector (Waters, 2414) (HPSEC-UV-MALLS-RI). Bovine serum albumin (BSA) was used as a standard for the determination of the volume delays among the US, MALLS, and RI detectors. ASTRA 5.3 software (Wyatt Technology Corp., Santa Barbara, California, USA) was applied for the data acquisition and to calculate Mw, Mn, and Mz.
In order to determine the gum rheological characteristics, OSP dispersions at concentrations 0.1%, 0.3%, 0.5%, 0.7% and 1.0% (w/v) were first prepared by dissolving the required amount of dry powdered gum in distilled water and gently stirred at room temperature for 2 h. The gum dispersions were stored at 5°C overnight to assure that the polysaccharide hydration was complete.
Both steady shear viscosity and oscillatory shear tests were performed by means of Physica MCR 301 rheometer (Anton Paar GmbH, Graz, Austria). A concentric cylinder geometry (radius ratio of 1.035) and a parallel plate geometry (25 mm diameter; 0.5 mm gap) were used for diluted samples and concentrated dispersions, respectively. The temperature was adjusted to 25°C with a Viscotherm VT2 circulating bath and a controlled Peltier system (Anton Paar, GmbH), with an accuracy of ± 0.01°C.
Shear sweeps were conducted at 25°C between 0.001 and 1000 s−1 so as to obtain flow curves. Flow behavior of the dispersions was assessed by fitting the shear rate vs. shear stress values to five usual models, i.e., Newtonian (τ = m
The effect of temperature on the flow properties was investigated by performing shear sweeps for 1% (w/v) OSP dispersion at 5°C, 25°C and 45°C. Also, the temperature dependency of apparent viscosity was evaluated by fitting the Arrhenius model (η = η0
The 1% (w/v) OSP gum dispersion was prepared for oscillatory shear measurements. A strain sweep test was performed over the range of 0.05%–100% at a fixed frequency (1 Hz) to determine the linear viscoelastic region (LVR). Frequency sweep tests were also carried out at a wide range of frequencies (0.01–20 Hz) and a constant strain (<LVR, ∼0.5%) to evaluate the dynamic rheological properties (G′ and G˝).
In addition, the rheological behavior in response to the salt concentration (0.2 M) and type (NaCl and CaCl2) was determined just at a certain gum concentration, i.e., 1.0% (w/v), and temperature of 25°C.
All measurements were performed in triplicate and data were presented as mean ± standard deviation. Microsoft Excel Software (Microsoft Office, Package 2012) was used for plotting the rheological curves.
The physicochemical and molecular parameters of the OSP are presented in Table 1. The results showed that the OSP contained 9.17% moisture, 1.88% ash, 2.14% protein, and 86.8% total carbohydrates, and presented a DE of 79.68%. Plant’s variety and growing conditions, extraction and purification processes are important factors affecting the chemical composition of hydrocolloids [24]. Similar chemical composition was detected for the pectin extracted from sour oranges, presenting the total ash, moisture content, and protein content of 1.89, 8.81, and 1.45, respectively [20].
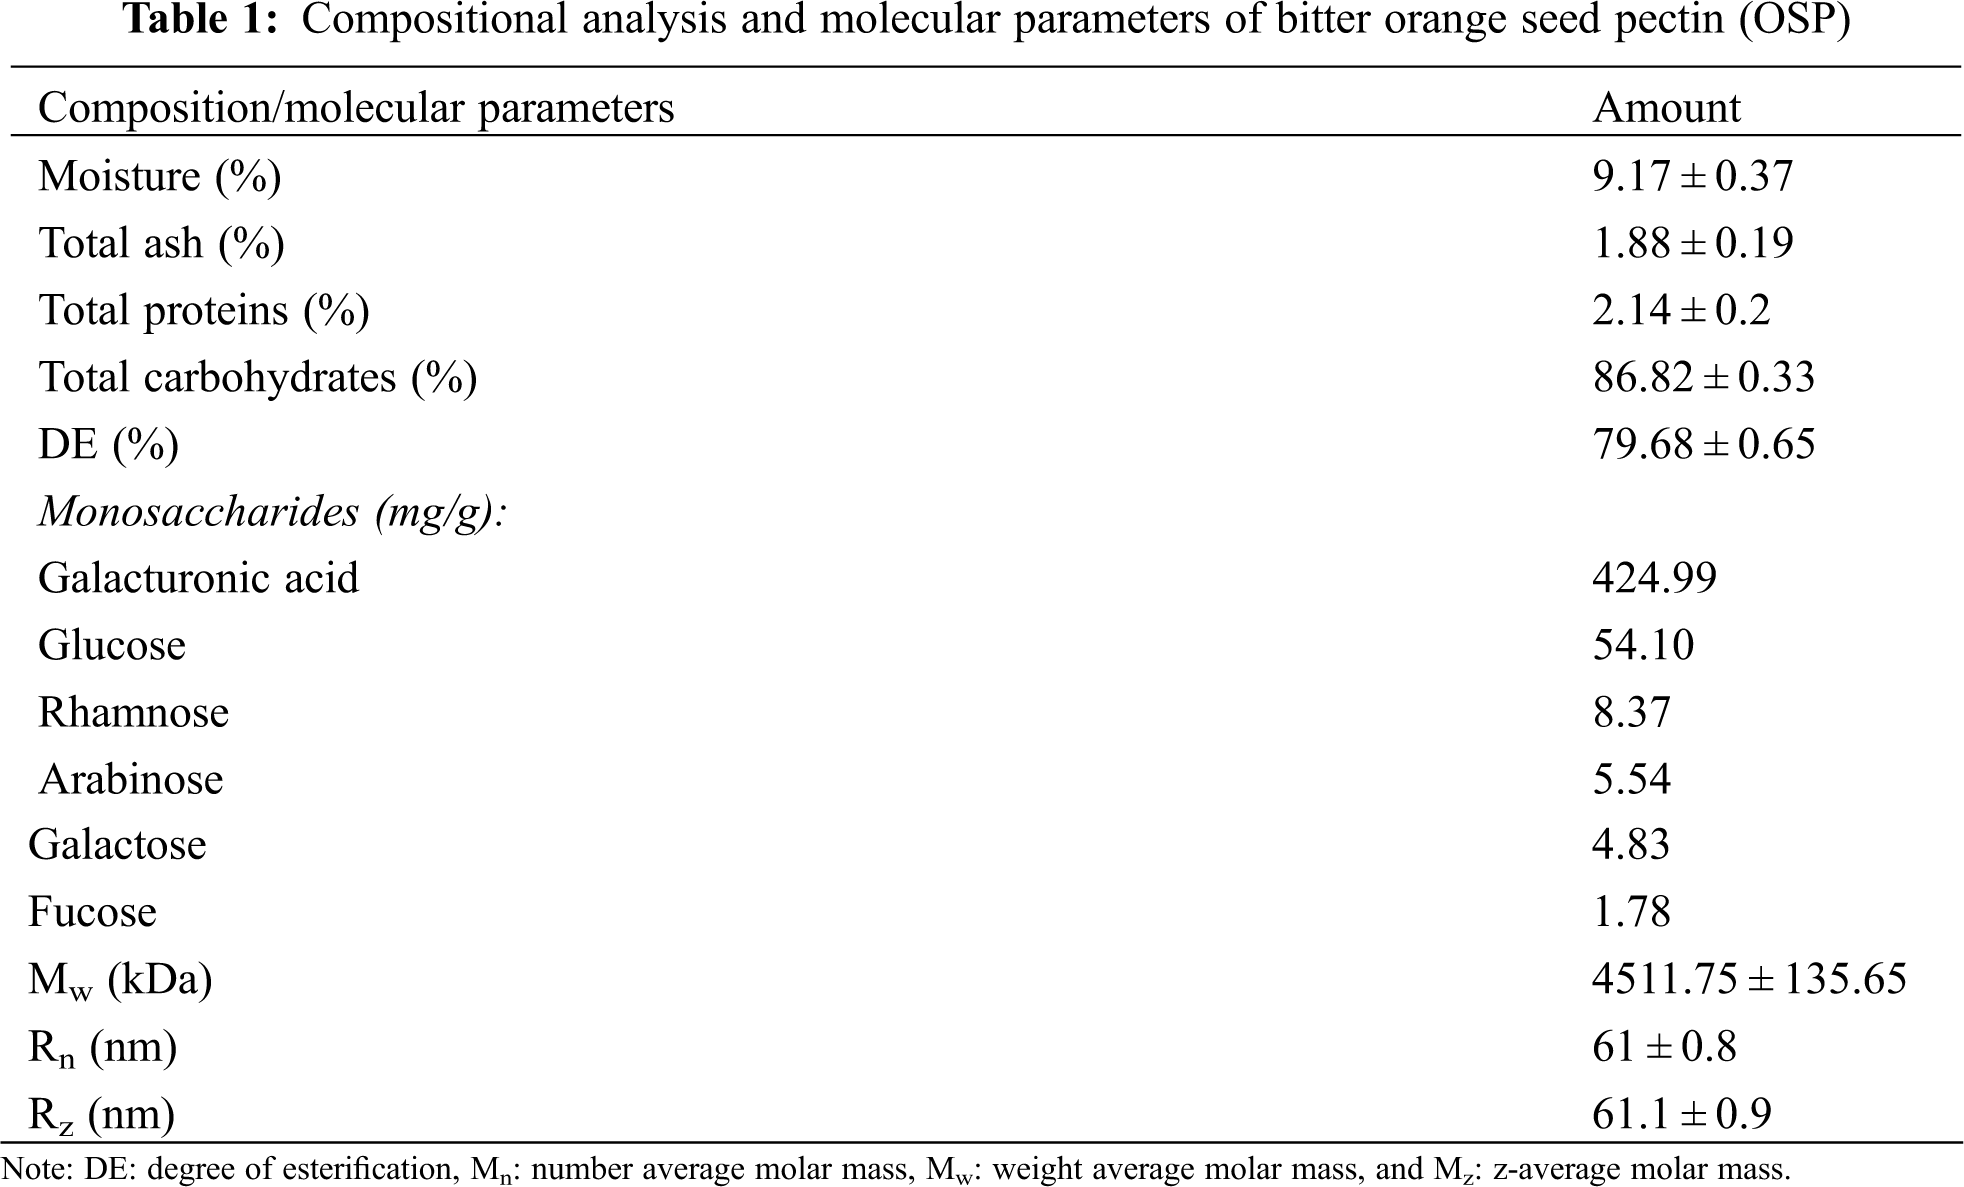
The monosaccharides analysis by high-performance anion-exchange chromatography showed that the galacturonic acid was the major component in OSP (∼425 mg/g, about 85% of sugar composition), followed by glucose (54 mg/g, about 10% of sugar composition). Homogalacturonan is a linear homopolymer made of α-(1–4) bound galacturonic acid residues and it is the major pectic polysaccharide. Galacturonic acid can also present in pectin as rhamnogalacturonan (RG) backbones which is composed of repeating units of [α-(1, 4)-galacturonic acid-α-(1, 2)-rhamnose]. However, the rhamnose units in RG can be substituted with other neutral sugar side chains such as galactosyl-and/or arabinosyl [4]. Similarly, Hosseini et al. [20] observed that galacturonic acid (65.3%) was the main monosaccharide present in the pectin extracted from sour orange peels. The wide diversity of composition in terms of galacturonic acid and glucose indicates that OSP owns a rich pectin content but also some cellulose or starch-like glucans. Comparable sugar composition was previously observed in the commercial low methoxyl pectin [8] and in some pectins from different food waste streams [25]. Minor quantities of fucose, galactose, arabinose, and rhamnose (about 4% of sugar composition) were also identified, justifying the complex polysaccharide composition of OSP [25]. It has been reported that galactose, rhamnose, arabinose, xylose and fucose are the principal neutral sugars found in the pectin side chains [20]. In order to interpret the sugar composition data and better understand the polymeric level of pectin, the ratio between the composition sugars was calculated. The linearity of pectin was calculated by the ratio of the pectic backbone sugar of galacturonic acid to the neutral pectin sugars involved in side-chains (sugar ratio 1). The amount of contribution of rhamnogalacturonan (RG) to the pectin population was calculated by the ratio of rhamnose to the galacturonic acid (sugar ratio 2). The other important ratio to study the branching of rhamnogalacturonan I (RG-I) was calculated by dividing arabinose and galactose to the rhamnose (sugar ratio 3). Sugar ratio analysis showed high linear properties for OSP pectin due to the high sugar ratio 1 (5.68), a rather low RG content in sugar ratio 2 (0.02) and less branched RG-I sugars in sugar ratio 3 (1.24) [2]. Hydrocolloids with higher amounts of fucose, xylose, galacturonic acid, methoxyl groups, and lower amounts of arabinose and nitrogenous fractions usually exhibit high viscosity [26]. Similar observations were also reported by Balaghi et al. [27] who showed that tragacanth gums with a greater quantity of galacturonic acid and fucose exhibited higher consistency coefficients. The monosaccharide composition of pectin is dependent on the extraction condition. High temperature and acidic conditions during commercial extraction of pectin can destroy the branched regions and leave few neutral sugar units attached to the main chain [3].
3.2 Molecular Weight Parameters
The results of molecular weights parameters are presented in Table 1. Mw (weight-average molar mass), Rn (number average molar mass), and Rz (z-average molar mass) values for the OSP were 4511.8 kDa, 61 nm, and 61.1 nm, respectively. The Mw measurement indicates a large Mw for OSP, confirming that such polysaccharides have a tendency to exhibit higher viscous and pseudoplastic properties when dissolved in water [28]. The viscosity of polymers increases with the molecular weight and due to the longer chain of pectin, it will become harder to get them to flow and tangled [3]. Molecular weight and concentration will also influence the thickening properties of hydrocolloids. Molecular weight and concentration will also influence the thickening properties of hydrocolloids. Pectin with a high DE is generally less extended and presents a more coiled structure with a larger hydration dynamic. Moreover, by the increase in DE, the chain stiffness of pectin molecules reduces due to the increase in high molecular weight which increases the chemical resistance of molecule chains for example resistance to heat treatments or the presence of chemicals in the food complex [6,16]. The high molecular weight of OSP is similar to other hydrocolloids such as xanthan (4200 kDa), locust bean gum (50–3000 kDa), basil seed gum (1045–5980 kDa), guar (50–8000 kDa), psyllium (1500 kDa), and Karaya (10,000 kDa) [29–33]. Different studies have shown that the extraction pH may play an effect on the pectin molecular weight: the pectin extracted at higher pH shows higher Mw due to its higher DE value [34,35]. Thus, the use of distilled water (pH = 7) to extract pectin from OSP may explain the high Mw observed for the pectin extracted in this research. Similarly, Gavlighi et al. [36] reported that the Mw value of the pectin extracted from pomegranate peels depended on the extraction conditions, achieving the highest Mw and Rg values for the buffer extracted pectin (18,631.85 × 103 g/mol and 102.80 nm, respectively).
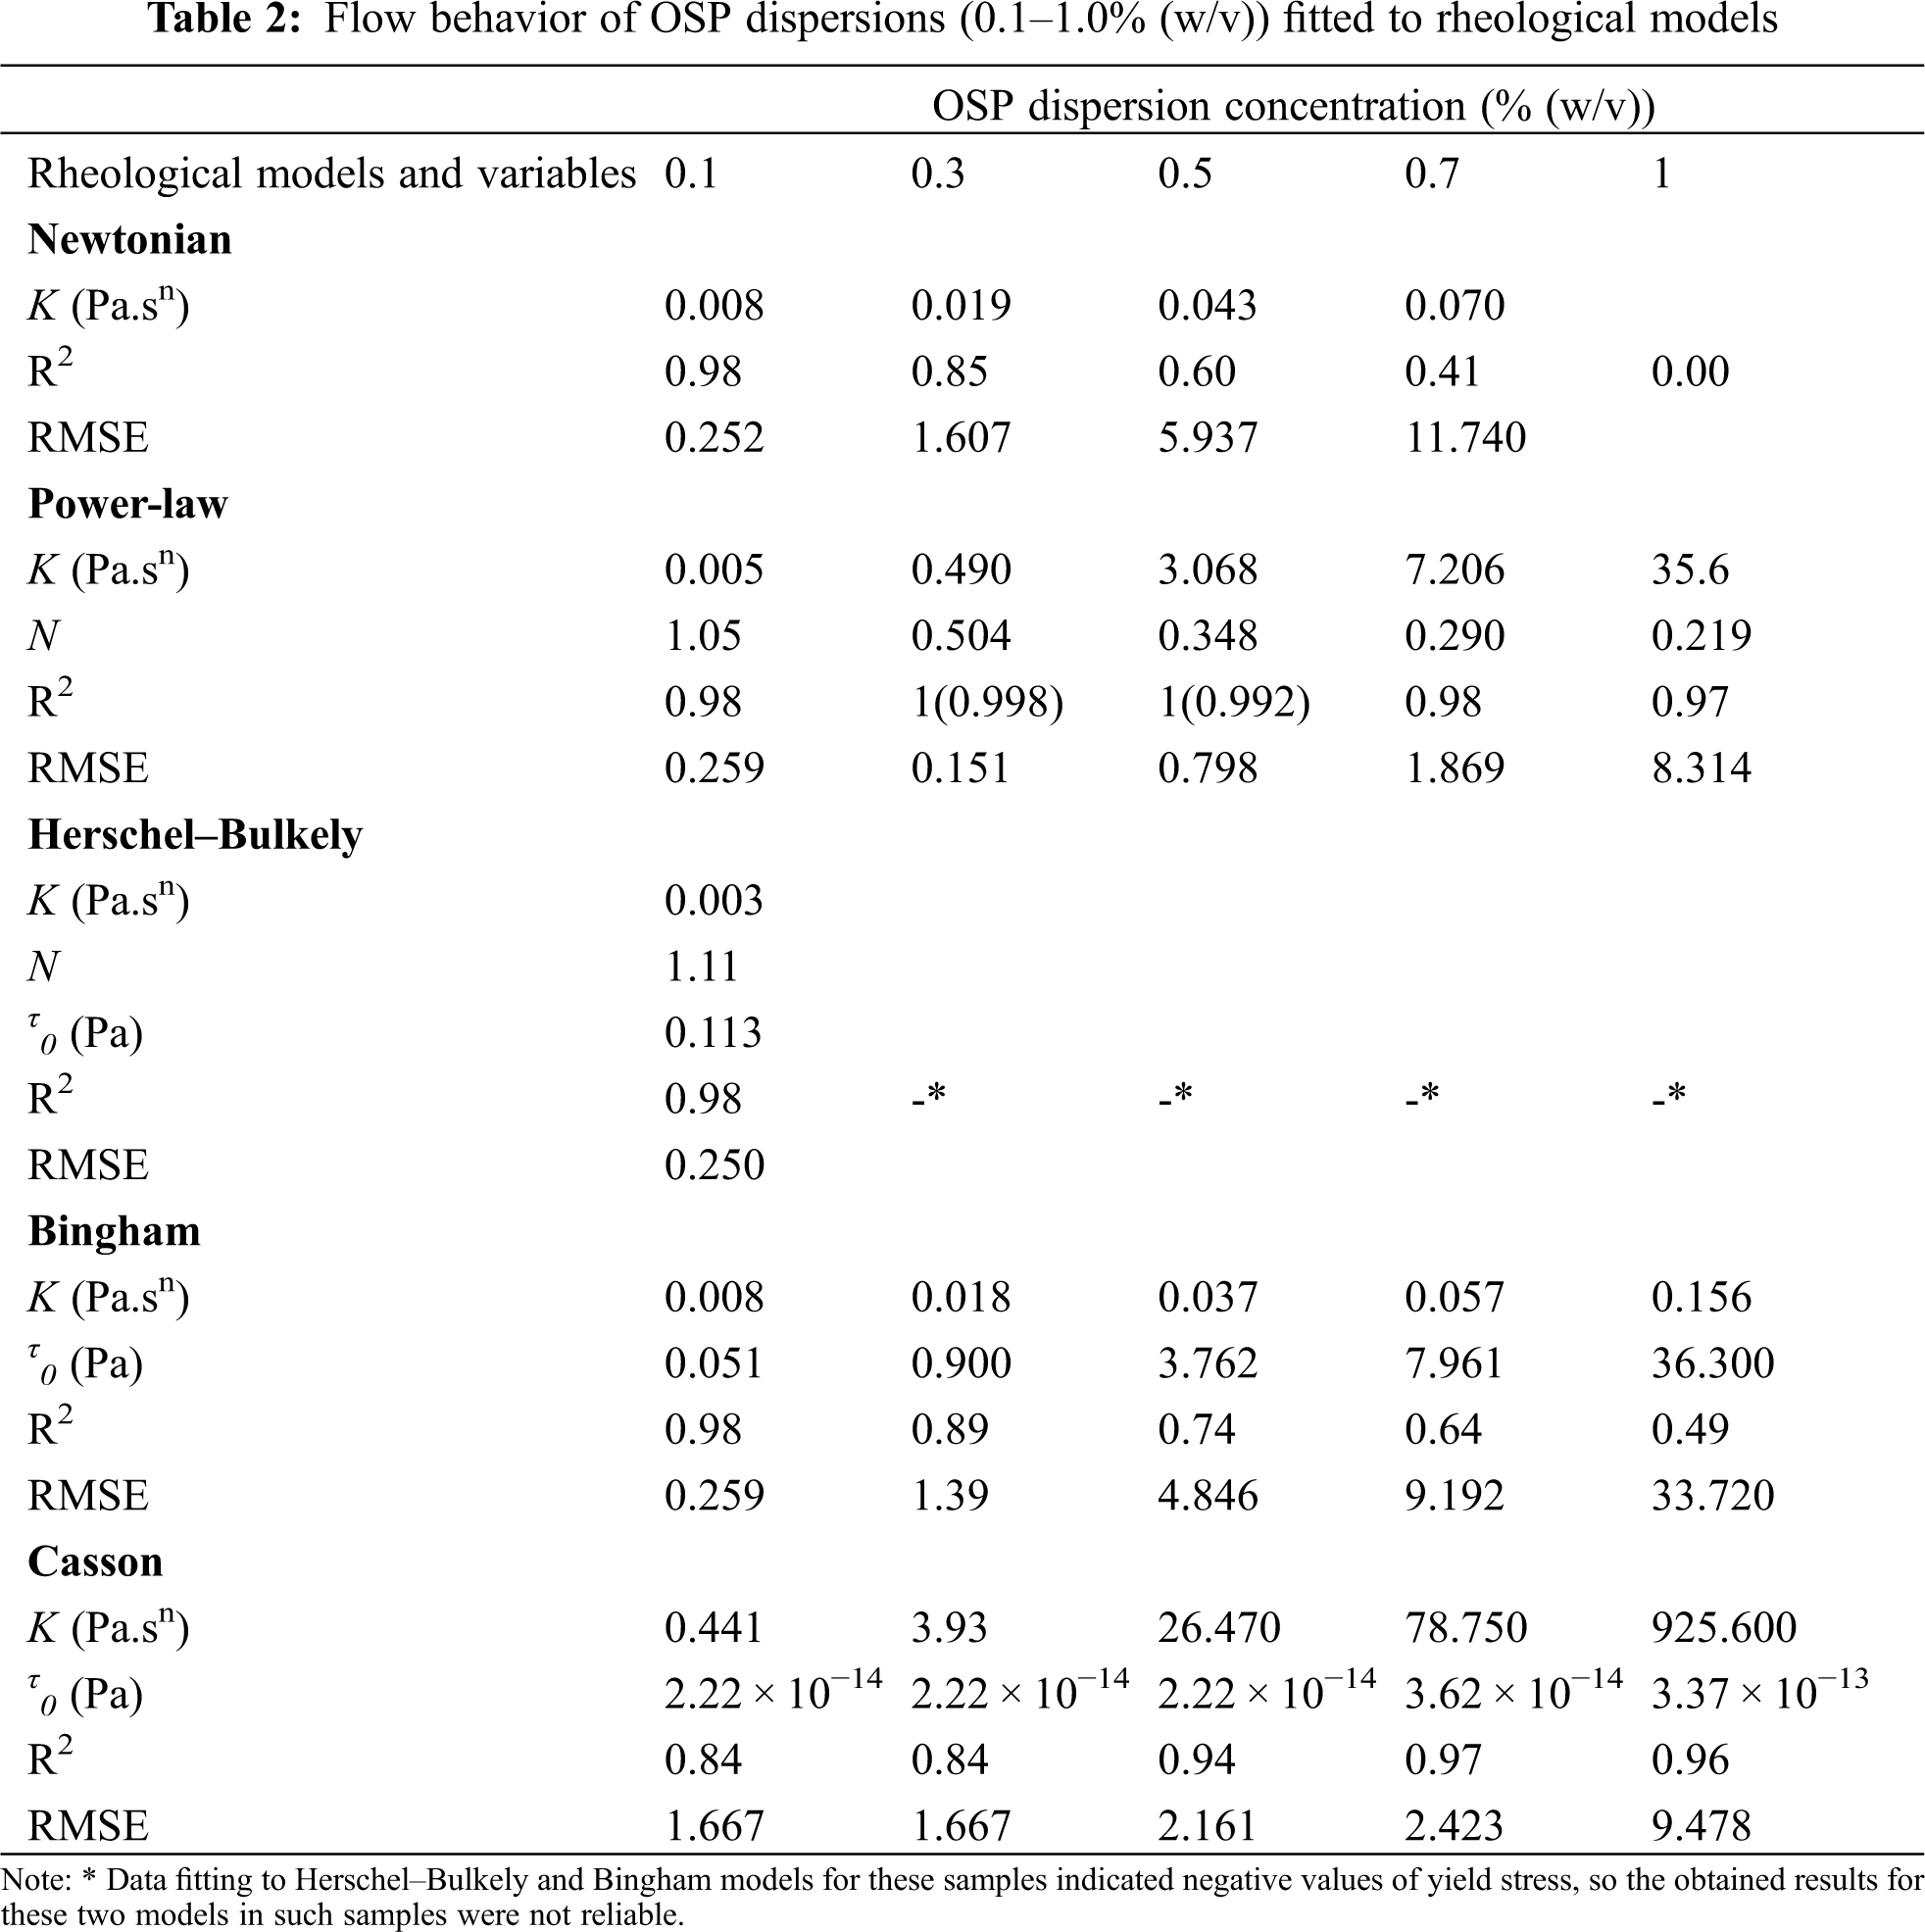
Fig. 1a compares the flow behavior of OSP dispersions within a concentration range of 0.1–1.0 wt%. Different rheological models were evaluated and the related coefficients are compared in Table 2. On the basis of the highest determination coefficient (R2) and the lowest root mean standard error (RMSE), the flow behavior of all OSP dispersions with different concentrations was particularly nonlinear and best fitted the Power-law model (τ = m
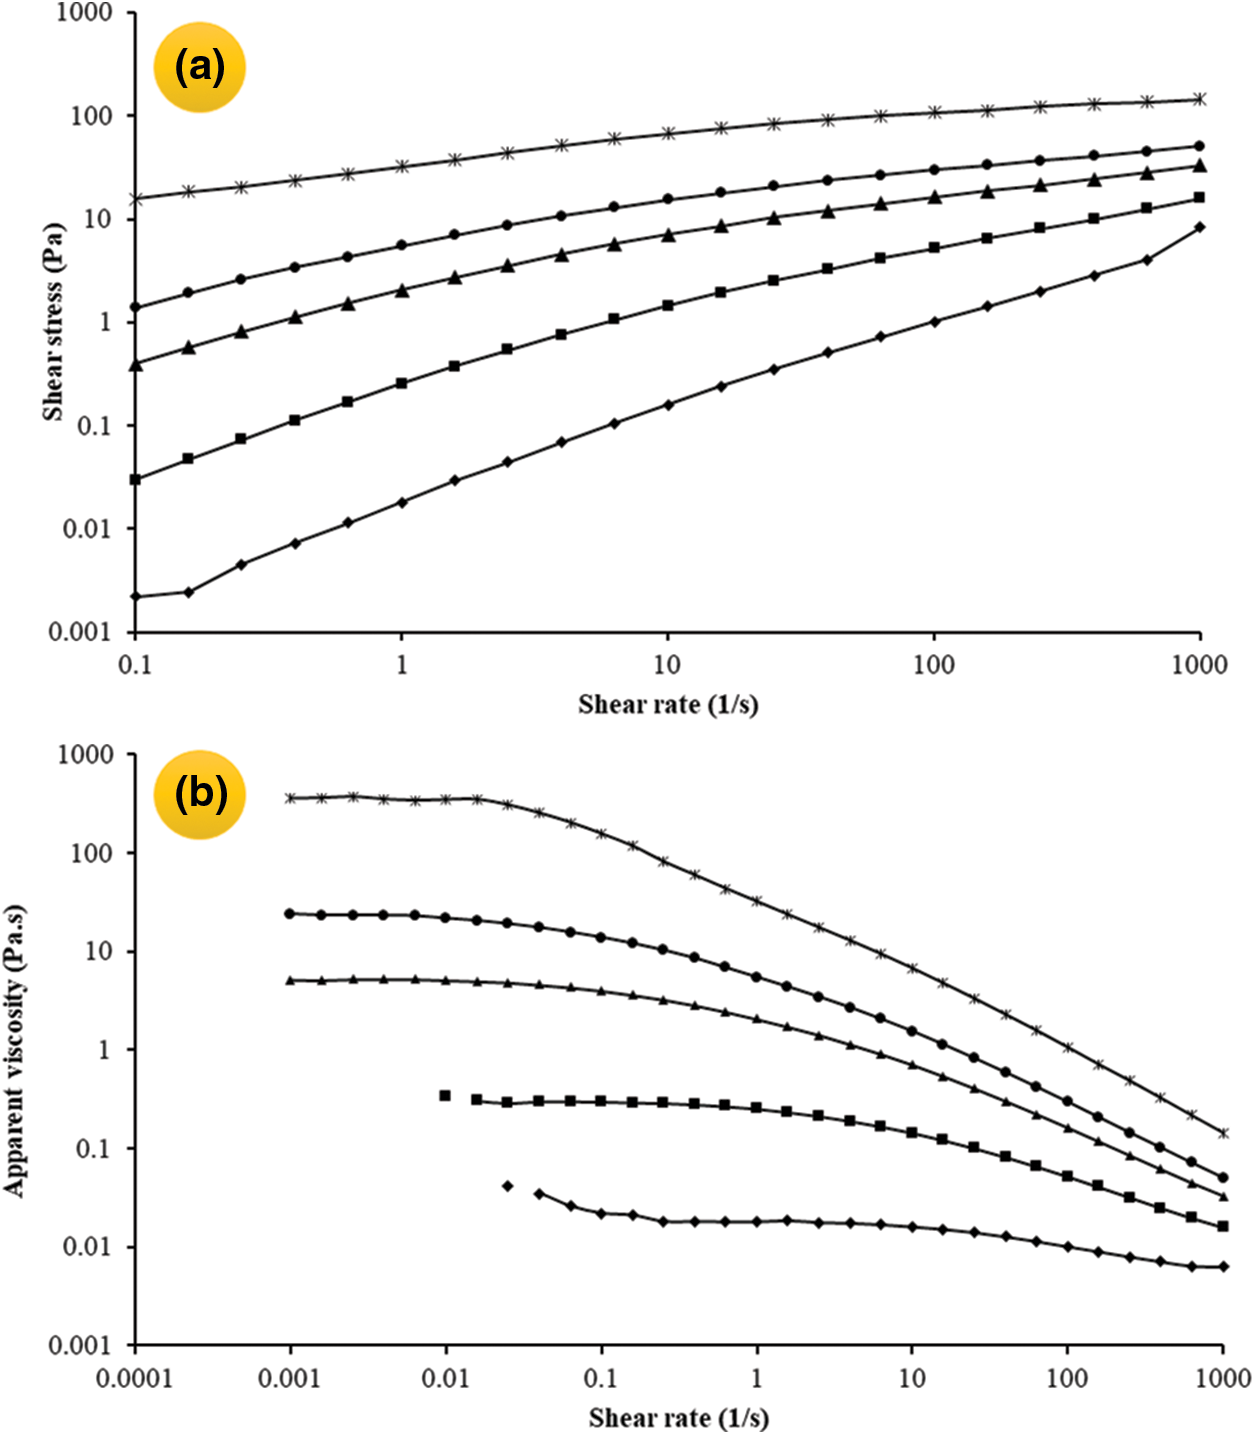
Figure 1: Shear stress (a) and apparent viscosity (b) of OSP dispersions plotted as a function of shear rate. Measurements were carried out in distilled water at 25°C and different concentrations of OSP [0.1 wt% (♦), 0.3 wt% (▪), 0.5 wt% (▴), 0.7 wt% (⬤), 1 wt% (★)]
The dependency of the apparent viscosity on the shear rate for the OSP dispersions at various concentrations is shown in Fig. 1b. As evident, the OSP dispersions were characterized by the typical viscosity vs. shear rate relationship of a colloidal food system, including the polysaccharides solutions. At a lower shear rate (∼0.1 1/s), and especially at higher gum concentrations (0.5–1.0 wt%), the apparent viscosity was nearly independent of the shear rate. Indeed, when the shear rate is low, the Brownian motion dominates the structural forces and favors the alignment of the elongated coil along the flow direction. However, the viscosity, reduced with increasing shear rate (shear thinning behavior), arose from the equilibrium between the hydrodynamic forces and the structural forces [38,39]. In fact, above a critical shear rate, the deformation rate of the gum chain entanglement become greater than the formation rate of the new entanglement due to the application of external forces [40].
As evident in Fig. 1b, the apparent viscosity decreased with reducing the gum concentration to 0.1%, throughout the shear rate study. In addition, as the dispersion concentration increases, the intermolecular interactions increase and improve the viscosity. The positive effect of gum concentration on the apparent viscosity can be also followed in the Power-law model parameters (Table 1), so that with increasing in OSP concentration, the consistency coefficient (k) and flow behavior index (n) increased and decreased, respectively. Generally, it seems that the apparent viscosity of OSP is similar to or even better than that of some other polysaccharides such as some species of gum tragacanth [13], pectin [41], Persian gum [42], guar gum [43], carboxymethyl cellulose [44], etc.
Strain sweep dynamic rheological measurements showed that for OSP dispersion (1.0 wt%) storage modulus (Gʹ) was slightly higher than loss modulus (Gʺ) (Fig. 2a). Nevertheless, the superiority of each of these modules over the other in the frequency sweep test depended on the frequency. As observed in Fig. 2b, there was a transition from a predominantly viscous response at longer time scales (Gʺ > Gʹ) to a predominantly elastic response at shorter time scales (Gʹ > Gʺ), indicating the dispersion has an entangled network structure. Such rheological behavior can be compared to some gum tragacanth species (Astragalus parrowianus and Astragalus fluccosus) [27] and deacetylated Sterculia striata polysaccharide [45].
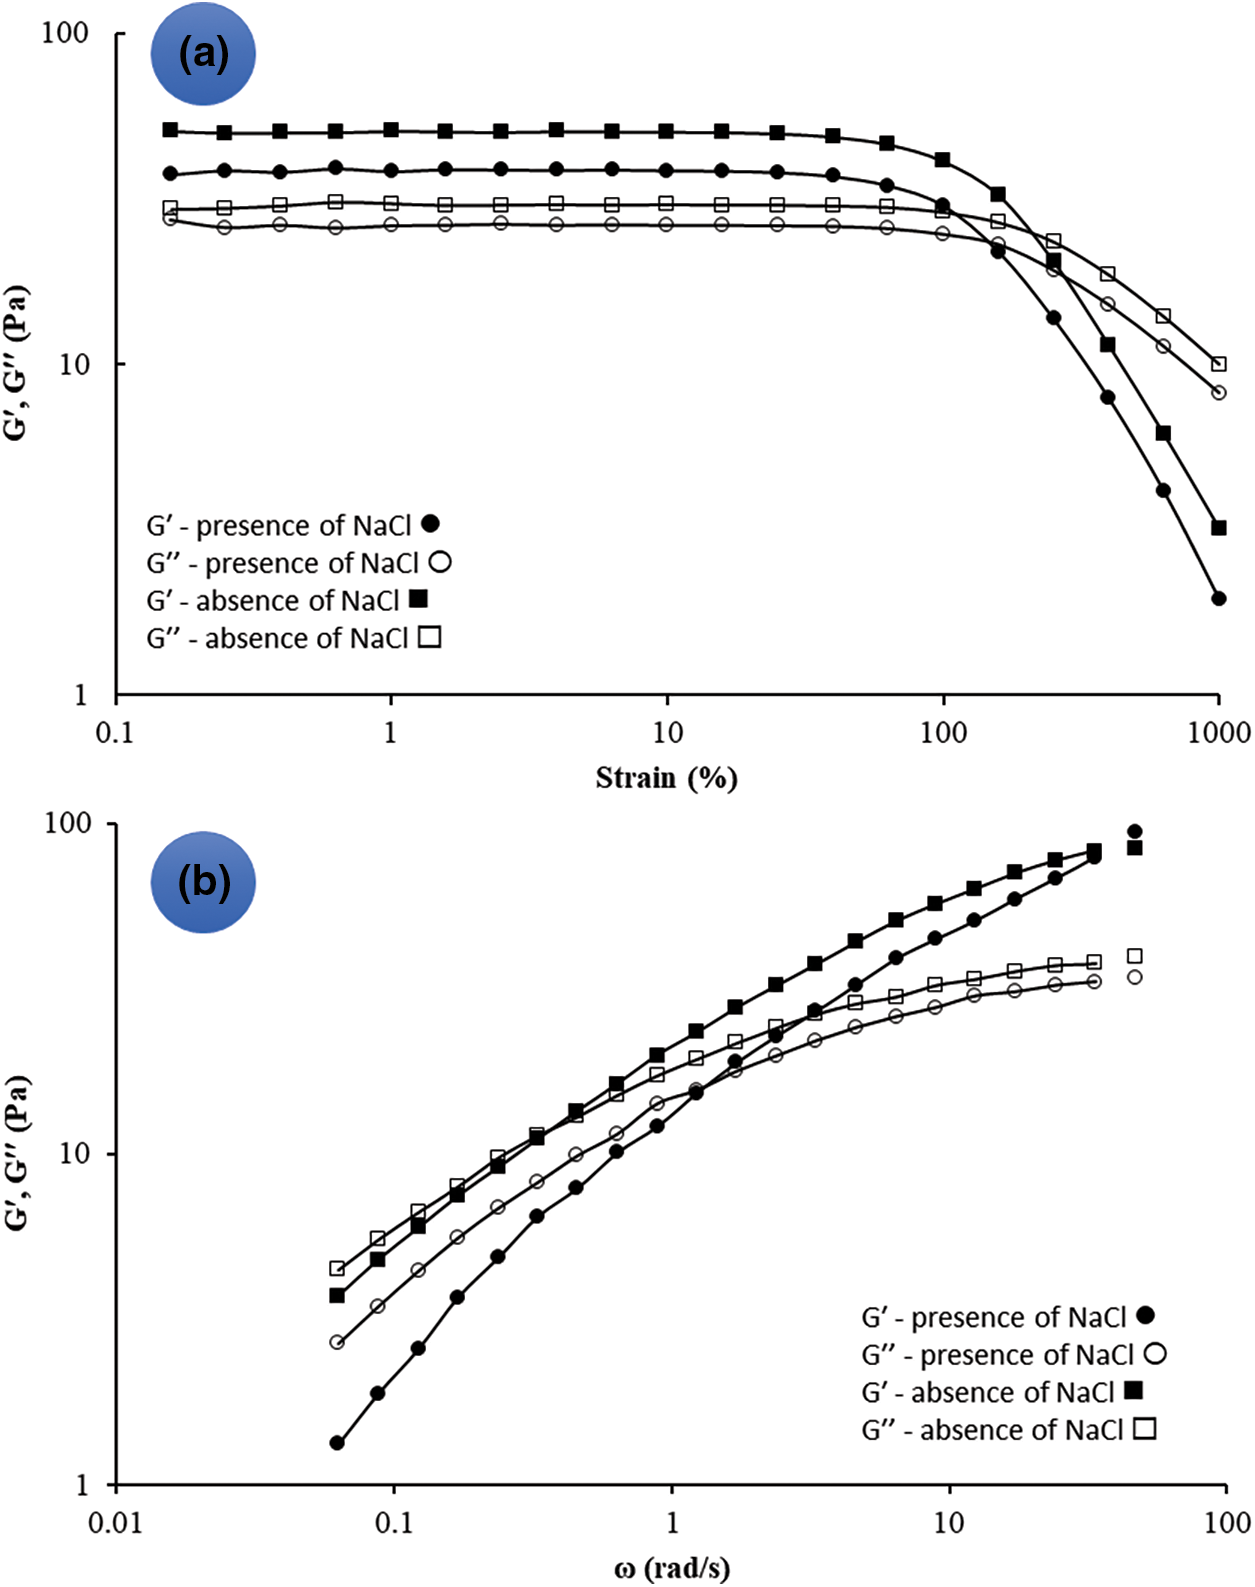
Figure 2: The storage modulus (G′) and loss modulus (G′′) as a function of strain at a frequency of 1 Hz (a), G′ and G′′ as a function of frequency at a constant strain (<LVR, ∼0.5%) (b) for a sample of 1.0 wt% OSP and the presence/absence of NaCl (0.2 M). measurements were carried out in distilled water at 25°C
3.3.2 Effect of Salt and Temperature on the Rheological Properties
The addition of salt (NaCl) to the OSP dispersion (1.0 wt%) decreased the apparent viscosity with no changes in the reduction pattern or flow behavior (Fig. 3a). Moreover, the consistency coefficient of 1 wt% OSP aqueous dispersion in the presence of 0.2 M NaCl decreased from 35.60 to 23.18 Pa.sn, while the flow behavior index remained almost unchanged (0.22 against 0.25). This effect can be ascribed to the charge screening effect of the salt on long-range electrostatic repulsion among the uronic acid residues of OSP [13]. Based on the strain sweep test, the salt addition reduced both Gʹ and Gʺ values, but the Gʹ values in LVR were still greater than Gʺ ones (Fig. 2a). Contrary to the NaCl-free OSP dispersion, the dispersion containing NaCl (0.2 M) presented a crossover point at a high frequency (Fig. 2b). Furthermore, in the presence of NaCl, the G′ and G″ gap was larger. This suggests that NaCl caused a more drastic decrease in the elastic component than the viscous component. Interestingly, as evident (Fig. 3a), incorporation of CaCl2 to OSP dispersion increased the viscosity which can be related to the bridging effect of Ca2+ forming a strong gel network of polysaccharide chains.
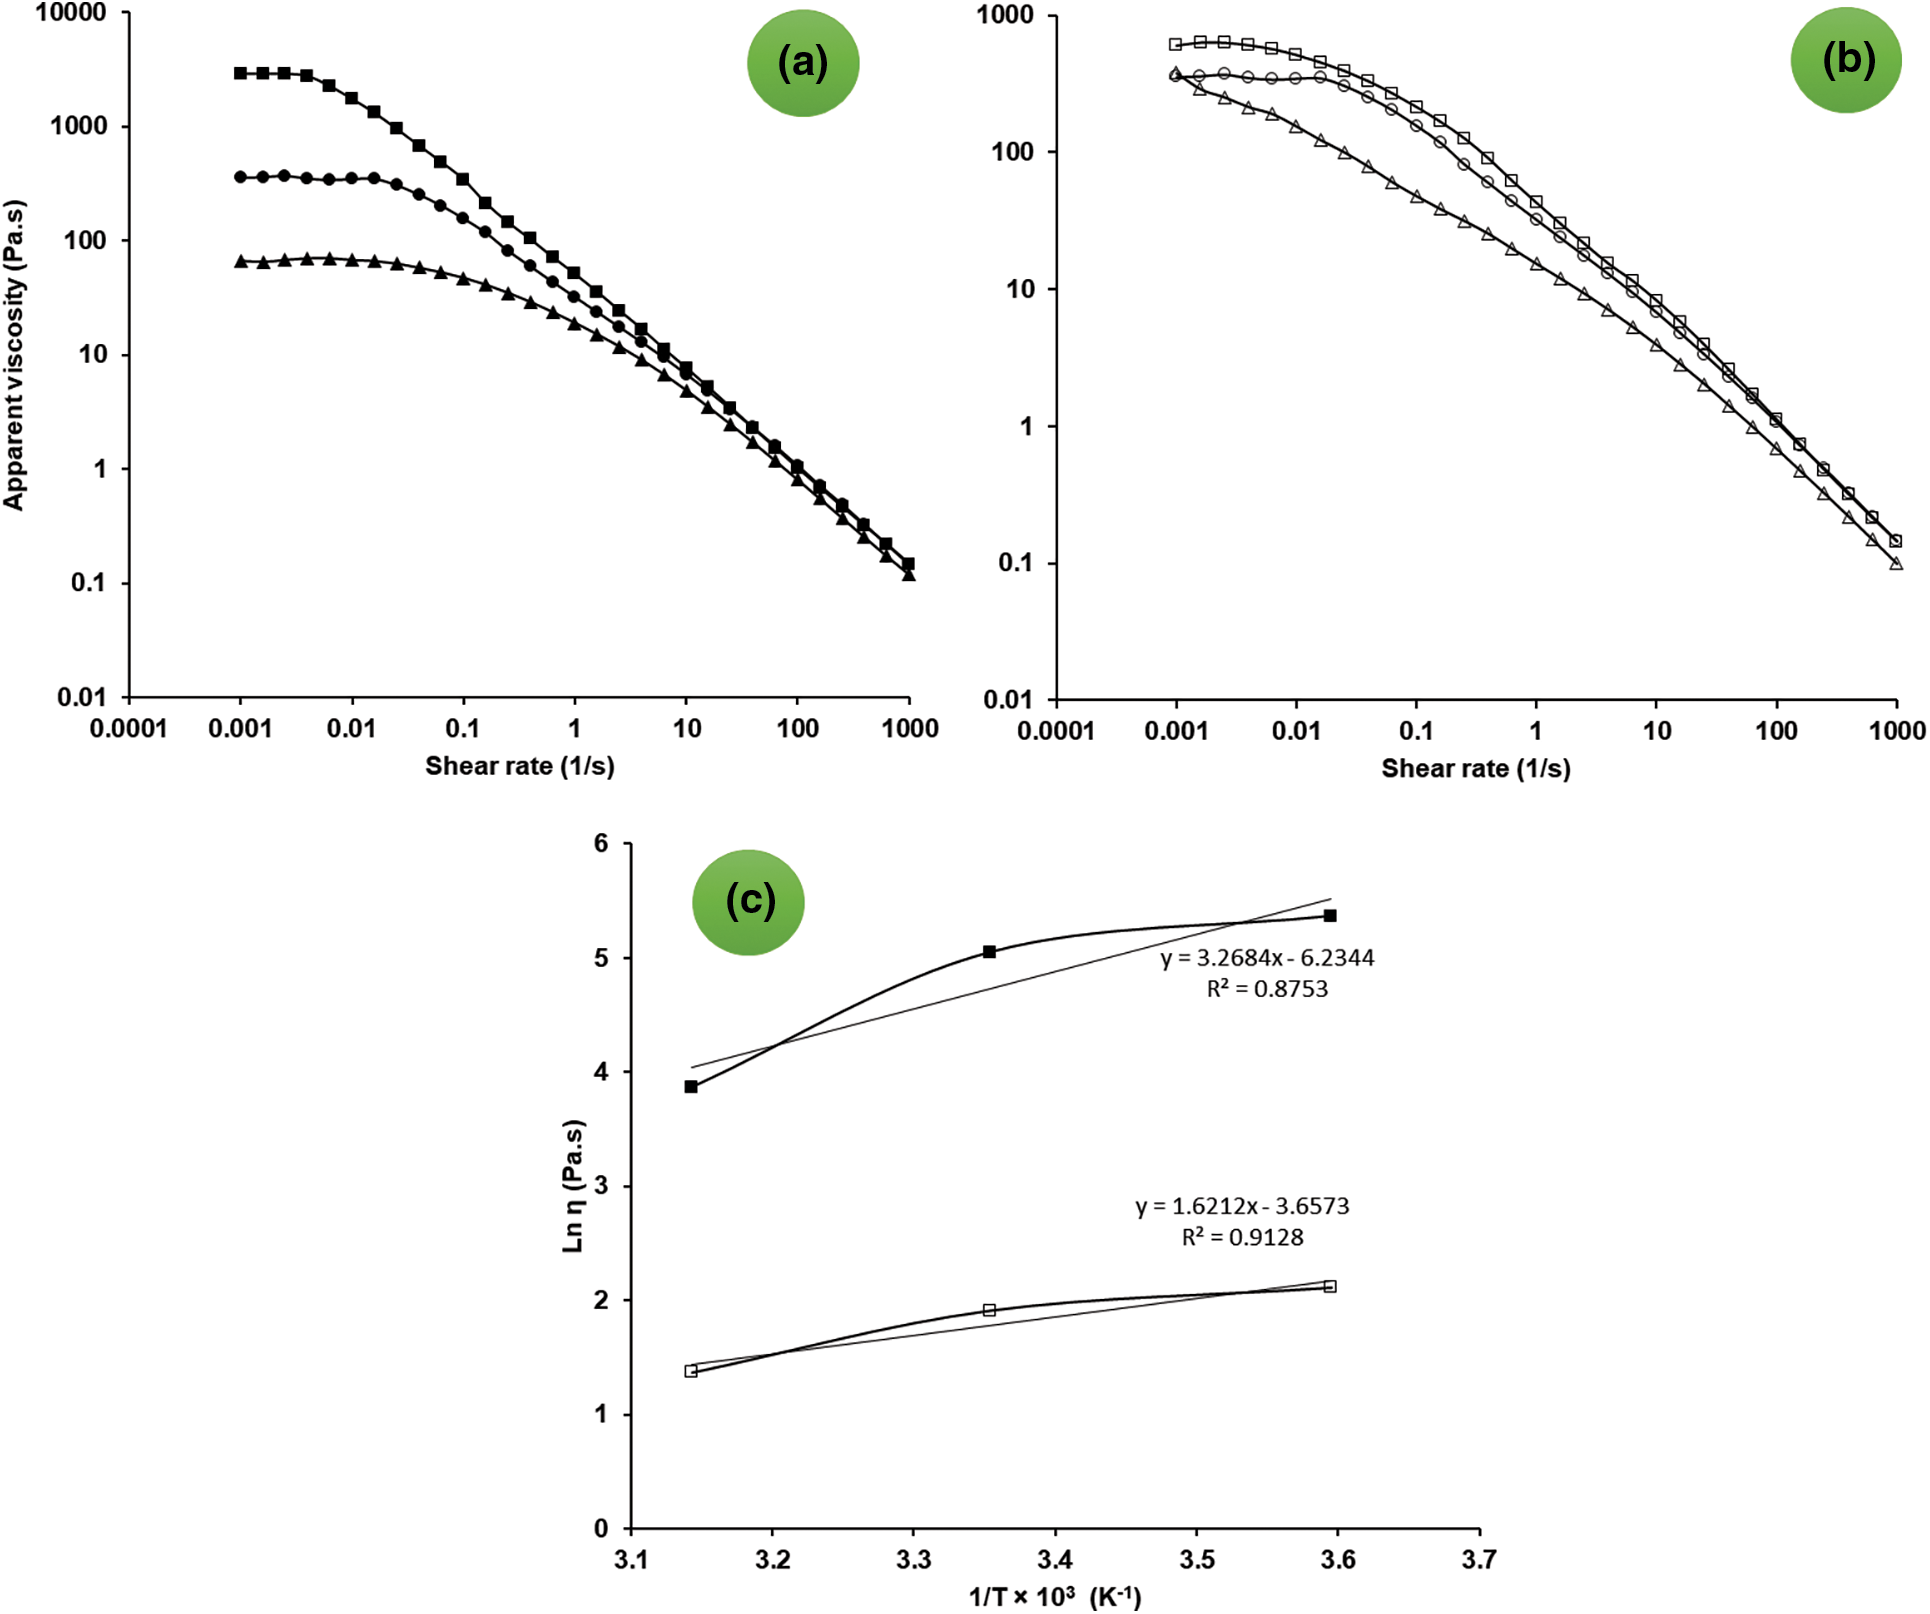
Figure 3: Effect of salts (a) (salt free sample (⬤), sample containing 0.2 M NaCl (▴) and 0.2 M CaCl2 (▪)) and different temperatures (b) (5°C (◻), 25°C (○), and 45°C (△) on the apparent viscosity of 1 wt% OSP dispersion as a function of shear rate. arrhenius plots (c) for 1 wt% OSP dispersions at the shear rates of 0.1 1/s (▪) and 10 1/s (◻)
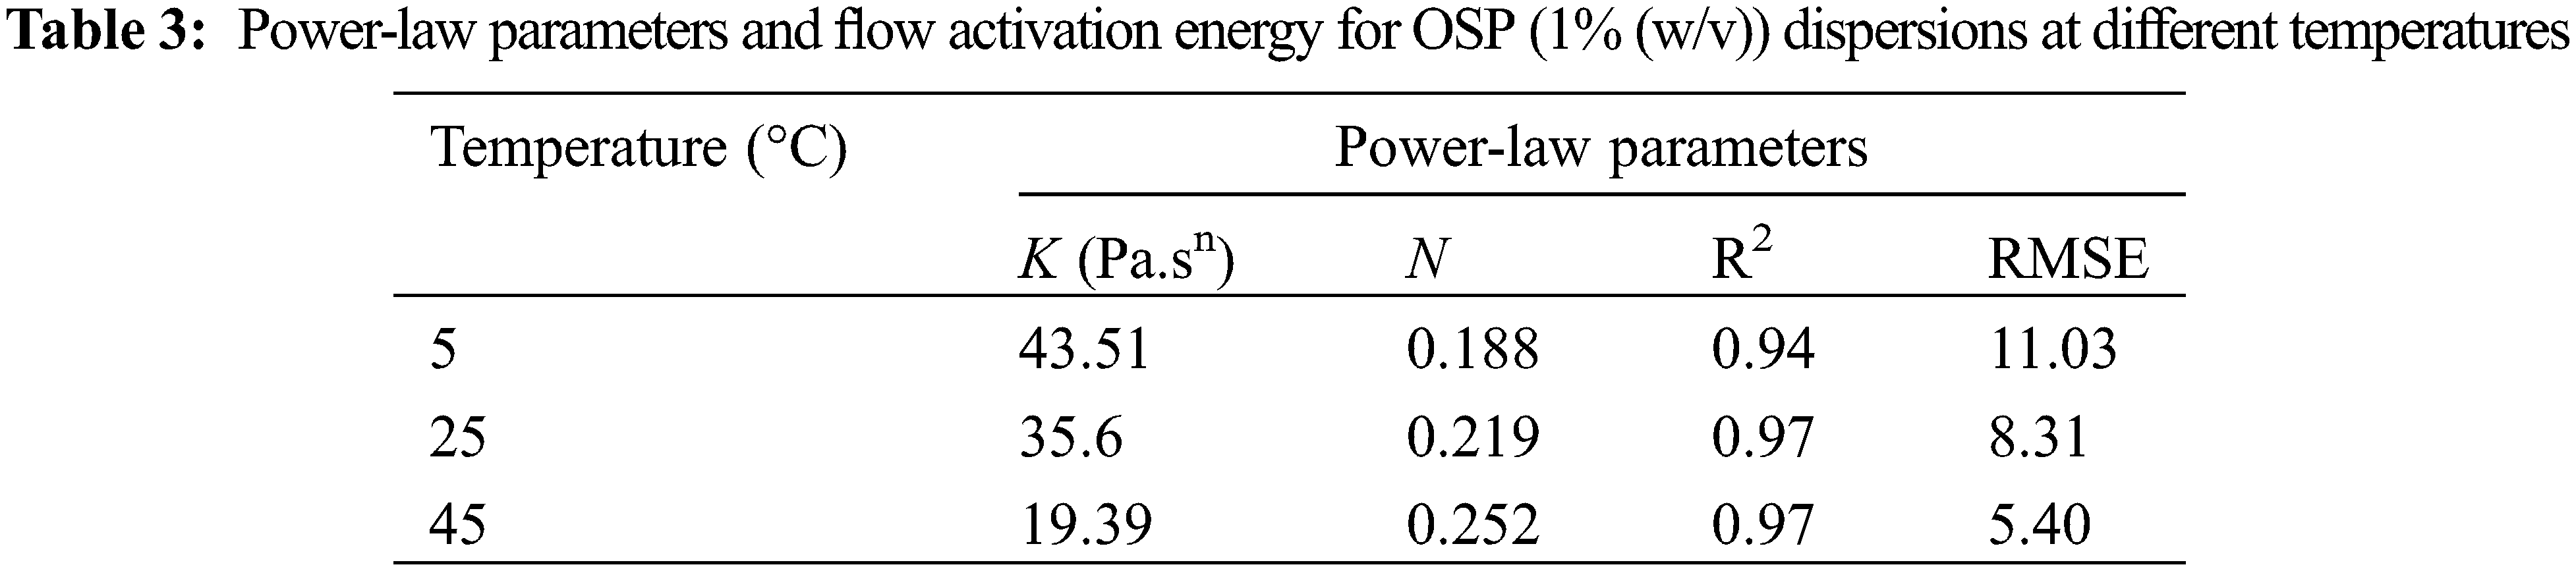
Fig. 3b shows the temperature influence on the apparent viscosity of 1 wt% OSP dispersion as a function of shear rate. The viscosity significantly declined by increasing the temperature from 5 to 45°C. This effect can be also observed in Power-law model parameters. According to it, by increasing the temperature, the consistency coefficient decreased and the flow behavior index increased (Table 3). However, the flow behavior index of the dispersion is still far from the typical value of a Newtonian fluid (i.e., n = 1). In addition, the shear rate exerted a considerable effect on the temperature dependence of OSP dispersion viscosity. Fig. 3c shows the activation energy (Ea) value obtained at two shear rates, i.e., 0.1 and 10 1/s, for 1 wt% OSP aqueous dispersions. High R2 values suggested that the dispersion apparent viscosity in relation to the temperature follows the Arrhenius model. A higher flow Ea value at low shear rates implicates more sensitivity of OSP viscosity to the temperature changes. This trend was previously reported for several hydrocolloids, including the pectin [46,47].
This article presents and describes a green and environmentally friendly method using heated distilled water for the extraction of high-quality pectin from bitter orange seeds for the first time. The compositional and rheological properties of the extracted pectin were evaluated. The compositional analysis showed that the majority of the extracted pectin was made of carbohydrates (86.8%) followed by proteins (2.14%). Due to the esterification degree of 79.68%, the extracted pectin can be categorized as high methoxyl pectin (HM). The monosaccharides composition revealed that the galacturonic acid was the major pectin structure followed by glucose. Arabinose, galactose, rhamnose, and fucose were also detected in smaller amounts, confirming the side-chain structure of the extracted pectin. The pectin molecular weight analysis showed a high Mw of 4512 kDa. Sugars ratio analysis of OSP showed high linearity and a low amount of rhamnogalacturonan acid branching. These observations along with high molecular weight mean particularly long and linear pectin in OSP. Rheological study of OSP dispersions exhibited a non-Newtonian shear thinning behavior. Strain sweep dynamic rheological measurements exhibited a higher storage modulus (G′) than loss modulus (G″), suggesting the entangled structure of OSP. Thus, it is possible to conclude that the mucilage extracted from orange seeds with an environmentally friendly extraction method using hot water is rich in pectin and demonstrates potential use as gelling or emulsion stabilizer in food applications. Further studies to deeper characterize this novel pectin source and evaluate its functional properties are needed, and, if fully elucidated, this innovative approach could potentially revolutionize the pectin use in the food industry.
Acknowledgement: The authors would like to thank Dr. Edel McGarry for offering help in language editing of the manuscript.
Funding Statement: The authors received no specific funding for this study.
Conflicts of Interest: The authors declare that they have no conflicts of interest to report regarding the present study.
1. Nejatian, M., Abbasi, S., Azarikia, F. (2020). Gum tragacanth: Structure, characteristics and applications in foods. International Journal of Biological Macromolecules, 160, 846–860. DOI 10.1016/j.ijbiomac.2020.05.214. [Google Scholar] [CrossRef]
2. Houben, K., Jolie, R. P., Fraeye, I., van Loey, A. M., Hendrickx, M. E. (2011). Comparative study of the cell wall composition of broccoli, carrot, and tomato: Structural characterization of the extractable pectins and hemicelluloses. Carbohydrate Research, 346(9), 1105–1111. DOI 10.1016/j.carres.2011.04.014. [Google Scholar] [CrossRef]
3. Christiaens, S., van Buggenhout, S., Houben, K., Jamsazzadeh Kermani, Z., Moelants, K. R. et al. (2016). Process–structure–function relations of pectin in food. Critical Reviews in Food Science and Nutrition, 56, 1021–1042. DOI 10.1080/10408398.2012.753029. [Google Scholar] [CrossRef]
4. Voragen, A. G., Coenen, G. J., Verhoef, R. P., Schols, H. A. (2009). Pectin, a versatile polysaccharide present in plant cell walls. Structural Chemistry, 20(2), 263–275. DOI 10.1007/s11224-009-9442-z. [Google Scholar] [CrossRef]
5. Berk, Z. (2016). Citrus fruit processing. USA: Academic press. [Google Scholar]
6. May, C. D. (1990). Industrial pectins: Sources, production and applications. Carbohydrate Polymers, 12, 79–99. DOI 10.1016/0144-8617(90)90105-2. [Google Scholar] [CrossRef]
7. Shan, Y. (2016). Comprehensive utilization of citrus by-products. USA: Academic Press. [Google Scholar]
8. Peng, X., Yang, G., Shi, Y., Zhou, Y., Zhang, M. et al. (2020). Box–Behnken design based statistical modeling for the extraction and physicochemical properties of pectin from sunflower heads and the comparison with commercial low-methoxyl pectin. Scientific Reports, 10, 1–10. DOI 10.1038/s41598-020-60339-1. [Google Scholar] [CrossRef]
9. Asgari, K., Labbafi, M., Khodaiyan, F., Kazemi, M., Hosseini, S. S. (2020). Valorization of walnut processing waste as a novel resource: Production and characterization of pectin. Journal of Food Processing and Preservation, 44, e14941. DOI 10.1111/jfpp.14941. [Google Scholar] [CrossRef]
10. Gharibzahedi, S. M. T., Smith, B., Guo, Y. (2019). Ultrasound-microwave assisted extraction of pectin from fig (Ficus carica L.) skin: Optimization, characterization and bioactivity. Carbohydrate Polymers, 222, 114992. DOI 10.1016/j.carbpol.2019.114992. [Google Scholar] [CrossRef]
11. Chaliha, M., Williams, D., Smyth, H., Sultanbawa, Y. (2018). Extraction and characterization of a novel Terminalia pectin. Food Science and Biotechnology, 27, 65–71. DOI 10.1007/s10068-017-0201-4. [Google Scholar] [CrossRef]
12. Assoi, S., Konan, K., Agbo, G. N., Dodo, H., Holser, R. et al. (2017). Palmyra palm (Borassus aethiopum Mart.) fruits: Novel raw materials for the pectin industry. Journal of the Science of Food and Agriculture, 97, 2057–2067. DOI 10.1002/jsfa.8010. [Google Scholar] [CrossRef]
13. Balaghi, S., Mohammadifar, M. A., Zargaraan, A. (2010). Physicochemical and rheological characterization of gum tragacanth exudates from six species of Iranian Astragalus. Food Biophysics, 5, 59–71. DOI 10.1007/s11483-009-9144-5. [Google Scholar] [CrossRef]
14. Rincón, F., Muñoz, J., Ramírez, P., Galán, H., Alfaro, M. C. (2014). Physicochemical and rheological characterization of Prosopis juliflora seed gum aqueous dispersions. Food Hydrocolloids, 35, 348–357. DOI 10.1016/j.foodhyd.2013.06.013. [Google Scholar] [CrossRef]
15. Moufida, S. D., Marzouk, B. (2003). Biochemical characterization of blood orange, sweet orange, lemon, bergamot and bitter orange. Phytochemistry, 62, 1283–1289. DOI 10.1016/S0031-9422(02)00631-3. [Google Scholar] [CrossRef]
16. Zibaee, E., Kamalian, S., Tajvar, M., Amiri, M. S., Ramezani, M. et al. (2020). Citrus species: A review of traditional uses, phytochemistry and pharmacology. Current Pharmaceutical Design, 26, 44–97. DOI 10.2174/1381612825666191127115601. [Google Scholar] [CrossRef]
17. do Nascimento Oliveira, A., de Almeida Paula, D., de Oliveira, E. B., Saraiva, S. H., Stringheta, P. C. et al. (2018) Optimization of pectin extraction from Ubá mango peel through surface response methodology. International Journal of Biological Macromolecules, 113, 395–402. DOI 10.1016/j.ijbiomac.2018.02.154. [Google Scholar] [CrossRef]
18. Gavlighi, H. A., Meyer, A. S., Zaidel, D. N., Mohammadifar, M. A., Mikkelsen, J. D. (2013). Stabilization of emulsions by gum tragacanth (Astragalus spp.) correlates to the galacturonic acid content and methoxylation degree of the gum. Food Hydrocolloids, 31, 5–14. DOI 10.1016/j.foodhyd.2012.09.004. [Google Scholar] [CrossRef]
19. Chaharbaghi, E., Khodaiyan, F., Hosseini, S. S. (2017). Optimization of pectin extraction from pistachio green hull as a new source. Carbohydrate Polymers, 173, 107–113. DOI 10.1016/j.carbpol.2017.05.047. [Google Scholar] [CrossRef]
20. Hosseini, S. S., Khodaiyan, F., Kazemi, M., Najari, Z. (2019). Optimization and characterization of pectin extracted from sour orange peel by ultrasound assisted method. International Journal of Biological Macromolecules, 125, 621–629. DOI 10.1016/j.ijbiomac.2018.12.096. [Google Scholar] [CrossRef]
21. Garavand, F., Madadlou, A. (2014). Recovery of phenolic compounds from effluents by a microemulsion liquid membrane (MLM) extractor. Colloids and Surfaces A: Physicochemical and Engineering Aspects, 443, 303–310. DOI 10.1016/j.colsurfa.2013.11.035. [Google Scholar] [CrossRef]
22. Nejatian, M., Abbasi, S. (2019). Formation of concentrated triglyceride nanoemulsions and nanogels: Natural emulsifiers and high power ultrasound. RSC Advances, 9, 28330–28344. DOI 10.1039/C9RA04761A. [Google Scholar] [CrossRef]
23. Nejatian, M., Abbasi, S., Kadkhodaee, R. (2018). Ultrasonic-assisted fabrication of concentrated triglyceride nanoemulsions and nanogels. Langmuir, 34, 11433–11441. DOI 10.1021/acs.langmuir.8b01596. [Google Scholar] [CrossRef]
24. Razavi, S. M. A., Cui, S. W., Guo, Q., Ding, H. (2014). Some physicochemical properties of sage (Salvia macrosiphon) seed gum. Food Hydrocolloids, 35, 453–462. DOI 10.1016/j.foodhyd.2013.06.022. [Google Scholar] [CrossRef]
25. Müller-Maatsch, J., Bencivenni, M., Caligiani, A., Tedeschi, T., Bruggeman, G. et al. (2016). Pectin content and composition from different food waste streams. Food Chemistry, 201, 37–45. DOI 10.1016/j.foodchem.2016.01.012. [Google Scholar] [CrossRef]
26. Anderson, D., Grant, D. (1988). The chemical characterization of some Astragalus gum exudates. Food Hydrocolloids, 2, 417–423. DOI 10.1016/S0268-005X(88)80006-7. [Google Scholar] [CrossRef]
27. Balaghi, S., Mohammadifar, M. A., Zargaraan, A., Gavlighi, H. A., Mohammadi, M. (2011). Compositional analysis and rheological characterization of gum tragacanth exudates from six species of Iranian Astragalus. Food Hydrocolloids, 25, 1775–1784. DOI 10.1016/j.foodhyd.2011.04.003. [Google Scholar] [CrossRef]
28. Hosseini-Parvar, S., Matia-Merino, L., Goh, K., Razavi, S. M. A., Mortazavi, S. A. (2010). Steady shear flow behavior of gum extracted from Ocimum basilicum L. seed: Effect of concentration and temperature. Journal of Food Engineering, 101, 236–243. DOI 10.1016/j.jfoodeng.2010.06.025. [Google Scholar] [CrossRef]
29. Faria, S., de Oliveira Petkowicz, C. L., de Morais, S. A. L., Terrones, M. G. H., De Resende, M. M. et al. (2011). Characterization of xanthan gum produced from sugar cane broth. Carbohydrate Polymers, 86, 469–476. DOI 10.1016/j.carbpol.2011.04.063. [Google Scholar] [CrossRef]
30. Harding, S. E., Tombs, M. P., Adams, G. G., Paulsen, B. S., Inngjerdingen, K. T. et al. (2017). An introduction to polysaccharide biotechnology. Boca Raton, Florida, USA: CRC Press. [Google Scholar]
31. Imeson, A. (2011). Food stabilisers, thickeners and gelling agents. Oxford, UK: John Wiley & Sons. [Google Scholar]
32. Milani, J., Maleki, G. (2012). Hydrocolloids in food industry. Food Industrial Processes–Methods and Equipment, 2, 2–37. DOI 10.5772/2491. [Google Scholar] [CrossRef]
33. Naji-Tabasi, S., Razavi, S. M. A., Mohebbi, M., Malaekeh-Nikouei, B. (2016). New studies on basil (Ocimum bacilicum L.) seed gum: Part I–Fractionation, physicochemical and surface activity characterization. Food Hydrocolloids, 52, 350–358. DOI 10.1016/j.foodhyd.2015.07.011. [Google Scholar] [CrossRef]
34. Cho, E. H., Jung, H. T., Lee, B. H., Kim, H. S., Rhee, J. K. et al. (2019). Green process development for apple-peel pectin production by organic acid extraction. Carbohydrate Polymers, 204, 97–103. DOI 10.1016/j.carbpol.2018.09.086. [Google Scholar] [CrossRef]
35. Yapo, B. M., Robert, C., Etienne, I., Wathelet, B., Paquot, M. (2007). Effect of extraction conditions on the yield, purity and surface properties of sugar beet pulp pectin extracts. Food Chemistry, 100, 1356–1364. DOI 10.1016/j.foodchem.2005.12.012. [Google Scholar] [CrossRef]
36. Gavlighi, H. A., Tabarsa, M., You, S., Surayot, U., Ghaderi-Ghahfarokhi, M. (2018). Extraction, characterization and immunomodulatory property of pectic polysaccharide from pomegranate peels: Enzymatic vs conventional approach. International Journal of Biological Macromolecules, 116, 698–706. DOI 10.1016/j.ijbiomac.2018.05.083. [Google Scholar] [CrossRef]
37. Khodaei, D., Razavi, S. M., Khodaparast, M. H. (2014). Functional properties of balangu seed gum over multiple freeze–thaw cycles. Food Research International, 66, 58–68. DOI 10.1016/j.foodres.2014.08.039. [Google Scholar] [CrossRef]
38. Barnes, H. A. (2000). A handbook of elementary rheology, vol. 1. Cardiff, UK: University of Wales, Institute of Non-Newtonian Fluid Mechanics Aberystwyth. [Google Scholar]
39. Morales-Contreras, B. E., Rosas-Flores, W., Contreras-Esquivel, J. C., Wicker, L., Morales-Castro, J. (2018). Pectin from husk tomato (Physalis ixocarpa Brot.Rheological behavior at different extraction conditions. Carbohydrate Polymers, 179, 282–289. DOI 10.1016/j.carbpol.2017.09.097. [Google Scholar] [CrossRef]
40. Torres, M., Hallmark, B., Wilson, D. (2014). Effect of concentration on shear and extensional rheology of guar gum solutions. Food Hydrocolloids, 40, 85–95. DOI 10.1016/j.foodhyd.2014.02.011. [Google Scholar] [CrossRef]
41. Marcotte, M., Hoshahili, A. R. T., Ramaswamy, H. (2001). Rheological properties of selected hydrocolloids as a function of concentration and temperature. Food Research International, 34, 695–703. DOI 10.1016/S0963-9969(01)00091-6. [Google Scholar] [CrossRef]
42. Fadavi, G., Mohammadifar, M. A., Zargarran, A., Mortazavian, A. M., Komeili, R. (2014). Composition and physicochemical properties of zedo gum exudates from Amygdalus scoparia. Carbohydrate Polymers, 101, 1074–1080. DOI 10.1016/j.carbpol.2013.09.095. [Google Scholar] [CrossRef]
43. Kayacier, A., Dogan, M. (2006). Rheological properties of some gums-salep mixed solutions. Journal of Food Engineering, 72, 261–265. DOI 10.1016/j.jfoodeng.2004.12.005. [Google Scholar] [CrossRef]
44. Yaşar, F., Toğrul, H., Arslan, N. (2007). Flow properties of cellulose and carboxymethyl cellulose from orange peel. Journal of Food Engineering, 81, 187–199. DOI 10.1016/j.jfoodeng.2006.10.022. [Google Scholar] [CrossRef]
45. De Brito, A. C. F., Sierakowski, M. R., Reicher, F., Feitosa, J. P., de Paula, R. C. M. (2005). Dynamic rheological study of Sterculia striata and karaya polysaccharides in aqueous solution. Food Hydrocolloids, 19, 861–867. DOI 10.1016/j.foodhyd.2004.10.035. [Google Scholar] [CrossRef]
46. Bak, J., Yoo, B. (2018). Effect of CMC addition on steady and dynamic shear rheological properties of binary systems of xanthan gum and guar gum. International Journal of Biological Macromolecules, 115, 124–128. DOI 10.1016/j.ijbiomac.2018.04.052. [Google Scholar] [CrossRef]
47. Fan, Z., Cheng, P., Gao, Y., Wang, D., Jia, G. et al. (2022). Understanding the rheological properties of a novel composite salecan/gellan hydrogels. Food Hydrocolloids, 123, 107162. DOI 10.1016/j.foodhyd.2021.107162. [Google Scholar] [CrossRef]
 | This work is licensed under a Creative Commons Attribution 4.0 International License, which permits unrestricted use, distribution, and reproduction in any medium, provided the original work is properly cited. |