| Journal of Renewable Materials |
DOI: 10.32604/jrm.2022.019620
ARTICLE
Damage and Deterioration Model of Basalt Fiber/Magnesium Oxychloride Composites Based on GM(1, 1)-Markov in the Salt Spray Corrosion Environment
1School of Civil Engineering, Lanzhou University of Technology, Lanzhou, 730050, China
2Western Ministry of Civil Engineering Disaster Prevention and Mitigation Engineering Research Center, Lanzhou University of Technology, Lanzhou, 730050, China
*Corresponding Author: Jianqiao Yu. Email: 1815200102@e.gzhu.edu.cn
Received: 02 October 2021; Accepted: 05 November 2021
Abstract: This study was designed to solve the problem of magnesium hazards due to potash extraction in the salt lake region. Using basalt fiber (BF) as the reinforcement material and magnesium oxychloride cement (MOC) as the gelling material, a BF/MOC composite material was prepared. Firstly, the effect of BF addition content on the basic mechanical properties of the composites was investigated. Then, through the salt spray corrosion test, the durability damage deterioration evaluation analysis was carried out from both macroscopic and microscopic aspects using mass change, relative dynamic modulus of elasticity (RDME) change, SEM analysis and FT-IR analysis. Finally, a GM(1, 1)-Markov model was established to predict the durability life of composite materials by using durability evaluation indicators. The results show that: when the BF content is 0.10% (by volumetric content), the composites have the best mechanical properties and resistance to salt spray corrosion. However, when the volume of BF content exceeds 0.10%, a large number of magnesium salt crystallization products are observed from the microscopic point of view, and the corrosion of the main strength phase of MOC is more serious. The prediction results of the GM(1, 1)-Markov model are highly identical with the raw data. In addition, using the change of RDME as a predictor, RDME is more sensitive to environmental factor compared to the change of mass. Predictions using the change of RDME as a threshold indicate that MOC-BF0.10 has the longest durability life, which is 836 days. The model is important to promote the application of MOC composites in the salt lake region and to promote the healthy development of green building materials.
Keywords: Basalt fiber; magnesium oxychloride cement; salt spray corrosion test; durability damage deterioration; GM(1; 1)-Markov model
The salt lake zone in Qinghai Lake Region of China covers a wide area. As an industrial by-product, a large amount of magnesium chloride accumulates around the salt lake, which has an adverse effect on the comprehensive utilization of resources and ecological environment. The corrosive ions in the salt lake are also easily caught in the air to form atmospheric salt spray, which seriously threatens the service life and safety of local construction materials. In order to effectively solve the problems of excessive magnesium resources and short service life of buildings in the western salt lake area, magnesium oxychloride cement (MOC) composite materials have gradually entered in the construction industry’s research perspectives [1,2]. MOC, as a magnesium gelling material composed of MgO-MgCl2-H20 system, has good resistance to brine corrosion without modification. MOC under suitable environment can adsorb CO2 efficiently to reduce carbon emission. Thus, promoting the use of MOC composites in the salt lake area can not only solve the problem of composites with abnormal durability due to salt corrosion, but it can also recycle magnesium slag and other wastes, reducing the negative impact of magnesium salt on the salt lake area’s production environment. Despite its many advantages, defects such as high brittleness, easy cracking, and low water resistance have limited MOC’s application and development [3–5]. The studies show that fiber is one of the effective methods to improve the properties of cementitious composites, especially to increase their crack resistance and toughness. Zheng et al. [6], Wang et al. [7], and Gomes et al. [8] used bamboo scrap fiber, straw fiber, and PVA fiber to reinforce MOC composites, respectively, which proved that the fiber improved the comprehensive properties of MOC. Basalt fiber (BF), as a new inorganic environment-friendly material with high performance, has natural advantages in reinforcing cementitious composites [9–11]. However, there are few relevant studies on the combination of BF and MOC.
The deterioration process of composite materials caused by environmental factors is always long [12]. Therefore, indoor accelerated tests of composite materials will be difficult to capture the specific moment of damage for each specimen due to time reasons. In order to accurately determine the failure time of composite materials, the durability life of composite materials can be predicted by mathematical methods combined with test data using a certain evaluation index as a threshold value [13,14]. The gray theory model (GM(1, 1)) can directly search for the internal correlation law of data from the original data series without considering relevant factors such as short data time series and incomplete information [15]. Markov chain theory can accurately capture the stochastic dynamic change process of data by studying the transfer probability between states to predict the next state of the object [16]. The combination of the above two models can eliminate accidental factors to the greatest extent and realize an accurate assessment of the durability life of composite materials in the salt lake region. In view of this, this study blended BF and MOC cement products to create an ultra-durable composite material that can be used as an engineering material for unreinforced construction. The GM(1, 1)-Markov model was established to explore the effect law of BF on composite materials under the effect of salt spray corrosion. On this basis, it will open up new research and application fields for MOC composites.
2.1 Materials and Mixture Proportions
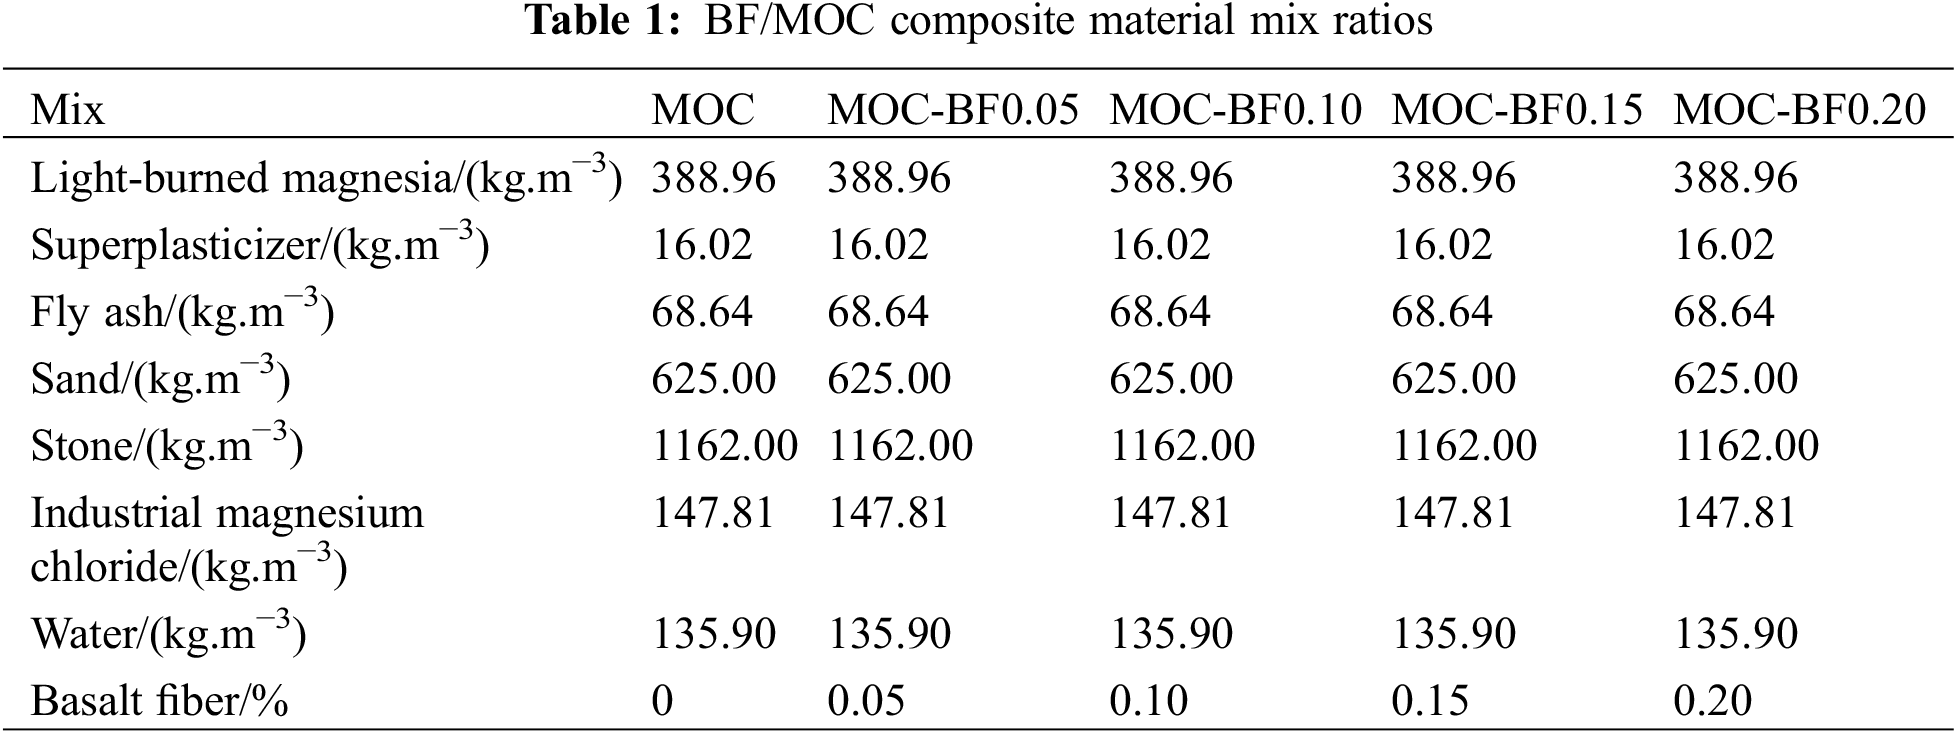
In this experiment, five mixing ratios (with basalt fiber volume content of 0%, 0.05%, 0.10%, 0.15%, 0.20%) were used for samples preparation, and they were named MOC, MOC-BF0.05, MOC-BF0.10, MOC-BF0.15, and MOC-BF0.20, see Table 1 for details. Based on the preliminary test results of the research group, the MgO/MgCl2 ratio was determined to be 6, allowing the MOC hydration product to generate a suitable physical image. Light burned magnesium oxide, industrial grade, having (by weight %) 85.96 MgO, 1.29 CaO, 6.03 SiO2, 1.28 Al2O3, 0.57 Fe2O3, and 4.87 loss on ignition, obtained from the Chaerhan Salt Lake Magnesium Chloride Factory (Qinghai, China). Magnesium chloride hexahydrate, industrial grade, and grade 1 fly ash came from Qinghai Jiayou Magnesium Industry Co., Ltd. (Gansu, China), while aggregates came from Qilianshan Commercial Concrete Co., Ltd. (Gansu, China), of which the fine aggregate being natural river sand with a fineness modulus of 2.73 and the coarse aggregate being crushed stone with an apparent density of 2,780 kg/m3. Water reducing agent, KD naphthalene system, with a water reduction rate of 34%, came from Subot New Materials, Ltd. (Jiangsu, China). Basalt fiber (BF), with 12 mm length, the equivalent diameter of 0.02 mm, elastic modulus of 100 GPa, and tensile strength of 4,500 MPa, came from Yongdeng County Xuanwu Mining Co, Ltd. (Gansu, China). The water was laboratory tap water, and it complies with the Chinese standard JGJ63-2006.
2.2 BF/MOC Composite Material Preparation
The specimen size of the BF/MOC composite was 100 × 100 × 100 mm3, which was prepared by using an HJW-60 mixer. The specific operations are as follows: (1) Configure a MgCl2 solution with a mass percentage of 23%; (2) Weigh the required magnesium oxide, fly ash, stone and sand, pour into the mixer, stir at a constant speed for the 30 s to make it evenly mixed, add the prepared an MgCl2 solution, and continue to stir for 30 s and stop; (3) Manually disperse and spread the BF into the mixer evenly, pour in the water reducing agent and water, control the mixing time, ensure the slump is 120 mm ± 5 mm; (4) After mixing the mixture, it was evenly poured into the test mold, which was removed after 24 h, and the mixture was dried and cured indoors for 28 days.
2.3 Performance Testing and Characterization
Referring to the Chinese standard GB/T 50081-2019, the mechanical strength of the specimens was measured by the WHY-3000 pressure testing machine after the specimens were cured. Among them, the testing machine was pressurized at a speed of 0.5 MPa/s to test the compressive strength and at 0.05 MPa/s to test the tensile strength, then the pressure at the time of specimen destruction was recorded.
Referring to the Chinese standard GB/T 50082-2009, the remaining specimens without mechanical testing were placed in the YSYW-60 salt water spray machine, as indicated in Fig. 1, for alternate dry and wet tests using the sprint-dry cycle system shown in Fig. 2. The ion content in the brine of the Chaerhan salt lake was determined by field investigation, and it was determined that the corrosion solution in this test was 23 g/L sodium sulfate solution. Before the start of the cycle test, a high-precision electronic balance was used to test the quality and the NM-4A ultrasonic tester was used to test the speed of sound, the actual measured data were used as the reference value. The durability test data were tested every 20 cycles, and the total number of test cycles was 360. The durability performance of concrete under different salt spray corrosion ages was evaluated by the mass change and the relative dynamic modulus of elasticity (RDME) change, which were calculated as follows:
where, M0 and Mt denote the initial mass and the mass at time t, kg, respectively; Mr is the change of mass, and when Mr reaches 95%, the test specimen is considered to have failure damage.
where, V0 and Vt denote the initial wave velocity and the wave velocity at time t, m/s, respectively; Er is the change of RDME, and when Er reaches 60%, the test specimen is considered to have failure damage.

Figure 1: Salt water spray machine
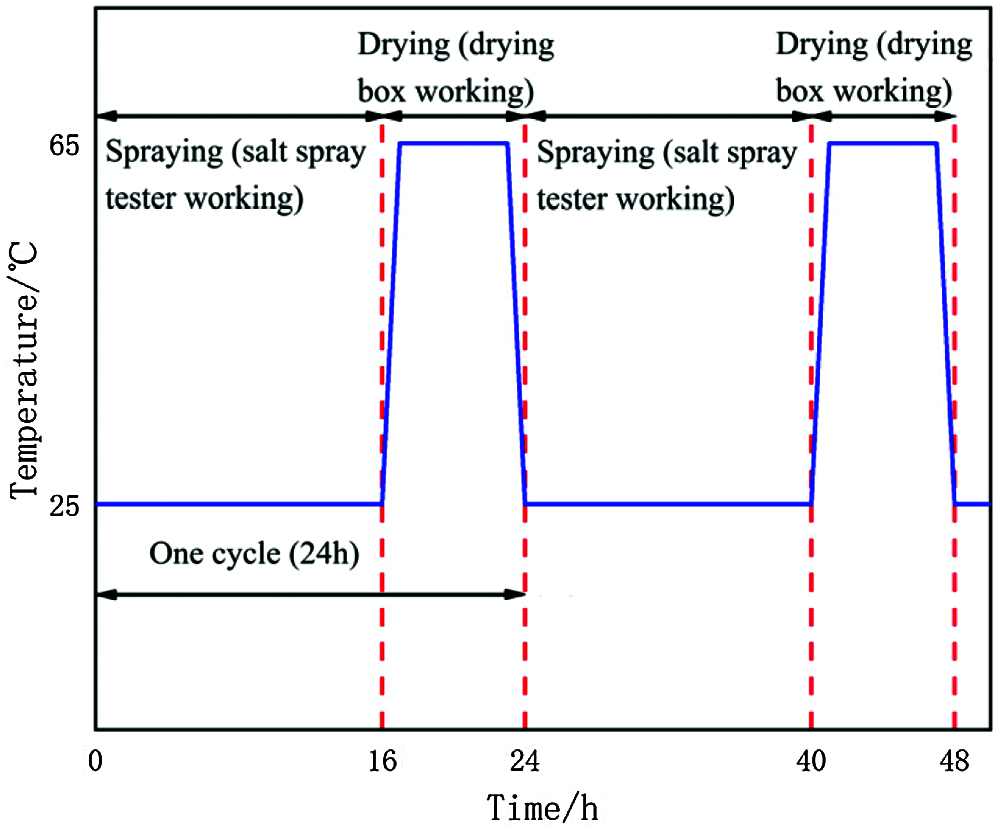
Figure 2: Spraying scheme
2.3.3 Scanning Electron Microscope (SEM) Analysis
After the whole test cycle, the BF/MOC composite material was used to make the specimens, and the microscopic morphology within the specimens was observed using a ZeissSigma 300 scanning electron microscope.
2.3.4 Fourier Transform Infrared (FT-IR) Analysis
After the whole experimental cycle, the infrared spectra of the BF/MOC composites to be tested were measured by KBr pressing, using a TENSOR 27 infrared spectrometer with a scanning range of 4000∼400 cm−1.
3.1 Mechanical Property Analysis
BF is a green healthy fiber with a high elastic modulus and fracture strength. Filling the pores in the internal structure of the composites with BF helps to promote the hydration reaction of MOC, which affects the composites’ strength. The basic mechanical properties of BF/MOC composites prepared with different BF contents were tested (Fig. 3). The incorporation of BF could significantly improve the tensile strength of MOC composites, and when the volume doping of BF was 0.10%, the tensile strength of this group of specimens was increased by 64.80% compared to the MOC group. This is because BF can form a completely reticulated stress structure in the internal space, which enhances the bonding force between the aggregates. When the composite matrix is subjected to tensile stress, the BF will cooperate with the matrix to bear the force, thereby improving the tensile strength. However, when the content of BF exceeds 0.10%, the excess BF will form a weak interface layer on the composite matrix’s surface, thereby destroying the optimal confined space structure, and the composite will be prone to bond splitting damage when subjected to tensile stress, resulting in a gradual decrease of the tensile strength improvement.

Figure 3: Basic mechanical properties of BF/MOC composite materials at 28 days
Compared with the tensile strength, the improvement of the compressive strength of MOC composites by BF was relatively limited. With the increase of fiber content, the compressive strength of the composites showed a trend of first increasing and then decreasing. When the BF content was 0.05% and 0.15%, the compressive strength of the two groups is almost equal. At the same time, when the BF content reaches 0.20%, the compressive strength of the MOC composites was even lower than that of the baseline specimens without fiber doping. This trend is consistent with the findings of Ramnath et al. [17–19]. The smooth and chemically inert surface of BF is easy to pull out when the matrix is subjected to large external forces, so the effect of enhancing the compressive strength of the material is limited. The coating thickness of the MOC colloid around the excessive volume content of BF was lowered, and this was insufficient to give the desired force transmission capacity, resulting a negative impact on compressive strength improvement. The tension-compression ratio is an important indicator of the brittleness and toughness of the composite materials. It can be seen that the BF/MOC tension-compression ratio was enhanced to different degrees when the BF admixture was increased from 0% to 0.20%. This indicates that BF can effectively improve the shortcomings of poor brittleness and low toughness of MOC composites. From the analysis of the damage mechanism, it can be seen that since the high tensile strength of BF up to 4,500 MPa and its elastic modulus up to 100 GPa, its embodied high toughness characteristics can play a role in restraining deformation and assisting force when the matrix is damaged. Macroscopically, the tension-compression ratio and tensile strength of BF/MOC composites are significantly improved compared to the MOC composites.
The main strength phases of MOC are Phase 5 (5MgO·MgCl2·8H2O) and Phase 3 (3MgO·MgCl2·8H2O), which are prone to decomposition under salt spray attack and loss of soluble components into the corrosive solution leading to mass reduction. Therefore, the mass change (Mr) can be used to measure the resistance of BF/MOC composites to salt spray corrosion. The mass change curves of the composites prepared with different BF doping were obtained by measurement (Fig. 4). From 0 day to 120 days, Mr showed a wave-like growth trend for each group of specimens. Thereafter, with the increase of the corrosion age, the BF/MOC composites of each group gradually entered a fluctuating decreasing phase. Without BF doping, the MOC composites reached the peak of Mr at 140 days, which is 100.51%. The BF with different content levels has a significant effect on the time and size of the peak of MOC composite Mr. At 160 days, the MOC-BF0.10 group showed a late and maximum peak of Mr growth to 101.03%. The early growth of Mr in BF/MOC composites has a fluctuating nature mainly related to two factors, one is that the main strength phase in MOC is continuously dissolved and generated in the salt spray and change dynamically, which makes the change of mass fluctuating. The second is that BF has a very strong resistance to acidic corrosion [20], and will not undergo qualitative changes due to the corrosion of SO42− in MOC wrapping, which can delay the corrosion effect of salt spray to provide space and time for MOC to generate more 5 phase. As the corrosion continues, the salt spray-drying cycle effect makes the retarding corrosion effect of BF reach its limit. The ability of MOC to generate the main strength phase gradually ceases, and the existing Phase 5 and Phase 3 are gradually dissolved. Therefore, in the late stage of the test, the Mr of each group of specimens declined simultaneously. Among them, Mr of the MOC-BF0.20 group was the most serious, which dropped to 98.11% at 360 days. Meanwhile, the Mr of the MOC group and the MOC-BF0.15 group are almost equal. This indicates that the doping of MOC composites with BF should not exceed 0.10%, and the excessive fibers are easy to form new defects by agglomerating inside the MOC matrix, accelerating the dissolution of Phase 5, and playing a negative role in the enhancement of Mr.
Figure 4: The mass change of different series of BF/MOC composite materials
The changing pattern of the RDME of the composites under salt spray corrosion environment reflects its physical properties. Therefore, the resistance of BF/MOC composites to salt spray corrosion was further verified by measuring the RDME change of composites prepared with different BF content (Fig. 5). Unlike the mass change, the RDME curves of each group of BF/MOC composites increased steadily in the early stage and then decreased steadily after reaching the peak. The fiber content continues to influence the time and magnitude of Er peak generation. On the 360 days, the Er degree of damage in descending order of each group was MOC-BF0.20>MOC > MOC-BF0.15>MOC-BF0.05>MOC-BF0.10. The Er of the MOC-BF0.10 group was measured to be 97.66% at the end of the cyclic test, which still had a strong durability performance. However, the MOC-BF0.20 group had the lowest Er measured at 360 days, which was only 85.66%, even lower than the MOC group. The Er of BF/MOC composite can continue to grow in the early stage. On the one hand, the Phase 3 and Phase 5 can interact with SO42− to generate an expansive crystalline magnesium salt compound Mg(OH)2·2MgSO4·2H2O [21]. This substance acts similarly to BF early on, filling the internal pores of the composite to increase the compactness, while retarding the corrosion of hydration products by salt spray. On the other hand, MgSO4 migrates to the surface of the MOC matrix through the capillaries and forms white frost crystals, which can retard the penetration of the corrosive liquid in the salt spray and cause a reduction in the corrosion of the composite. However, the generated Mg(OH)2, MgSO4 and other corrosion products have weak bonding properties. As the age of corrosion increases, the cumulative growth of corrosion products in the pores of the entire MOC slurry produces more uniform damage stresses leading to cracks in the composite material, and the propagation speed of ultrasonic waves weakens, and the Er value decreases. The appropriate amount of BF firmly connects the surrounding aggregates, so that the cemented structure does not become loose due to salt spray corrosion and remains dense. Therefore, when the volume content of BF is 0.10%, the Er decline trend of BF/MOC composite tends to be flat, and the best performance of salt spray corrosion resistance is achieved.
Figure 5: The RDME change of different series of BF/MOC composite materials
3.4 Interface Topography Analysis
BF mainly plays a filling role in this composite system and MOC plays a cementing role. During the test cycle of salt spray attack for nearly one year, more pores and cracks will be generated inside the aggregate, which will affect the durability performance of the composite. Therefore, the influence mechanism of BF on the durability performance of BF/MOC composite was explored by SEM to observe characteristics of microscopic morphology in BF/MOC composites (Fig. 6).

Figure 6: SEM images of BF/MOC composite materials. (a and b) MOC; (c) MOC-BF0.05; (d) MOC-BF0.10; (e) MOC-BF0.15; (f) MOC-BF0.20
In the MOC composite without BF, more pores and a small amount of Phase 5 were observed (Fig. 6a), and it can also be observed that the Phase 3 hydrolysis generates scaly Mg(OH)2 and accumulates in the Phase 3 debris matrix (Fig. 6b). From this, it can be inferred that the MOC group underwent severe corrosion. Meanwhile, the hydride phase of MOC was unstable under the action of salt spray in the late stage of the reaction and produced phase transition, which led to the damage of the composite material. The surface of the composite matrix doped with 0.05% BF had a large number of needle-like Phase 5 and gelled substances (Fig. 6c). It indicates that BF largely prevented the corrosive solution in the salt spray from entering the interior of the specimen through the pores, and has a good protective effect on the Phase 5 in the MOC. When the BF content is 0.10%, part of the fiber is directly pulled out from the matrix, and the remaining BF is embedded in the composite matrix aggregate, co-existing with the interfacial cracks and has a tighter microscopic spatial structure (Fig. 6d). No excessive magnesium salt crystal products were found at this content level, and the adhesion of the cemented interface with the MOC matrix was good, indicating that the salt spray had the worst corrosion effect on this group of specimens, which was consistent with the durability test conclusion. When the BF content was increased to 0.15%, there was a large amount of irregular granular material adhering to the fiber surface on the BF surface, and there were also sporadic visible coral-like magnesium salt crystals present (Fig. 6e). According to Wang et al. [22], the particulate matter is MgO that fails to participate in the hydration reaction. MgO will generate a large amount of Mg(OH)2 and MgSO4 under the performance of salt spray, which generates volume expansion and crystallization stress to crack the cementite structure. When the BF content reaches 0.20%, a large amount of flocculent magnesium salt crystalline compounds covers the surface of the MOC matrix, accompanied by Phase 5 debris making the microstructure hazy and blurred like a halo of muslin (Fig. 6f). This indicates that the excessive BF affected the normal hydration of MOC, and the fibers were not uniformly distributed in the MOC composites, which caused the agglomeration phenomenon to provide new channels for corrosive ion invasion and accelerated the damage and deterioration rate of BF/MOC composite materials, thus the salt spray corrosion was the most serious in this group.
Through FT-IR analysis of each group of specimens, the effect of BF on the physical phase composition of BF/MOC composites under salt spray corrosion environment was investigated (Fig. 7). The FT-IR spectra of MOC composites with different BF content were similar after 360 days of a salt spray corrosion (Fig. 7a). In the spectrum, the broad absorption peaks at 3,750∼3,550 cm−1 and 875∼460 cm−1 are mainly the absorption peaks of Phase 5 in MOC, while weak absorption peaks appear at 1,680∼1,560 cm−1. The stretching vibration peak of the non-aqueous hydroxyl group (-OH) in Phase 5 is at 3,614.46 cm−1. 1,604.71 cm−1 is associated with the -OH in the crystalline water of Phase 5 bending vibration peak; 1,461.98 cm−1 is the vibration absorption peak of free water. According to the FT-IR spectra, the main phase in BF/MOC composites is still Phase 5 at the end of the salt spray drying cycle test for almost one year. Relative to the MOC group without BF content, a part of the BF/MOC composites showed a shift in the absorption peak of the stretching vibration at 3685.82 cm−1 (Fig. 7b). When the BF content is increased from 0.05% to 0.10%, the shift toward the lower wave number increases and a significant red-shift phenomenon occurs. This shows that with a proper amount of BF content, the main strength phase of the composite is the Phase 5, and a certain amount of gelling material may be generated [23]. The resulting amorphous gel wraps around the surface of the Phase 5 crystal particles to form a protective layer, which isolates the contact of the salt spray corrosion solution to the Phase 5 crystal particles, thus enabling the Phase 5 to exist stably in the salt spray. This is consistent with the conclusion of the phenomenon explored by SEM.

Figure 7: The FT-IR patterns of different series of BF/MOC composite materials in salt spray corrosion for 360 days. (a) The wavenumber of 4,000∼400 cm−1; (b) The wavenumber of 3,800∼3,500 cm−1
4 GM(1, 1)-Markov Prediction Model
The results of the durability test show that the durability evaluation indicators Mr and Er of each group of specimens did not reach the failure standard. Therefore, in order to research the next durability trend of each group of specimens, it is necessary to use mathematical models to track and predict them. In order to investigate the law of system change and generate a strong regular data sequence, the GM(1, 1) model is used to clarify the dissimilarity degree trends between the system factors, and processing of the raw data. Then, the corresponding differential equation models are built to predict the future development trend of things. In this section, the durability indicator Er of MOC-BF0.10 is used as an example, and a prediction model for the life of the specimen under salt spray corrosion environment is established for the BF/MOC composite.
4.1 Traditional GM(1, 1) Modeling
The traditional GM(1, 1) model is a biased exponential model, which is modeled by the following steps:
According to the original non-negative data series X(0)(t) = (X(0)(1), X(0)(2), …, X(0)(n)), X(0)(t) ≥ 0, t = 1, 2, …, n, we can perform accumulative generating operation as in Eq. (3).
Then, the differential equation of the GM(1, 1) model is
For the parameters a and b in Eq. (4), let there exist parameter vectors:
Using the least squares method, the solution of the parameter vectors is written as
By substituting the solutions of parameter a and b into Eq. (4), the discrete time response equation of GM (1, 1) model can be obtained.
where a is the development coefficient, and b is the grey effect coefficient.
The response equation can be easily recovered from Eq. (8), and the predicted value of the GM(1, 1) model is shown as
The change in Er has a volatility of increasing and then decreasing. Introducing Markov chain into the GM(1, 1) model, and correcting its residuals is exactly the method to make full use of the advantages of Markov chain in predicting discrete, random and volatile events, and compensate for the lack of accuracy of the GM(1, 1) model. The corresponding calculation steps are as follows.
The residual error data set is obtained by subtracting the GM(1, 1) predicted values of Er from the raw values. Then, the residual error data set is
Following Steps (3)∼(5), the GM(1, 1) model based on residual error can be obtained as
For some regular information present in the residual errors, their states can be specified according to the Markov chain. When
where Pij is the transfer probability from state i to state j, Mij is the transition time from state i to state j, and Mi is the amount of data belonging to the i-th state.
The state probability transfer matrix can be derived from the state transfer probabilities as follows:
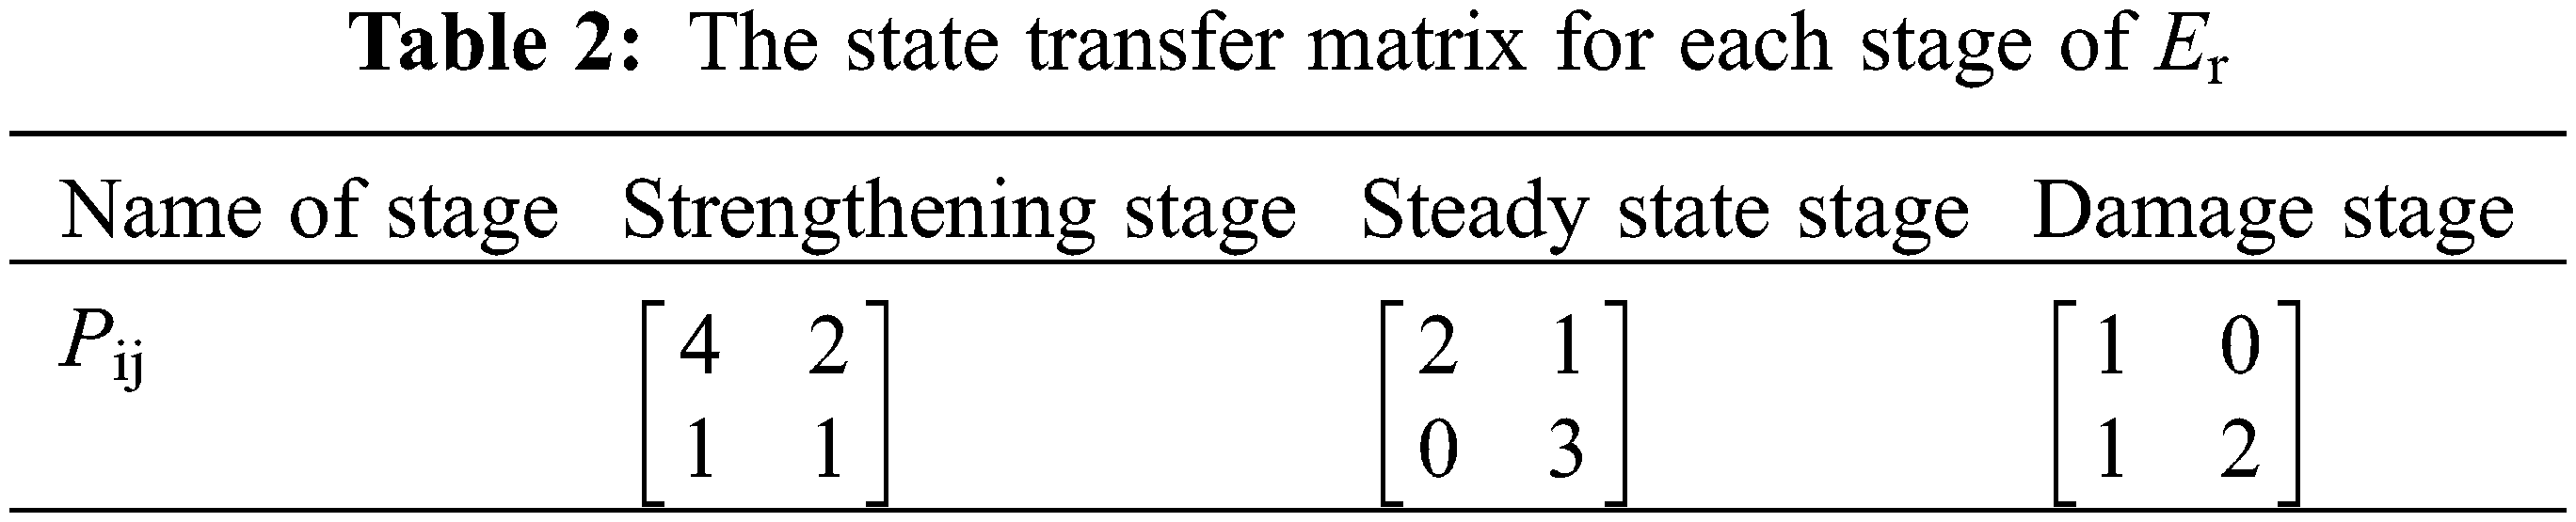
However, traditional Markov chains generally have variability in the values and states of the elements at different moments in the application process. Therefore, in order to make each moment satisfy the objective law of state change, it is necessary to divide the state region. The damage process of Er can be divided into three stages: strengthening stage, steady state stage and damage stage (Fig. 8), and the state transfer matrix of each stage is shown in Table 2.
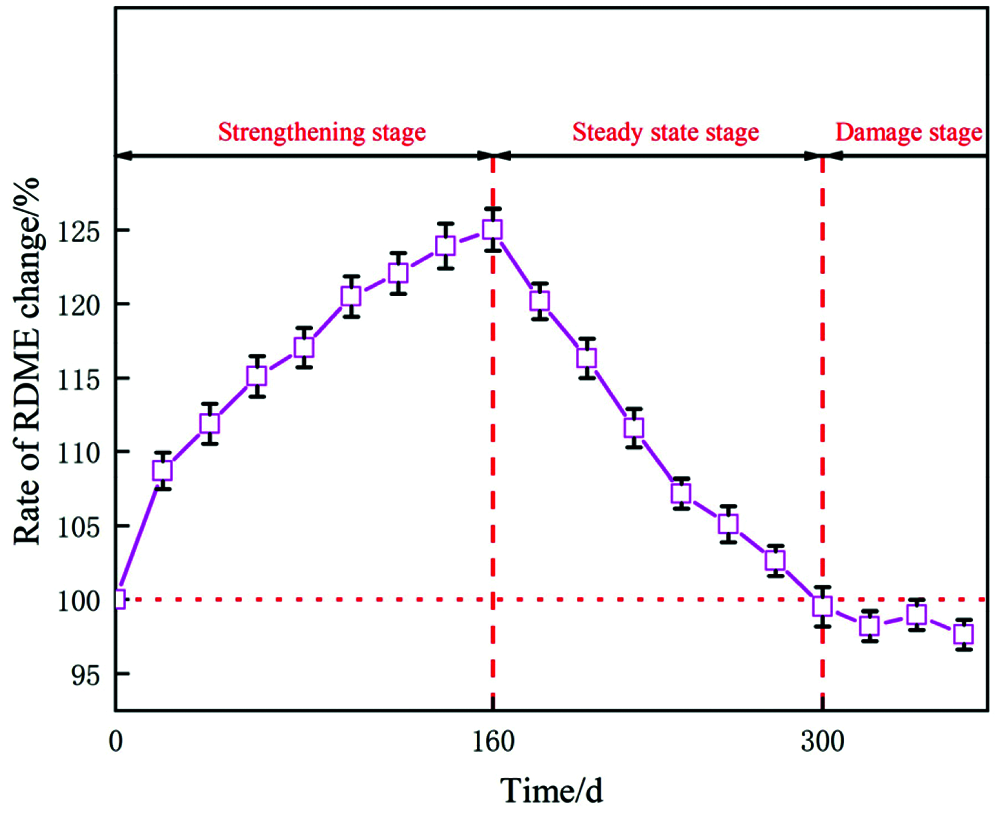
Figure 8: Division of each damage process stage of Er
4.3 Prediction Results Analysis
The Markov chain reveals the intrinsic law of residual errors transferring between states under the action of stochastic factors. Here, combined with the new state transfer probability matrix, the predicted value of the traditional GM(1, 1) model is modified, and the fitting results of the RDME change of MOC-BF0.10 group under salt spray corrosion are obtained (Fig. 9). The obtained fitting results show that the GM(1, 1)-Markov model fits extremely ideal , which is in highly identical with the raw data. However, the GM(1, 1) model cannot completely match the damage degradation process of the RDME in steady state stage and damage stage. In particular, the GM(1, 1)-Markov model fitting results can synchronous change with the raw data in the fluctuation falling section from 300 days to 360 days. The relative error in the full prediction interval is significantly lower than the GM(1, 1) fitting error. In view of this, for this sample of durability indicator data from the salt spray corrosion test, the GM(1, 1)-Markov model was used for more accurate prediction.
Figure 9: Fitting results of the RDME change for the MOC-BF0.10 group
To further understand the resistance of BF/MOC composites to salt spray attack, the RDME change and mass change of each specimen group were predicted by GM(1, 1)-Markov model (Figs. 10 and 11). As a whole, the RDME deterioration rate of the composite material under salt spray corrosion significantly exceeds the mass damage rate. However, the failure time of the MOC group was almost equal with the predicted results of the two durability evaluation indicators, and the service life was about 700 days. This was mainly due to the fact that in the damage stage, on the one hand, as the age of corrosion increases, Phase 5 and Phase 3 gradually convert to corrosion products leading to increasing porosity inside the composite, and this deterioration process will be sensitively captured by ultrasound. On the other hand, BF can share the expansion stress caused by corrosion products, and the BF/MOC composites fail to show considerable peeling and slagging on the cement-based surface like the reference group, resulting in the salt spray damage to the composite mass not being reflected in time. Therefore, the change of mass is not appropriate as a crucial degradation factor indicator for the life prediction modeling of BF/MOC composites. From the RDME prediction results, BF/MOC-0.10 group is the best mixture proportion for this test, with a durability life of 836 days under salt spray corrosion environment, which improves the service time by 136 days compared to the MOC group. This indicates that excessive BF is not conducive to maintaining the long-term durability performance of MOC composites, similar to the results in Section 3. Overall, the GM(1, 1)-Markov prediction model is suitable for a comprehensive evaluation and prediction of BF/MOC composites deterioration under this salt spray corrosion test, and the result of the prediction is of high precision.
Figure 10: Prediction results of RDME for each group based on GM(1, 1)-Markov model
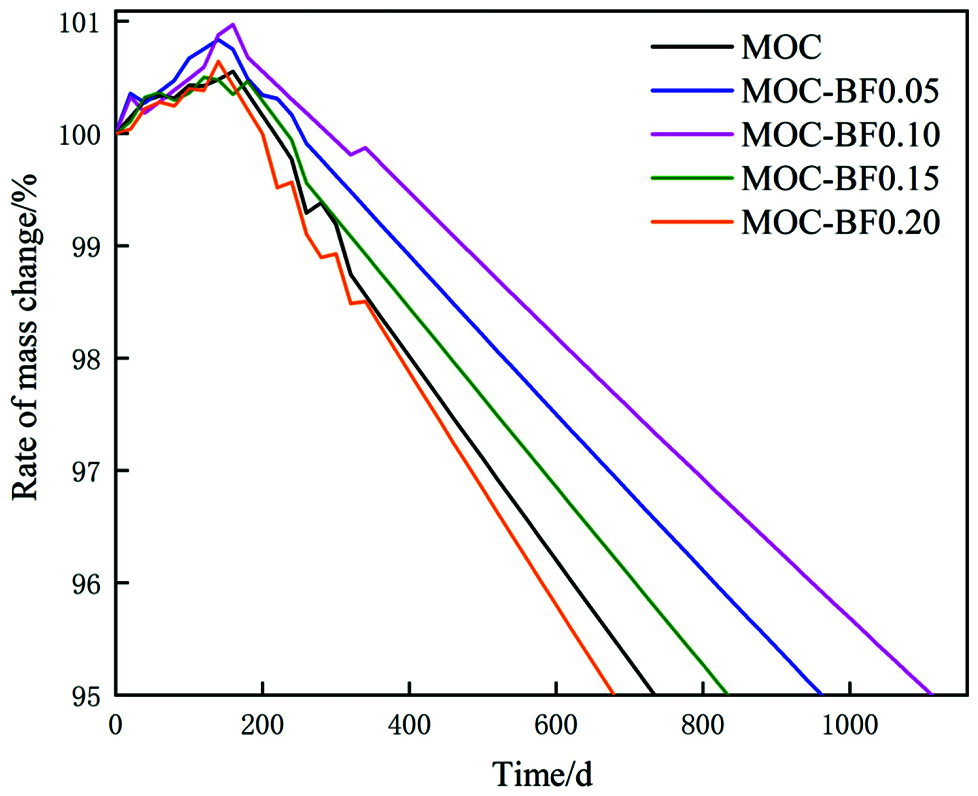
Figure 11: Prediction results of mass for each group based on GM(1, 1)-Markov model
In this paper, the basic mechanical properties of BF/MOC composites were investigated, and the durability performance of the composites with different volume of BF content was compared and analyzed by salt spray corrosion test. The following conclusions can be drawn:
1. The volume content of BF largely affects the mechanical and durability properties of BF/MOC composites. When the BF content is 0.10%, the BF/MOC composites reach the maximum tensile- compressive ratio and the minimum amount of mass and RDME damage. When the BF content exceeds 0.10%, the durability performance of BF/MOC composites decreases with the increase of fiber content.
2. Both SEM analysis and FT-IR analysis showed that BF was resistant to salt spray corrosion. At 360 days, the BF/MOC composites still had a large number of Phase 5 and cemented structures. This further explains the resistance to sulfate attack exhibited by the BF/MOC composites. When the BF content exceeds 0.10%, the BF will appear agglomeration phenomenon. Thus, the ability of BF in the Pro>s Pro> Pro>t Pro> Pro>r Pro> Pro>e Pro> Pro>n Pro> Pro>g Pro> Pro>t Pro> Pro>h Pro> Pro>e Pro> Pro>n Pro> Pro>i Pro> Pro>n Pro> Pro>g Pro> phase of MOC composites is gradually lost.
3. The GM(1, 1)-Markov model can provide reliable prediction results in the prediction research of salt spray corrosion test, which provides a new idea and a new approach for the service life prediction of composite materials.
Funding Statement: The authors gratefully acknowledge the financial support provided by National Natural Science Foundation of China (Grant Nos. 52178216, 51868044).
Conflicts of Interest: The authors declare that they have no conflicts of interest to report regarding the present study.
1. Jorge, O., Austin, C. H., Gregory, L. (2021). Sintering of 3D printable simulated lunar regolith magnesium oxychloride cements. Acta Astronautica, 183, 227–232. DOI 10.1016/j.actaastro.2021.03.016. [Google Scholar] [CrossRef]
2. Wang, P. H., Qiao, H. X., Zhang, Y. S., Li, Y. K., Chen, K. F. et al. (2020). Three-dimensional characteristics of steel corrosion and corrosion-induced cracks in magnesium oxychloride cement concrete monitored by X-ray computed tomography. Construction and Building Materials, 246, 118504. DOI 10.1016/j.conbuildmat.2020.118504. [Google Scholar] [CrossRef]
3. Wang, Y. C., Wei, L. Z., Yu, J. T., Yu, K. Q. (2019). Mechanical properties of high ductile magnesium oxychloride cement-based composites after water soaking. Cement and Concrete Composites, 97, 248–258. DOI 10.1016/j.cemconcomp.2018.12.028. [Google Scholar] [CrossRef]
4. Tang, S. W., Hu, Y., Ren, W., Yu, P., Huang, Q. et al. (2019). Modeling on the hydration and leaching of eco-friendly magnesium oxychloride cement paste at the micro-scale. Construction and Building Materials, 204, 684–690. DOI 10.1016/j.conbuildmat.2019.01.232. [Google Scholar] [CrossRef]
5. Chen, X. Y., Zhang, T. T., Bi, W. L., Cheeseman, C. (2019). Effect of tartaric acid and phosphoric acid on the water resistance of magnesium oxychloride (MOC) cement. Construction and Building Materials, 213, 528–536. DOI 10.1016/j.conbuildmat.2019.04.086. [Google Scholar] [CrossRef]
6. Zheng, L., Wu, Y., Wang, S., Sheng, G., Sun, B. et al. (2021). Effect of the proportion of bamboo scraps on the properties of bamboo scraps/Magnesium oxychloride composites. Journal of Renewable Materials, 9(10), 1729–1739. DOI 10.32604/jrm.2021.015143. [Google Scholar] [CrossRef]
7. Wang, J., Wang, S., Zuo, Y. F., Xiao, J. H., Wu, Y. Q. (2021). Construction of compatible interface of straw/magnesium oxychloride lightweight composites by coupling agents. Construction and Building Materials, 281, 122600. DOI 10.1016/j.conbuildmat.2021.122600. [Google Scholar] [CrossRef]
8. Gomes, C. M., Garry, A., Freitas, E., Bertoldo, C., Siqueira, G. (2020). Effects of rice husk silica on microstructure and mechanical properties of magnesium-oxychloride fiber cement (MOFC). Construction and Building Materials, 241, 118022. DOI 10.1016/j.conbuildmat.2020.118022. [Google Scholar] [CrossRef]
9. Tran, T. T., Pham, T. M., Huang, Z. J., Chen, W. S., Hao, H. et al. (2021). Impact response of fibre reinforced geopolymer concrete beams with BFRP bars and stirrups. Engineering Structures, 231, 111785. DOI 10.1016/j.engstruct.2020.111785. [Google Scholar] [CrossRef]
10. Dong, Z. Q., Sun, Y., Wu, G., Zhu, H., Zhao, X. L. et al. (2021). Flexural behavior of seawater sea–sand concrete beams reinforced with BFRP bars/grids and BFRP-wrapped steel tubes. Composite Structures, 268, 113956. DOI 10.1016/j.compstruct.2021.113956. [Google Scholar] [CrossRef]
11. Li, Z. Z., Zhu, H. T., Du, C. X., Gao, D. Y., Yuan, J. S. et al. (2021). Experimental study on cracking behavior of steel fiber-reinforced concrete beams with BFRP bars under repeated loading. Composite Structures, 267, 113878. DOI 10.1016/j.compstruct.2021.113878. [Google Scholar] [CrossRef]
12. Neto, J., Queiroz, H., Aguiar, R., Lima, R., Cavalcanti, D. et al. (2022). A review of recent advances in hybrid natural fiber reinforced polymer composites. Journal of Renewable Materials, 10(3), 561–589. DOI 10.32604/jrm.2022.017434. [Google Scholar] [CrossRef]
13. Liu, G., Wang, M., Yu, Q., Li, Q., Wang, L. (2021). Effect of alkaline electrolyzed water on performance improvement of green concrete with high volume of mineral admixtures. Journal of Renewable Materials, 9(11), 2051–2065. DOI 10.32604/jrm.2021.015398. [Google Scholar] [CrossRef]
14. Moya, R., Fallas-Valverde, L., Berrocal, A., Méndez-Álvarez, D. (2017). Durability of thermally modified wood of gmelina arborea and tectona grandis tested under field and accelerated conditions. Journal of Renewable Materials, 5(3–4), 208–219. DOI 10.7569/JRM.2017.634111. [Google Scholar] [CrossRef]
15. Khuman, A. S. (2021). The similarities and divergences between grey and fuzzy theory. Expert systems with applications. Expert Systems with Applications, 186, 115812. DOI 10.1016/j.eswa.2021.115812. [Google Scholar] [CrossRef]
16. Cheng, Z. W., Mao, Y. H. (2021). Variational formula of capacity for asymmetric Markov chains. Statistics & Probability Letters, 179, 109230. DOI 10.1016/j.spl.2021.109230. [Google Scholar] [CrossRef]
17. Ramnath, V., Elanchezhian, C., Aravind, J., Sushil, L., Kumar, A. (2018). Studies on mechanical behaviour of basalt fiber composite. IOP Conference Series: Materials Science and Engineering, 377, 012119. DOI 10.1088/1757-899X/377/1/012119. [Google Scholar] [CrossRef]
18. Mutalikdesai, S., Vani, R., Bhandari, A., Aishwarya, J. Y. (2021). Mechanical characterization of Mmt nano clay/epoxy/basalt fiber composites. IOP Conference Series: Materials Science and Engineering, 1065, 012026. DOI 10.1088/1757-899X/1065/1/012026. [Google Scholar] [CrossRef]
19. Zhao, L., Sun, S., Qi, W. (2020). Study on the mechanical properties of steel - basalt fiber composite reinforcement (SBFCBs). E3S Web of Conferences, 165, 05028. DOI 10.1051/e3sconf/202016505028. [Google Scholar] [CrossRef]
20. Ren, D. M., Yan, C. J., Duan, P., Zhang, Z. H., Li, L. Y. et al. (2017). Durability performances of wollastonite, tremolite and basalt fiber-reinforced metakaolin geopolymer composites under sulfate and chloride attack. Construction and Building Materials, 134, 56–66. DOI 10.1016/j.conbuildmat.2016.12.103. [Google Scholar] [CrossRef]
21. Zheng, L., Zuo, Y. F., Li, P., Wang, S., Sheng, G. A. et al. (2021). Construction of homogeneous structure and chemical bonding in bamboo scrap/magnesium oxychloride composites by polycarboxylate superplasticizer. Journal of Materials Research and Technology, 12, 2257–2266. DOI 10.1016/j.jmrt.2021.04.039. [Google Scholar] [CrossRef]
22. Wang, P. H., Qiao, H. X., Zhang, Y. S., Li, Y. K., Feng, Q. et al. (2020). Meso-damage evolution analysis of magnesium oxychloride cement concrete based on X-CT and grey-level co-occurrence matrix. Construction and Building Materials, 255, 119373. DOI 10.1016/j.conbuildmat.2020.119373. [Google Scholar] [CrossRef]
23. Benalia, A., Derbal, K., Khalfaoui, A., Pizzi, A., Medjahdi, G. (2022). The use of as natural coagulant in algerian drinking water treatment plant. Journal of Renewable Materials, 10(3), 625–637. DOI 10.32604/jrm.2022.017848. [Google Scholar] [CrossRef]
 | This work is licensed under a Creative Commons Attribution 4.0 International License, which permits unrestricted use, distribution, and reproduction in any medium, provided the original work is properly cited. |