
 Submit a Paper
 Propose a Special lssue
 Open Access
ARTICLE

Optimizing Hybrid Fibre-Reinforced Polymer Bars Design: A Machine Learning Approach
1 School of Civil Engineering, Zhengzhou University, Zhengzhou, 450001, China
2 College of Civil Engineering, Tongji University, Shanghai, 200092, China
* Corresponding Author: Pu Zhang. Email:
Journal of Polymer Materials 2024, 41(1), 15-44. https://doi.org/10.32604/jpm.2024.053859
Received 11 May 2024; Accepted 06 June 2024; Issue published 21 June 2024
 View Full Text
 Download PDF
Abstract
Fiber-reinforced polymer (FRP) bars are gaining popularity as an alternative to steel reinforcement due to their advantages such as corrosion resistance and high strength-to-weight ratio. However, FRP has a lower modulus of elasticity compared to steel. Therefore, special attention is required in structural design to address deflection related issues and ensure ductile failure. This research explores the use of machine learning algorithms such as gene expression programming (GEP) to develop a simple and effective equation for predicting the elastic modulus of hybrid fiber-reinforced polymer (HFPR) bars. A comprehensive database of 125 experimental results of HFPR bars was used for training and validation. Statistical parameters such as R, MAE, RRSE, and RMSE are used to judge the accuracy of the developed model. Also, parametric analysis and SHAP analysis have been carried out to reveal the most influential factors in the predictive model. Finally, the proposed model was compared to the available equations for elastic modulus. The results demonstrate that the developed GEP model performance is better than that of the traditional formula. Statistical parameters and K-fold cross-validation ensured the accuracy and reliability of the predictive model. Finally, the study recommends the optimal GEP model for predicting the elastic modulus of HFRP bars and improving the structural design of HFRP.Keywords
List of Nomenclature
| FRP | Fiber Reinforced Polymer |
| HFRP | Hybrid Fiber Reinforced Polymer |
| GEP | Gene Expression Programming |
| RMSE | Root Mean Squared Error |
| MAE | Mean Absolute Error |
| RRSE | Root Relative Squared Error |
| R2 | Coefficient of Determination |
| CFRP | Carbon Fiber Reinforced Polymer |
| GFRP | Glass Fiber Reinforced Polymer |
| BFRP | Basalt Fiber Reinforced Polymer |
| AFRP | Aramid Fiber Reinforced Polymer |
| ML | Machine Learning |
| ROM | Rule of Mixture |
| RoHM | Rule of Hybrid Mixtures |
| GP | Genetic Programming |
| GF % | Percentage of Glass Fiber |
| E-GF | Elastic Modulus of Glass Fiber |
| CF % | Percentage of Carbon Fiber |
| E-CF | Elastic Modulus of Carbon Fiber |
| BF % | Percentage of Basalt Fiber |
| E-BF | Elastic Modulus of Basalt Fiber |
| MoE | Modulus of Elasticity |
| ET | Expression Tree |
| cos | Cosine |
| sin | Sine |
| ln | Natural Logarithm |
| + | Addition |
| − | Subtraction |
| * | Multiplication |
| / | Division |
| % | Percentage |
| avg | Average |
| kN.m | KiloNewtons.Metre |
| mm | Millimeter |
| MPa | Megapascal |
| GPa | Gigapascal |
| bj | Bias |
| Ec | FRP Bars Modulus of Elasticity |
| fr | FRP Bars Tensile Strength |
| K-FCV | K-Fold Cross Validation |
| f’c | Concrete Compressive strength |
| EHybrid | Modulus of Hybrid Material |
| E11,fi | Young’s Modulus of Fibers |
| Vfi | Volume Fraction of Fibers |
| Em | Young’s Modulus of Matrix |
| Vm | Volume Fraction of Matrix |
| CO2 | Carbon Dioxide |
| °C | Degree Celsius |
| Pi | Predictive Value |
| Ti | Target Value |
| Infinity | |
| CV | Cross Validation |
Concrete has high brittleness and low tensile capacity [1]. The introduction of waste materials in concrete provides better durability and strength [2] but still needs to improve tensile reinforcement. Steel reinforced are used to improve the tensile capacity of concrete and ductility. However, reinforced concrete structures have faced various challenges, including steel corrosion, freezing damage in cold climates, and exposure to physical and chemical factors in corrosive conditions [3–6]. In humid environments, air pollutants penetrate through the concrete cover and cause steel reinforcement corrosion. The corrosion of steel within the reinforced concrete results in the expansion of steel, leading to internal cracking, surface cracking, spalling, and failure as shown in Fig. 1 [7].
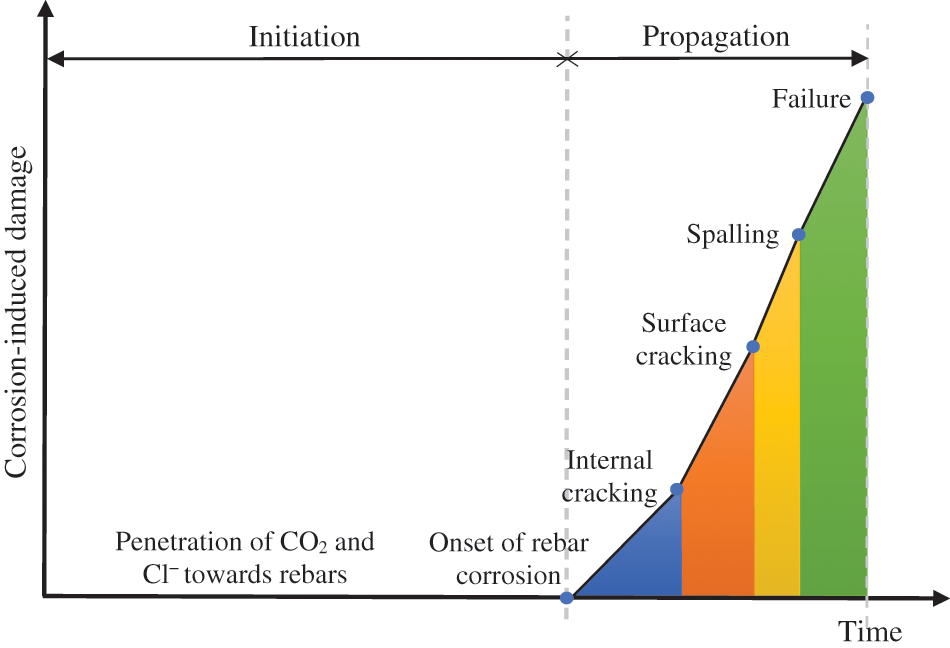
Figure 1: Conceptual model of rebar corrosion process [7]
The reinforcements become exposed to direct environmental attack which accelerates corrosion. The corrosion decreased the overall load-bearing capacity of the structures due to decreased bonds between the steel and concrete. The deterioration not only compromises the structural performance but also demands costly repairs and maintenance [8]. A study also noted that the corrosion of steel strands significantly the serviceability of prestressed concrete structures [9]. Similarly, a study [10] noted that fiber rope has many advantages as compared to steel in marine engineering. Therefore, it is necessary to adopt alternative materials as a solution to overcome the corrosion-related problems of traditional reinforcement. The research proposed different ways to decrease the corrosion of steel. A practical solution involves substituting steel bars with non-corrosive reinforcement materials such as fiber-reinforced polymer (FRP) bars.
Fiber-reinforced polymer (FRP) composites are creative and innovative ideas for addressing the growing problem of infrastructure [11]. FRP bars are promising alternative bars to steel reinforcement due to their high corrosion resistance and high strength properties [12]. Furthermore, FRP (carbon fiber-reinforced polymer) also improved seismic performance [13]. Studies show the anti-degradation performance of FRP bars in corrosive environments. Guo et al. [14] studied the degradation of carbon fiber-reinforced polymer (CFRP), glass fiber-reinforced polymer (GFRP), and basalt fiber-reinforced polymer (BFRP) in sea sand concrete. Results showed CFRP has the highest durability, followed by GFRP, BFRP, and steel. Li [15] explored CFRP and GFRP bars as replacements for steel reinforcement in sea sand concrete. The test findings indicated that the addition of CFRP greatly improves the shear capacity of beams without shear reinforcement, exceeding its effect on beams with appropriate shear reinforcement [16]. The study revealed differing corrosion resistance due to resin matrix dissolution in FRP bars. However, FRP bars demonstrate superior corrosion resistance to steel bars. Nevertheless, FRP bars have a lower elastic modulus than steel bars, and their brittleness is typically caused by their linear stress-strain behavior. Abdalla [17] developed simple methods to estimate deflection in FRP-reinforced concrete members under flexural stress, highlighting the brittle behavior of CFRP-reinforced beams. Ferreira et al. [18] analyzed simply supported concrete beams reinforced with composite rebars, comparing the effects of reinforcement with composite and steel rebars on concrete. A study [19] reported that hybrid fiber-reinforced concrete (HFRC) shows better performance in terms of tensile and flexural capacity. Recently, GFRP bars have been utilized in various structural elements to investigate their behavior. Chaallal et al. [20] investigated the glass-fiber plastic rods as rebars in concrete structures, focusing on rod characterization, bond performance, and flexural behavior in concrete beams. Results indicate satisfactory performance of concrete beams with glass-fiber rebars compared to steel rebars. However, more cracking under moderate to high loading was observed. Numerous investigations on concrete beams reinforced with FRP bars have been carried out [21–24], and it has been found that using FRP bars enhanced the durability of FRP-reinforced structures [25–27]. However, FRP-reinforced structures often exhibit lower serviceability due to the lower modulus of elasticity and reduced ductility of FRP compared to those reinforced with steel bars [28,29].
The types of FRP bars that are commercially available are CFRP, GFRP, BFRP, and aramid (AFRP). Each FRP bar possesses distinct tensile strength, Young’s modulus, ductility, and other characteristics depending on the type of fiber used [30]. Certain types of bars are relatively expensive to produce, and other varieties do not meet the strength requirements. The development of hybrid fiber-reinforced polymer (HFRP) bars presents an optimal solution. HFRP bars have shown significant attention due to their potential for enhanced mechanical properties.
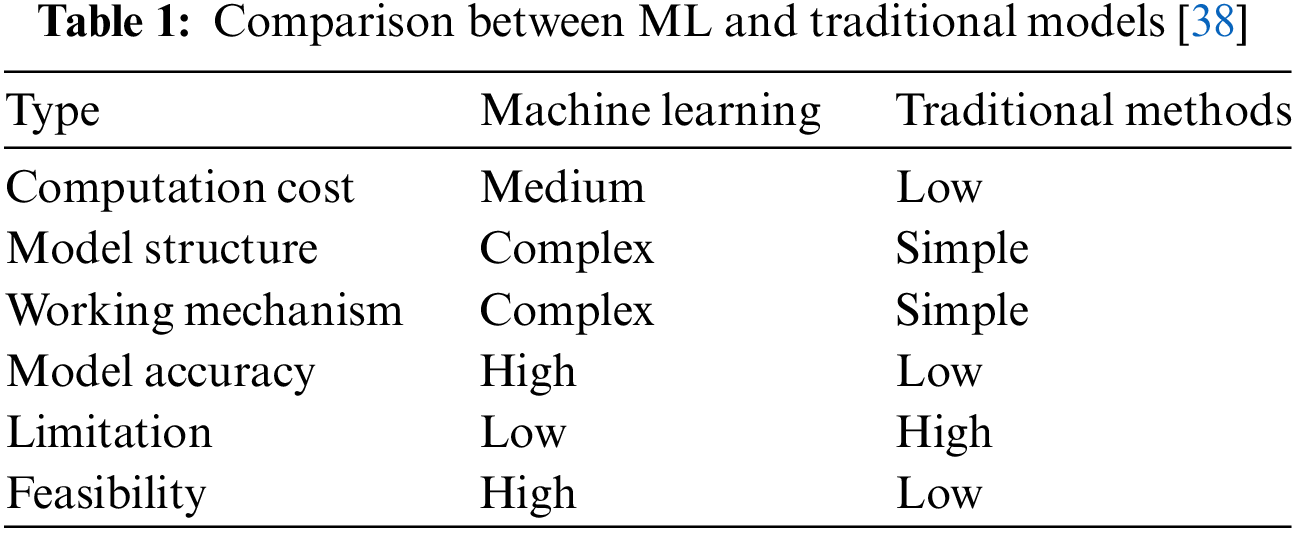
Previous researches Hayashi [31], Belarbi et al. [32], and Ali et al. [33] have highlighted the importance of achieving specific characteristics in HFRP bars, particularly ductility under tensile load and variation of the modulus of elasticity through hybrid fiber configurations. However, experimental studies Bakis et al. [34], Cui et al. [35], You et al. [36], and Harris et al. [37] suggest that more efficient and cost-effective methods are required to optimize the design of HFPR bars. Table 1 [38] illustrates a comparison between machine learning (ML) models and traditional methods, focusing on different aspects such as computational cost, working mechanism, and model applicability. Studies [39–41] reported that ML is a cheaper, more efficient, and alternative approach to the traditional approach.
To optimize cost and time efficiency in the construction industry, ML techniques are being increasingly used to precisely predict various properties [42]. A study [43] concluded that the random forest model shows better accuracy than the back propagation neural network (BPNN) ML model. A study [44] applied machine learning approaches, such as adaptive neuro-fuzzy inference systems (ANFIS), artificial neural networks (ANN), and gene expression programming (GEP), to forecast the compressive strength (CS) of steel fiber-reinforced concrete (SFRC) under high temperatures. The findings indicate that the GEP model has high accuracy and the lowest error in comparison to the ANN and ANFIS models. However, a study [45] predicted the split tensile strength of fiber-reinforced recycled aggregate concrete. Five prediction models namely two deep neural network models (DNN1 and DNN2), one optimizable Gaussian process regression (OGPR) model, and two genetic programming-based models (GEP1 and GEP2) are apply for analysis. The results indicate that all the models demonstrated high accuracy in predicting split tensile strength. The DNN2 model shows highest R² value 0.94, while the GEP1 model shows lowest R² value 0.76. The R² value of the DNN2 model was 3.3% and 13.5% greater than the R² values of the OGPR and GEP2 models, respectively. Therefore, a more detailed study is required on GEP to improve its accuracy.
Traditional regression models show lower computational costs due to their dependence on individual parameters for accuracy. However, several factors like hyperparameter tuning and model structure impact the predictive performance of ML models. These factors increase the computational cost and complexity of work than traditional methods. However, traditional models primarily rely on individual sample fittings, resulting in significantly lower prediction accuracy than ML models. Therefore, this study focuses on utilizing GEP, an advanced machine learning technique, to develop HFRP bars that can fill the gap by providing a systematic approach to design optimization, potentially offering improvements in mechanical performance, cost-effectiveness, and time efficiency compared to traditional experimental methods. The proposed approach reduces the limitations of conventional methods and offers an advanced methodology for predicting mechanical properties which bridge the gap between theory and practice. Integrating machine learning techniques into materials science holds significant potential for future advancements in structural design and engineering optimization.
The methodology of this research is described in this section and the steps can be visualized in Fig. 2. Initially, the data was collected from previous published research articles and influential variables were defined. Afterward, the collected data underwent screening to process in which dependent and independent variables statistical analysis is conducted. For the utilization of ML approaches, the data was split into training and testing datasets. Subsequently, GEP algorithms were then employed to develop a highly accurate predictive model, and the best models were selected based on statistical parameters. Validation of the model was carried out. Furthermore, the proposed model was compared with the traditional method to assess robustness and accuracy. The conclusion recommends the most accurate model based on the comprehensive evaluation.
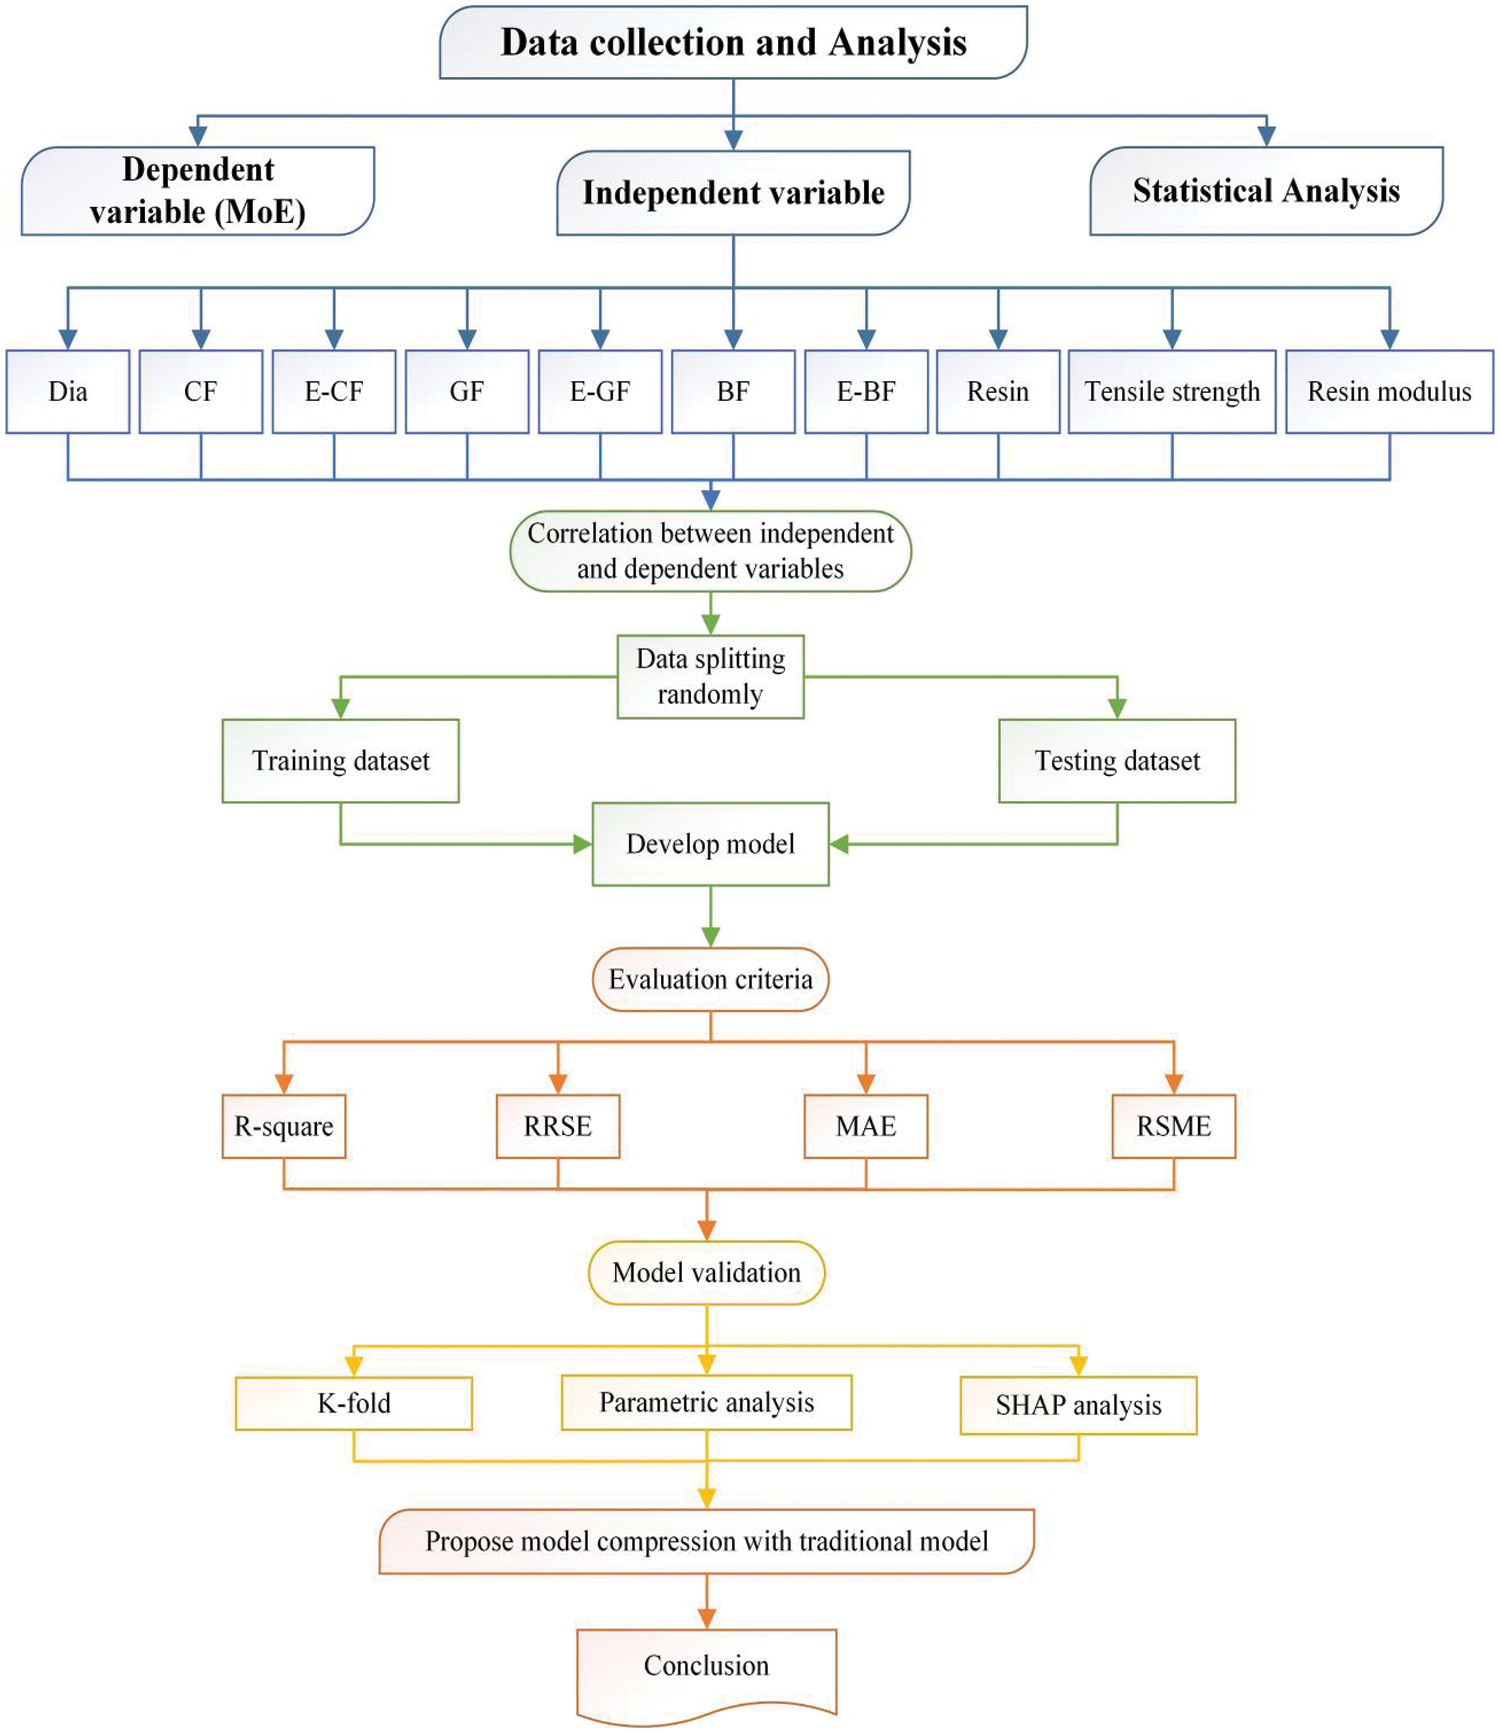
Figure 2: Research methodology
3 Existing Analytical Approach
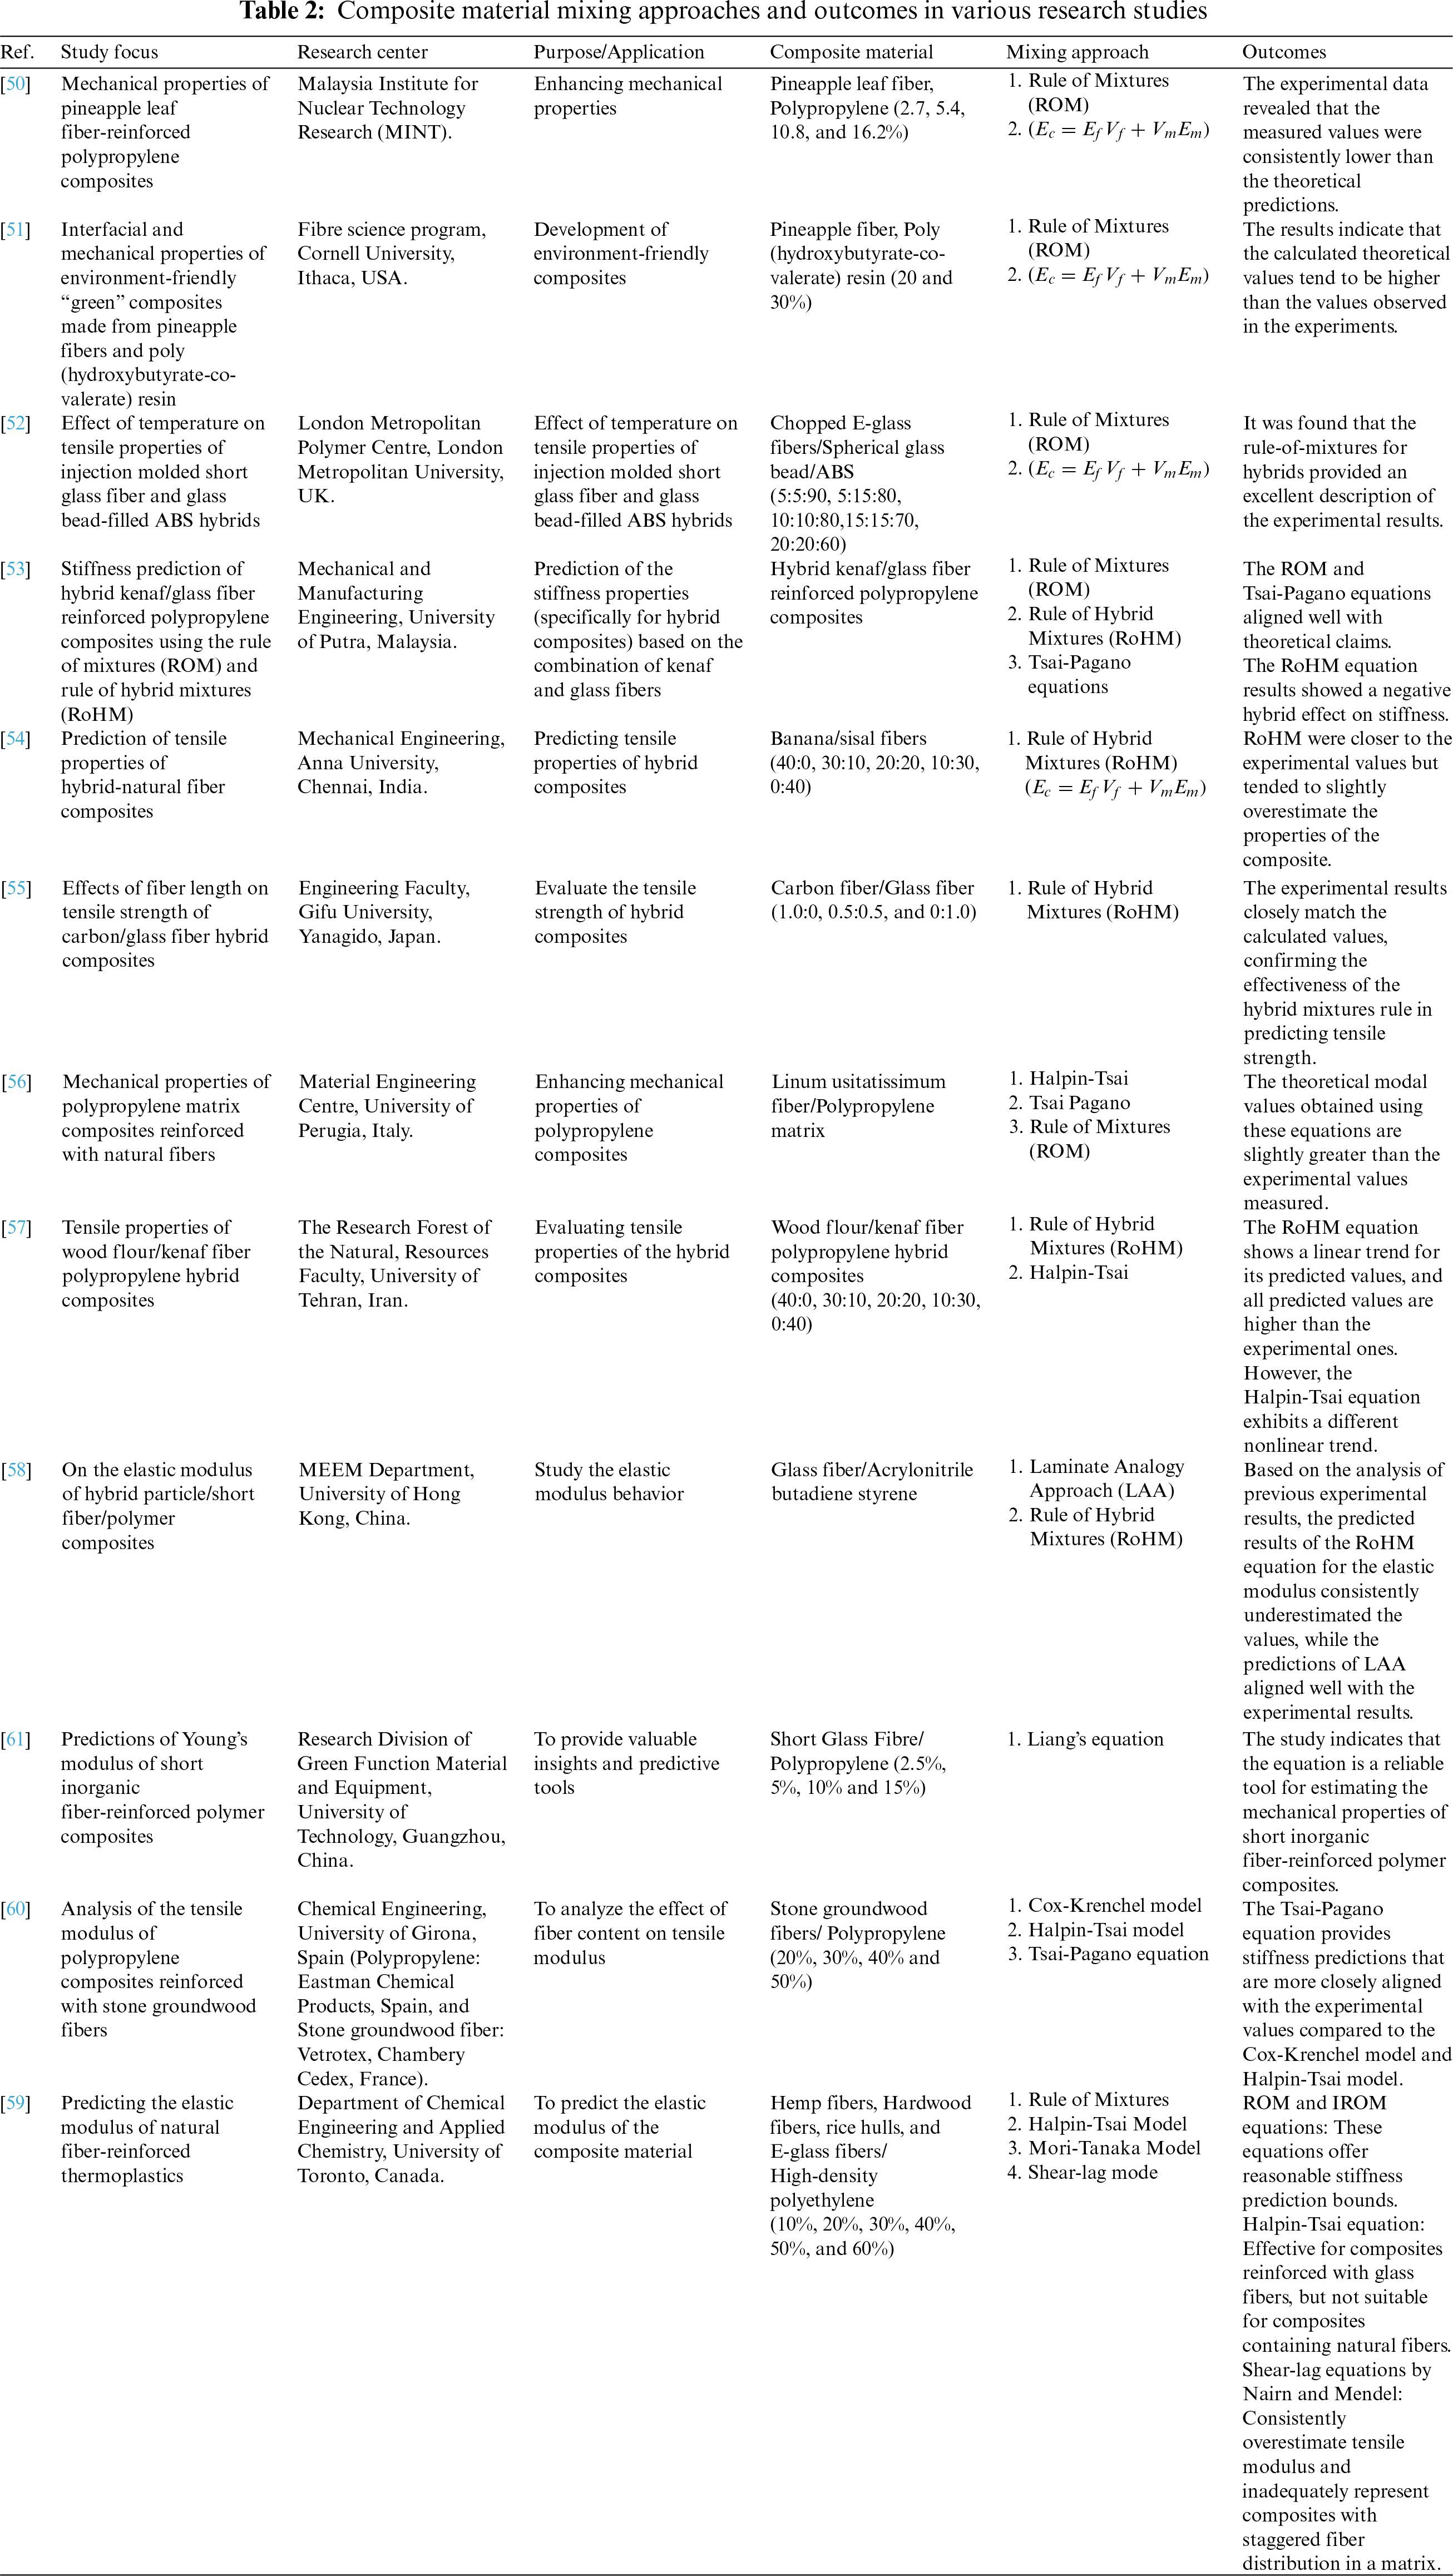
There are various micromechanical models available in literature with differing accuracy and complexity including Halpin Tsai and rule of mixture (ROM) models. The ROM models are more often utilized as it is relatively simple and yield acceptable prediction values compared to experimental values. Andersons et al. [46] investigated the strength and stiffness of flax fiber composite under uniaxial tension using thermoset and thermoplastic polymer matrices. The study assesses the suitability of orientational averaging-based models and ROM models, originally developed for short fiber composites, to flax-reinforced polymer. Affdl et al. [47] concluded that the Halpin-Tsai equation is preferred for predicting the accuracy of short random fiber composites. Sandier et al. [48] studied the Cai-Pagano equation, which determines longitudinal and transverse modulus to assess composite stiffness, concluding that mixing rules for equations of state enables accurate predictions. Tham et al. [49] have conducted a detailed study on the ROM models, concluding that they assume homogeneity and neglect variations, interfacial effects, and non-linear behavior, thereby indicating limitations in accurately predicting composite properties. Eq. (1) presents the mathematical model of ROM used to estimate the mechanical properties of composite materials based on their individual components’ properties.
where E11 is Young’s modulus of fibers along the longitudinal axis;
4 Gene Expression Programming (GEP)
Genetic Algorithms (GA) are optimization and search algorithms inspired by genetics [62–65] Genetic Programming (GP) was developed by Cramer in 1985 and enhanced by Koza [66,67]. In GP, an initial population of programs with terminals and functions is provided. Functions play a crucial role in program excitation and defining terminals [68,69]. GEP introduced by Candida Ferreria mimics living organisms and involves generating complex tree-like structures/models. GEP considers input variable shapes, compositions, and sizes to search for optimal solutions. It leverages computational intelligence and genetic programming principles rooted in Darwin’s and Mendel’s theories [70,71].
In GEP, a linear chromosome encodes multiple computer programs, offering advantages like accurate predictive models and robust mathematical expressions [72]. In civil engineering, GEP models are increasingly popular for predictive equations, utilizing generated mathematical formulas. GEP has been successfully applied in structural engineering, predicting concrete parameters [73–77] strength characteristics of steel slag [78], prediction of compression strength of geopolymer concrete [79], determining the nominal shear capacity of steel fiber beam [80], etc. Additionally, GEP modeling is widely used for predicting functions, data mining pattern detection, and equation solving [81].
The GA and GEP work mechanism shown in Figs. 3 and 4 involve generating random generation of chromosomes using the Karva language. A typical chromosome or gene in gene expression programming (GEP) consists of two parts: a head and a tail. The head contains function or terminal symbols, while the tail includes only parameters. The number of genes determines the number of sub ETs in the model. Chromosomes have fixed lengths and can be simply transformed into an algebraic expression [82]. Each GEP gene is composed of a fixed length list of terms, with each term derived from a set of functions. These functions can include arithmetic operations (e.g., +, −, x, /), Boolean logic functions (e.g., AND, OR, NOT, etc.), mathematical functions (e.g., cos, sin, natural log), conditional functions (e.g., IF, THEN, ELSE), or others [83].
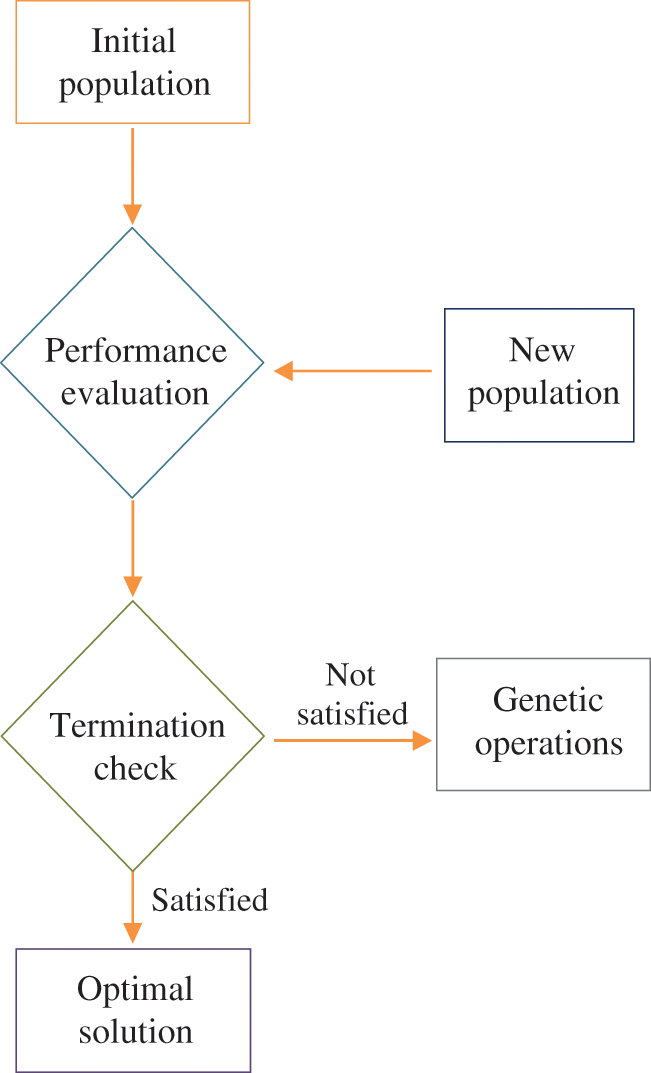
Figure 3: GA flowchart
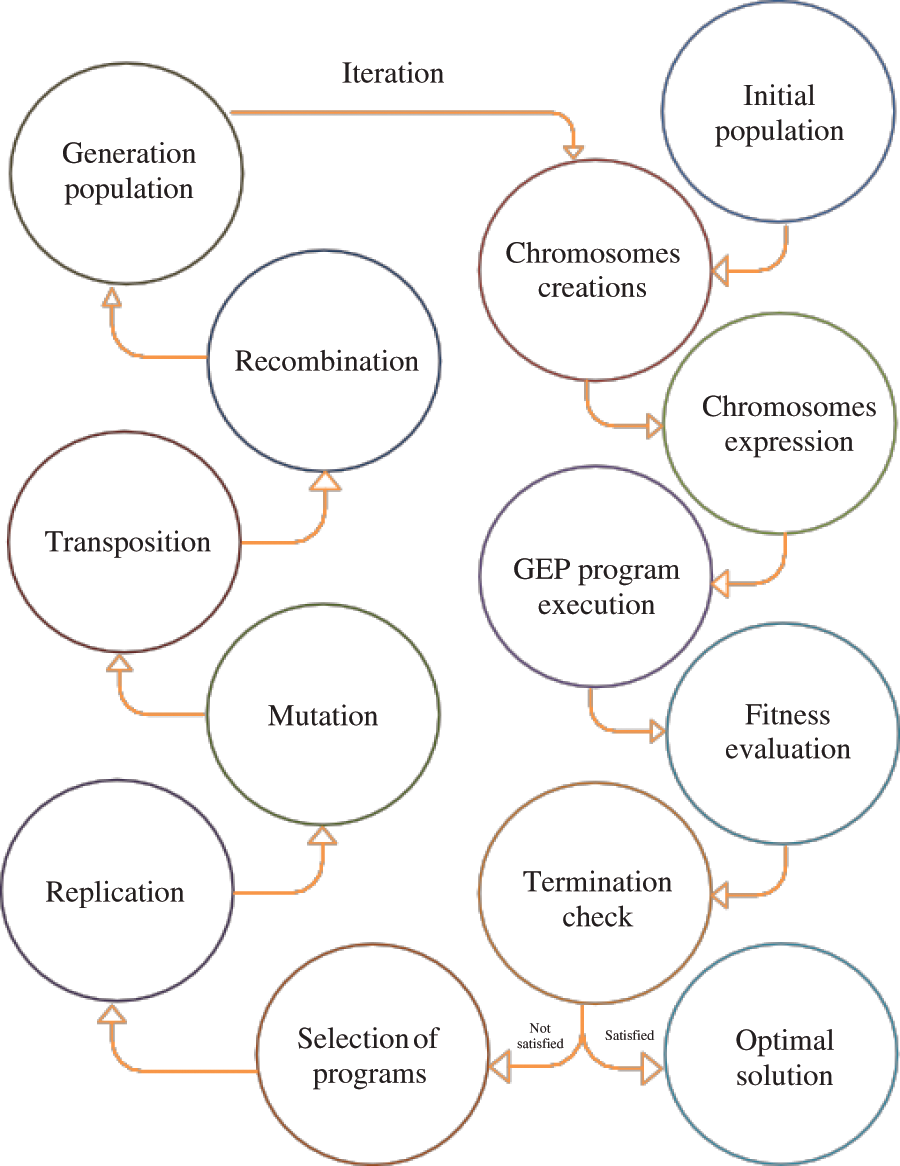
Figure 4: Algorithm of GEP
Afterward, the chromosomes are represented by expression trees (ETs) that come in various shapes and sizes. Then, the main genetic operators such as crossover, mutation, transposition and recombination (including 1-point, 2-point, and gene recombination) are executed on the chromosomes based on their ratios [84]. The ETs are then expressed using karva notation or K-expression [85]. The entire process concludes once the stopping condition (highest number of generations or suitable solution) is met.
5 Data Acquisition and Model Development
In this research, a dataset of 125 values is considered for the GEP and ROM prediction model for HFRP elastic modulus. The data section 1–11 is acquired from [70], data section 12–23 [86], data section 24–25 [87], data section 26–38 [88], data section 39–46 [89], data section 47 [90], data section 48–65 [91], data section 66–106 [92], data section 107–112 [93], data section 113–118 [94], and data section 119–125 [95]. In the current study, 100 data points for training and 25 data points for testing were considered for the generation of the GEP model. Moreover, ten input variables and one dependent variable were taken, i.e., the Diameter of the bar (Dia of the bar), percentage of glass fiber (GF), the elastic modulus of glass fiber (E-GF), percentage of carbon fiber (CF), the elastic modulus of carbon fiber (E-CF), percentage of basalt fiber (BF), elastic modulus of basalt fiber (E-BF), percentage of resin (Resin), tensile strength of resin elastic and modulus of resin (Resin Modulus) against HFRP elastic modulus. The statistical analysis and frequency distribution of the database are shown in Table 3 and Fig. 5, respectively. These are highly dependent variables for governing the elastic modulus of HFRP bars which are collected from previous studies.
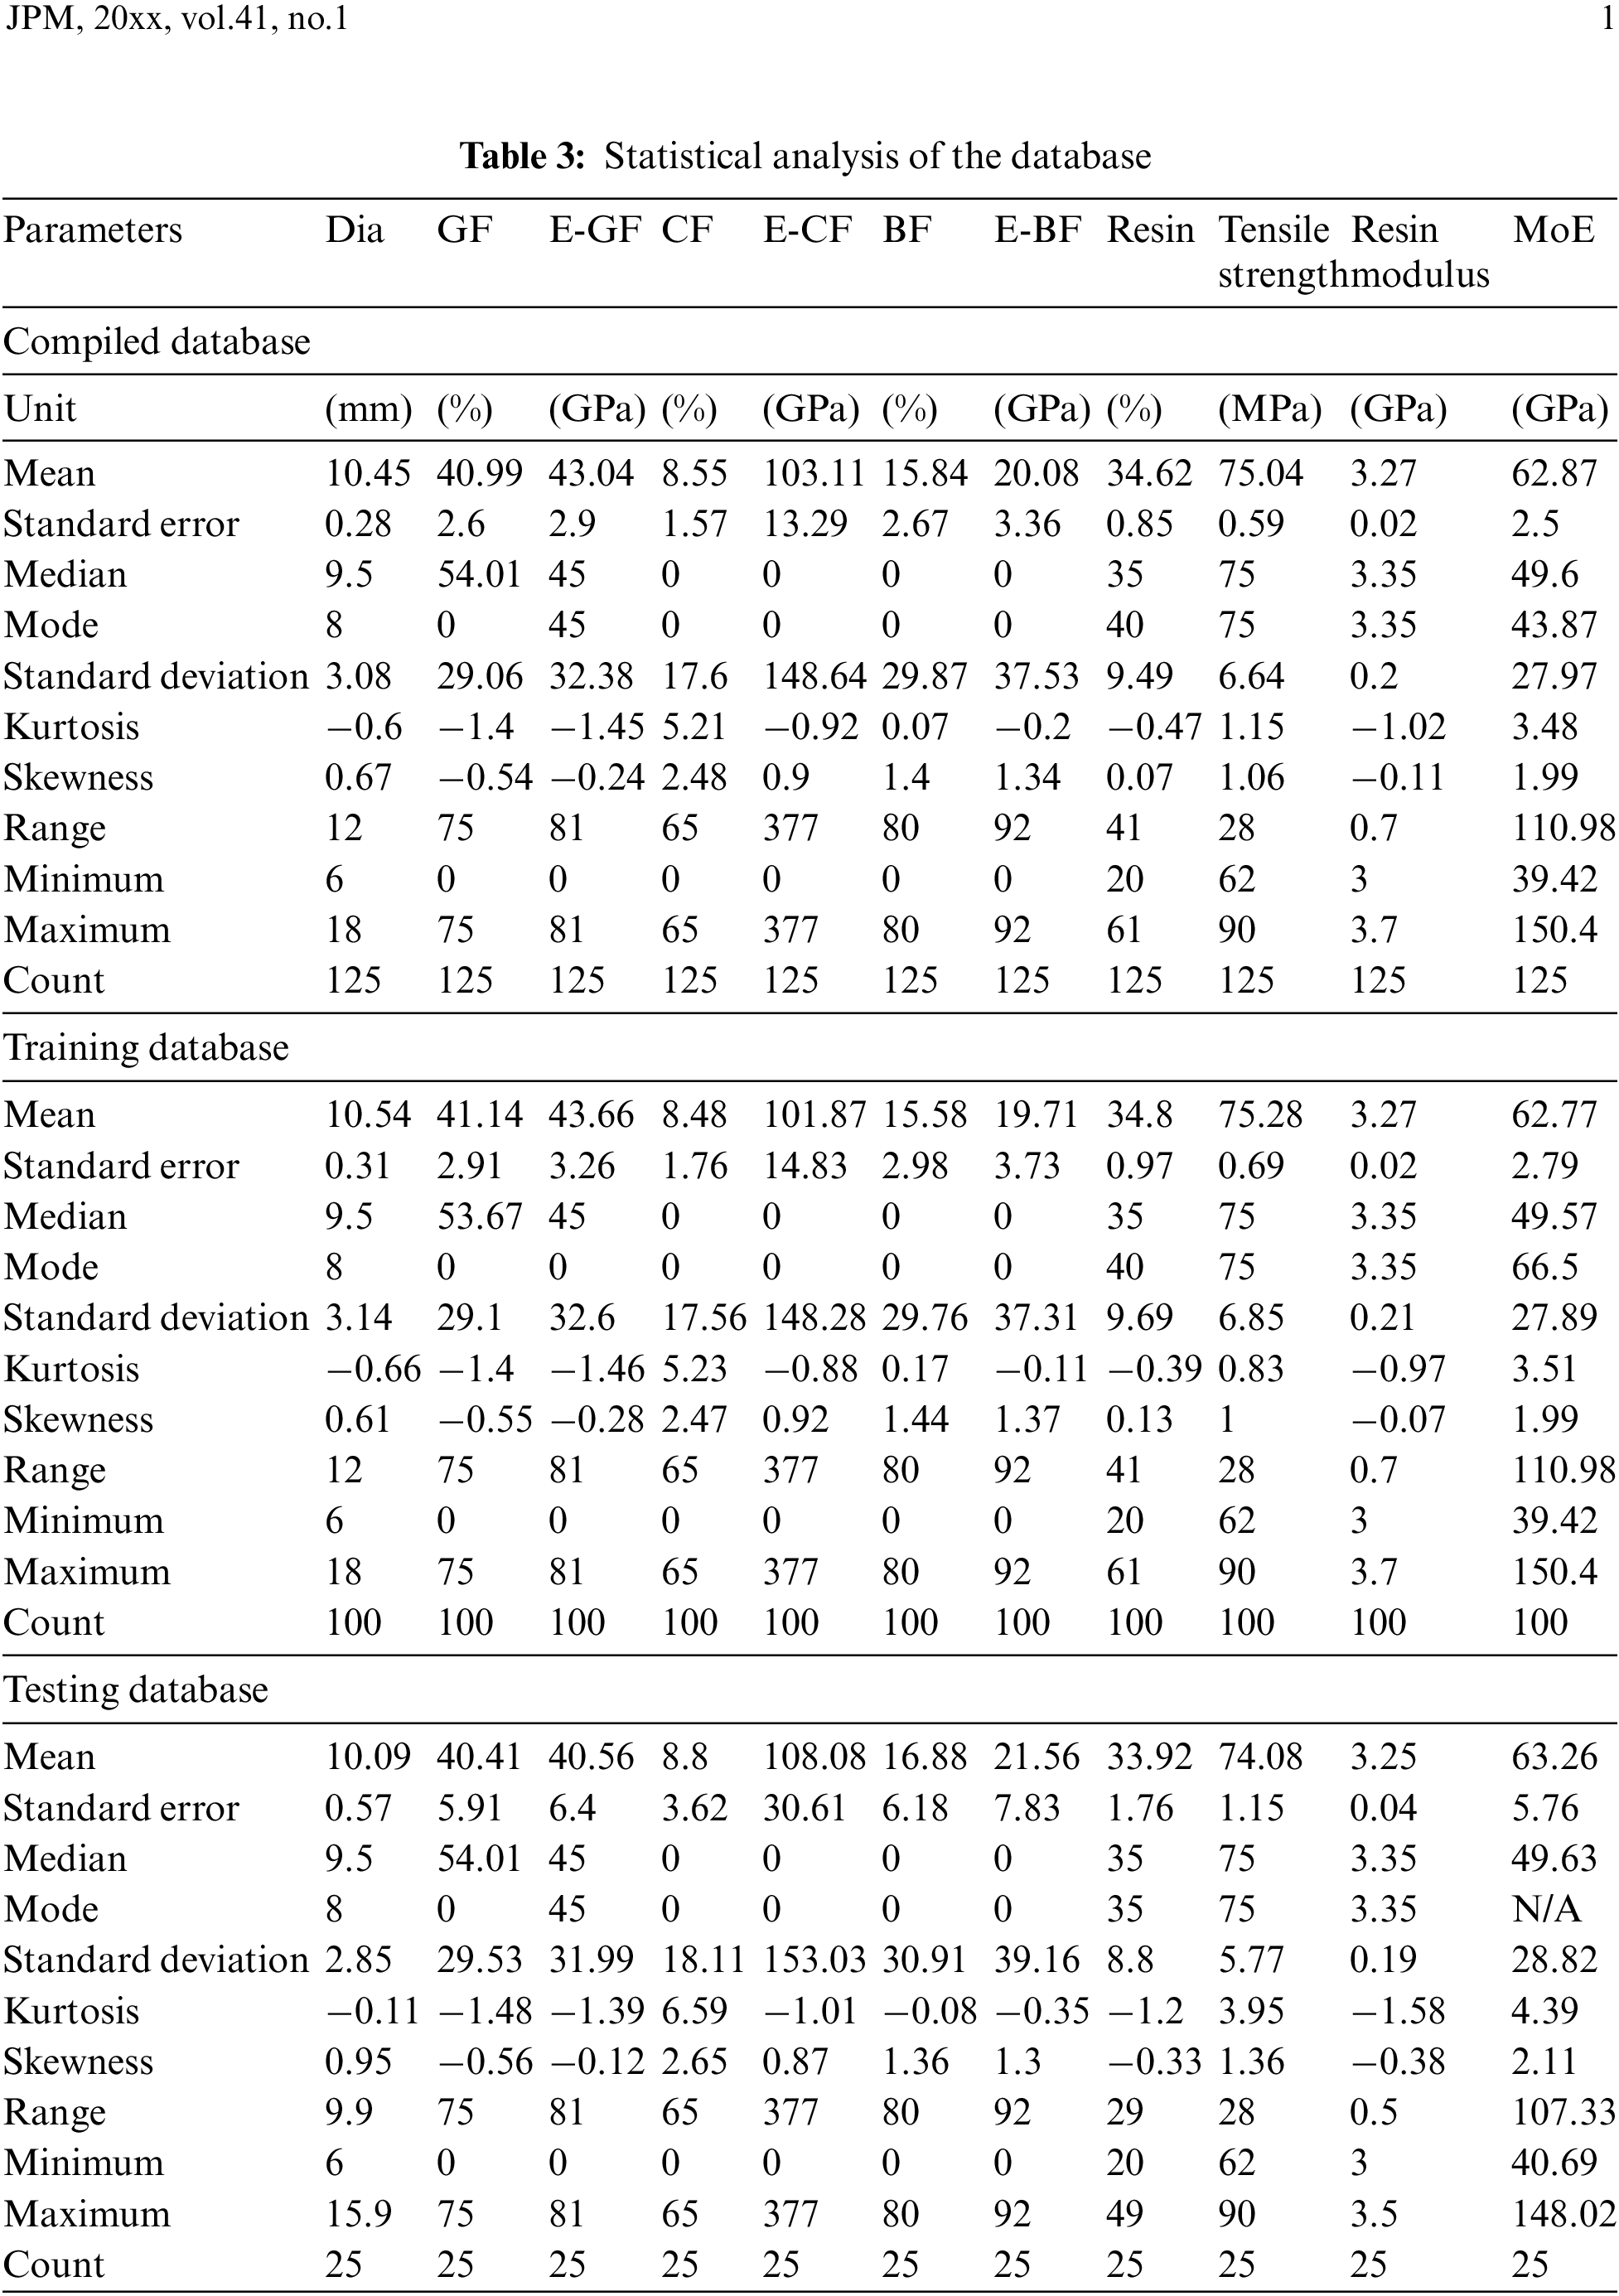
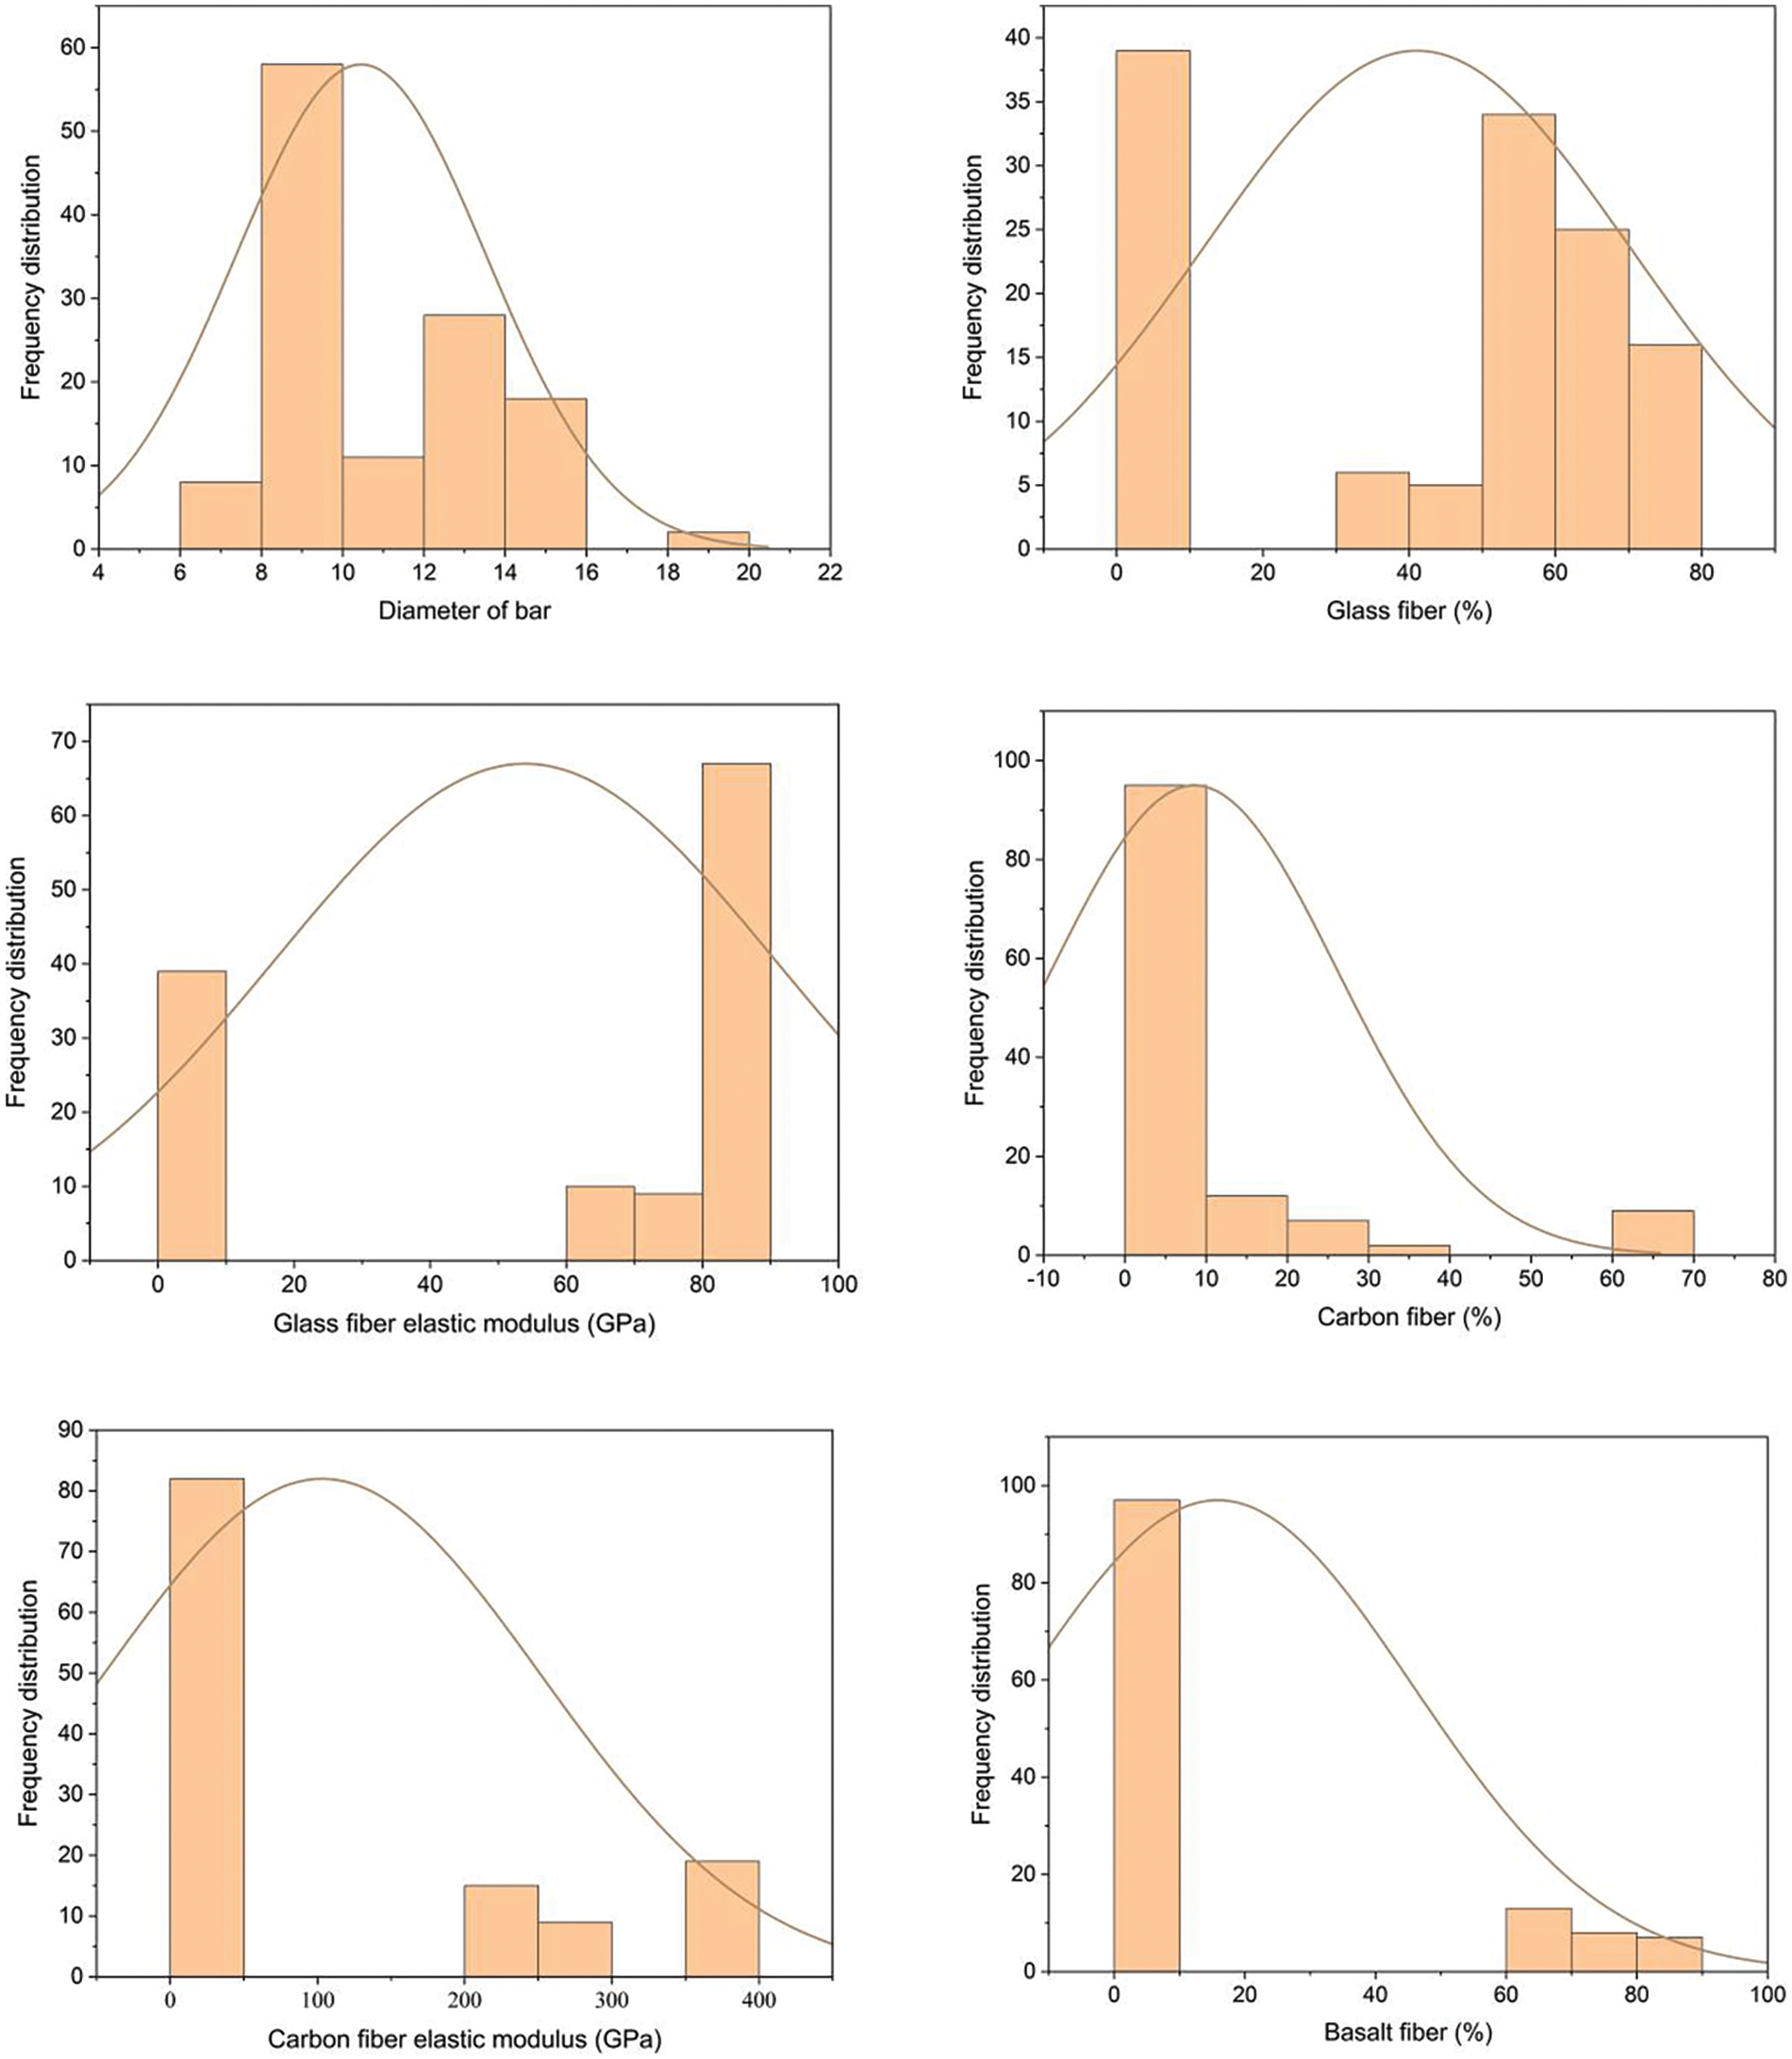
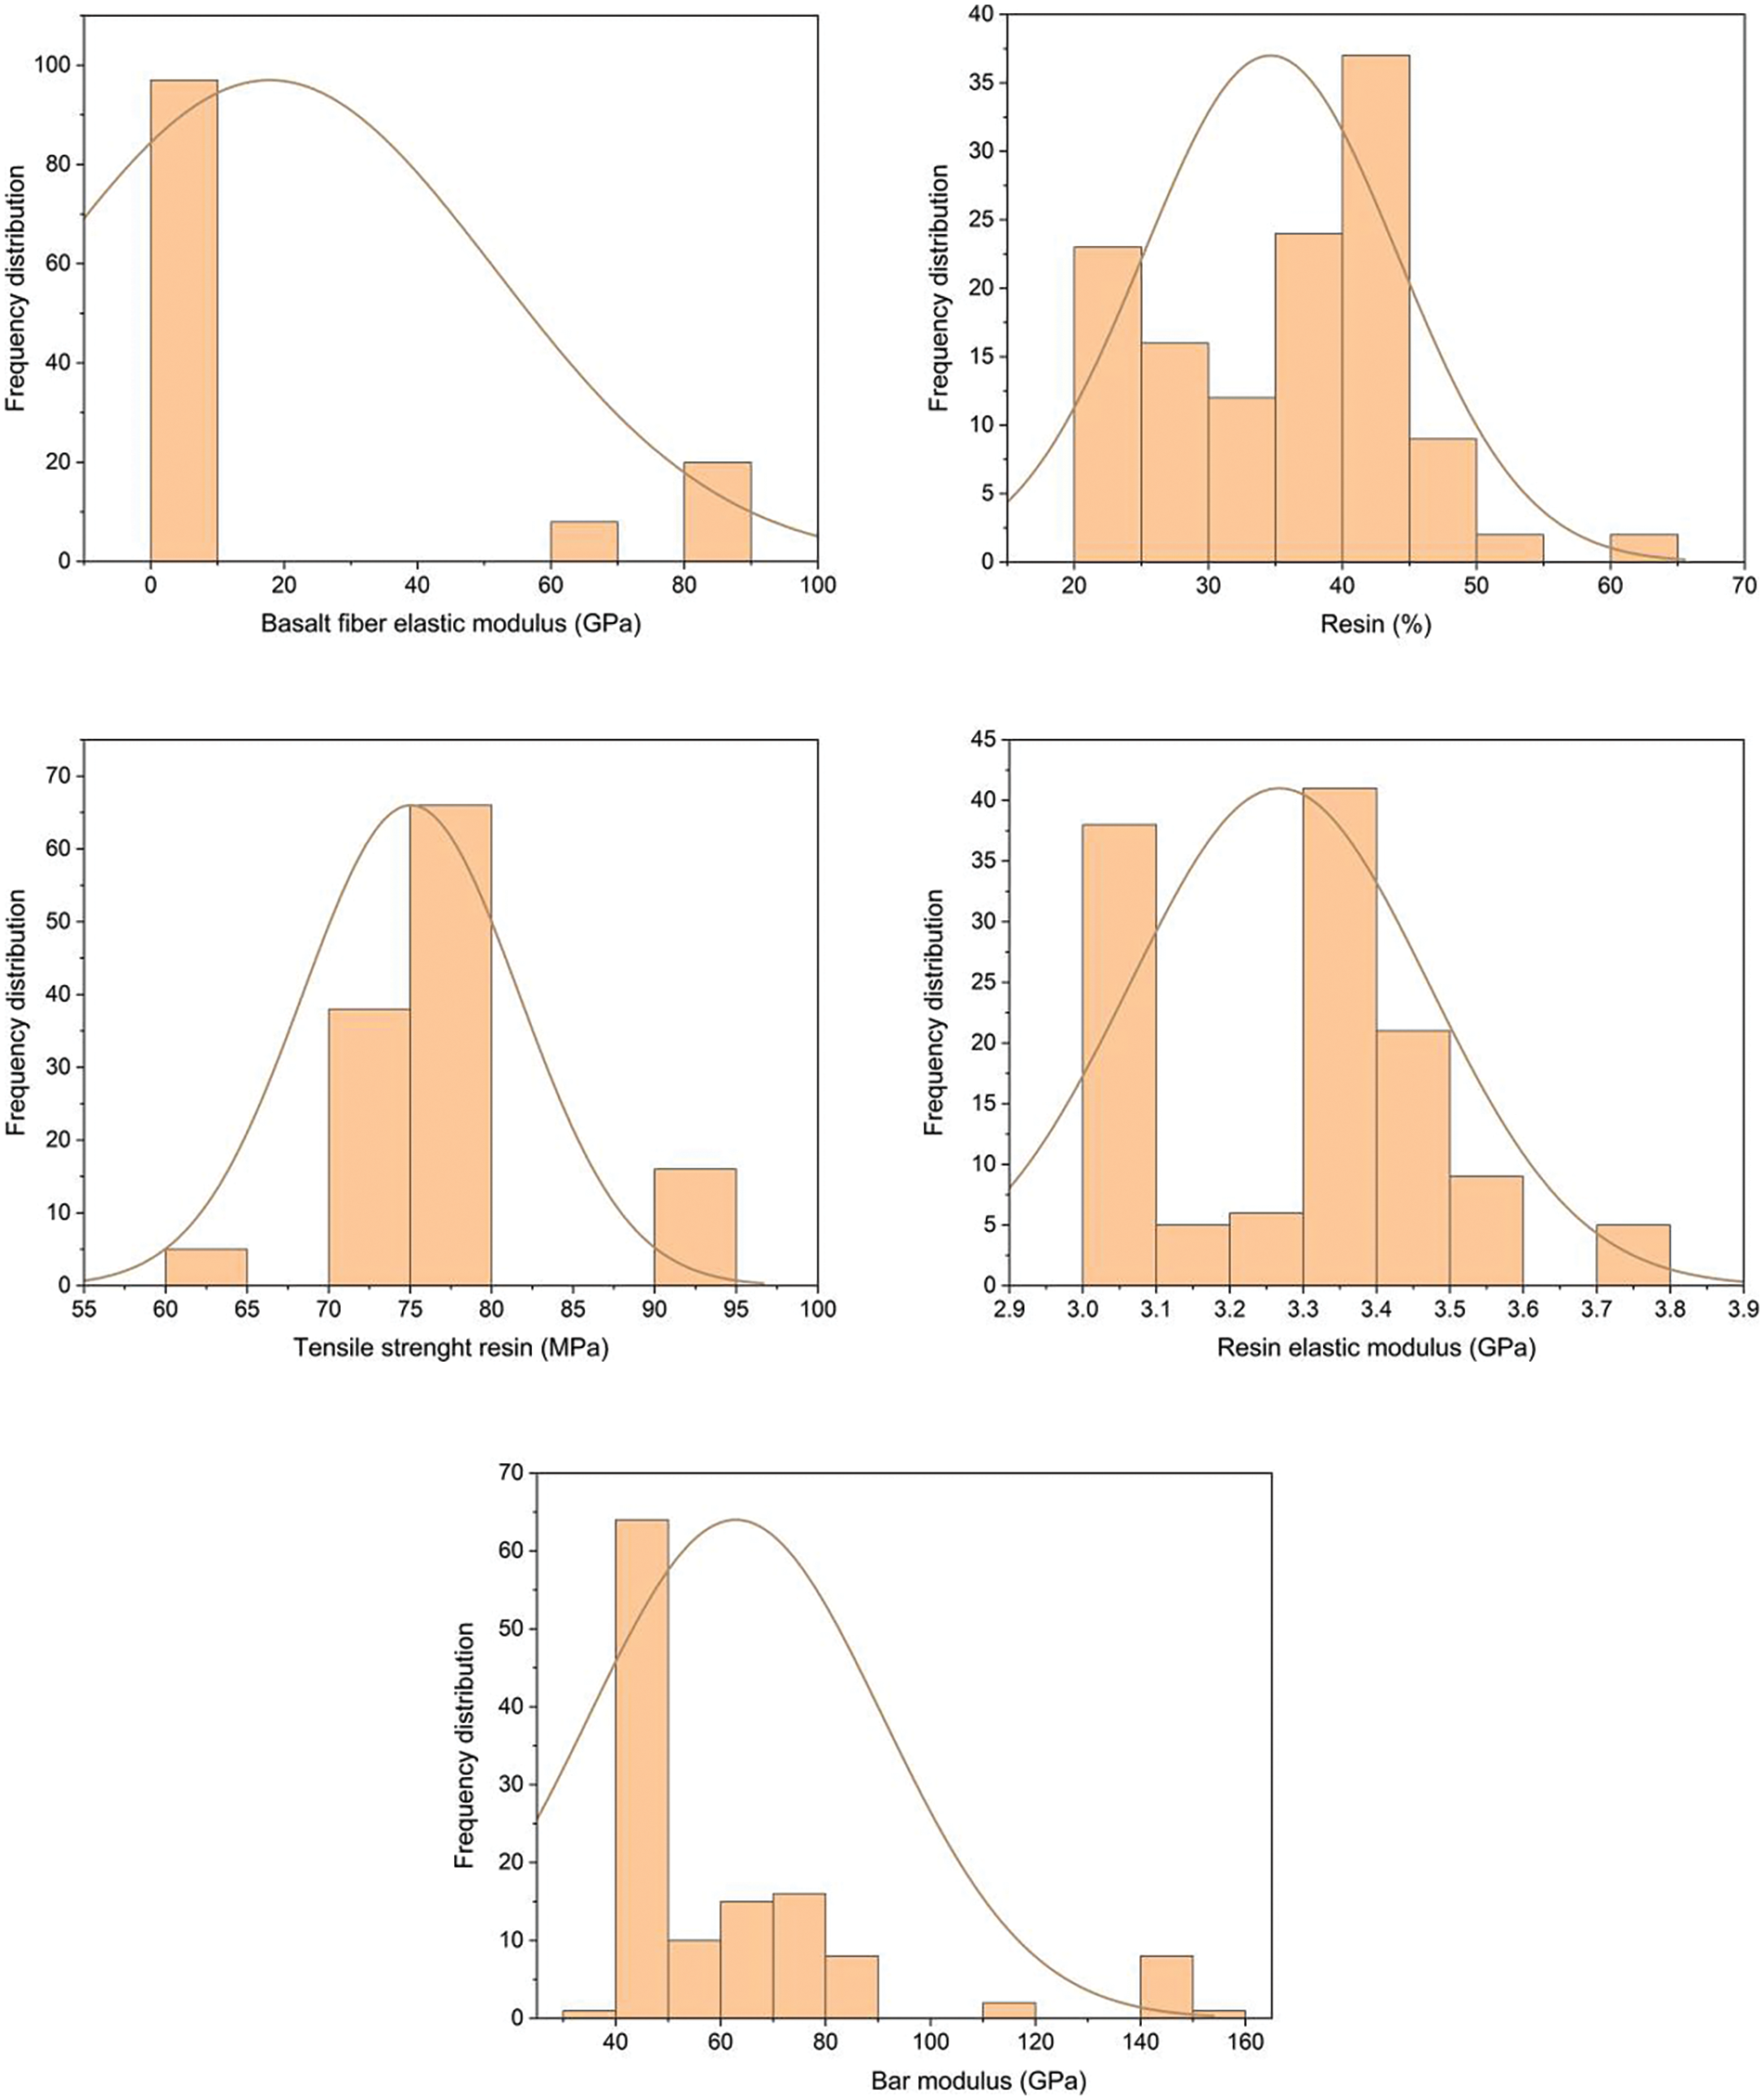
Figure 5: Frequency distribution
Moreover, the study explores the relationships between various variables, as shown in Fig. 6. The results indicate that “GF%” has a positive correlation with “Bar Dia” and “E-GF” (correlation coefficients of 0.301 and 0.311, respectively). This suggests that an increase in glass fiber percentage or effective glass fiber is connected to a larger bar diameter. Additionally, the correlation coefficients reveal connections among resin properties. Specifically, “Resin%” exhibits a positive correlation with “Resin Tensile Strength” (correlation coefficient: 0.0327) and “Resin Modulus” (correlation coefficient: 0.0688). These correlations indicate that an increase in resin percentage is linked to higher tensile strength and modulus.
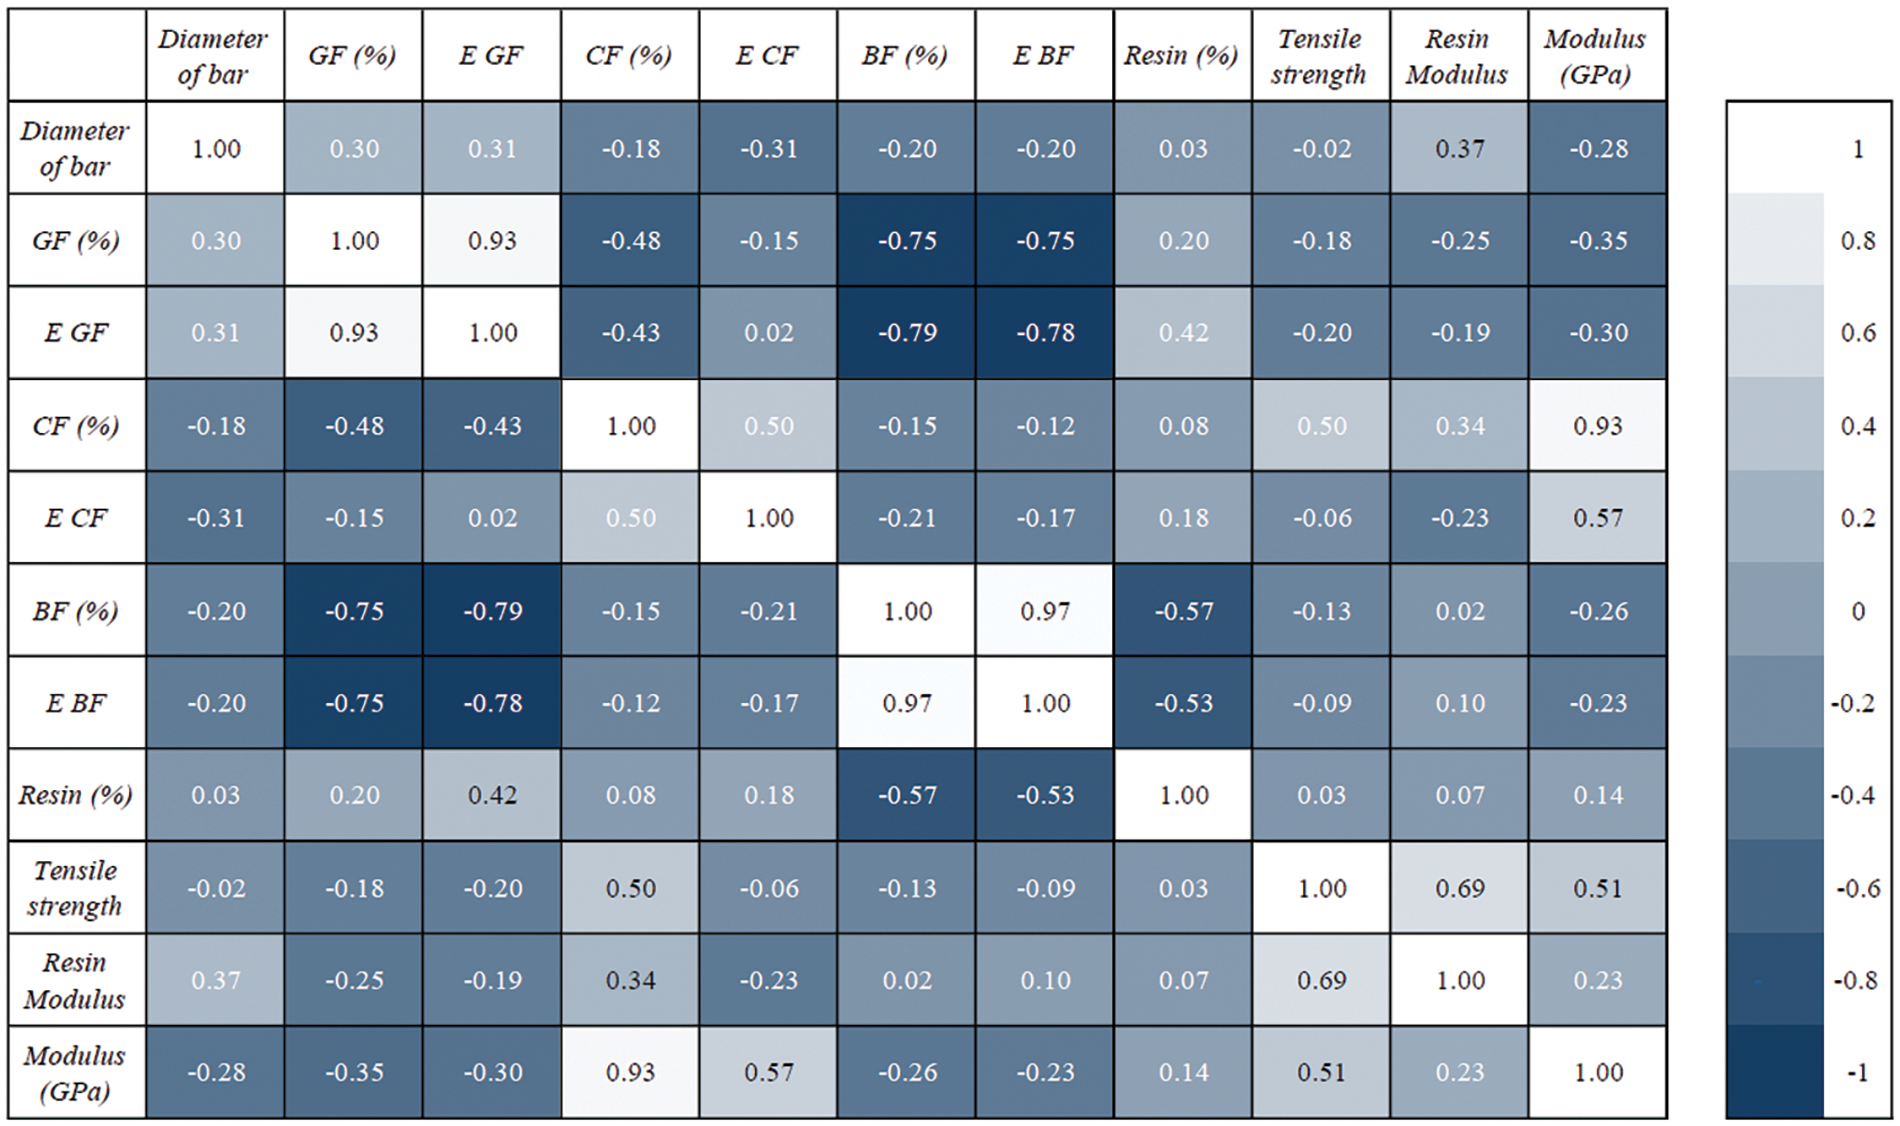
Figure 6: Pearson correlation matrix of the dataset
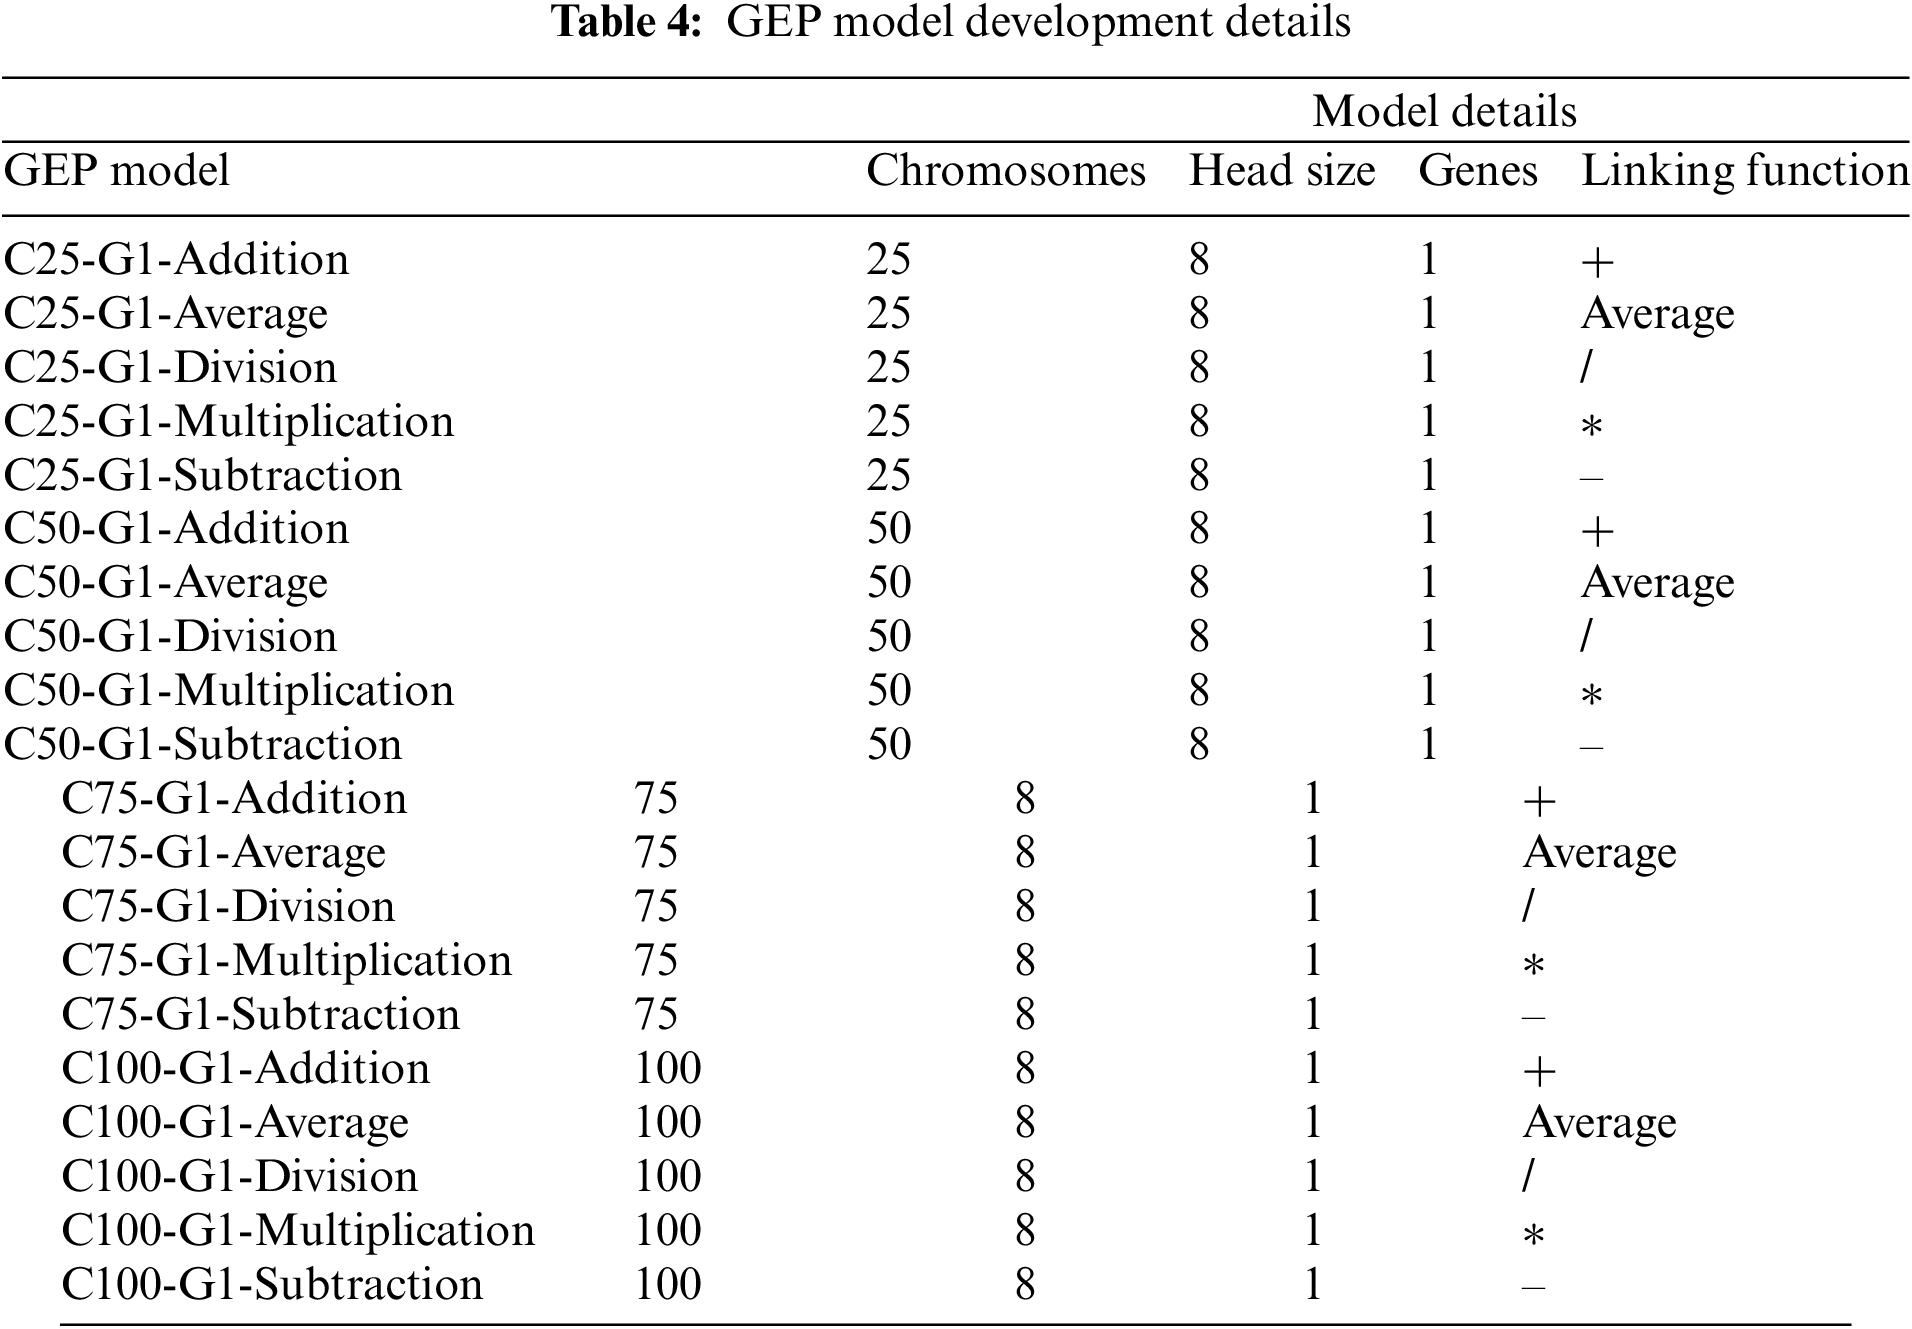
GeneXproTool 5.0, a flexible GEP data modeling software, was used to predict the HFRP modulus of elasticity. This tool allows for the adjustment of various parameters, facilitating the creation of diverse GEP models with different characteristics. Table 4 presents a comprehensive GEP prediction model for HFRP elastic modulus, each configuration corresponds to a unique GEP setup identified by a code. For instance, “C25-G1-Addition” shows 25 chromosomes, 1 gene per chromosome, and addition as the linking function. The chromosome count remains consistent at 25, 50, 75, and 100 in each configuration. Additionally, all configurations have 8 genes per chromosome, influencing the overall model behavior. The linking function determines gene combinations within chromosomes, denoted by symbols such as “+”, “−”, “*”, “/”, or “Average,” representing addition, subtraction, multiplication, division, or averaging of input variables.
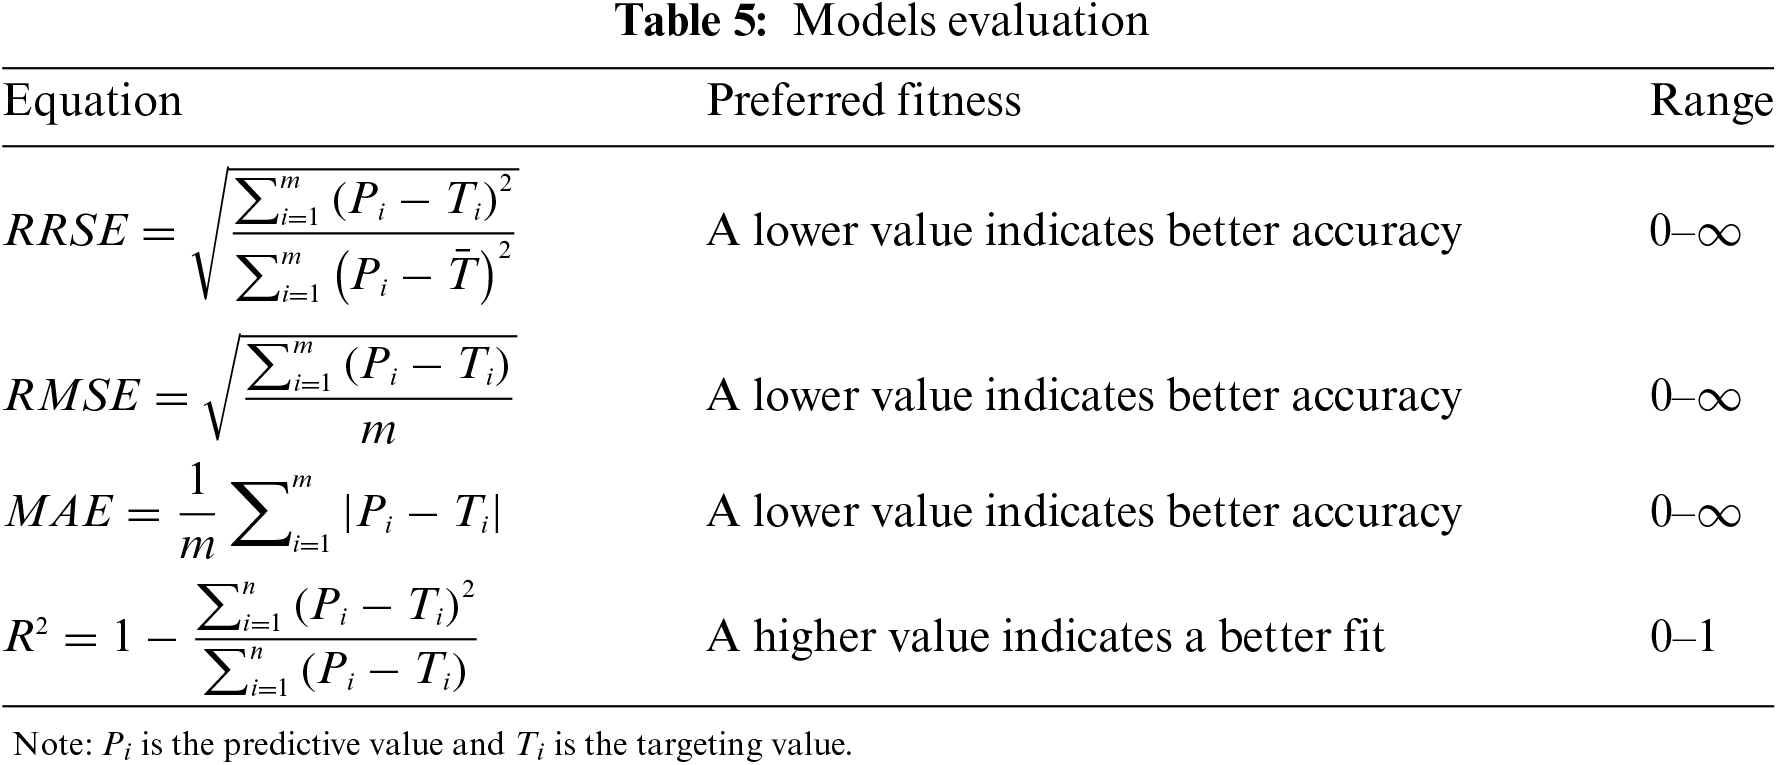
The statistical performance of the proposed GEP models to predict MOE was measured using four analytical standard measures including the coefficient of determination (
To assess the machine learning model’s flexibility and performance, the Cross-Validation (CV) technique is used. Various CV techniques, such as the Monte Carlo test, Jack Knife test, bootstrapping, three-way split cross-validation, and disjoint sets test, are utilized [105]. However, among these techniques, K-fold cross-validation (CV) is the most unbiased approach to address sampling and overfitting concerns.
The dataset is divided into “K” equal subsets to assess the model’s accuracy. The K-fold CV methodology creates K-1 subsets for training and one subset for testing to validate the training dataset [106]. This process is repeated K times with different data samples for training and testing. The best model is chosen based on approximation statistics for other errors from all the datasets. K-fold CV ensures complete dataset validation to obtain the most optimal model. The following steps are followed in K-fold validation: The dataset is divided into “K” equal subsets, where K-1 subsets are used for training, and one subset is reserved for testing and validation. The best model is developed from the K-1 subsets and validated on the remaining subset, considering all training subsets. The complete flow diagram of the K-fold CV algorithm is shown in Fig. 7.
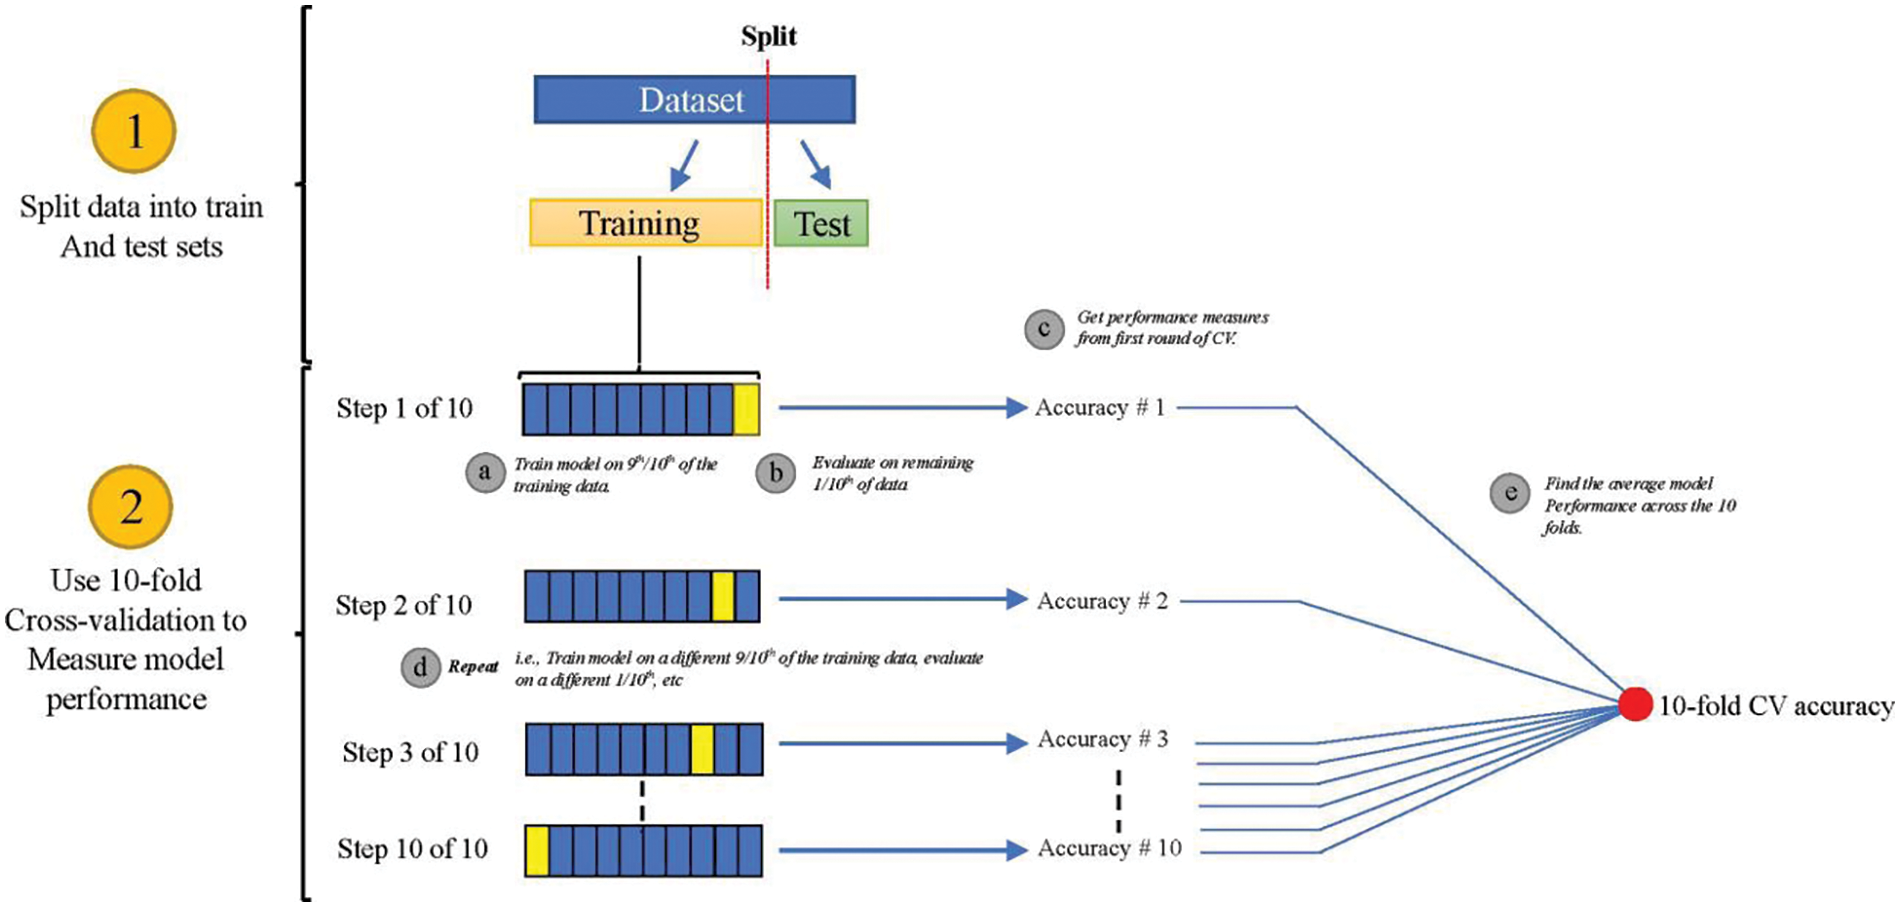
Figure 7: K-fold cross-validation flow diagram
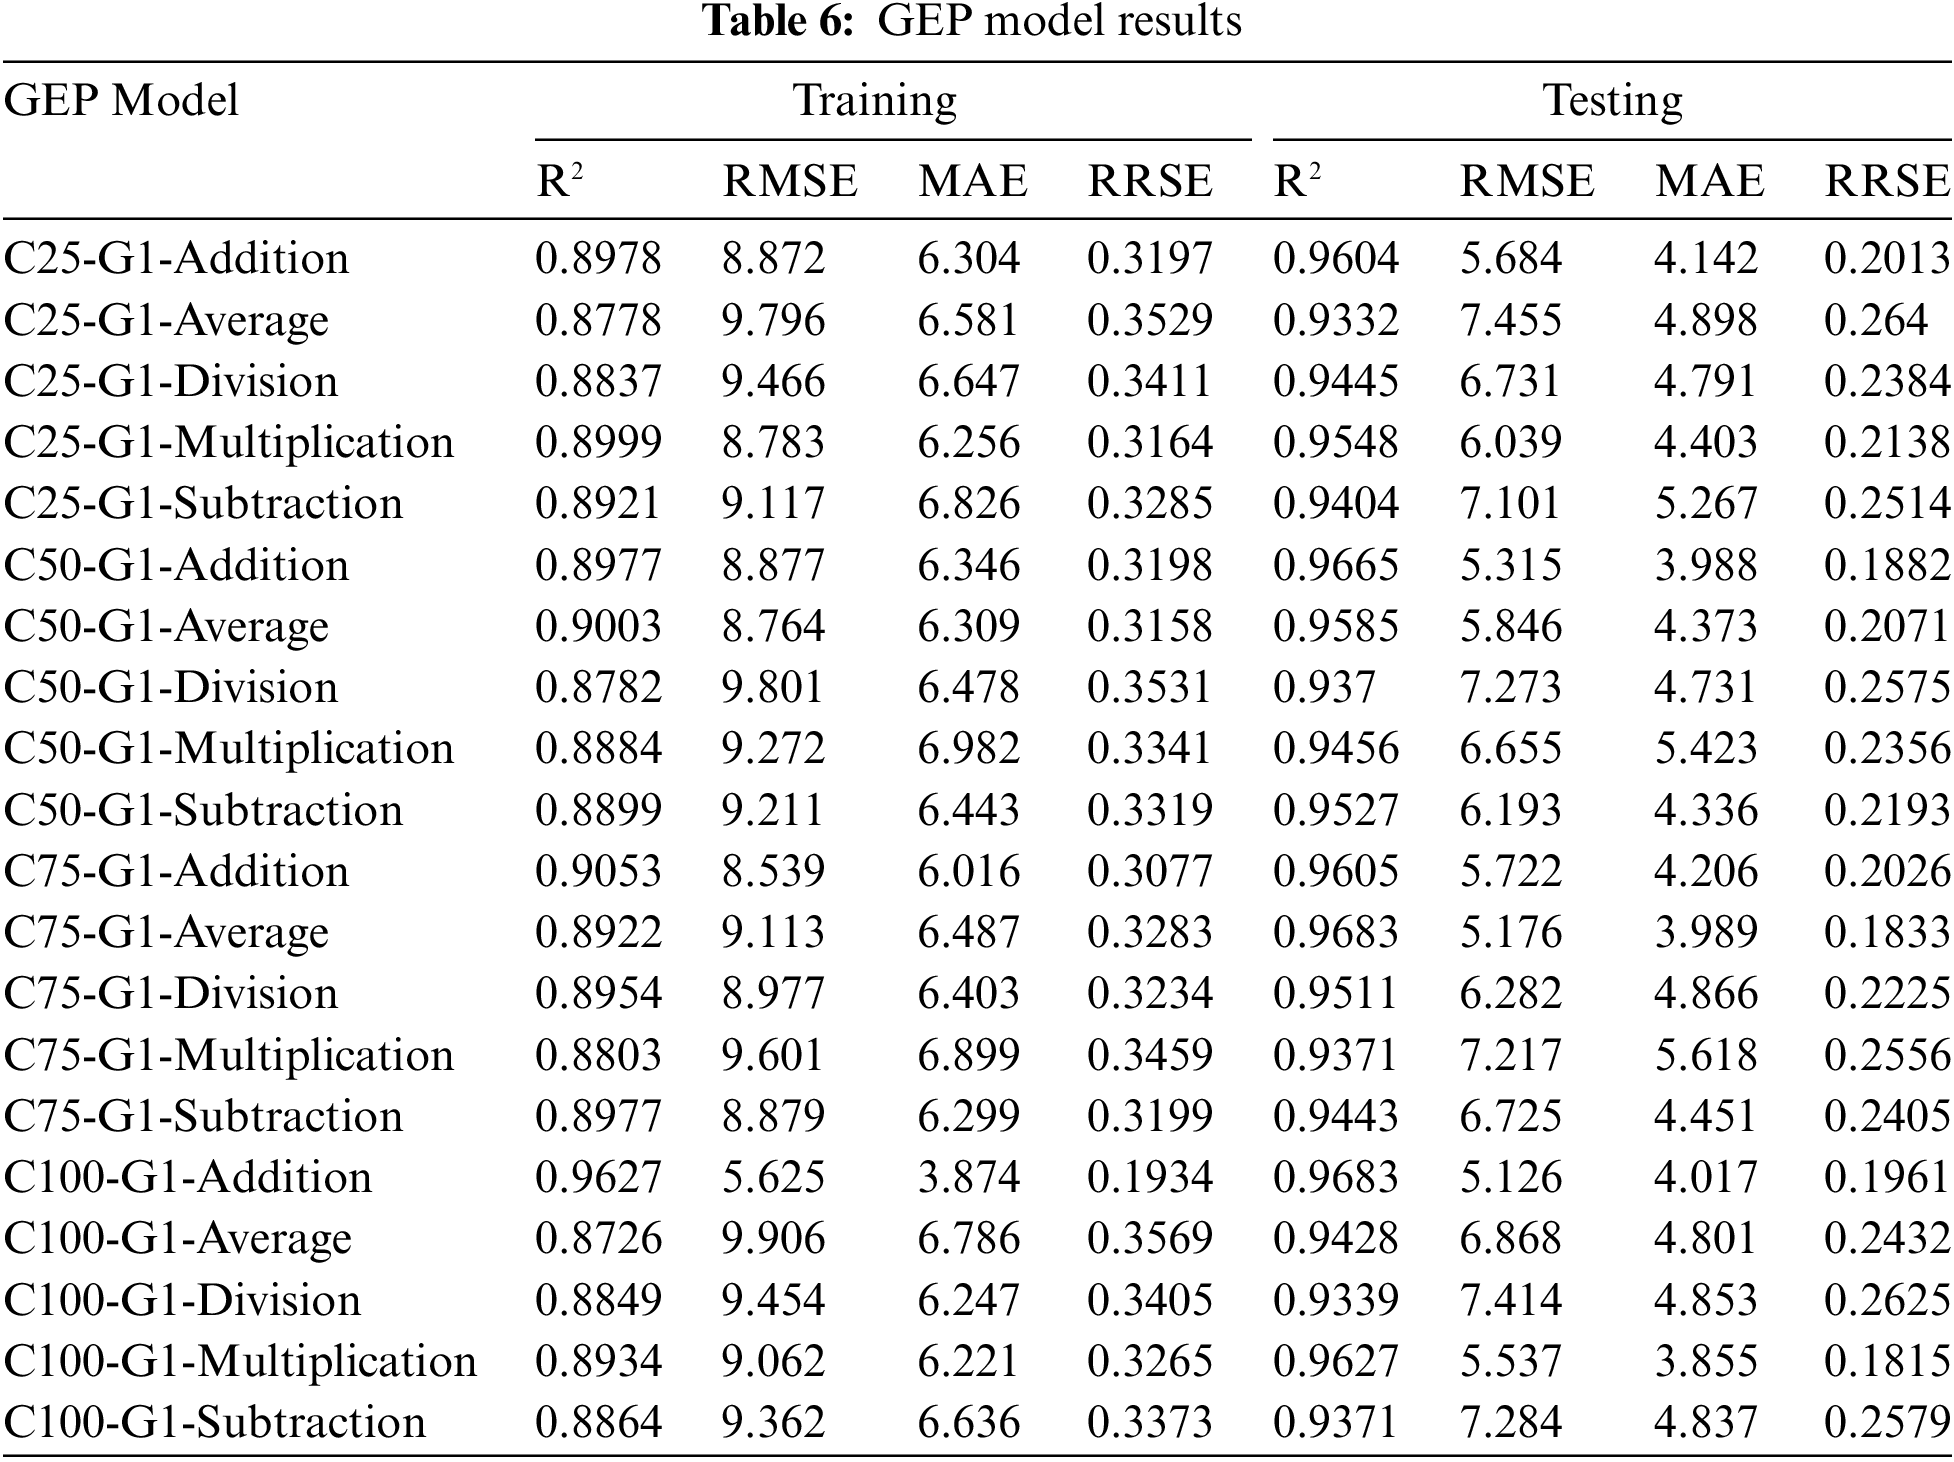
Table 6 shows the different GEP models using various evaluation metrics for training and testing. The R2, RMSE, MAE, and RRSE values for each model are used for accuracy. The “C100-G1-Addition” model demonstrates better performance than models with an R2 value of 0.96 in training and 0.96 in testing. Therefore a strong correlation exists between predicted and actual values. The model shows the lowest RMSE of 5.59, indicating accurate predictions with minimal error. The MAE value of 3.87 also supports the models accuracy (average magnitude of errors). Finally, the RRSE value of 0.19 shows that the models performance is better than others, reflecting the normalized error relative to the target variables.
Numerous models were generated by adjusting various parameters in GeneXprotool such as the number of chromosomes, genes, and functions. Statistical parameters such as R2, MAE, RMSE, and RRSE were employed to evaluate the performance of the developed GEP models. The optimal fitness model, “C100-G1-Addition” shows better performance with R2 values of 0.96 during training and 0.96 during testing. Additionally, the GEP regression plot and error distribution diagram are illustrated in Figs. 8 and 9, respectively. The solid lines represent the predicted value, while the markers (e.g., circles and squares) indicate the observed data points. The different colors distinguish between training and testing datasets. In Fig. 9a, the comparison of experimental and predicted values of the modulus of elasticity is illustrated. The blue markers represent the experimental data, while the orange markers denote the predicted values from the GEP model. Each data point corresponds to a specific dataset, and the lines connecting the markers help visualize the trend and correlation between the experimental and predicted values. Fig. 9b represents the error value (difference between experimental and predicted values) for each dataset.
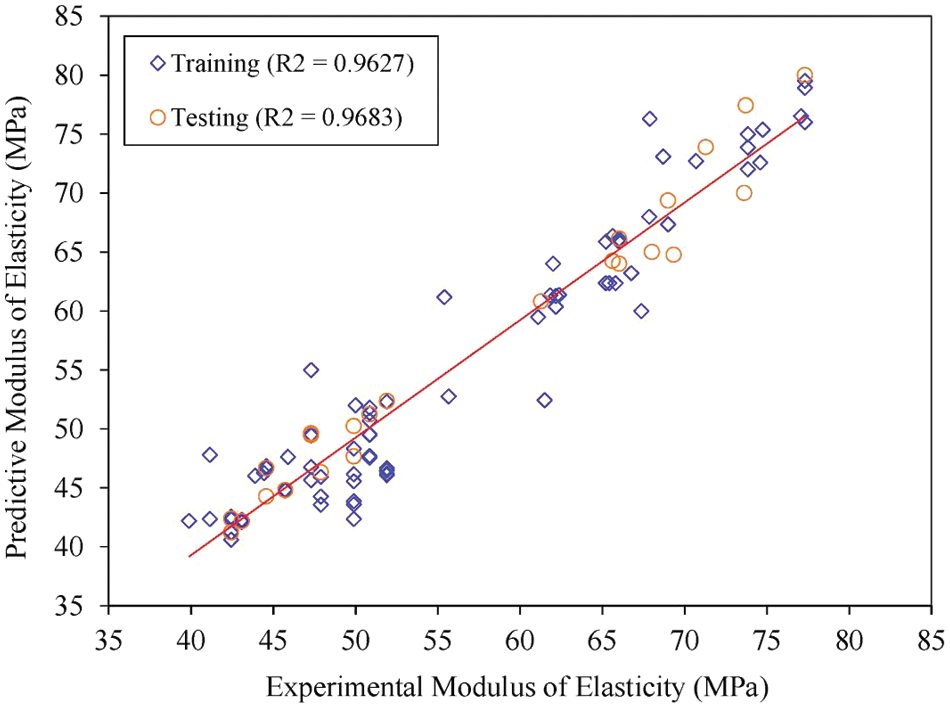
Figure 8: Regression plot
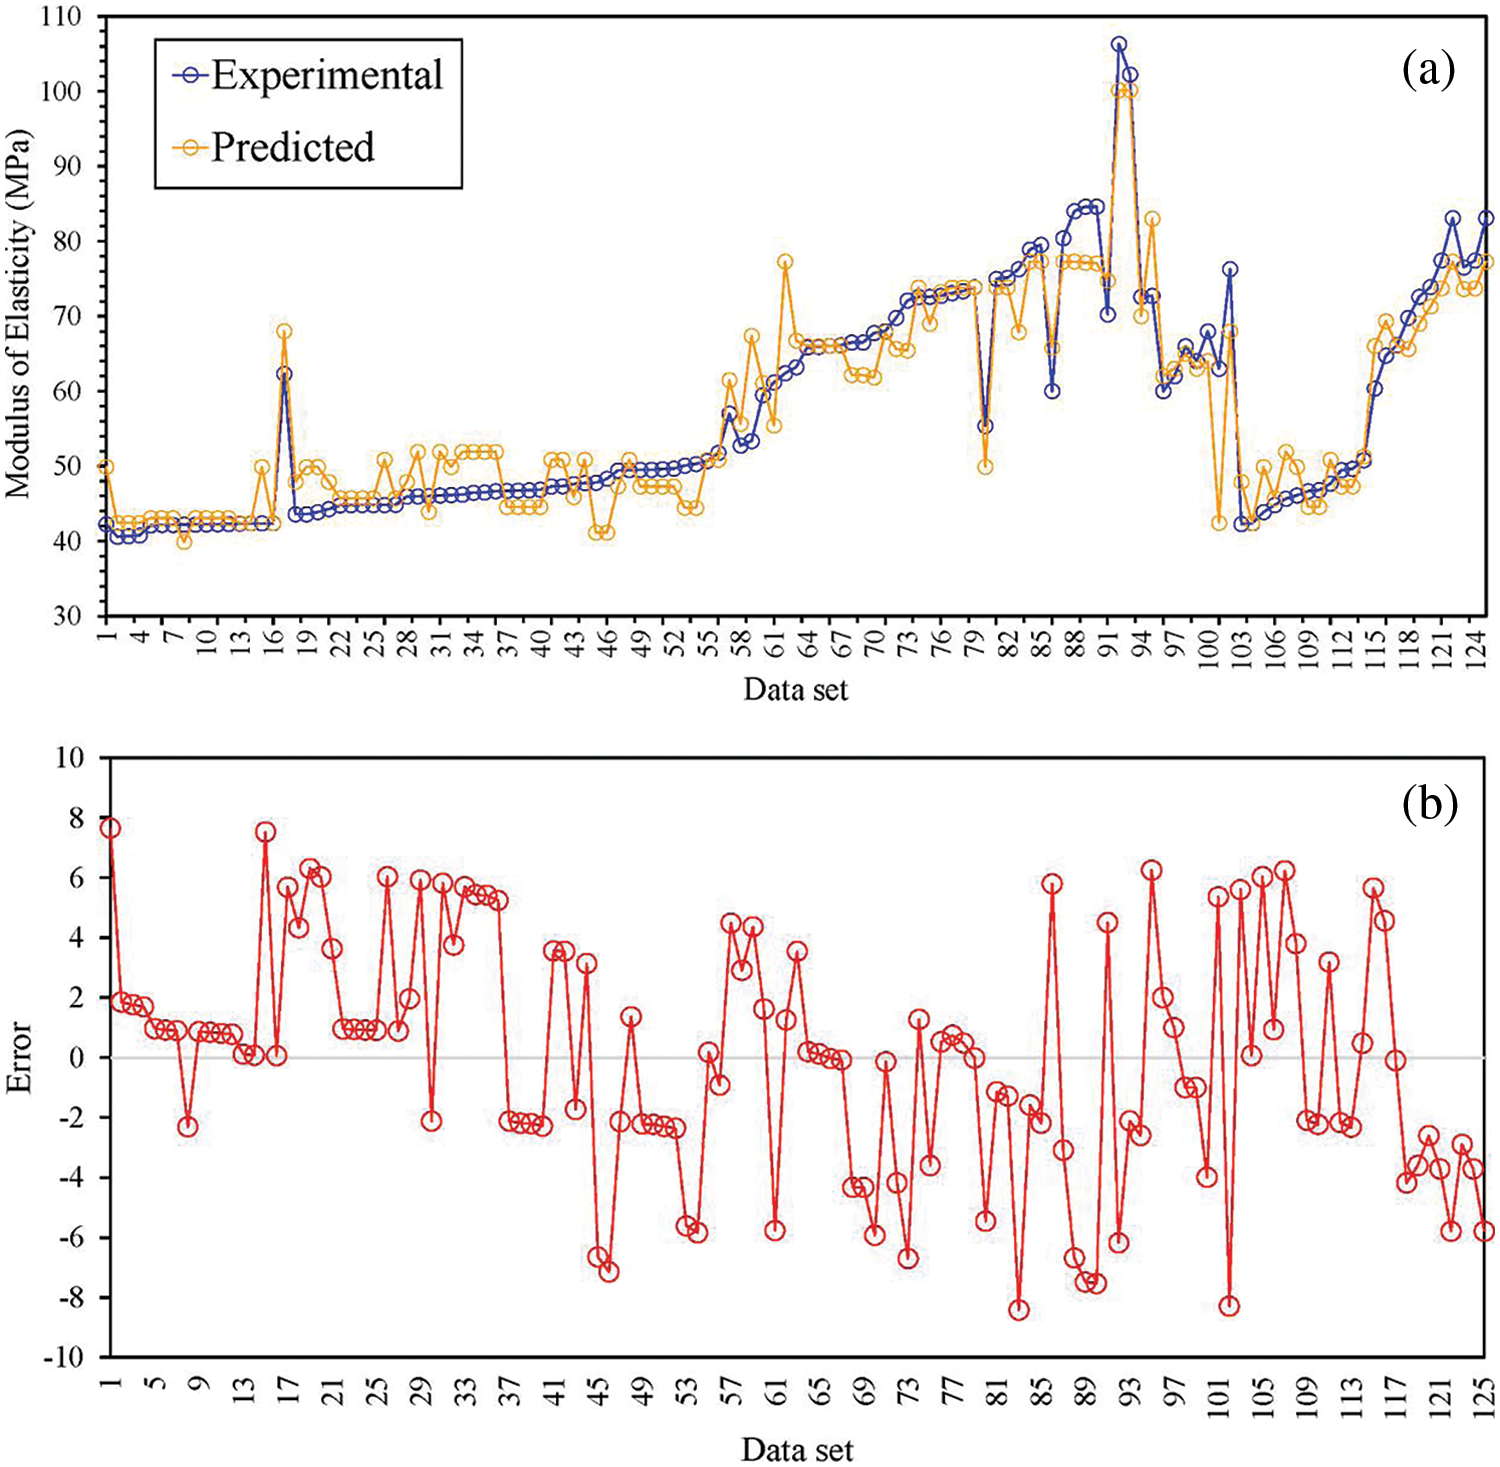
Figure 9: (a) Experimental vs. Predicted values (b) Error
The expression tree generated by GEP is from the best model “C100-G1-Addition” utilized to formulate the mathematical equation for the predictive model as shown in Fig. 10 and Eq. (2). This equation is for the utilization of a model generated by machine-learning techniques in the real world. By decoding the expression tree, a concise mathematical relationship between various input variables and mathematical operations (e.g., addition, subtraction, multiplication, division) is established. This simplified equation enables the calculation of the modulus of elasticity for HFRP bars.
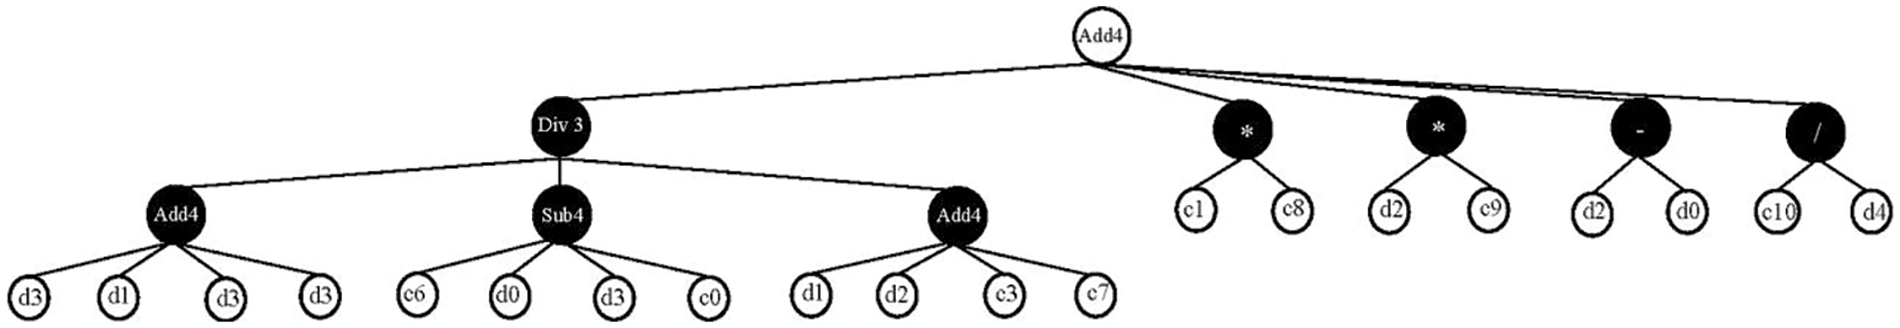
Figure 10: Expression tree of model “C100-G1-Addition”
In this study, a 10-fold cross-validation technique was utilized to assess the performance of a predictive model. Cross-validation is a widely employed method in machine learning and statistical analysis to evaluate a model’s generalization capability. Fig. 11 illustrates the performance of the predictive model across the 10-fold cross-validation iterations.
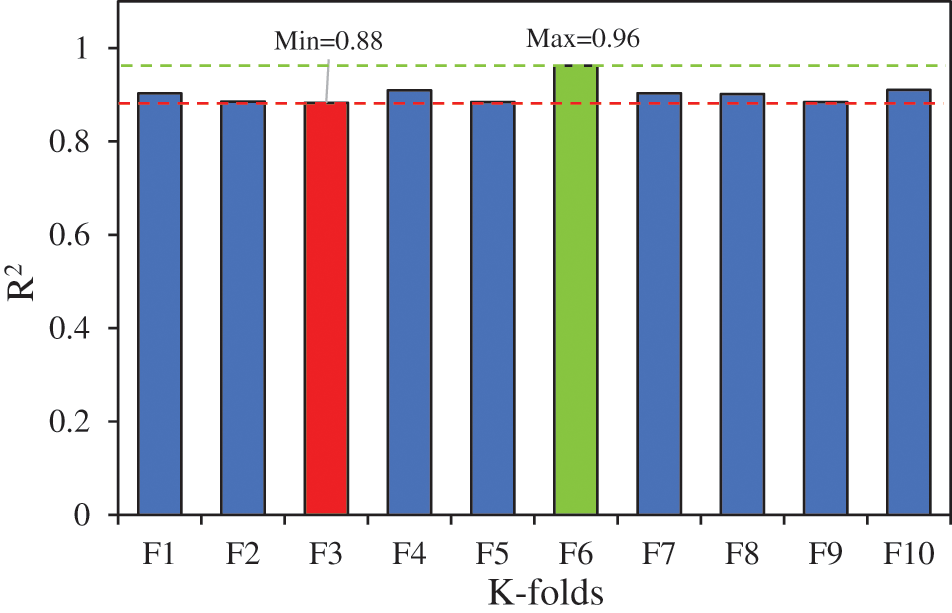
Figure 11: GEP model K-fold cross-validation results, R2
Fig. 12 illustrates the correlations between the elastic modulus of hybrid fiber-reinforced polymer (HFRP) bars and each variable such as bar diameter, carbon fiber percentages, the elastic modulus of carbon fibers, the elastic modulus of basalt fibers, basalt fibers percentages, the elastic modulus of glass fibers, glass fibers percentages, resin matrix percentages, resin modulus, and tensile strength. It can be observed that all the variables positively influence the elastic modulus of HFRP bars. The discovered beneficial impacts of each variable on the elastic modulus of HFRP bars indicate that changes in each parameter lead to an increase in the elastic modulus of the HFRP bars. Furthermore, the tensile strength more effectively increased the elastic modulus of HFRP bars than the other variables. These findings indicate that increasing the tensile capacity of concrete is a very effective approach to increasing its elastic modulus. Therefore, the study recommends that special attention should be given to the tensile strength to ensure better elastic modulus of HFRP bars. Also, it can be observed that each variable (other than tensile strength) has a significant role in increasing the elastic modulus of HFRP bars. Therefore, optimizing all the considered variables leads to an increase in the elastic modulus of the HFRP bars. These results have implications for carrying out efficient parametric studies and improving the design and manufacturing processes of HFRP bars to fulfill precise structural criteria.

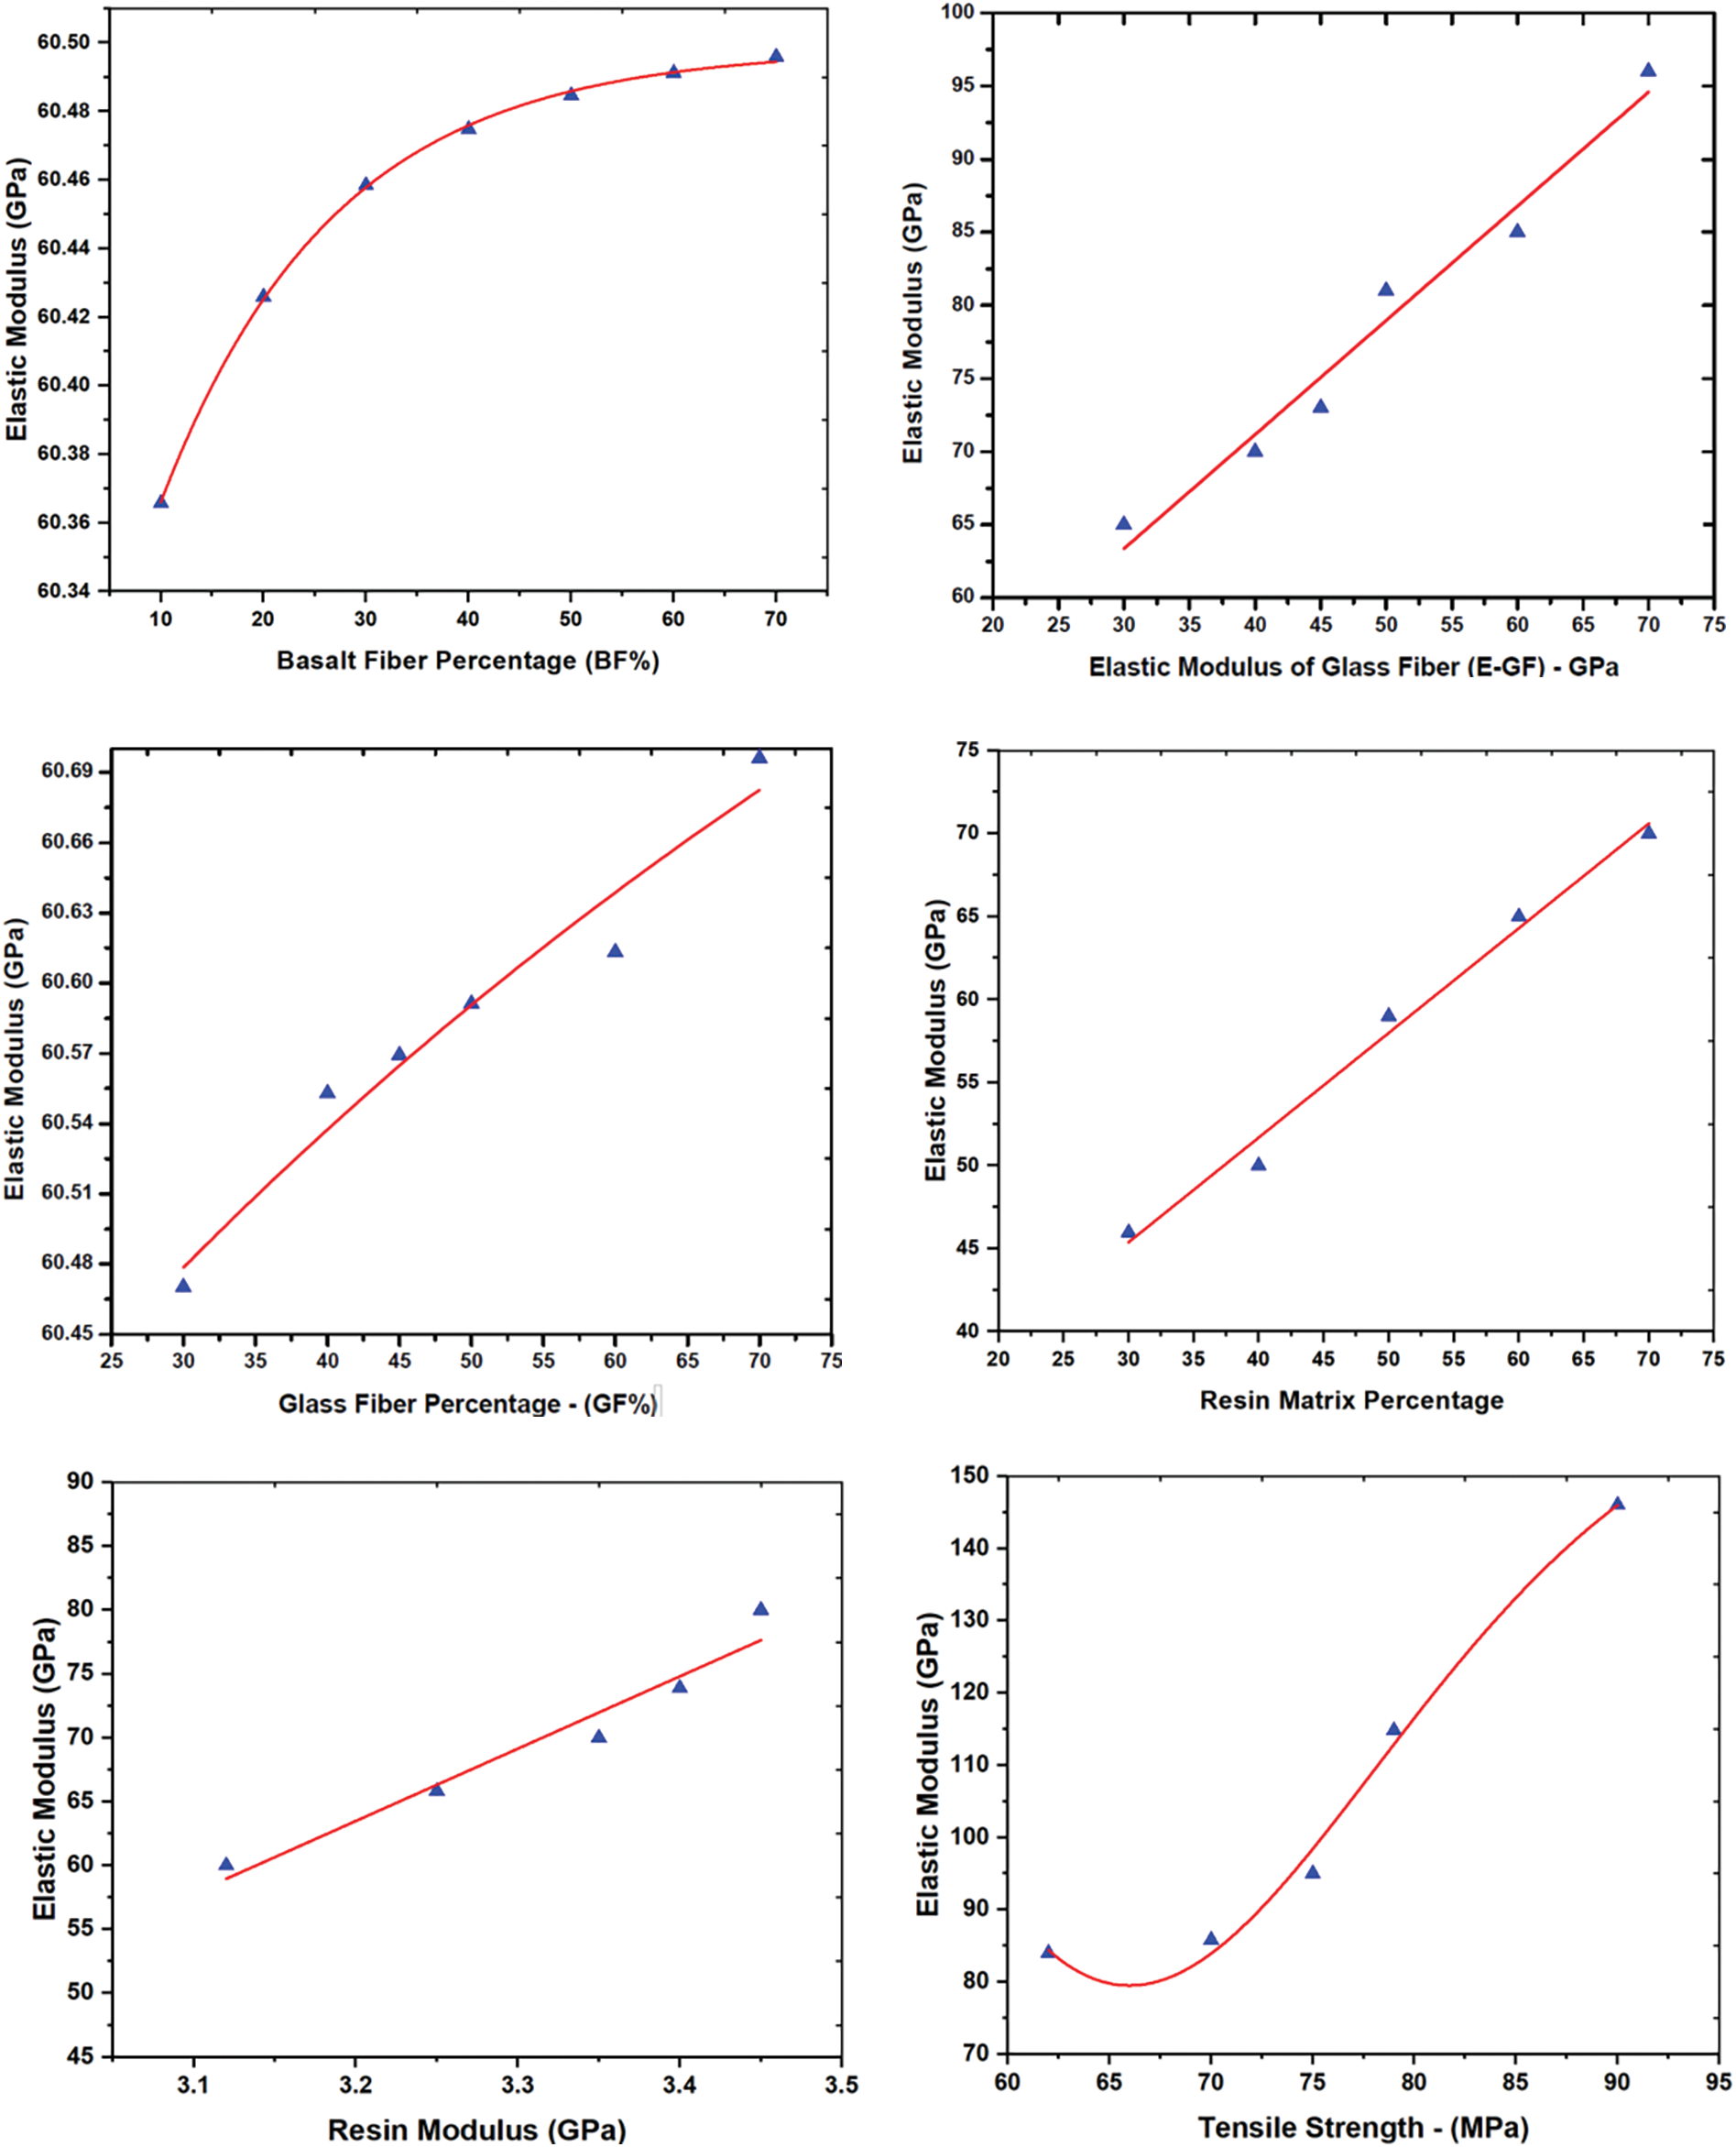
Figure 12: Parametric analysis
The Shapley additive explanation (SHAP) framework provides internal and external explanations for investigating a critical variable. It is particularly suitable for collective machine learning techniques due to its robustness and ability to offer qualitative and quantitative insights, comparable to widely used feature significance metrics. In Fig. 13, prominent attributes significant contributions to the model’s output, notably tensile strength, CF%, GF%, bar diameter, elastic modulus GF, resin%, BF% and elastic modulus CF, resin modulus and elastic modulus BF influencing the prediction of elastic modulus. These influential parameters display distinct thresholds dictating their effects on the model’s output. The intensity of each variable is judged through different colors. The red color indicates a highly sensitive variable that significantly impacts the elastic modulus. The SHAP analysis indicates that tensile strength is the most sensitive variable which significantly impacts the elastic modulus. Therefore, the study suggests that special attention should be given to the tensile strength while designing hybrid fiber-reinforced polymer (HFRP) bars.
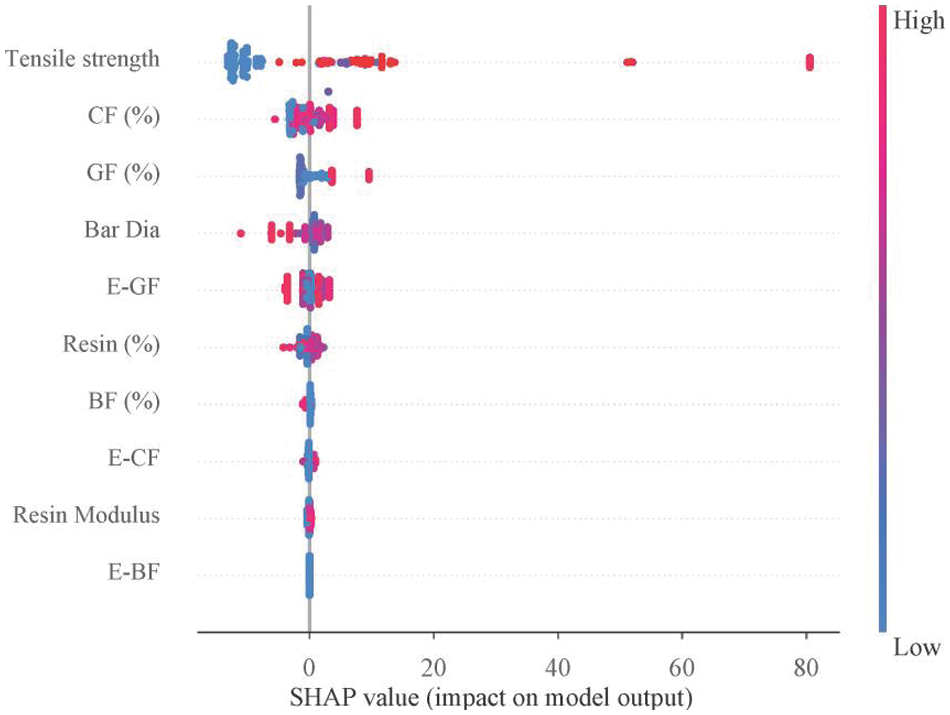
Figure 13: SHAP analysis
10 Comparative Analysis of GEP and Traditional Prediction Formula
Fig. 14 shows the comparison between the developed models of the GEP and the traditional prediction formula (ROM) available for elastic modulus. The alignment between the GEP model and experimental values is comparable. However considerable variation was noted between the experimental results and ROM value. Therefore, the findings indicate that the developed GEP model captures the patterns and relationships more accurately than the ROM model.
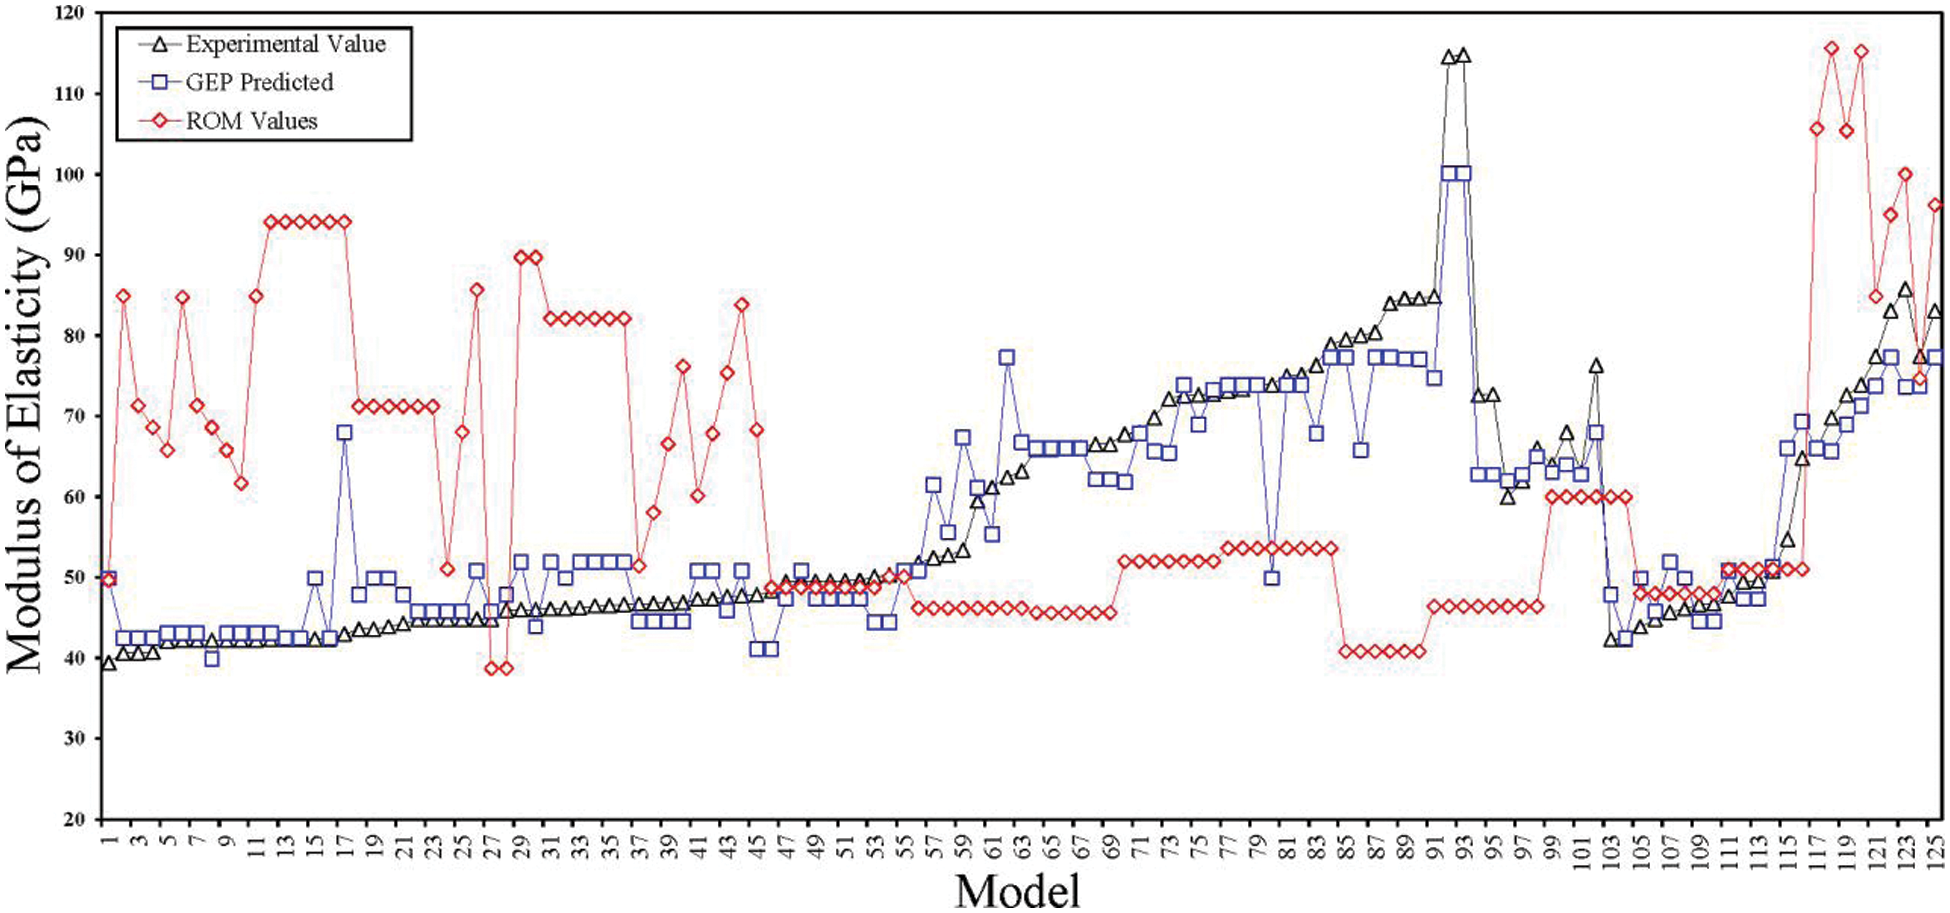
Figure 14: Comparison between results
The application of machine learning was applied to develop a predictive model for the elastic modulus of HFRP bars. A dataset containing 125 experimental results of HFRP bars was collected from the literature and used for model development and validation. The detailed conclusions are:
• The developed GEP model performance is better than the traditional available formula for predicting the elastic modulus of HFRP bars.
• A more accurate model (optimal predictive model) was identified with 100 chromosomes, 1 gene and an addition linking function.
• The statistical parameters such as R2, RMSE, MAE, and RRSE values are 0.96, 5.62, 3.87, and 0.1934, respectively, for training, and 0.96, 5.12, 4.01, and 0.196 for testing, respectively.
• A simplified mathematical equation for predicting the elastic modulus of HFRP bars is developed which offers a more straightforward approach for practical applications.
• Parametric and SHAP analyses identify tensile strength, carbon fiber, and glass fiber were the most significant contributing factors.
• Validation was performed through K-fold cross-validation (CV), demonstrating satisfactory performance across all models and further confirming the accuracy and reliability.
12 Limitations and Recommendations
Although the study provides promising results. However, the study has certain limitations and recommends future work to improve performance and accuracy.
• The study focused primarily on the prediction of the elastic modulus of HFRP bars. However, it might be possible that HFRP other properties like tensile strength and flexural behaviour influence overall performance. The study recommends future studies to explore different properties.
• Gene expression programming (GEP) was employed for predictive modelling and accuracy could be increased with the use of advanced algorithms. Therefore, the study recommends some advanced algorithms such as random forest or XGBoost to improve accuracy.
• Although the dataset used in this study is compressive, the variation in testing conditions, material properties, and fabrication methods may still have limitations. Therefore, the study recommends detailed controlled and standardized studies.
Acknowledgement: The authors gratefully acknowledge Zhengzhou University for providing the support and resources that enabled this research.
Funding Statement: The authors received no specific funding for this study.
Author Contributions: Aneel Manan: Software, Data curation, Visualization, Conceptualization, Methodology, Writing–original draft. Pu Zhang: Supervision, Methodology, Writing–review and editing. Shoaib Ahmad: Investigation, Conceptualization, Formal analysis, Writing–review and editing. Jawad Ahmad: Conceptualization, Methodology, Data curation, Visualization, Writing–review and editing. All authors reviewed the results and approved the final version of the manuscript.
Availability of Data and Materials: Data will be made available upon request.
Ethics Approval: Not applicable.
Conflicts of Interest: The authors declare that they have no known competing financial interests or personal relationships that could have appeared to influence the work reported in this paper.
References
1. Pang B, Jin Z, Zhang Y, Xu L, Li M, Wang C, et al. Ultraductile waterborne epoxy-concrete composite repair material: epoxy-fiber synergistic effect on flexural and tensile performance. Cem Concr Compos. 2022;129:104463. [Google Scholar]
2. Li Z, Gao M, Lei Z, Tong L, Sun J, Wang Y, et al. Ternary cementless composite based on red mud, ultra-fine fly ash, and GGBS: synergistic utilization and geopolymerization mechanism. Case Stud Constr Mater. 2023;19:e02410. [Google Scholar]
3. Adeola OO, Tauheed Alfa M. The role of advance composite material in contemporary buildings. J Contemp Urban Aff. 2018;2(3):95–101. doi:10.25034/ijcua.2018.4723. [Google Scholar] [CrossRef]
4. Attiogbe EK. Compliance concept in protection of concrete from freezing-and-thawing damage. ACI Mater J. 2020;117(6):187–200. doi:10.14359/51726995. [Google Scholar] [CrossRef]
5. Nedeljković M, Visser J, Šavija B, Valcke S, Schlangen E. Use of fine recycled concrete aggregates in concrete: a critical review. J Build Eng. 2021;38(1):102196. doi:10.1016/j.jobe.2021.102196. [Google Scholar] [CrossRef]
6. Santa AC, Tamayo JA, Correa CD, Gómez MA, Castaño JG, Baena LM. Atmospheric corrosion maps as a tool for designing and maintaining building materials: a review. Heliyon. 2022;8(9):e10438. doi:10.1016/j.heliyon.2022.e10438. [Google Scholar] [PubMed] [CrossRef]
7. Taffese WZ, Sistonen E. Machine learning for durability and service-life assessment of reinforced concrete structures: recent advances and future directions. Autom Constr. 2017;77:1–14. doi:10.1016/j.autcon.2017.01.016. [Google Scholar] [CrossRef]
8. Bhagwat Y, Nayak G, Lakshmi A, Pandit P. Corrosion of reinforcing bar in RCC structures—A review. Lect Notes Civ Eng. 2022;162(2):813–26. doi:10.1007/978-981-16-2826-9_51. [Google Scholar] [CrossRef]
9. Li H, Yang Y, Wang X, Tang H. Effects of the position and chloride-induced corrosion of strand on bonding behavior between the steel strand and concrete. In: Structures. Amsterdam, Netherlands: Elsevier; 2023. vol. 58, p. 105500. [Google Scholar]
10. Li H, He G, Zhao Z, Liu Q, Wang J, Yin Y, et al. Abrasion performance and failure mechanism of fiber yarns based on molecular segmental differences. J Eng Fiber Fabr. 2024;19. doi:10.1177/15589250241228263. [Google Scholar] [CrossRef]
11. Naser MZ, Hawileh RA, Abdalla JA. Fiber-reinforced polymer composites in strengthening reinforced concrete structures: a critical review. Eng Struct. 2019;198(12):109542. doi:10.1016/j.engstruct.2019.109542. [Google Scholar] [CrossRef]
12. Sun L, Wang C, Zhang C, Yang Z, Li C, Qiao P. Experimental investigation on the bond performance of sea sand coral concrete with FRP bar reinforcement for marine environments. Adv Struct Eng. 2023;26(3):533–46. doi:10.1177/13694332221131153. [Google Scholar] [CrossRef]
13. Cao J, Du J, Fan Q, Yang J, Bao C, Liu Y. Reinforcement for earthquake-damaged glued-laminated timber knee-braced frames with self-tapping screws and CFRP fabric. Eng Struct. 2024;306(6):117787. doi:10.1016/j.engstruct.2024.117787. [Google Scholar] [CrossRef]
14. Guo F, Al-Saadi S, Singh Raman RK, Zhao XL. Durability of fiber reinforced polymer (FRP) in simulated seawater sea sand concrete (SWSSC) environment. Corros Sci. 2018;141:1–13. doi:10.1016/j.corsci.2018.06.022. [Google Scholar] [CrossRef]
15. Li J. Application of corrosion resistance of FRP composites rebar in sea water sea sand concrete. Appl Comput Eng. 2023;7(1):131–5. doi:10.54254/2755-2721/7/20230401. [Google Scholar] [CrossRef]
16. Khalifa A, Nanni A. Rehabilitation of rectangular simply supported RC beams with shear deficiencies using CFRP composites. Constr Build Mater. 2002;16(3):135–46. doi:10.1016/S0950-0618(02)00002-8. [Google Scholar] [CrossRef]
17. Abdalla HA. Evaluation of deflection in concrete members reinforced with fibre reinforced polymer (FRP) bars. Compos Struct. 2002;56(1):63–71. doi:10.1016/S0263-8223(01)00188-X. [Google Scholar] [CrossRef]
18. Ferreira AJM, Camanho PP, Marques AT, Fernandes AA. Modelling of concrete beams reinforced with FRP re-bars. Compos Struct. 2001;53(1):107–16. doi:10.1016/S0263-8223(00)00182-3. [Google Scholar] [CrossRef]
19. Huang H, Yuan Y, Zhang W, Zhu L. Property assessment of high-performance concrete containing three types of fibers. Int J Concr Struct Mater. 2021;15(1):1–17. doi:10.1186/s40069-021-00476-7. [Google Scholar] [CrossRef]
20. Chaallal O, Benmokrane B. Fiber-reinforced plastic rebars for concrete applications. Compos Part B Eng. 1996;27(3–4):245–52. doi:10.1016/1359-8368(95)00023-2. [Google Scholar] [CrossRef]
21. Zhu H, Li C, Cheng S, Yuan J. Flexural performance of concrete beams reinforced with continuous FRP bars and discrete steel fibers under cyclic loads. Polymers. 2022;14(7):1399. doi:10.3390/polym14071399. [Google Scholar] [PubMed] [CrossRef]
22. Benmokrane B, Chaallal O, Masmoudi R. Flexural response of concrete beams rsssseinforced with FRP reinforcing bars. ACI Struct J. 1996;93(1):46–55. doi:10.14359/9839. [Google Scholar] [CrossRef]
23. Sirimontree S, Keawsawasvong S, Thongchom C. Flexural behavior of concrete beam reinforced with GFRP bars compared to concrete beam reinforced with conventional steel reinforcements. J Appl Sci Eng. 2021;24(6). doi:10.6180/jase.202112_24(6).0009. [Google Scholar] [CrossRef]
24. Xiao SH, Lin JX, Li LJ, Guo YC, Zeng JJ, Xie ZH, et al. Experimental study on flexural behavior of concrete beam reinforced with GFRP and steel-fiber composite bars. J Build Eng. 2021;43(13):103087. doi:10.1016/j.jobe.2021.103087. [Google Scholar] [CrossRef]
25. Nanni A, de Luca A, Zadeh HJ. Reinforced concrete with FRP bars: mechanics and design. 2014. Available from: https://www.afzir.com/knowledge/wp-content/uploads/2018/08/Nanni-A.-Reinforced-Concrete-with-FRP-Bars-Mechanics-and-Design-2014.pdf. [Accessed 2024]. [Google Scholar]
26. Schutte CL. Environmental durability of glass-fiber composites. Mater Sci Eng R. 1994;13(7):265–323. doi:10.1016/0927-796X(94)90002-7. [Google Scholar] [CrossRef]
27. Wang H, Belarbi A. Ductility characteristics of fiber-reinforced-concrete beams reinforced with FRP rebars. Constr Build Mater. 2011;25(5):2391–401. doi:10.1016/j.conbuildmat.2010.11.040. [Google Scholar] [CrossRef]
28. Matos B, Correia JR, Castro LMS, França P. Structural response of hyperstatic concrete beams reinforced with GFRP bars: effect of increasing concrete confinement. Compos Struct. 2012;94(3):1200–10. doi:10.1016/j.compstruct.2011.10.021. [Google Scholar] [CrossRef]
29. Mousavi SR, Esfahani MR. Effective moment of inertia prediction of FRP-reinforced concrete beams based on experimental results. J Compos Constr. 2012;16(5):490–8. doi:10.1061/(asce)cc.1943-5614.0000284 [Google Scholar] [CrossRef]
30. Feng G, Zhu D, Guo S, Rahman MZ, Jin Z, Shi C. A review on mechanical properties and deterioration mechanisms of FRP bars under severe environmental and loading conditions. Cem Concr Compos. 2022;134(24):104758. doi:10.1016/j.cemconcomp.2022.104758. [Google Scholar] [CrossRef]
31. Hayashi T. On the improvement of mechanical properties of composites by hybrid composition. In: Proceedings of 8th International Reinforced Plastics Conference; 1972; London, England. p. 149–52. [Google Scholar]
32. Belarbi A, Chandrashekhara K, Watkins SE. Smart composite rebars with enhanced ductility. Proc Eng Mech. 1996;42(3):245–50. [Google Scholar]
33. Ali NM, Wang X, Wu Z. Integrated performance of FRP tendons with fiber hybridization. J Compos Constr. 2014;18(3):A4013007. doi:10.1061/(asce)cc.1943-5614.0000427 [Google Scholar] [CrossRef]
34. Bakis CE, Nanni A, Terosky JA, Koehler SW. Self-monitoring, pseudo-ductile, hybrid FRP reinforcement rods for concrete applications. Compos Sci Technol. 2001;61(6):815–23. doi:10.1016/S0266-3538(00)00184-6. [Google Scholar] [CrossRef]
35. Cui YH, Tao J. A new type of ductile composite reinforcing bar with high tensile elastic modulus for use in reinforced concrete structures. Can J Civ Eng. 2009;36(4):672–5. doi:10.1139/L09-012. [Google Scholar] [CrossRef]
36. You YJ, Park YH, Kim HY, Park JS. Hybrid effect on tensile properties of FRP rods with various material compositions. Compos Struct. 2007;80(1):117–22. doi:10.1016/j.compstruct.2006.04.065. [Google Scholar] [CrossRef]
37. Harris HG, Somboonsong W, Ko FK. New ductile hybrid FRP reinforcing bar for concrete structures. J Compos Constr. 1998;2(1):1–28. doi:10.1061/(ASCE)1090-0268(1998)2:1(28). [Google Scholar] [CrossRef]
38. Wang S, Xia P, Chen K, Gong F, Wang H, Wang Q, et al. Prediction and optimization model of sustainable concrete properties using machine learning, deep learning and swarm intelligence: a review. J Build Eng. 2023;80:108065. [Google Scholar]
39. Lu B, Xia Y, Ren Y, Xie M, Zhou L, Vinai G, et al. When machine learning meets 2D materials: a review. Adv Sci. 2024;11(13):2305277. [Google Scholar]
40. Hu T, Zhang H, Cheng C, Li H, Zhou J. Explainable machine learning: compressive strength prediction of FRP-confined concrete column. Mater Today Commun. 2024;39(4):108883. doi:10.1016/j.mtcomm.2024.108883. [Google Scholar] [CrossRef]
41. Cheng C, Taffese WZ, Hu T. Accurate prediction of punching shear strength of steel fiber-reinforced concrete slabs: a machine learning approach with data augmentation and explainability. Buildings. 2024;14(5):1223. doi:10.3390/buildings14051223. [Google Scholar] [CrossRef]
42. Angelis D, Sofos F, Karakasidis TE. Artificial intelligence in physical sciences: symbolic regression trends and perspectives. Arch Comput Methods Eng. 2023;30(6):3845–65. doi:10.1007/s11831-023-09922-z. [Google Scholar] [PubMed] [CrossRef]
43. Yao X, Lyu X, Sun J, Wang B, Wang Y, Yang M, et al. AI-based performance prediction for 3D-printed concrete considering anisotropy and steam curing condition. Constr Build Mater. 2023;375:130898. [Google Scholar]
44. Alyousef R, Rehman MF, Khan M, Fawad M, Khan AU, Hassan AM, et al. Machine learning-driven predictive models for compressive strength of steel fiber reinforced concrete subjected to high temperatures. Case Stud Constr Mater. 2023;19:e02418. [Google Scholar]
45. Alarfaj M, Qureshi HJ, Shahab MZ, Javed MF, Arifuzzaman M, Gamil Y. Machine learning based prediction models for spilt tensile strength of fiber reinforced recycled aggregate concrete. Case Stud Constr Mater. 2024;20:e02836. [Google Scholar]
46. Andersons J, Sparniņš E, Joffe R. Stiffness and strength of flax fiber/polymer matrix composites. Polym Compos. 2006;27(2):221–9. doi:10.1002/pc.20184. [Google Scholar] [CrossRef]
47. Affdl JCH, Kardos JL. The Halpin-Tsai equations: a review. Polym Eng Sci. 1976;16(5):344–52. doi:10.1002/pen.760160512. [Google Scholar] [CrossRef]
48. Sandier SI, Orbey H. 9 Mixing and combining rules. In: Sengers JV, Kayser RF, Peters CJ, White HJ, editors. Equations state fluids fluid mix. Amsterdam, Netherlands: Elsevier; 2000. vol. 5, p. 321–57. doi:10.1016/S1874-5644(00)80020-X. [Google Scholar] [CrossRef]
49. Tham MW, Fazita MN, Abdul Khalil HPS, Mahmud Zuhudi NZ, Jaafar M, Rizal S, et al. Tensile properties prediction of natural fibre composites using rule of mixtures: a review. J Reinf Plast Compos. 2019;38(5):211–48. doi:10.1177/0731684418813650. [Google Scholar] [CrossRef]
50. Arib RMN, Sapuan SM, Ahmad MMHM, Paridah MT, Khairul Zaman HMD. Mechanical properties of pineapple leaf fibre reinforced polypropylene composites. Mater Des. 2006;27(5):391–6. doi:10.1016/j.matdes.2004.11.009. [Google Scholar] [CrossRef]
51. Luo S, Netravali AN. Interfacial and mechanical properties of environment-friendly `green’ composites made from pineapple fibers and poly(hydroxybutyrate-co-valerate) resin. J Mater Sci. 1999;34(22):5449–56. doi:10.1023/A:1004791807509. [Google Scholar] [CrossRef]
52. Hashemi S. Effect of temperature on tensile properties of injection moulded short glass fibre and glass bead filled ABS hybrids. Express Polym Lett. 2008;2(7):474–84. doi:10.3144/expresspolymlett.2008.57. [Google Scholar] [CrossRef]
53. Mansor MR, Sapuan SM, Zainudin ES, Nuraini AA, Hambali A. Stiffness prediction of hybrid kenaf/glass fiber reinforced polypropylene composites using rule of mixtures (ROM) and rule of hybrid mixtures (RoHM). J Polym Mater. 2013;30(3):321–34. [Google Scholar]
54. Venkateshwaran N, Elayaperumal A, Sathiya GK. Prediction of tensile properties of hybrid-natural fiber composites. Compos Part B Eng. 2012;43(2):793–6. doi:10.1016/j.compositesb.2011.08.023. [Google Scholar] [CrossRef]
55. Miwa M, Horiba N. Effects of fibre length on tensile strength of carbon/glass fibre hybrid composites. J Mater Sci. 1994;29(4):973–7. doi:10.1007/BF00351419. [Google Scholar] [CrossRef]
56. Biagiotti J, Fiori S, Torre L, López-Manchado MA, Kenny JM. Mechanical properties of polypropylene matrix composites reinforced with natural fibers: a statistical approach. Polym Compos. 2004;25(1):26–36. doi:10.1002/pc.20002. [Google Scholar] [CrossRef]
57. Mirbagheri J, Tajvidi M, Hermanson JC, Ghasemi I. Tensile properties of wood flour/kenaf fiber polypropylene hybrid composites. J Appl Polym Sci. 2007; doi:10.1002/app.26363. [Google Scholar] [CrossRef]
58. Fu SY, Xu G, Mai YW. On the elastic modulus of hybrid particle/short-fiber/polymer composites. Compos Part B Eng. 2002;33(4):291–9. doi:10.1016/S1359-8368(02)00013-6. [Google Scholar] [CrossRef]
59. Facca AG, Kortschot MT, Yan N. Predicting the elastic modulus of natural fibre reinforced thermoplastics. Compos Part A Appl Sci Manuf. 2006;37(10):1660–71. doi:10.1016/j.compositesa.2005.10.006. [Google Scholar] [CrossRef]
60. López JP, Mutjé P, Angels Pèlach M, El Mansouri NE, Boufi S, Vilaseca F. Analysis of the tensile modulus of polypropylene composites reinforced with stone groundwood fibers. BioResources. 2012;7(1):1310–23. doi:10.15376/biores.7.1.1310-1323. [Google Scholar] [CrossRef]
61. Liang JZ. Predictions of Young’s modulus of short inorganic fiber reinforced polymer composites. Compos Part B Eng. 2012;43(4):1763–6. doi:10.1016/j.compositesb.2012.01.010. [Google Scholar] [CrossRef]
62. Wang HL, Yin ZY. High performance prediction of soil compaction parameters using multi expression programming. Eng Geol. 2020;276(5):105758. doi:10.1016/j.enggeo.2020.105758. [Google Scholar] [CrossRef]
63. Baykasoǧlu A, Öztaş A, Özbay E. Prediction and multi-objective optimization of high-strength concrete parameters via soft computing approaches. Expert Syst Appl. 2009;36(3):6145–55. doi:10.1016/j.eswa.2008.07.017. [Google Scholar] [CrossRef]
64. Nematzadeh M, Shahmansouri AA, Fakoor M. Post-fire compressive strength of recycled PET aggregate concrete reinforced with steel fibers: optimization and prediction via RSM and GEP. Constr Build Mater. 2020;252(6):119057. doi:10.1016/j.conbuildmat.2020.119057. [Google Scholar] [CrossRef]
65. Ilyas I, Zafar A, Javed MF, Farooq F, Aslam F, Musarat MA, et al. Forecasting strength of cfrp confined concrete using multi expression programming. Materials. 2021;14(23):7134. doi:10.3390/ma14237134. [Google Scholar] [PubMed] [CrossRef]
66. Bian F, Li TH, Cong PS. Genetic programming. Fenxi Huaxue. 1998;926–31 (In Chinese). [Google Scholar]
67. Cheng ZL, Zhou WH, Garg A. Genetic programming model for estimating soil suction in shallow soil layers in the vicinity of a tree. Eng Geol. 2020;268(1):105506. doi:10.1016/j.enggeo.2020.105506. [Google Scholar] [CrossRef]
68. Gandomi AH, Babanajad SK, Alavi AH, Farnam Y. Novel approach to strength modeling of concrete under triaxial compression. J Mater Civ Eng. 2012;24(9):1132–43. doi:10.1061/(ASCE)MT.1943-5533.0000494 [Google Scholar] [CrossRef]
69. Gandomi AH, Yun GJ, Alavi AH. An evolutionary approach for modeling of shear strength of RC deep beams. Mater Struct Constr. 2013;46(12):2109–19. doi:10.1617/s11527-013-0039-z. [Google Scholar] [CrossRef]
70. Gao W. A comprehensive review on identification of the geomaterial constitutive model using the computational intelligence method. Adv Eng Inform. 2018;38(3):420–40. doi:10.1016/j.aei.2018.08.021. [Google Scholar] [CrossRef]
71. Ferreira C. Gene expression programming: a new adaptive algorithm for solving problems Cândida. Complex Syst. 2011;13(2):87–129. [Google Scholar]
72. Iqbal M, Zhang D, Jalal FE, Faisal Javed M. Computational AI prediction models for residual tensile strength of GFRP bars aged in the alkaline concrete environment. Ocean Eng. 2021;232(5):109134. doi:10.1016/j.oceaneng.2021.109134. [Google Scholar] [CrossRef]
73. Chu HH, Khan MA, Javed M, Zafar A, Ijaz Khan M, Alabduljabbar H, et al. Sustainable use of fly-ash: use of gene-expression programming (GEP) and multi-expression programming (MEP) for forecasting the compressive strength geopolymer concrete. Ain Shams Eng J. 2021;12(4):3603–17. doi:10.1016/j.asej.2021.03.018. [Google Scholar] [CrossRef]
74. Awoyera PO, Kirgiz MS, Viloria A, Ovallos-Gazabon D. Estimating strength properties of geopolymer self-compacting concrete using machine learning techniques. J Mater Res Technol. 2020;9(4):9016–28. doi:10.1016/j.jmrt.2020.06.008. [Google Scholar] [CrossRef]
75. Khan MA, Zafar A, Akbar A, Javed MF, Mosavi A. Application of gene expression programming (GEP) for the prediction of compressive strength of geopolymer concrete. Materials. 2021;14(5):1106. doi:10.3390/ma14051106. [Google Scholar] [PubMed] [CrossRef]
76. Farooq F, Nasir Amin M, Khan K, Rehan Sadiq M, Javed MF, Aslam F, et al. A comparative study of random forest and genetic engineering programming for the prediction of compressive strength of high strength concrete (HSC). Appl Sci. 2020;10(20):7330. doi:10.3390/app10207330. [Google Scholar] [CrossRef]
77. Akin OO, Ocholi A, Abejide OS, Obari JA. Prediction of the compressive strength of concrete admixed with metakaolin using gene expression programming. Adv Civ Eng. 2020;2020(2):1–7. doi:10.1155/2020/8883412. [Google Scholar] [CrossRef]
78. Awoyera PO, Mansouri I, Abraham A, Viloria A. A new formulation for strength characteristics of steel slag aggregate concrete using an artificial intelligence-based approach. Comput Concr. 2021;27(4):333–41. doi:10.12989/cac.2021.27.4.333. [Google Scholar] [CrossRef]
79. Khan MA, Zafar A, Farooq F, Javed MF, Alyousef R, Alabduljabbar H, et al. Geopolymer concrete compressive strength via artificial neural network, adaptive neuro fuzzy interface system, and gene expression programming with k-fold cross validation. Front Mater. 2021;8:621163. doi:10.3389/fmats.2021.621163. [Google Scholar] [CrossRef]
80. Ahmadi M, Kheyroddin A, Dalvand A, Kioumarsi M. New empirical approach for determining nominal shear capacity of steel fiber reinforced concrete beams. Constr Build Mater. 2020;234:117293. doi:10.1016/j.conbuildmat.2019.117293. [Google Scholar] [CrossRef]
81. Mousavi M, Azarbakht A, Rahpeyma S, Farhadi A. On the application of genetic programming for new generation of ground motion prediction equations. Handb Genet Program Appl. 2015;38(1):309–43. doi:10.1007/978-3-319-20883-1_12. [Google Scholar] [CrossRef]
82. Wang M, Wan W. A new empirical formula for evaluating uniaxial compressive strength using the Schmidt hammer test. Int J Rock Mech Min Sci. 2019;123(1):104094. doi:10.1016/j.ijrmms.2019.104094. [Google Scholar] [CrossRef]
83. Soleimani S, Rajaei S, Jiao P, Sabz A, Soheilinia S. New prediction models for unconfined compressive strength of geopolymer stabilized soil using multi-gen genetic programming. Meas J Int Meas Confed. 2018;113(23):99–107. doi:10.1016/j.measurement.2017.08.043. [Google Scholar] [CrossRef]
84. Ferreira C. Mutation, transposition, and recombination: an analysis of the evolutionary dynamics. In: Proceedings of the 6th Joint Conference on Information Science; New York, USA; 2002. [Google Scholar]
85. Gandomi AH, Roke DA. Assessment of artificial neural network and genetic programming as predictive tools. Adv Eng Softw. 2015;88(3):63–72. doi:10.1016/j.advengsoft.2015.05.007. [Google Scholar] [CrossRef]
86. Protchenko K, Zayoud F, Urbański M, Szmigiera E. Tensile and shear testing of basalt fiber reinforced polymer (BFRP) and hybrid basalt/carbon fiber reinforced polymer (HFRP) bars. Materials. 2020;13(24):5839. doi:10.3390/ma13245839. [Google Scholar] [PubMed] [CrossRef]
87. Szmigiera ED, Protchenko K, Urbański M, Garbacz A. Mechanical properties of hybrid FRP bars and nano-hybrid FRP bars. Arch Civ Eng. 2019;65(1):97–110. doi:10.2478/ace-2019-0007. [Google Scholar] [CrossRef]
88. Won JP, Park CG, Jang CIl. Tensile fracture and bond properties of ductile hybrid FRP reinforcing bars. Polym Polym Compos. 2007;15(1):9–16. doi:10.1177/096739110701500102. [Google Scholar] [CrossRef]
89. Gao D, Zhang Y, Wen F, Fang D, Pang Y, Tang J, et al. Design method and experiment verification for hybrid fiber reinforced polymer bars with both tensile ductility and different strength grades. J Build Eng. 2022;46(6):103723. doi:10.1016/j.jobe.2021.103723. [Google Scholar] [CrossRef]
90. Gao D, Zhang Y, Pang Y, Wen F, Fang D, Tang J. Five-stage tensile constitutive model of hybrid fiber reinforced polymer bar. J Build Eng. 2022;58(1):105006. doi:10.1016/j.jobe.2022.105006. [Google Scholar] [CrossRef]
91. Hiesch D, Proske T, Graubner CA, Bujotzek L, El Ghadioui R. Theoretical and experimental investigation of the time-dependent relaxation rates of GFRP and BFRP reinforcement bars. Struct Concr. 2023;24(2):2800–16. doi:10.1002/suco.202200212. [Google Scholar] [CrossRef]
92. Youssef T, Benmokrane B. Creep behavior and tensile properties of GFRP bars under sustained service loads. Am Concr Institute, ACI Spec Publ. 2011. doi:10.14359/51682449. [Google Scholar] [CrossRef]
93. Hitesh Kumar M, Mohandoss P, Anjana L. Investigation on tensile and creep behaviour of glass fiber reinforced polymer (GFRP) bars: a review. Mater Today Proc. 2023;7(2):194. doi:10.1016/j.matpr.2023.04.656. [Google Scholar] [CrossRef]
94. Shi J, Wang X, Huang H, Wu Z. Relaxation behavior of prestressing basalt fiber-reinforced polymer tendons considering anchorage slippage. J Compos Mater. 2017;51(9):1275–84. doi:10.1177/0021998316673893. [Google Scholar] [CrossRef]
95. Yang D, Zhang J, Song S, Zhou F, Wang C. Experimental investigation on the creep property of carbon fiber reinforced polymer tendons under high stress levels. Materials. 2018;11(11):2273. doi:10.3390/ma11112273. [Google Scholar] [PubMed] [CrossRef]
96. Botchkarev A. A new typology design of performance metrics to measure errors in machine learning regression algorithms. Interdiscip J Inf, Knowl, Manag. 2019;14:45–76. doi:10.28945/4184. [Google Scholar] [CrossRef]
97. Çanakci H, Baykasoǧlu A, Güllü H. Prediction of compressive and tensile strength of Gaziantep basalts via neural networks and gene expression programming. Neural Comput Appl. 2009;18(8):1031–41. doi:10.1007/s00521-008-0208-0. [Google Scholar] [CrossRef]
98. Iqbal MF, Liu QF, Azim I, Zhu X, Yang J, Javed MF, et al. Prediction of mechanical properties of green concrete incorporating waste foundry sand based on gene expression programming. J Hazard Mater. 2020;384:121322. doi:10.1016/j.jhazmat.2019.121322. [Google Scholar] [PubMed] [CrossRef]
99. Alavi AH, Gandomi AH, Nejad HC, Mollahasani A, Rashed A. Design equations for prediction of pressuremeter soil deformation moduli utilizing expression programming systems. Neural Comput Appl. 2013;23(6):1771–86. doi:10.1007/s00521-012-1144-6. [Google Scholar] [CrossRef]
100. Zhang W, Zhang R, Wu C, Goh ATC, Lacasse S, Liu Z, et al. State-of-the-art review of soft computing applications in underground excavations. Geosci Front. 2020;11(4):1095–106. doi:10.1016/j.gsf.2019.12.003. [Google Scholar] [CrossRef]
101. Alade IO, Abd Rahman MA, Saleh TA. Modeling and prediction of the specific heat capacity of Al2O3/water nanofluids using hybrid genetic algorithm/support vector regression model. Nano-Structures and Nano-Objects. 2019;17:103–11. doi:10.1016/j.nanoso.2018.12.001. [Google Scholar] [CrossRef]
102. Kisi O, Shiri J, Tombul M. Modeling rainfall-runoff process using soft computing techniques. Comput Geosci. 2013;51(2):108–17. doi:10.1016/j.cageo.2012.07.001. [Google Scholar] [CrossRef]
103. Majidifard H, Jahangiri B, Rath P, Urra Contreras L, Buttlar WG, Alavi AH. Developing a prediction model for rutting depth of asphalt mixtures using gene expression programming. Constr Build Mater. 2021;267(3):120543. doi:10.1016/j.conbuildmat.2020.120543. [Google Scholar] [CrossRef]
104. Gandomi AH, Alavi AH, Mousavi M, Tabatabaei SM. A hybrid computational approach to derive new ground-motion prediction equations. Eng Appl Artif Intell. 2011;24(4):717–32. doi:10.1016/j.engappai.2011.01.005. [Google Scholar] [CrossRef]
105. Wong TT, Yeh PY. Reliable accuracy estimates from k-fold cross validation. IEEE Trans Knowl Data Eng. 2020;32(8):1586–94. doi:10.1109/TKDE.2019.2912815. [Google Scholar] [CrossRef]
106. Bengio Y, Grandvalet Y. No unbiased estimator of the variance of k-fold cross-validation. J Mach Learn Res. 2004;5:1089–105. [Google Scholar]
Cite This Article
 Copyright © 2024 The Author(s). Published by Tech Science Press.
This work is licensed under a Creative Commons Attribution 4.0 International License , which permits unrestricted use, distribution, and reproduction in any medium, provided the original work is properly cited.
 Downloads
 Citation Tools