
 Submit a Paper
 Propose a Special lssue
 Open Access
ARTICLE

Rheological Investigation on a Polypropylene/Low Density Polyethylene Blending Melt
1 Jiangsu Key Laboratory of Environmentally Friendly Polymeric Materials, School of Materials Science and Engineering, Changzhou University, Changzhou, 213164, China
2 Jiangsu Collaborative Innovation Center of Photovolatic Science and Engineering, Changzhou University, Changzhou, 213164, China
3 National Experimental Demonstration Center for Materials Science and Engineering, Changzhou University, Changzhou, 213164, China
* Corresponding Author: Huayong Liao. Email:
Journal of Polymer Materials 2024, 41(1), 45-54. https://doi.org/10.32604/jpm.2024.053021
Received 16 January 2024; Accepted 29 April 2024; Issue published 21 June 2024
 View Full Text
 Download PDF
Abstract
Polymer blending with co-continuous morphology has garnered the interest of many researchers, but corresponding rheological models are rarely presented. In this study, the dynamic rheological behavior of a blend of polypropylene (PP) and low-density polyethylene (LDPE) in the ratio of 50/50 wt% is investigated, and a rheological model suggested by Yu et al. is used to fit the dynamic modulus. The rheological measurement shows that at low frequency, pure PP has higher complex viscosity and dynamic modulus than LDPE. SEM images reveal that the morphology among the 40/60 and 60/40 blends is non-dispersive. The fitting results indicate that the data at low frequency are underestimated by Yu model with lower coefficient K, while the data are well-fit by the model with enough K. Furthermore, the coefficient K has no obvious influence on the fitting since B type structure in the original Yu model has a very weak contribution to dynamic modulus when orientation and distortion of the cylinders standing for the co-continuous structure cannot be neglected. The key coefficients in Yu model are K and the characteristic length , while the co-efficient K can be neglected. Thus, a simplified form of the model is suggested to predict the rheological dynamic modulus data for the PP/LDPE blending melt.Keywords
Nomenclature
| G′ | Storage modulus |
| α | Interfacial tension |
| Sv | Specific area |
| Characteristic length of the co-continuous phase | |
| a | Radius of the cylinder |
| b | Length of the cylinder |
| Reduced length | |
| Reduced length | |
| f1, f2 | Parameters associated with p |
| p | Viscosity ratio of fluid Ⅰ to fluid Ⅱ |
| ω | Angular frequency |
| ηm | Matrix’s viscosity |
| τ | Relaxation time of the matrix, τ = ηma/α |
| ki | Coefficients in Eq. (1) |
| Volume fraction of fluid Ⅰ, | |
| Complex modulus of fluid Ⅰ in the ideal co-continuous morphology | |
| Complex modulus of fluid Ⅱ in the ideal co-continuous morphology | |
| Mw | Mass average molar masses |
| Mn | Number average molar masses |
| ψi | Volume fraction of component i |
| ηi | Melt viscosity of component i |
Blending different polymers together is a common way to create new polymer materials. However, because of the large mass weight and complex interactions, most polymer blends have poor miscibility. Basically, there are two types of phase morphologies for binary blends, i.e., droplet morphology and co-continuous morphology, which depend on many factors, such as the volume ratio of the two components, interfacial tension, viscosity ratio, and blending conditions [1]. The co-continuous morphology is preferred over the droplet morphology because it enables the polymer blends to have more favorable properties [2–5].
Various rheological models have been studied to understand rheology of blends with droplet morphology, such as the Palierne model [6,7], Lee and Park model [8,9], and others [10]. However, developing rheological models for blending melt with co-continuous morphology is quite challenging due to difficulties including characterizing the morphology [11]. Even though advanced scientific technology has made it possible to characterize co-continuous morphology, it is still not easy to establish a rheological model that correlates rheology and morphology. Only a limited number of models have been suggested so far, such as the one proposed by Yu and his colleagues [12] based on a mechanical model presented by Veenstra and his team [13]. This rheological model can be expressed as follows:
The model parameters are listed in the nomenclature before the introduction. In this work, Eq. (1) is referred to as the Yu model. Fig. 1 illustrates the interface schematics of the ideal co-continuous morphology [12]. The co-continuous structure consists of multiple repeated elements shown in Fig. 1a. In oscillatory shear, there are three types of deformation depicted in Fig. 1b. The stress response in a particular flow field can be considered as the sum of the response of these cylinders. Type A has little contribution to the stress response of the blend as the area and orientation of the interface almost remain unchanged during shear flow. For type B, the interfacial tension has little contribution to this kind of deformation since the cross-section of the cylinder also remains unchanged. Only the tilt of the cylinder influences the stress response. For type C, the circular shape of the cylinder turns into an ellipse with a constant length. This deformation has a significant contribution to the stress as the interfacial area increases considerably. In Eq. (1), the coefficients are represented by ki, where the subscript B and C indicate the transformation of type B and type C structure, respectively, as shown in Fig. 1b.
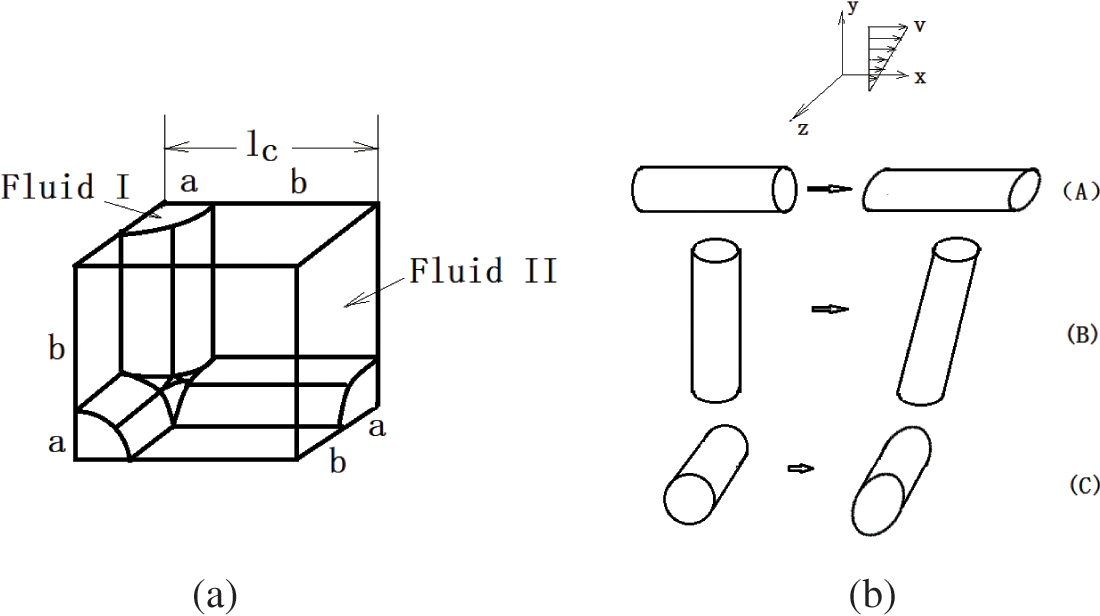
Figure 1: Schematics of an ideal co-continuous morphology in Yu model for (a) the interfacial contribution and (b) deformation of interfaces
In Eq. (1), the complex modulus of the co-continuous blends is
Eq. (3) represents a symmetric expression for fluids I and II. The free parameter is
In a co-continuous morphology, the orientation of cylinders can be random. To account for the random orientation and possible distortion of continuous elements, coefficients KB and KC were introduced into Eq. (1) [12]. For isotropic blends, KB and KC should have the same order of magnitude, and KB/KC is about 1. However, for co-continuous blends under shear flow or compression-like flow, the B type structure will decrease, and KB/KC would be less than 1. According to the work of Yu and co-workers [12], Yu model can fit the data well for some blends, such as PS/POE (40/60, 50/50, and 60/40), PS/SAN (50/50), PS/PEO (50/50), PS/PMMA (35/65), and PLA/PCL (50/50).
In this work, the Yu model was utilized to fit the dynamic rheological data. Additionally, the coefficients were simplified and reduced to only one, resulting in a simplified Yu model.
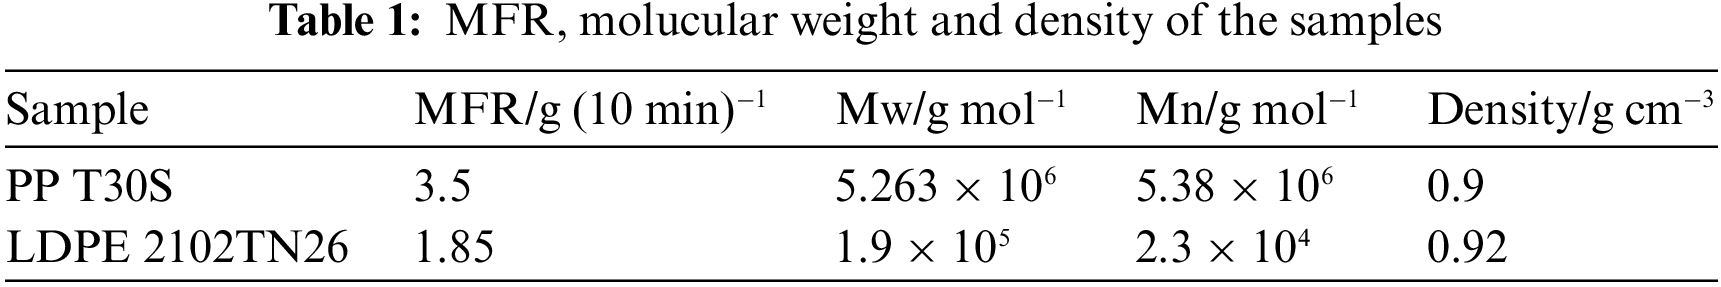
Two different types of plastic, PP T30S and LDPE 2102TN26, were purchased from Dalian and Qilu Petro China, respectively. The melt flow rate (MFR) of PP and LDPE was measured at 230°C and 190°C, respectively, using a 2.16 kg weight. The density was measured at room temperature. The measured values are listed in Table 1.
PP and LDPE samples were dried using an electric blast drying oven at 80°C for 12 h. A high-speed mixer from Fuxin Light Industry Machinery Factory in Liaoning, China was then used to mix the PP/LDPE blend at a weight ratio of 50/50. To analyze the phase morphology, other weight ratios such as 30/70, 40/60, 60/40, and 70/30 were also prepared. The PP/LDPE blends were extruded using a co-rotating twin screw extruder from Rubber and Plastic Machinery Factory in Guangzhou, China at 210°C, and blended particles were obtained using a granulator. The blended samples were then dried at 85°C for 12 h using an electric blast drying oven. Sample disks with diameters of 25 mm were prepared for rheological measurement using a compression mold at 210°C and 10 MPa.
Scanning electron microscope (SEM): The samples of PP/LDPE blends were brittlely fractured after being kept in liquid nitrogen for half an hour.
The weight ratios of the blends were 30/70, 40/60, 50/50, 60/40, and 70/30. Gold was sprayed on the cross sections of the samples and micrographs were taken using a scanning electron microscope (SEM) LE0438VP from Hitachi Co., Japan. The average size of the dispersed phase was calculated using Nano Measurer 1.2.0 software.
Rheological measurement: A rotational rheometer with a parallel-plates geometry manufactured by Anton Paar GmbH was employed to measure the dynamic rheological properties of the polymer samples. The parallel plates have a diameter of 25 mm with a gap of 1 mm between them. The angular frequency ranged from 0.028 to 300 rad/s at two different temperatures—210°C and 230°C. The samples were subjected to an applied strain of 4%, which was within the linear viscoelastic region determined through strain sweeping. Nitrogen gas was employed during the rheological measurement to prevent possible oxidation of the polymer samples at high temperatures. The samples were allowed to rest on the rheometer for 5 min to remove any thermal history before conducting the rheological measurement.
3.1 Morphology and Rheological Behavior of Polymer Blending Melt
Fig. 1 shows SEM images of the PP/LDPE blends. In the PP/LDPE (30/70) blend, dispersed morphology can be observed. PP and LDPE are the dispersed droplet and matrix, respectively. The condition for phase inversion can be expressed as follows [14]:
where ψi and ηi represent the volume fraction and melt viscosity of component i, respectively.
At 210°C and 230°C, the ratio of ψ1/ψ2 (PP/LDPE) is 35/65 and 44/56, respectively, and the viscosity is zero shear one. Models that use the viscosity ratio approach face difficulties in predicting the phase inversion at low shear rates [15]. However, Wu’s work [15] shows that this model accurately predicted the phase inversion region at a shear rate of about 40 s−1. Similarly, in this work, the ratio of ψ1/ψ2 (PP/LDPE) at a shear rate of 40 s−1 is 48/52 and 51/49 at 210°C and 230°C, respectively, which corresponds to the phase inversion. The models predict that it is much more likely for the less viscous phase to be the continuous phase [16–18].
Figs. 2b–2d show the morphologies of the 40/60, 50/50, and 60/40 blends, respectively. These blends do not exhibit dispersed morphologies. It is difficult to confirm a distinct co-continuous morphology, as the optical contrast of PP and LDPE is not high enough. On the other hand, the 70/30 blend clearly shows a dispersed morphology, which is different from the 30/70 blend (Figs. 2a and 2e). In the 70/30 blend, LDPE is the dispersed phase, and PP is the matrix. The average diameter of the 30/70 blend and 70/30 blend is 0.57 and 0.55 µm, respectively.
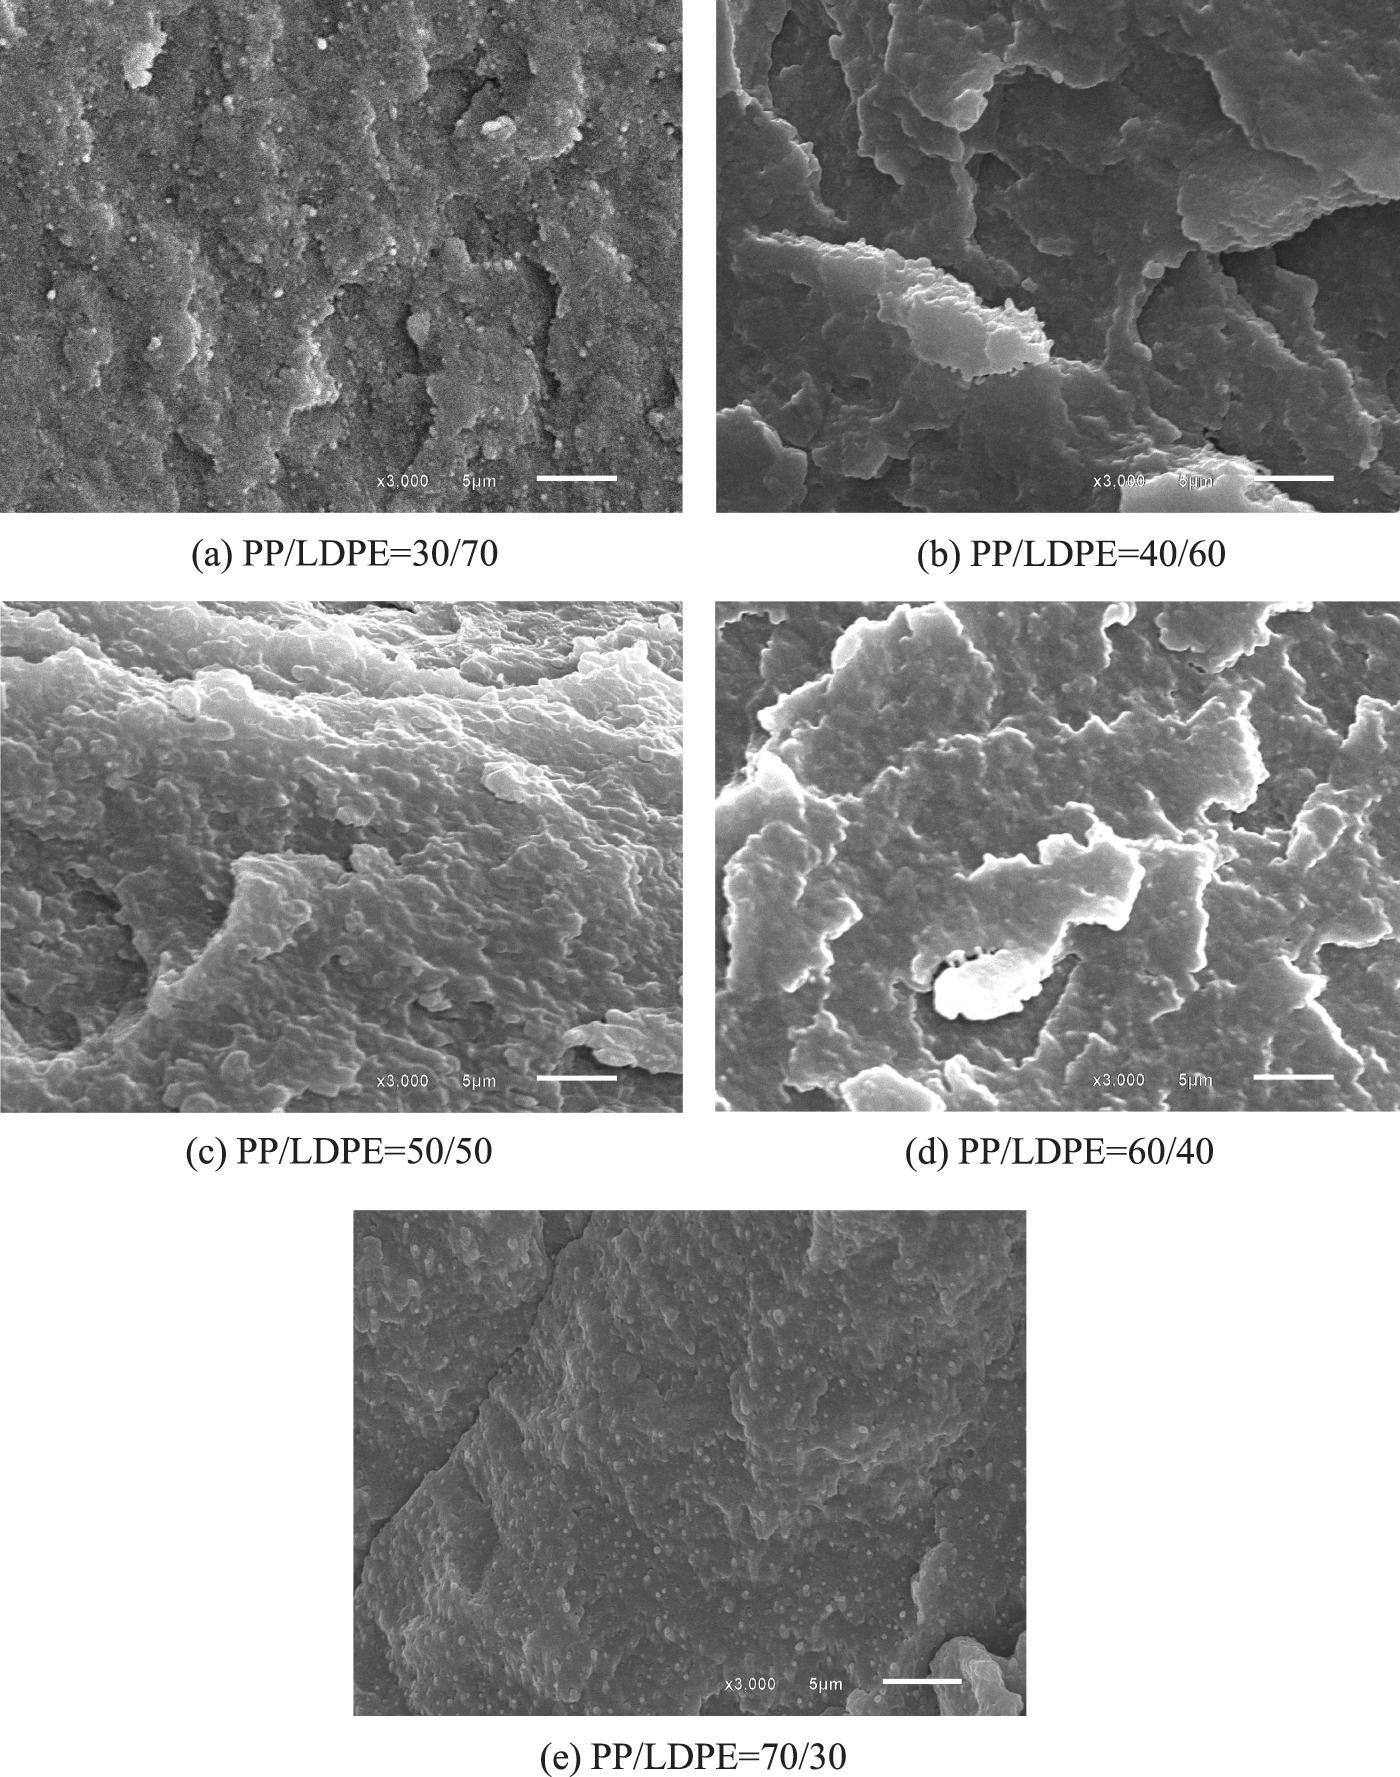
Figure 2: SEM images of a PP/LDPE blends
The storage modulus of the PP/LDPE binary blend shows an interesting trend as the LDPE content is varied. Initially, it increases with increasing LDPE content, reaching a peak at around 30%. After this point, it slowly drops until 70% of LDPE content is reached, beyond which it drops quickly. This trend suggests a phase inversion of the binary blend, which is consistent with the morphology shown in Fig. 3. It also implies a transition from dispersed to co-continuous morphology, as per studies [19,20].
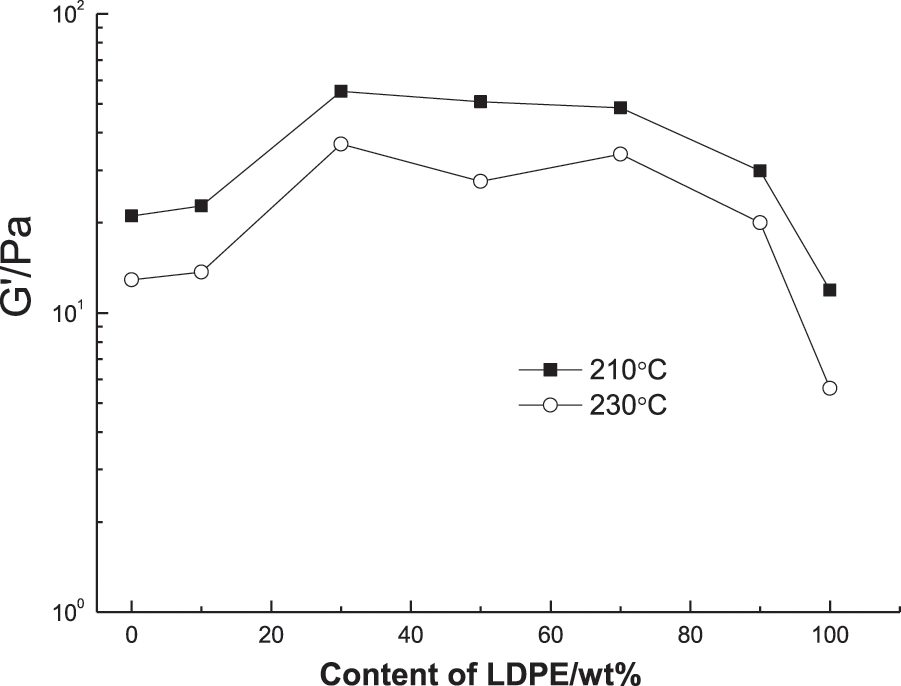
Figure 3: Storage modulus at 0.028 rad/s of PP/LDPE blends at 210°C and 230°C
Fig. 4 shows the dynamic rheological curves of the PP/LDPE (50/50) blend as well as neat polymers at 210°C and 230°C, respectively. It is obvious PP has higher viscosity than LDPE. In the PP/LDPE blend with a weight ratio of PP/LDPE less than 1, LDPE forms the continuous phase as it is less viscous than PP, which is the dispersed phase. The viscosity curve and loss modulus of the blend lie between the two components, but the storage modulus does not. At both temperatures, the storage modulus of the 50/50 blend shows a plateau at low frequencies, beyond those of PP and LDPE. This plateau occurs due to an increase in the interfacial area between the two phases, rather than the shape relaxation of the dispersed droplets [21]. A larger interfacial area results in a higher interfacial modulus [22], as more time is needed for the interface between the two phases to relax. This unique characteristic at low frequency invalidates the G-M model [23] and Palierne model [6], which only consider dispersed morphology. The 70/30 and 30/70 PP/LDPE blends have droplet morphology and do not show an elasticity plateau at low frequency, which is not shown in this work.
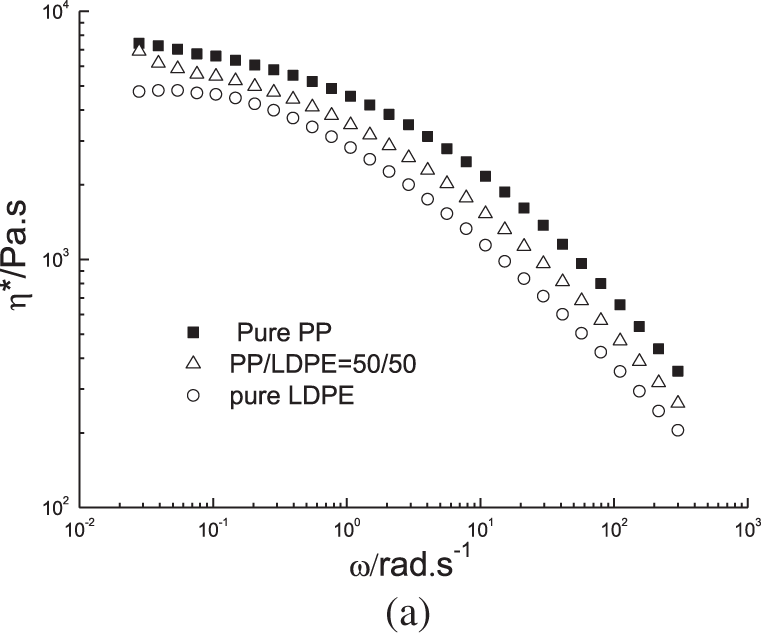
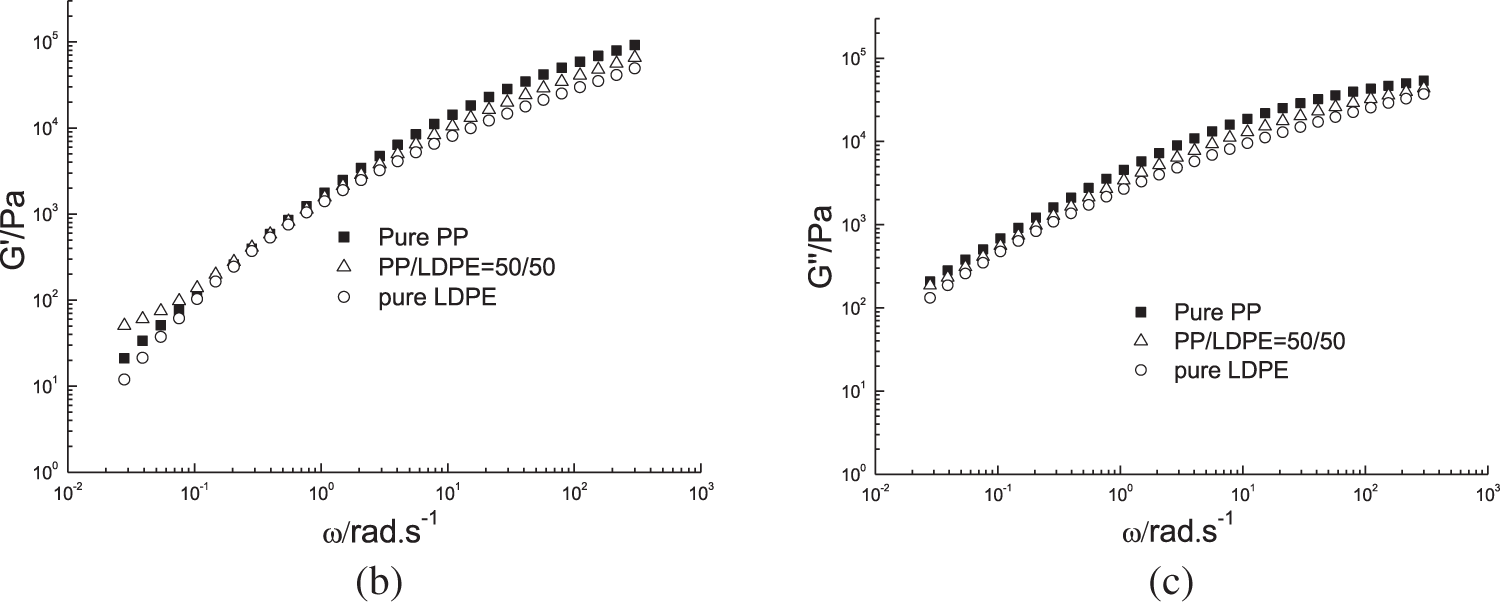
Figure 4: (a) Complex viscosity, (b) storage modulus, and (c) loss modulus vs. angular frequency of PP/LDPE blends at 210°C
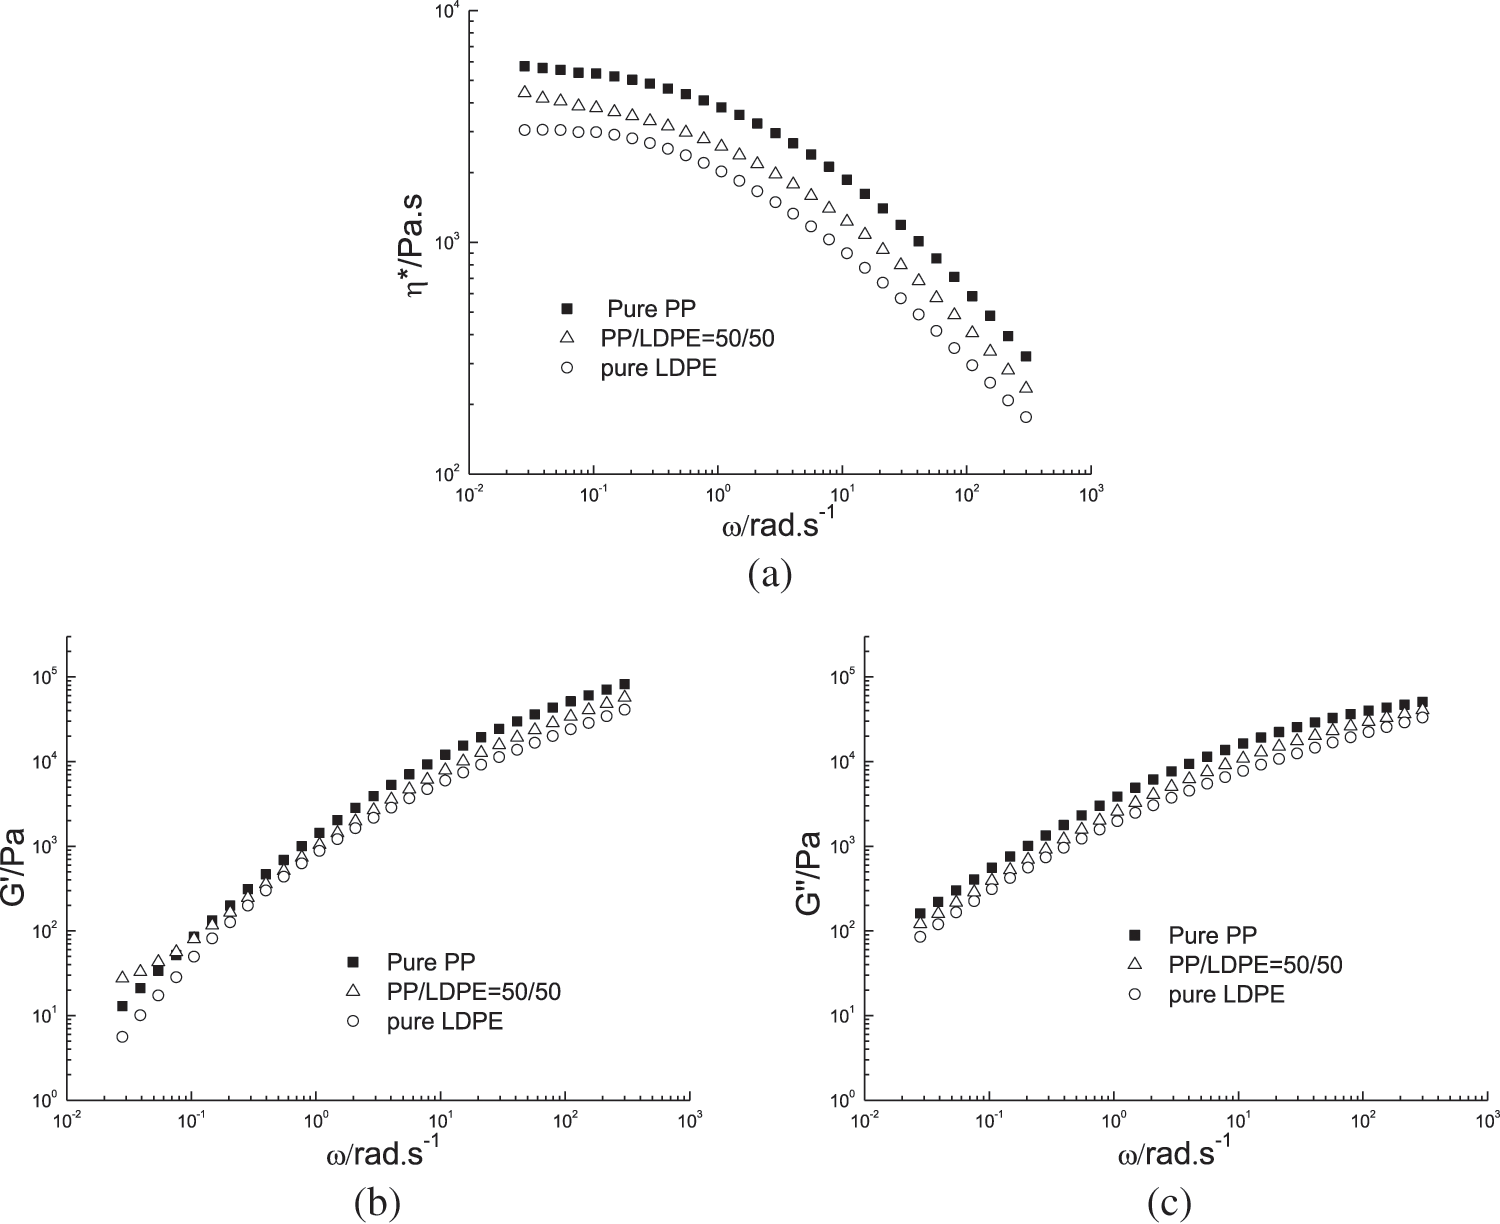
Figure 5: (a) Complex viscosity, (b) storage modulus, and (c) loss modulus vs. angular frequency of PP/LDPE blends at 230°C
Yu model (Eq. (1)) was used to fit the G′ data for the PP/LDPE (50/50) blend. According to [24], the interfacial tension of the blend is 0.214 mN/m at 210°C and 0.098 mN/m at 230°C. Yu model has two parameters: KB or KC and KB/KC. However, only KB/KC was shown in Yu’s fitting work. The value of KB or KC was not presented in the fitting. Although KB/KC may be small, KC may be very large! As explained earlier, the interfacial tension has little contribution to the B-type deformation. Only the tilt of the cylinder has an impact. On the other hand, C-type has a significant impact on the interfacial deformation of the blend due to the shape change of the cross-section of the cylinder. This work has been done to show their different influences in dynamic shear flow. If KB/KC = 0.1, KC should be much larger than KB. Fig. 6 exhibits the fitting curves at two temperatures. For the fixed KB/KC ratio and different KC values, the fitting results are different. Fig. 6a demonstrates that the larger the value of KC, the closer the fitting curve. However, when KC value is too low (0.07 and 0.7), the fitting curves are located below the data. Conversely, when KC value is large enough (7), Yu model fits the data well. However, if KC value is too high, the fitting curve will lay beyond the data (not shown in Fig. 6a). Fig. 6b shows the fitting curve for the data at 230°C. If KC value is lower than 8.3, the fitting curves will lay below the data. The fitting curve with KC value of 8.3 agrees well with the data. At the two temperatures shown, the characteristic length is 6 µm, and the KB/KC ratio is 0.1.
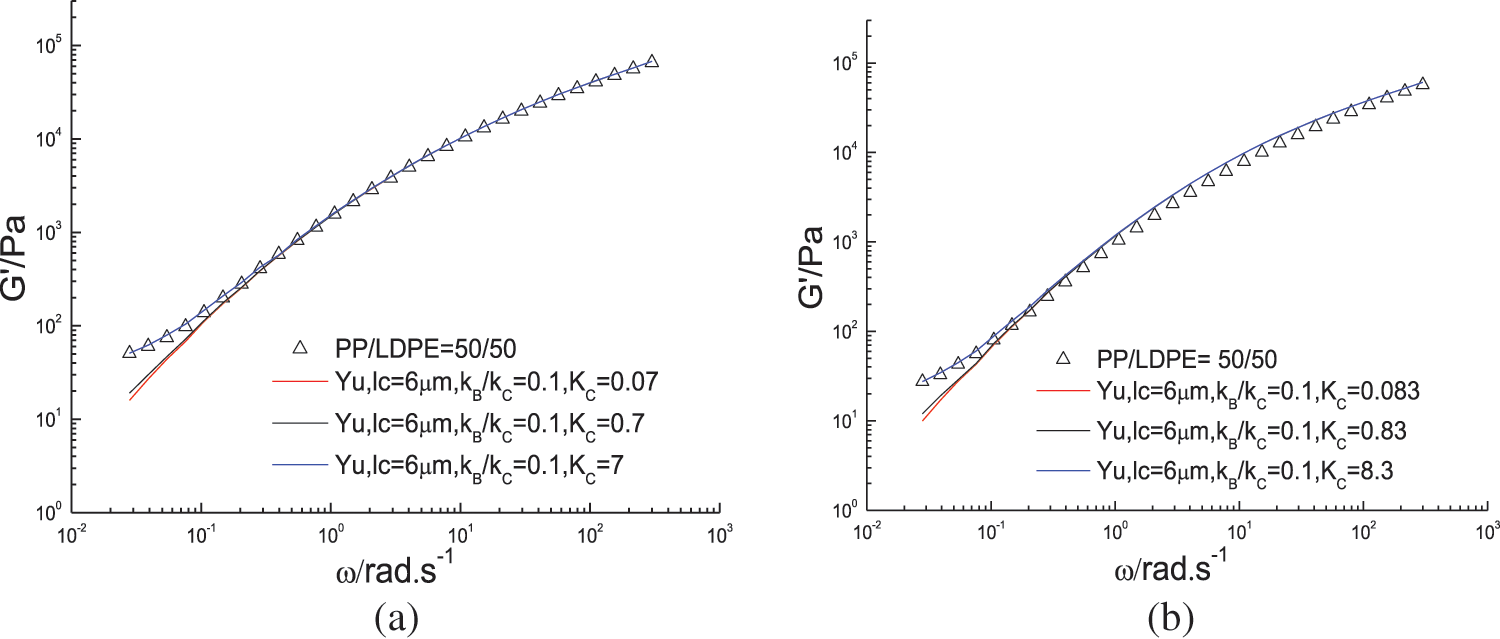
Figure 6: Fit of the dynamic storage modulus data to Yu model with fixed KB/KC and various KC for the PP/LDPE blends, (a) 210°C, (b) 230°C
A further fitting was carried out with fixed KC and varying KB/KC ratios, as presented in Fig. 7. Fig. 7a indicates that if KC is low, adjusting the ratio or KB value, has no effect on the fitting outcome. The fitting curve at low frequency is below the data if KC is not enough. In fact, if KC is insufficient, the fitting curve falls below the data at low frequency, which means the model with low KC value underestimates the data. However, when KC is increased to a higher value, as demonstrated in Fig. 7b, the KB/KC ratio or KB has no impact on the fitting when KB/KC is less than 1. If KB/KC is 1, i.e., when KB is considerably increased, the fitting curve overestimates the data at low frequency. Since type B deformation has little contribution to the stress of the blend, it is unnecessary to emphasize the value of the KB co-efficient during the fitting process. When KB/KC is less than 1, the KB co-efficient can be neglected in Eq. (1), and only KC should be retained. Thus, Eq. (1) can be rewritten as Eq. (5) by removing the KB item.
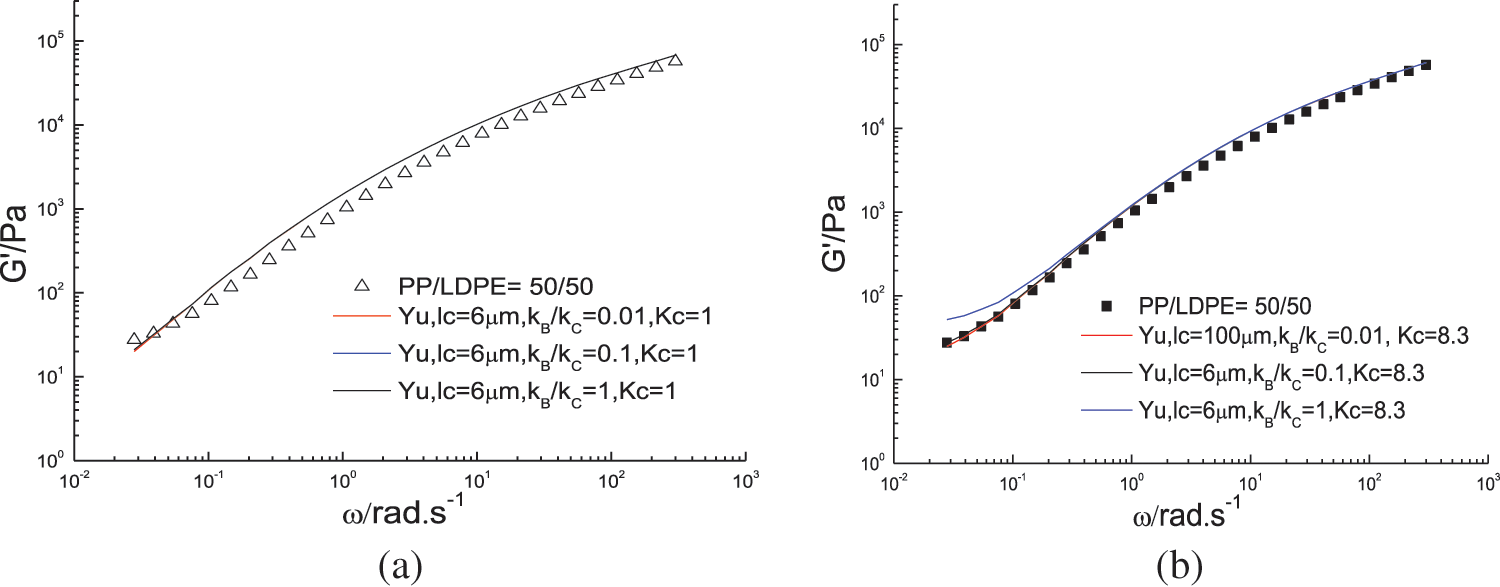
Figure 7: Fit of the dynamic storage modulus data to YW Yu model with various KB/KC and fixed KC for the PP/LDPE blends, (a) 210°C, (b) 230°C
The simplified model (Eq. (5)) is applicable only when the KB/KC ratio is less than 1. In Yu’s research [10], the KB/KC ratio for the best-fitting curves is 0.12, 0.2, 1, and 0.4 in Figs. 4 to 6, respectively, most of which are less than or equal to 1. This simplified model is effective in most cases where orientation and distortion are present, with only two fitting parameters, KC and
A rheological investigation was carried out on a blend of PP/LDPE (50/50 wt%) by performing small amplitude oscillatory shear at two different temperatures, namely 210°C and 230°C. The SEM images of the blends showed that those near the 50/50 ratio have a non-dispersed morphology. The storage modulus G′ data was analyzed using a rheological model proposed by Yu et al. A simplified form of the model was suggested to describe the G′ data at both temperatures, as in the original Yu model, the B type structure had little contribution to dynamic modulus. The fitting results confirmed that the co-efficient KB can be neglected in the simplified model in this case, which produced a desirable fitting result for the PP/LDPE (50/50) blend.
Acknowledgement: None.
Funding Statement: The authors received no specific funding for this study.
Author Contributions: The authors confirm contribution to the paper as follows: data collection: Jing Gao; analysis and interpretation of results: Huayong Liao; draft manuscript preparation: Chunlin Liu, Guoliang Tao. All authors reviewed the results and approved the final version of the manuscript.
Availability of Data and Materials: The authors confirm that the data supporting the findings of this study are available within the article.
Conflicts of Interest: The authors declare that they have no conflicts of interest to report regarding the present study.
References
1. Xiang F, Shi Y, Li X, Huang T, Chen C, Peng Y, et al. Cocontinuous morphology of immiscible high density polyethylene/polyamide6 blend induced by multiwalled carbon nanotubes network. Eur Polym J. 2012;48(12):350–61. [Google Scholar]
2. Galloway JA, Koester KJ, Paasch BJ, Macosko CW. Effect of sample size on solvent extraction for detecting cocontinuity in polymer blends. Polymer. 2004;45(2):423–8. doi:10.1016/j.polymer.2003.10.098. [Google Scholar] [CrossRef]
3. Zhang K, Jiang L, Wu G. Co-continuity and thermal expansion of injection molded EPDM/PP blends with heterogeneous dispersion of nanoparticles. Compos Sci Technol. 2016;125:123–31. doi:10.1016/j.compscitech.2016.01.024. [Google Scholar] [CrossRef]
4. Chen J, Zhang J, Deng J, Qiu S, Zheng J, Chen Y, et al. Control of graphene nanoplatelets at the interface of the co-continuous polypropylene/polyamides 6 blend under the elongational flow. Eur Polym J. 2023;182:111703. doi:10.1016/j.eurpolymj.2022.111703. [Google Scholar] [CrossRef]
5. Li Y, Gancheva T, Estakhrianhaghighi E, Favis BD, Akbarzadeh A. Material extrusion of quaternary co-continuous biopolymers: a strategy for realizing lightweight cellular solids with high impact toughness. Addit Manuf. 2023;77:103805. [Google Scholar]
6. Palierne JF. Linear rheology of viscoelastic emulsions with interfacial tension. Rheol Acta. 1990;29:204–14. doi:10.1007/BF01331356. [Google Scholar] [CrossRef]
7. Liao H, Tao G, Liu C, Gong F. A polypropylene/high density polyethylene blend compatibilized with an ethylene-propylene-diene monomer block copolymer: fitting dynamic rheological data by emulsion models with a physical scheme. J App Poly Sci. 2016;43709:1–8. [Google Scholar]
8. Lee HM, Park OO. Rheology and dynamics of immiscible polymer blends. J Rheol. 1994;38:1405–25. doi:10.1122/1.550551. [Google Scholar] [CrossRef]
9. Lacroix C, Aressy M, Carreau PJ. Linear viscoelastic behavior of molten polymer blends: a comparative study of the Palierne and Lee and Park models. Rheol Acta. 1997;36:416–28. doi:10.1007/BF00396328. [Google Scholar] [CrossRef]
10. Bousmina M. Rheology of polymer blends: linear model for viscoelastic emulsions. Rheol Acta. 1999;38:73–83. doi:10.1007/s003970050157. [Google Scholar] [CrossRef]
11. Galloway JA, Montminy MD, Macosko CW. Image analysis for interfacial area and cocontinuity detection in polymer blends. Polymer. 2002;43(17):4715–22. doi:10.1016/S0032-3861(02)00282-3. [Google Scholar] [CrossRef]
12. Yu W, Zhou W, Zhou CX. Linear viscoelasticity of polymer blends with co-continuous morphology. Polymer. 2010;51(9):2091–8. doi:10.1016/j.polymer.2010.03.005. [Google Scholar] [CrossRef]
13. Veenstra H, Verkooijen PCJ, van Lent BJJ, van Dam J, de Boer AP, Nijhof APHJ. On the mechanical properties of co-continuous polymer blends: experimental and modeling. Polymer. 2000;41(5):1817–26. doi:10.1016/S0032-3861(99)00337-7. [Google Scholar] [CrossRef]
14. Paul DR, Bucknall CB. Polymerblends: formulation and performance. New York: Wiley; 2000. [Google Scholar]
15. Wu DF, Zhang YS, Zhang M, Zhou W. Phase behavior and its viscoelastic response of polylactide/poly(e-caprolactone) blend. Eur Polym J. 2008;44(7):2171–83. doi:10.1016/j.eurpolymj.2008.04.023. [Google Scholar] [CrossRef]
16. Utracki LA. Polymer alloys and blends. Munich: Hanser; 1989. [Google Scholar]
17. Metelkin VI, Blekht VS. Formation of a continuous phase inheterogeneous polymer mixtures. Colloid J USSR. 1984;46:425–9. [Google Scholar]
18. Utracki IA. On the viscosity-concentration dependence of immiscible polymer blends. J Rheol. 1991;35:1615–37. doi:10.1122/1.550248. [Google Scholar] [CrossRef]
19. Castro M, Prochazka F, Carrot C. Cocontinuity in immiscible polymer blends: a gel approach. J Rheol. 2005;49:149–60. doi:10.1122/1.1835341. [Google Scholar] [CrossRef]
20. Castro M, Carrot C, Prochazka F. Experimental and theoretical description of low frequency viscoelastic behaviour in immiscible polymer blends. Polymer. 2004;45:4095–104. doi:10.1016/j.polymer.2004.04.019. [Google Scholar] [CrossRef]
21. Steinmann S, Gronski W, Friedrich C. Quantitative rheological evaluation of phase inversion in two-phase polymer blends with cocontinuous morphology. Rheol Acta. 2002;41:77–86. doi:10.1007/s003970200007. [Google Scholar] [CrossRef]
22. Doi M, Ohta T. Dynamics and rheology of complex interfaces. I. J Chem Phys. 1991;95:1242–8. doi:10.1063/1.461156. [Google Scholar] [CrossRef]
23. Gramespacher H, Meissner J. Interfacial tension between polymer melts measured by shear oscillations of their blends. J Rheol. 1992;36:1127–41. doi:10.1122/1.550304. [Google Scholar] [CrossRef]
24. Liao H, Liao R, Li S, Liu C, Tao G. Rheology of a polypropylene/low density polyethylene blending melt: fitting dynamic rheological data by Palierne model and Lee and Park model. Polym Bull. 2022;79:4957–70. doi:10.1007/s00289-021-03720-y. [Google Scholar] [CrossRef]
Cite This Article
 Copyright © 2024 The Author(s). Published by Tech Science Press.
This work is licensed under a Creative Commons Attribution 4.0 International License , which permits unrestricted use, distribution, and reproduction in any medium, provided the original work is properly cited.
 Downloads
 Citation Tools