 Open Access
ARTICLE
Tensile Failure Characterization of Glass/Epoxy Composites using Acoustic Emission RMS Data
a
Department of Automobile Engineering, PSN Engineering College, Tirunelveli, India
b
Department of Automobile Engineering, PSN Engineering College, Tirunelveli, India
* Corresponding Authors: email: ,
Journal of Polymer Materials 2023, 40(3-4), 215-226. https://doi.org/10.32381/JPM.2023.40.3-4.7
Abstract
The acoustic emission monitoring with artificial neural networks predicts the ultimate strength of glass/epoxy composite laminates using Acoustic Emission Data. The ultimate loads of all the specimens were used to characterise the emission of hits during failure modes. The six layered glass fiber laminates were prepared (in woven mat form) with epoxy as the binding medium by hand lay-up technique. At room temperature, with a pressure of 30 kg/cm2, the laminates were cured. The laminates of standard dimensions as per ASTM D3039 for the tensile test were cut from the lamina. The Acoustic Emission (AE) test was conducted on these specimens under the load of uni-axial tension in the 10 Ton capacity Universal Testing Machine (UTM). In the monitoring process, acoustic emission parameters such as hits, counts, energy, duration, Root Mean Square (RMS) Value and amplitude were recorded. The RMS Values corresponding to the amplitude ranges from tensile test were used to characterise the failure load of all the similar glass-epoxy composite specimens.Keywords
A very fast development of new structural materials has followed the way of substituting metals for composite in various industries, such as aviation, shipbuilding, chemical-petroleum, civil engineering, etc. Even at the low temperatures, composite materials have been increasingly used in many structures such as airplanes, in which the flight condition undergoes a temperature as low as -60°C or in a cryogenic tank which may be exposed to temperature below -150°C. The advantages of these materials were very high strength, stiffness, and damping together with a low specific weight. This composite material has higher structural reliability and enhancing safety compare to other materials. So, the cost of the construction, operation, and development of the composite materials was reduced. Because of these unique specifications, they are widely used in high technology applications, such as aeronautic and aerospace. A composite material is a material in which, two or more constituent materials are mixed together to create a material with properties unlike the individual elements. These constituent materials have notably dissimilar chemical or physical properties. The constituents are, fiber, and matrix. They are classified by the geometry of the reinforcement: particulate, flake, and fibers or by the type of matrix: polymer, metal, ceramic, and carbon. By the way of incorporate the reinforcement phase in the composite, the properties of the composite are improved. In these composite materials, fibers are the principal load-carrying constituents while the surrounding matrix act as a load transfer medium between them. It helps to keep them in the desired location and orientation.
Milad Saeedifaret et al.[1] presented a comprehensive review on the use of AE for damage characterisation in laminated composites. They compared the AE peak frequency of different damage mechanisms reported in the literature. This research has given more knowledge about the matrix cracking, fiber breaking and delamination of the damage mechanism. As per their review, most of the researches uses peak frequency and amplitude for their research works.
Michal Šofer et al.[2] performed tensile and compact tension tests on specimens with various stacking sequences to induce specific failure modes and mechanisms. The AE activity was monitored using two different wideband AE sensors and further analysed using a hybrid AE hit detection process. The datasets received from both sensors were separately subjected to clustering analysis using the spectral clustering technique, which incorporated an unsupervised k-means clustering algorithm. The failure mechanism analysis also included a proposed filtering process based on the power distribution across the considered frequency range, with which it was possible to distinguish between the fiber pull-out and fiber breakage mechanisms.
Samira Gholizadeh's[3] study assessed the progression of damage occurring on glass fiber reinforced polyester composite specimens using acoustic emission parameters. Its aims were to improve understanding of the particular characteristics of AE signals; and also to determine the relationship between AE signals and the failure of the material. Time and frequency domain trends were analysed at four different applied loads, representing 45–60 per cent of the ultimate tensile strength of material. The relevant AE parameters were analysed both in the early stages of the test and as the material neared the fracture zone. The results showed a high degree of correlation between the root mean square and number of hits and the number of cycles to failure, This correlation as well as AE basic parameters suggests that AE can be a valuable tool to predict the fatigue life and detect the onset of damage in such composite material.
Like this most of the researchers are used to characterise the properties of composite materials using AE data such as Amplitude, Hits, Count and Energy mostly. But, they didn't use the RMS values for the prediction or characterisation composite materials. So, the RMS value is selected with their unique feature of constant value irrespective of their place of emission for characterisation the tensile failure of glass/epoxy composites.
In this fabrication process, the hand layup method was used to fabricate the GFRP composite lamina of dimensions 250 × 400 mm. The six layers of bi-directional glass fiber mat along with LY556 epoxy were employed for the fabrication of the lamina. The fourteen tensile specimens of size 250×25×2.5 mm was cut from the lamina as per ASTM D 3039 standards.[4] GFRP composite tabs were provided as per the ASTM standard on both ends. Diamond cutting was employed to avoid the machining defects and to ensure good surface finish along the cutting edges. The tensile test specimens were shown in the following Fig. 1.
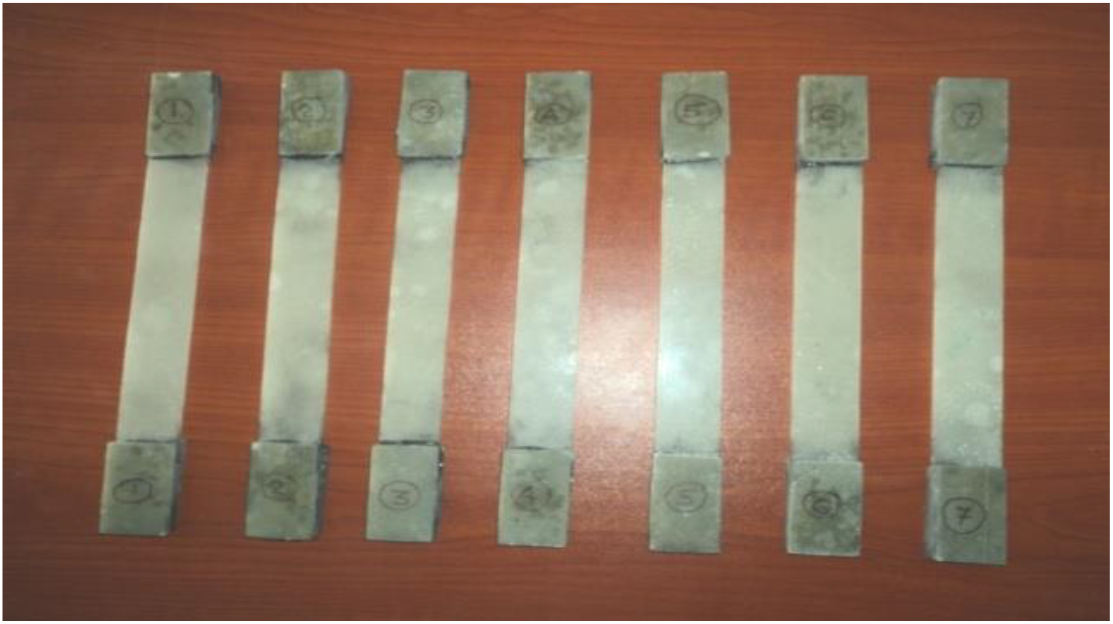
Fig. 1.: Sample Fabricated Specimens
The tensile specimens were subjected to uniaxial tension test using DAK universal testing machine. Fourteen specimens were tested. The crosshead speed was maintained at 1.5 mm/min throughout the testing process. The tensile properties of bidirectional glass/epoxy composite were determined through the testing process. The testing procedure of the ASTM D3039 Standard Test Method for Tensile Properties of Epoxy Matrix Composite Materials has adhered.
Fig. 2 shows the prepared tensile test specimens with strain gauges and wiring to obtain the strain values during the testing process. While loading, AE activities were monitored with Physical Acoustic Corporation (PAC) AE system.[5] A pair of Nano sensors and preamplifiers with 45 dB gain was used. AE transducers were mounted in position using adhesive tapes 37.5 mm apart from GFRP tabs. To acquire emissions from the complete volume, the sensors were mounted on alternate sides of the specimen as shown in Fig. 3. AE signals transmission between specimen and sensor were ensured through appropriate couplant (silicone vacuum grease).[6] A threshold setting of 45 dB was adopted for the test after estimating background noise.
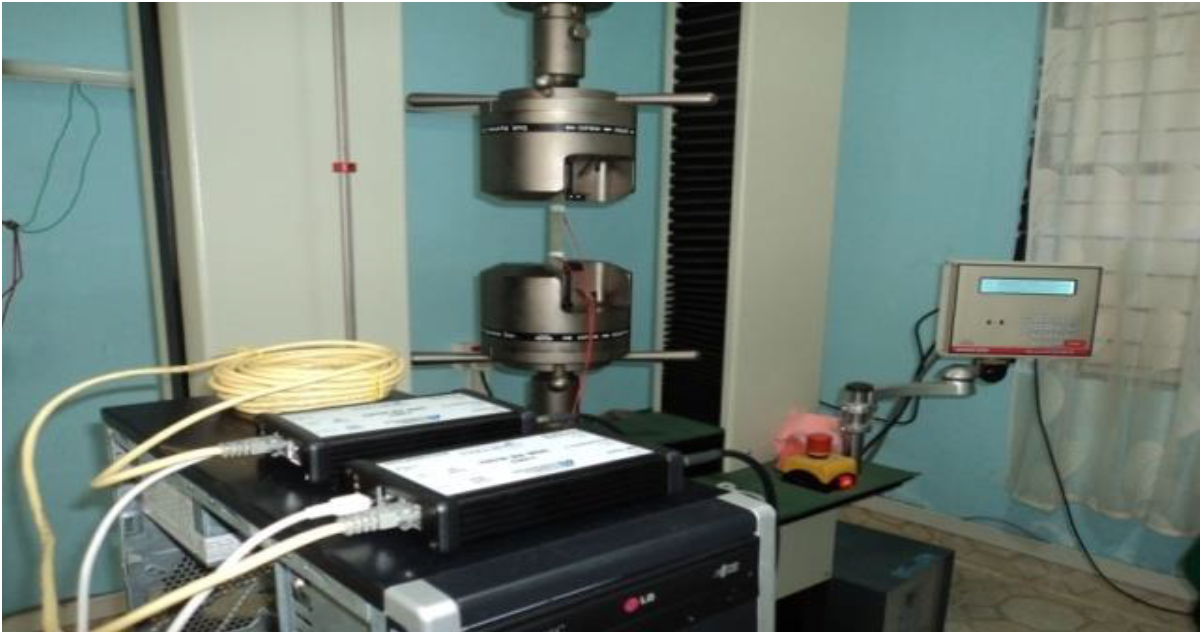
Fig. 2.: Specimen with AE Sensors set up
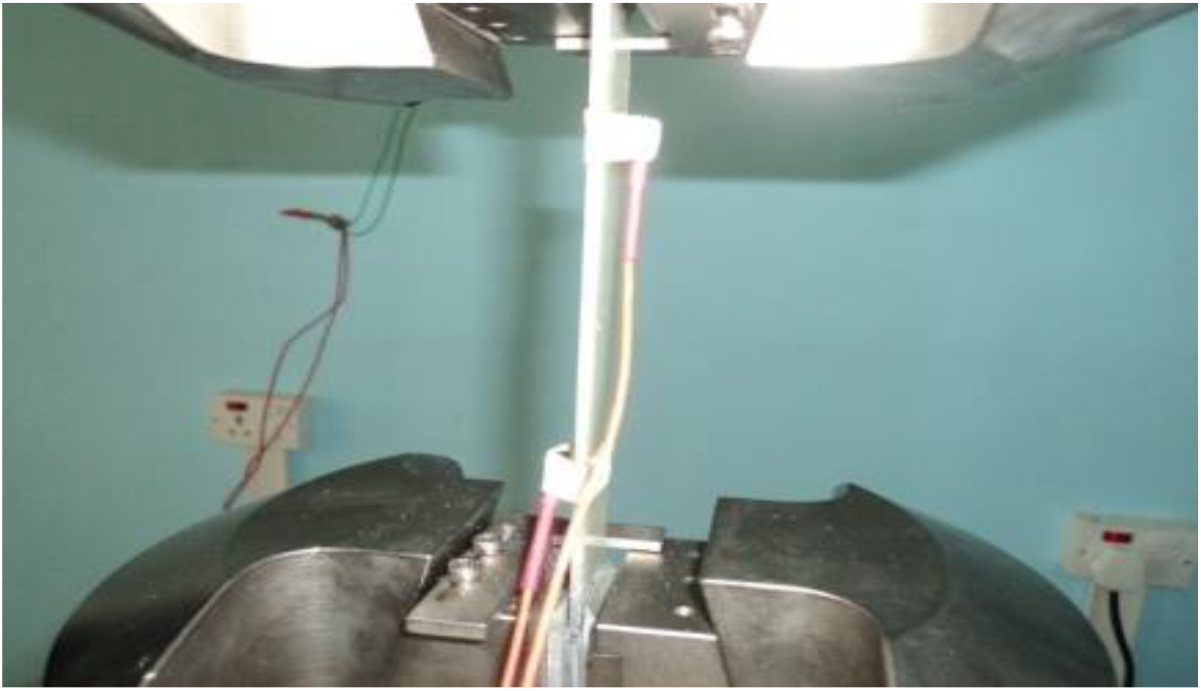
Fig. 3.: Location of Sensors on the Specimen
The failure characterisation will be changed according to AE parameters such as amplitude, count, RMS, energy, and duration. V. Arumugam et al have considered only amplitude-frequency for their prediction work.[7] The sensors were fixed at different places on the specimens. For every hit, the sensing amplitude by the sensors at different places were different because of the distance between the sensor and source. So, the definition of failure mode was not accurate for this prediction work.[8] It was due to attenuation, the predicted value using amplitude-frequency had some error. But the RMS value was the same at each sensor for every source. So, the predicted value was accurate. These values are an effective parameter, which is not attempted so far. It has been successfully handled in this research work, and the worst-case prediction error of 5.62 per cent was obtained. The relationship between failure load and RMS values was shown in the fig. 4.
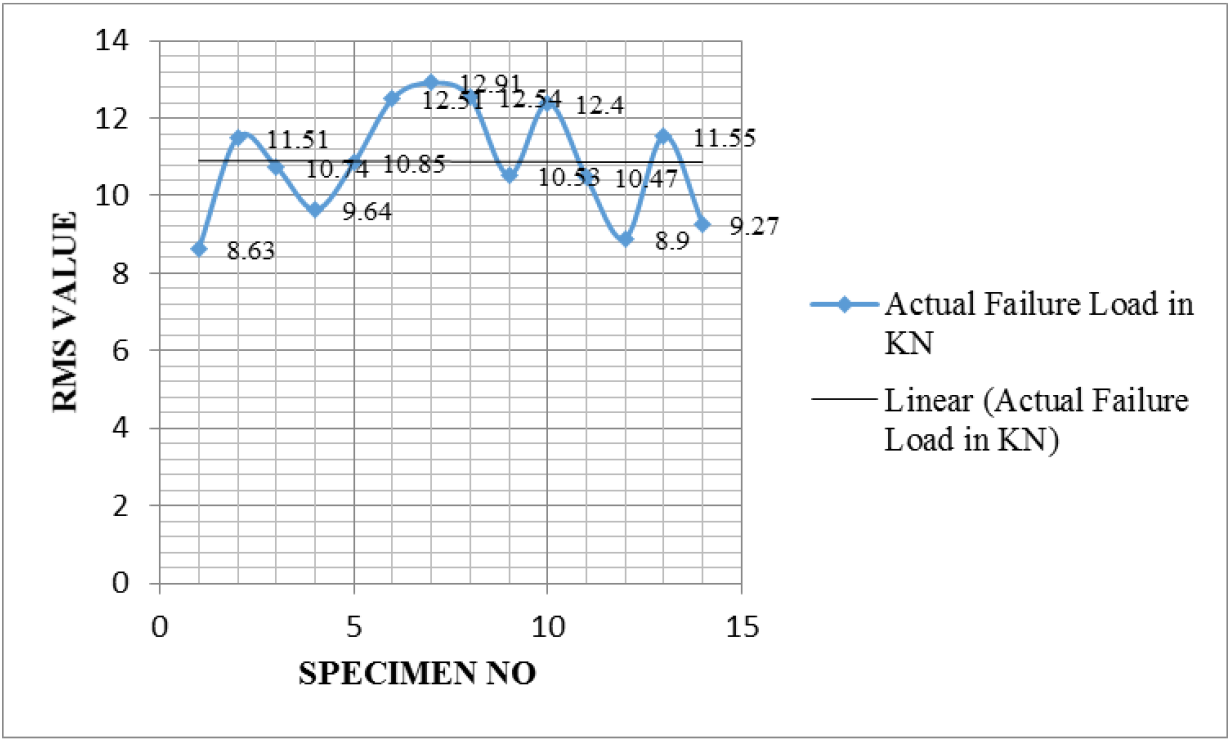
Fig. 4.: Graph between RMS Value and Actual Failure Load
Out of fourteen numbers of tensile specimens, ten specimens were selected for group 1. Their AE data collected up to 70 per cent of the failure load was used in the training phase to train the neural network. The remaining four specimens were selected for group 2. These specimens were used for testing the network.[9] AE data were collected and its corresponding failure load was utilised for prediction. RMS values in each dB interval (45dB to 100dB) were calculated. Those values were made as a numerical array (matrix), which was convenient as an input for the network. The failure load of each specimen was also arranged in the same way, and it was given as the targeted output for the network.[10] The total RMS values and corresponding failure load of each specimen for 45dB are summarised in Table 1. The neural network model was developed in MATLAB-10 workspace, and it was trained with ten specimen data.[11] Better training performance was obtained at 56-40-1 network architecture.

Here 56 neurons in the input layer (RMS value of each amplitude as one neuron) and only one neuron (failure load) in the output layer.[12&13] In between a single middle layer was adjusted and optimized with 40 neurons. The learning coefficient and momentum were 0.01 and 0.9 respectively. It is due to the number of input neurons that was more, Levanberg - Marguart algorithm was employed as a learning rule.[14] The hyperbolic tangent transfer function was used in the middle layer. The optimised neural network was tested with the remaining four specimens' data, the results were summarised in Table 2.

From Table 2, the failure load prediction error of specimen number 12 was found outside the acceptable error margin of 5 percent. Above the said table, the other three specimen's failure loads were within the range at which the network was trained.[15] It shows the incapability of the network to predict the failure load, which was outside the training range. Subsequently, the network was trained with some more training sets. It was noticed that changing the data set with a new training phase gave much reduction in its error margin. The Table 3 shows the result of the fine-tuning network. Thus, the network has proved its potential within the range of target failure loads given in the training phase.

The revised network consists of 56 neurons in the input layer and one targeted failure load in the output layer shown in Fig. 8. The best training performance was obtained at 56-40-1 network architecture. The error convergence threshold of 7×10⁻⁸ was attained at 4 epoch size, (Fig. 5). The above said learning rule, transfer function, the optimal learning coefficient, and momentum were used for this network.[16 &17] The prediction accuracy of the network could be understood by the comparison plot of actual and desire outputs (Fig. 5 & 6). The worst-case prediction error of 5.62 per cent was obtained for specimen number 14. All other values were very close to the actual outputs.
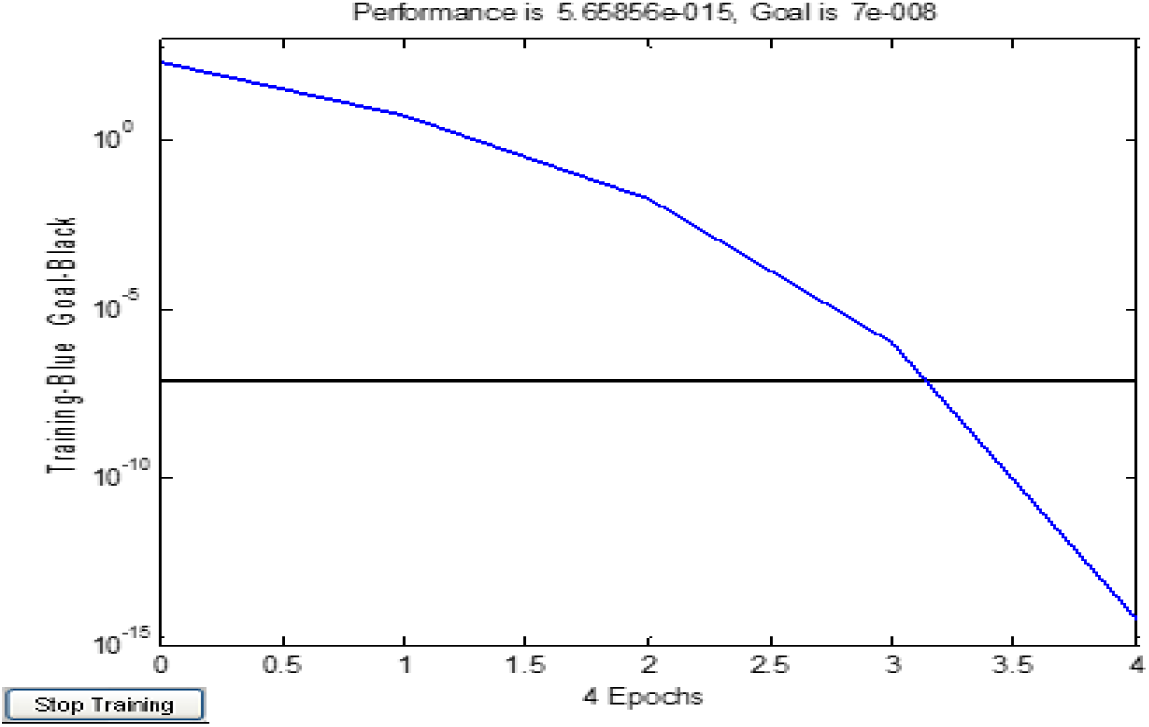
Fig. 5.: Convergent Result

Fig. 6.: Actual Failure Load Vs Predicted Failure Load Vs Specimen
Earlier researchers have considered only amplitude-frequency for their failure characteristics work.[18] Hit values are an effective parameter, it has been successfully handled in this research work for the failure mode definition. In this work, hits emitted are separately collected for the specified amplitude intervals i.e. 45-60, 61-80, and 81-100. The failure mode was characterised according to the following definitions as shown in Table 4. The number of hits emitted are high when strong de-lamination and matrix cracking are available.

If the amplitude 45-60 in (Decibels) dB and the duration in microseconds (μs) were less than 300, then the failure mode was Matrix Cracking in week condition. If the amplitude 45-60 in dB and the duration in microseconds were greater than 300, then the failure mode was Matrix Cracking in week condition.[19&20] If the amplitude 61-80 in dB and the duration in microseconds were less than 300, then fiber failure was very week and strong matrix creaking failure has appeared.
If the amplitude 61-80 in dB and the duration in microseconds were greater than 300, then fiber failure was very week and strong matrix creaking was be very strong, very week de-lamination has appeared. If the amplitude 81-100 in dB and the duration in microseconds were less than 300, then fiber failure was very strong, and strong matrix creaking has appeared. If the amplitude 81-100 in dB and the duration in microseconds were greater than 300, strong matrix creaking and very strong de-lamination has appeared. Some fiber failures may occur.[21]
From the Table, Duration less than 300 microseconds, there is no linear relationship between the hits emitted during the above-said condition and the corresponding failure loads. Also, duration more than 300 microseconds, the hits emitted during amplitude 40-60, 61-80 were not linear with the failure loads. Also the total hits for each specimen were not linear with the failure loads of each specimen as shown in the table 5 and the fig. 10. But duration more than 300 microseconds, the total hits for every specimen emitted during amplitude 81-00 were linear with the failure loads of each specimen[22-23]. It shows in table 6, and also observed from the fig. 7 & 8.


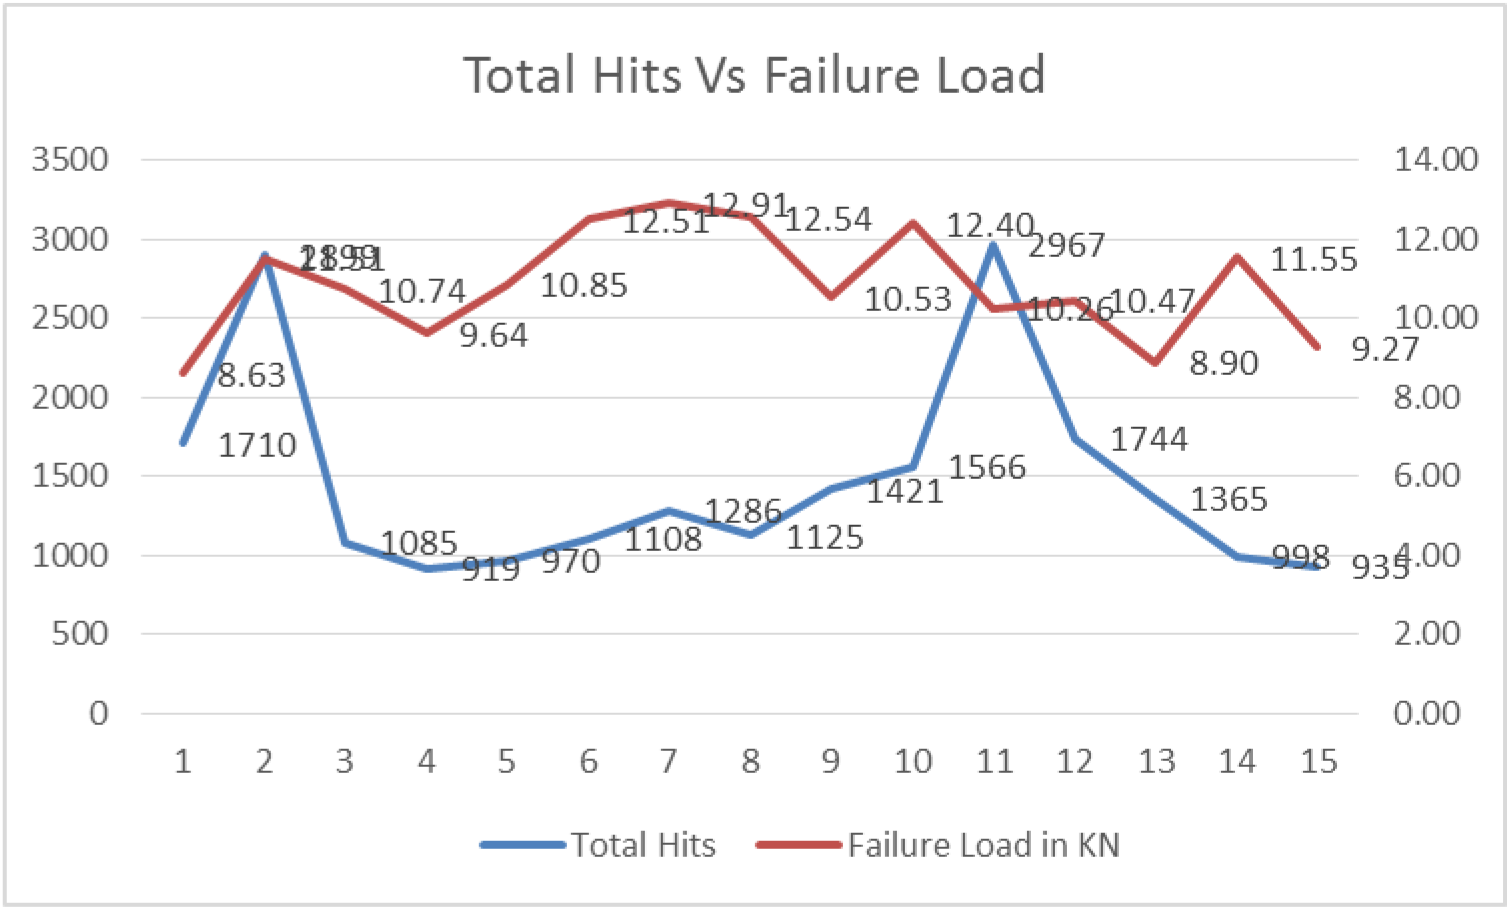
Fig. 7.: Total Hits Vs Failure Load

Fig. 8.: Hits Vs Failure Load on Amplitude 80 – 100 and Duration > 300 μs
Acoustic Emission parameters like amplitude, hits, counts, and RMS values are most significant to predict the ultimate failure load. The back propagation neural network has proved its capability for predicting the failure load of the composite specimen with the AE data collected up to 70 per cent of its ultimate load. The ultimate failure load prediction within a 5.62 per cent error margin was attained by giving RMS value as input vectors for the three-layer network.
It may be possible to proof test the composites more sophisticated at lower loads (may be 50 per cent to 60 per cent of ultimate load). So, the composite material's structural integrity degradation could be minimised while proof testing. It is due to the highest number of hits emitted during a period of amplitude 81-100 and duration 300 μs, and also the hits emission was linear with the failure loads of the specimen, is assured here, the specimen's structural integrity is started to failure here only.
References
1. Milad Saeedifar, Dimitrios Zarouchas. (2020). Com. Part B: Eng., Volume 195. [Google Scholar]
2. Michal Šofer, Pavel Šofer, Marek Pagáè, Anastasia Volodarskaja, Marek Babiuch, Filip Gruò. (2022). Polym. 2023, 15(147. [Google Scholar]
3. Samira Gholizadeh. (2016). Aust. J. Mech. Eng. 16(1):12642 84. [Google Scholar]
4. Nat Ativitavas, Timothy J. Fowler, and Thanyawat Pothisiri. (2004). J. Nondes. Eva., 23: 1. [Google Scholar]
5. James L. Walker, Ginger H. Rowell, and Eric V.K. Hill. (1996). Mater. Eva., 54, No. 6, 744-748. [Google Scholar]
6. James L. Walker, Eric V. K. Hill. (1996). Adv. Perfor. Mater., 3: 75-83. [Google Scholar]
7. V. Arumugam, R. Naren Shankar, B.T.N. Sridhar and A. Joseph Stanley. (2010). J. Mater. Sci. Tech., 26(8725-729. [Google Scholar]
8. S. Rajendraboopathy, T. Sasikumar, K. M. Usha, E. S. Vasudev. (2009). Int. J.Adv. Manu. Tech., 44: 399-404. [Google Scholar]
9. R. Santosh, B. Kiran. (2012). Int. J.Ins., Cont. Auto, ISSN: 2231-1890, 1: 3-4. [Google Scholar]
10. T. Sasikumar, S. Rajendraboopathy, K.M. Usha, E.S. Vasudev. (2008). J. Nondes. Eva., 27: 127–133. [Google Scholar]
11. Sivanandam SN, Sumathi S, Deepa SN. (2005). Tata McGraw-Hill, New Delhi, ISBN-13:978-0-07-059112-7. [Google Scholar]
12. Yuxuan Wang, Xuebang Wu, Xiangyan Li, ZhuomingXie, Rui Liu, Wei Liu,Yange Zhang, YichunXu, Changsong Liu. (2020). Met., 10: 234, doi:https://doi.org/10.3390/met10020234. [Google Scholar] [CrossRef]
13. International ASTM Standard: D3039/D3039M-08. [Google Scholar]
14. Suresh Kumar. C, Arumugamam, V, Sengottuvelusamy. R, Srinivasan. S, Dhakalc. H.N. (2017). Appl. Acou., 115: 32-41. [Google Scholar]
15. M. Gayatri Vineela, Abhishek, Dave Phaneendra, Kiran Chaganti. (2018). Mater. To., 5, 9: 19908-19915. [Google Scholar]
16. Dante L. Silva, Kevin Lawrence M. de Jesus, Edgar M. Adina Daelson V, Mangrobang, Mareshah D, Escalante Nicole Anne M. Susi. (2021). IEEE Expl., DOI: https://doi.org/10.1109/ICCAE51876.2021.9426170. [Google Scholar] [CrossRef]
17. J.M.L. Reis, J.L.V. Coelho, A.H. Monteiro, H.S. da Costa Mattos. (2012). Comp. Part B: Eng., 43, 4: 2041-2046. [Google Scholar]
18. Ramkumar S. (2015). Adv. Comp. Lett., 24: 5. [Google Scholar]
19. W.C.Cui, M.R.Wisnom, M.Jones. (1992). Comp., 23, 3: 158-166. [Google Scholar]
20. S. Rajendra Boopathy, T. Sasikumar, E.S., Vasudev. (2008). Int. J. Mater. Stru. Inte., 2&3: 228-240. [Google Scholar]
21. T. Sasikumar, S. Rajendraboopathy, K. M. Usha, E. S. Vasudev. (2008). J. Nondes. Eva., 27: 127-133. [Google Scholar]
22. U. K. Vaidya, P. K. Raju. (1996). J. Vib. Acou., 118(3446-453. [Google Scholar]
23. XinyeLiu, XinyueYao, JinhuiCai, Jiusun Zeng, Wingkong Chiu. (2021). Adv. Mater. Sci. Eng., 4: 1-12. [Google Scholar]
Cite This Article
 Copyright © 2023 The Author(s). Published by Tech Science Press.
This work is licensed under a Creative Commons Attribution 4.0 International License , which permits unrestricted use, distribution, and reproduction in any medium, provided the original work is properly cited.


 Submit a Paper
 Propose a Special lssue
 View Full Text
 Download PDF
 Downloads
 Citation Tools