 Open Access
ARTICLE
Enhanced Mechanical and Electrical Properties of Styrene Butadiene Rubber Nanocomposites with Graphene Platelet Nano-powder
Department of Rubber and Plastics Technology, Anna University, Madras Institute of Technology Campus, Chennai, Tamil Nadu, India.
* Corresponding Author: e-mail:
Journal of Polymer Materials 2023, 40(3-4), 141-156. https://doi.org/10.32381/JPM.2023.40.3-4.2
Abstract
Nanocomposites are very important materials because it imparts superior properties than other composites with low level of filler loading. Styrene butadiene rubber (SBR) is a non-polar rubber which acts as an insulator and has low electrical conductivity. Graphene platelet nano-powder from 0.1 to 1.25 phr level is incorporated into SBR rubber in order to improve the electrical properties. Comparative studies on electrical and mechanical properties of styrene butadiene rubber with graphene platelet nano-powder (GPN) by varying the filler content are made. The incorporation of Graphene platelet nano-powder increases the electrical conductivity in styrene butadiene rubber. It has been observed that there is a gradual increase in electrical conductivity by increasing the amount of nanofiller at higher frequency of about 100 kHz. The mechanical properties of styrene butadiene rubber are improved by the incorporation of Graphene platelet nano-powder. The effect of applied pressure and temperature on the volume resistivity and electrical conductivity of the composites is also investigated at a constant frequency of 100 kHz. The electrical properties of the SBR/GPN nanocomposites increases with increase in pressure and temperature up to a certain limit and then becomes constant.Keywords
Conductive rubber composites are broadly utilized for various applications, for example, touch control switches and electromagnetic interference (EMI) shielding, electrostatic charge dissipation, and surface heaters[1,2]. These materials need the desired electrical properties as well as sound mechanical properties. Various rubbers are being widely used for preparation of such composites, e.g., silicone, nitrile, butyl, etc.[3–5]. Elastomers are characterized by low electrical and thermal conductivities, which are extensively used as components in electrical and electronic circuits, film capacitors, and electrical insulation cables. Recently polymeric insulation materials have been used in nuclear power plants[6]. The polymer materials have to be strong electrical insulators at a wide range of frequencies and temperatures for this application. For a strong electrical insulation, polymers should possess the maximum dielectric strength and resistivity while possessing the lowest dielectric constant and dielectric loss.
In recent days, elastomers also be made anti-static and even conducting by the addition of suitable conducting fillers such as conducting carbon black (CCB), graphite, graphene[7], layered silicate, metallic salt, carbon nanotube (CNT)[8–10]. SBR rubber is a synthetic rubber comprising of styrene and butadiene monomers. Key benefits of SBR include: Abrasion resistance, perfect impact strength, good resilience and high tensile strength. SBR is one of the most widely used rubbers such as in the production of tires, footwear, conveyor, belts, hoses, flooring and adhesives[11-13].
Graphene has the potential to revolutionize entire industries - in the fields of electricity, conductivity, energy generation, batteries, sensors and more. Graphene is the world's strongest material, and can be used to enhance the strength of other materials. Dozens of researchers have demonstrated that adding even a trace amount of graphene to rubber can make these materials much stronger - or lighter (as you can use a smaller amount of material to achieve the same strength). The single layers of carbon atoms tightly packed into a two-dimensional (2D) honeycomb crystal lattice is called graphene[14]. The carbon atoms in the graphene layer form three σ bonds with neighbouring carbon atoms by overlapping of sp2 orbitals while the remaining pz orbitals overlap to form a band of filled π orbitals – the valence band – and a band of empty π* orbitals – the conduction band – which are responsible for the high in-plane conductivity[15, 16]. Graphene has proven to be a multifunctional nanomaterial and is entering a crucial segment in its product life-cycle from innovation to applications. Opportunities for the future will depend on the effective use of graphene defects to design graphene polymer nanocomposites.
In recent years, studies have shown that the nanocomposites exhibited excellent electrical, mechanical, and thermal properties[17-19]. Graphene may be an ideal nanofiller to impart prominent mechanical and multifunctional properties to rubbers, provided that fine dispersion and strong interfacial interaction can be achieved. Graphene-enhanced composite materials can find uses in aerospace, building materials, mobile devices, and many other applications such as electrically and thermally conductive elastomers, recyclable, self-healing, absorption-dominated and highly effective electromagnetic shielding elastomers[20], flexible strain sensors[21], Sensor-Enabled Geo-synthetics Sensors[22], Transparent elastic films serve as skin-like pressure and strain sensors[23].
The influence of Graphene platelet nano-powder as a reinforcement on the vulcanization, mechanical, and electrical properties of Styrene butadiene rubber nanocomposites were investigated and compared in this study. The present work also reports the findings of experimental investigation on the changes in the electrical conductivity and volume resistivity of SBR/GPN nanocomposites as a function of frequency, pressure and temperature.
Styrene butadiene rubber (Stylamer SBR 1502, styrene content 23.5 wt. %) procured from Reliance Industries Ltd, India was selected as the base polymer in this study. Graphene platelet nano-powder with carbon content min. 99.5%, Aero-dynamic particle size (APS) 15 microns. Thickness 2-10 nm, Surface area 20-40 m2/g and Bulk density ∼0.10 gm/ml was purchased from M/s Sisco Research Laboratories Pvt. Ltd., India was used as the reinforcing filler. The activators used for rubber vulcanization were zinc oxide and stearic acid, which were supplied by M/s Scientific Chemicals, Chennai. Sulphur supplied by M/s Spectrum Reagents and Chemicals Pvt. Ltd., Cochin, India was the crosslinking agent used along with the cure accelerators, 2,2'-dithiobis(benzothiazole) (MBTS) and diphenylguanidine (DPG) both were procured from Rubber Chemicals suppliers in Chennai, India and used as received.
2.2 Preparation of SBR/GPN Nanocomposites
The formulations of the SBR/GPN nanocomposites are given in the Table 1. Many research groups has reported to incorporate graphene into polymers using melt blending method in a Two roll mixing mill and showed proper and uniform dispersion of graphene into the rubbers[1,7, 24-26]. In this investigation, SBR/GPN nanocomposites filled with up to 1.25 parts per hundred rubber (Phr) GPN were compounded in an open two roll mixing mill. SBR is well masticated by using SHANTHOSE (Model No. SMX-LAB-613) two roll mixing mill at room temperature with the driven power of rear roller 24 rpm and front roller 17 rpm. Accurately weighed all the compounding ingredients except accelerator were added in the mixer in the following order: SBR, graphene filler, zinc oxide, steric acid and sulfur. The total mixing time was 30 min for all compositions to attain proper dispersion and distribution of ingredients into the rubber. The accelerators were added in a two roll mixing mill at a friction ratio of 1.4:1 where the compound is sheeted out and kept for maturation followed by curing of samples for different analysis as per cure time obtained from moving die rheometer (MDR). For the determination of mechanical properties, slabs having dimension of 150mm x 150mm x 2mm were cured in a hydraulic press (POWER HYDRAULICS) at 150°C under 1500 kg/cm2 pressure.

2.3 Characterization and Testing of SBR/GPN Nanocomposites
2.3.1 Rheological and Mechanical testing
At 150°C with a moving die rheometer (Prescott-Rheoline), the vulcanizing characteristics including scorch time (Ts2), time for 90% cure (T90) and cure rate index (CRI) were evaluated according to ASTM D 6204. The mechanical properties like tensile strength and elongation at break of the cured samples were measured using dumbbell test specimens in an SHANTA ENGINEERING Universal Testing Machine (UTM), Model No.SET-T-10kN, according to ASTM D 412 at a cross head speed of 500 mm/min. For each test minimum five specimens were used and the average value was recorded. Tear strength were measured according to the ASTM D 624.
Abrasion test was done on the DIN abrasion tester for determining the abrasion resistance of compounds of vulcanized rubber, recommended by the Indian Standards Institution vide IS:3400 (Part 3)-1987. The volume loss of a rubber test piece is determined by sliding the test piece under specified conditions over the surface of an abrasive sheet mounted to a rotating drum of specified dimensions. The diameter of the cylindrical drum shall approx.150mm and length 500mm, operating at a rotational frequency of 0.11 rad/s (40 rpm). The sample is fitted in the die holder and it moves along the length of the drum. On moving from left to right, the drum takes 84 revolutions.
2.3.2 Swelling and Crosslink Density
The cross-link density was determined by immersing a small amount (known mass) of sample in 100 mL of toluene for 3 days to attain equilibrium swelling. After this, the sample is taken out from toluene and the solvent is blotted from the surface of the sample and is weighed immediately. The sample is then dried at 70°C to constant weight. Then the chemical cross-link density is calculated by using the Flory–Rehnner[27–29] equation as per ASTM D 6814-02.
Equilibrium swelling ratio (Qr) is calculated from the equation Qr = (w2-w1) /w1. where w1 is the mass of cured rubber before swelling, w2 is the mass of the swollen rubber sample[30]. Relative Swelling (Qr/Qo) is also measured to compare the swelling index. where Qo is the swelling ratio of SBR GUM vulcanizate.
Electrical properties such as volume resistivity (ρv), electrical conductivity (σAC) and dielectric constant (ɛ′) were measured using an LCR meter (Hioki Hitester-IM3533 and PROBE 9140-10) in the frequency range between 50 Hz – 200 kHz at ambient temperature accordance with ASTM D 150 - 1995. A cylindrical sample with a 20 mm diameter and 2 mm thickness was placed between two circular electrodes of a typical resistivity cell which is connected to a LCR meter. The resistance in parallel, parallel capacitance, and Impedance values were directly measured from LCR meter. Using the following equation, the volume resistivity was calculated.
where RP is the parallel resistance in Ohm (Ω), t is thickness of sample in meter(m) and A is the area of electrode in square meter (m2).
Electrical conductivity (Ωm)-1 was calculated by inversing the volume resistivity. The relative permittivity or dielectric constant (ɛ′ = ɛ / ɛ0) of the composites were calculated through the parallel capacitance by the equation,
where Cp is the parallel capacitance in Farad (F), and ɛ0 = 8.854 × 10⁻¹² F/m is permittivity of free space.
To study the effect of applied pressure on the volume resistivity and electrical conductivity of samples, definite loads were applied on the samples placed in the resistivity cell as mentioned earlier and the range of pressure applied was varied from 3.58 to 12.22 kPa. To check the effect of temperature on the volume resistivity and electrical conductivity, sample holder fitted in a controlled hot air oven was used. The temperature sweep range was from room temperature to 110°C.
3.1 Rheological Properties of SBR/GPN Nanocomposites
Torque measurements are frequently used to extract insights concerning flow as well as curing behaviour. Vulcanization is a major technological method that transforms raw rubbers into usable rubber products upon appropriate compounding. All of this enhances the elasticity of the rubber while diminishing its plasticity, resulting in a three-dimensional molecular crosslinked core network whose stability is strongly influenced by temperature as well as time[31]. Rubber rheogram and rheological properties of SBR/GPN nanocomposites are shown in the fig. 1 and Table 2 respectively.

Fig. 1.: Rubber Rheogram of SBR/GPN nanocomposites

From the rubber rheogram, the vulcanizing characteristics of rubber compounds such as optimum Cure time, scorch time and cure rate index could be obtained. Torque Difference (DT) signifies the amount of cross linking as well as an indicator of dynamic shear modulus, which would be related to the cross linking density of nanocomposites indirectly[24, 32]. The torque difference increases with the inclusion of filler, suggesting an increase in crosslink density through the use of increased GPN content. The ML and MH values are measures of the material's viscosity at low and high shear rates, respectively. A high ML value indicates that the material has a higher viscosity and is more resistant to flow, while a high MH value indicates that the material has a higher resistance to deformation at high shear rates. The TS2 value is a measure of the material's stress at a specified deformation, typically 2% strain. A higher TS2 value indicates that the material is stiffer and has a higher resistance to deformation.
In terms of moulding parameters, the rheological properties of rubber can affect several aspects of the moulding process, including the flow behaviour, filling time, and curing characteristics. For example, a material with a higher ML value may require a higher injection pressure to fill the mould properly, while a material with a higher TS2 value may require longer curing times to achieve the desired properties. From our rubber rheogram results we can infer that with the addition of Graphene Platelet Nano-powder, the moulding parameters of the gum compound were improved significantly.
The changes in the rheometric torque with filler loading is a measure of the rubber-filler interaction or reinforcement represented by the reinforcing factor (αf) and can be calculated from the rheographs using Equation.
The ΔTcomp is the change in torque of the nanocomposites, while ΔTgum is the change in torque of the pure elastomer[19]. The αf has shown an increasing trend on increasing the content of GPN. However, the experimental data have shown significant fluctuations and the value of was found to be higher in SBR/GPN nanocomposites than in neat rubber. This was attributed to the increased interactions between GPN and rubber matrix. We have found that the improvement in mechanical properties by GPN fillers plays a significant role in increasing the value of composites in comparison to neat rubber.
3.2 Mechanical Properties of SBR/GPN Nanocomposites
Several studies have shown that the reinforcement of graphene and/or graphene derivatives as a nanofiller into polymer greatly improves the mechanical properties of neat elastomeric matrix. Table 3 and fig. 2 shows the mechanical properties including tensile strength, elongation at break, tear strength and abrasion loss. When nanocomposites were produced with the addition of Graphene Platelet Nano-powder, the mechanical characteristics of the gum compound were improved significantly. The compounds with the GPN filler content of 1 and 1.25 Phr obtained a rise in tensile strength up to 10 and 16 % respectively than the neat rubber. The compounds with the GPN filler content of 0.25 and 0.5 Phr obtained a rise in tear strength up to 11 and 13 % respectively than the neat rubber. The intercalation of rubber chains into layered Graphene Platelets, which provides improved interaction between the rubber matrix and GPN, was responsible for all significant improvement in the tensile properties of rubber compounds reinforced with Graphene Platelet Nano-powder[33]. It can be concluded that the tensile properties are linearly proportional to the crosslink density of the rubber material, achieved through improved interaction of the rubber matrix and GPN filler.


Fig. 2.: (a) Tensile strength (b) Elongation at break (c) Tear strength and (d) Abrasion volume loss of SBR/GPN nanocomposites
The Stress – Strain behaviour of SBR/GPN nanocomposites is shown in fig. 3. The increase in strain by the induced stress of SBR/GPN rubber nanocomposites is in-between that of lower and higher loading of GPN filler. This was attributed to the increased interactions and crosslink density between GPN and rubber matrix at 0.75 Phr to 1.25 Phr of filler loading.

Fig. 3.: Stress – Strain behaviour of SBR/GPN nanocomposites
3.3 Swelling Properties of SBR/GPN Nanocomposites
fig. 4 shows the values of equilibrium swelling ratio, relative swelling and crosslink density of the cured rubber compounds. The reduction in the equilibrium swelling ratio is a measure of the degree of total network by either rubber molecules or adhesion between the rubber chains and the filler particles.
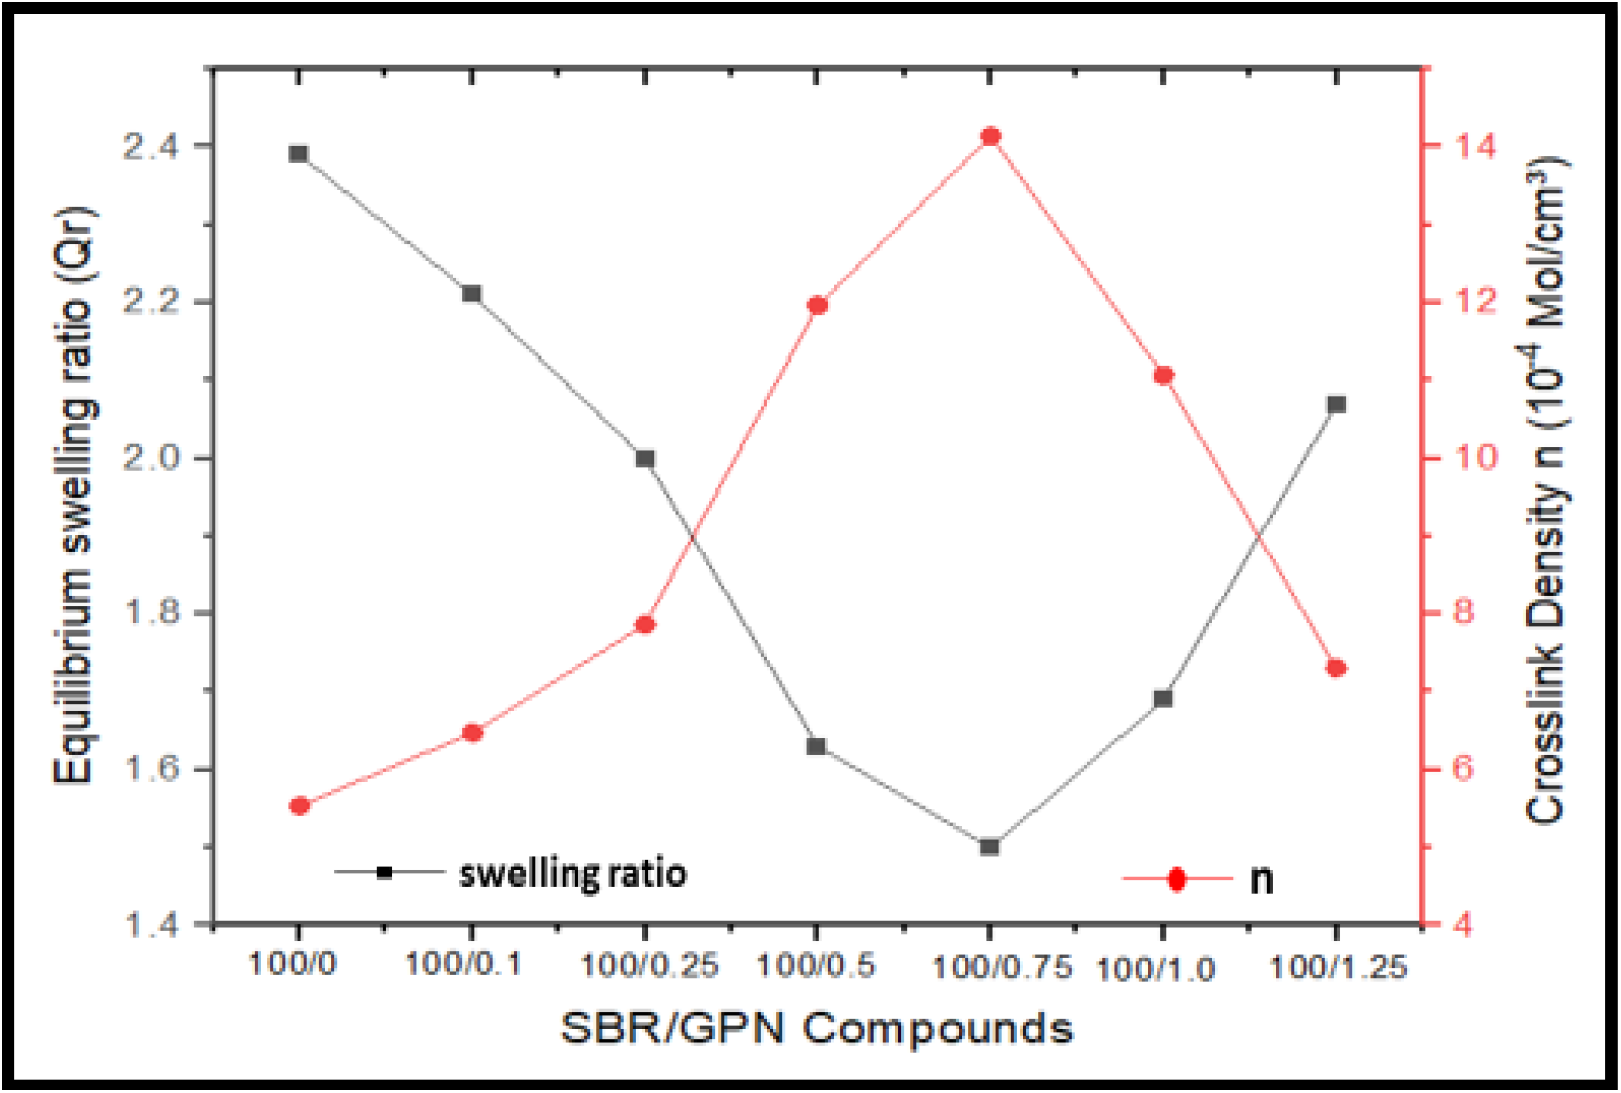
Fig. 4.: Equilibrium swelling ratio and crosslink density of SBR/GPN nanocomposites
A significant reduction in equilibrium swelling ratio is seen in the SBR/GPN rubber nanocomposites, relative to the neat SBR compound. When the elastomer chains interact more strongly with the filler, a single macromolecular chain can cover sizable numbers of active sites on the filler surface, and therefore, only a smaller number of chains may be anchored at the surfaces. The crosslink densities increased significantly with increase in the filler content[34]. This can be attributed to effective filler-to-rubber links upon curing leading to the reduction in the relative swelling ratio of SBR/GPN rubber nanocomposites. It is obvious that the increased network is responsible for the enhanced mechanical performance.
3.4 Electrical Properties of SBR/GPN Nanocomposites
3.4.1 Effect of frequency on Electrical properties
Polymer nanocomposites filled with conductive nanofillers are known to exhibit a typical electrical percolation behaviour. This behaviour is characterized by sudden and remarkable decrease in the nanocomposite's electrical resistivity at a critical filler concentration known as the electrical percolation threshold[35]. The conductance in conductive polymer composites is because of the formation of a continuous network structure by the conductive filler dispersed in the polymer matrix, and this happens only after addition of a certain critical amount of the filler. The loading of the conductive filler after which there is no significant change in resistivity irrespective of further addition of the filler is called the percolation limit of the composite system[36]. For the SBR-CCB system, the limit is observed at 30 Phr of conductive carbon black[37]. In general, the conduction of current in a conductive polymer composite follows three common mechanisms (1) flow of electrons through the conductive network, (2) electron hopping (jumping of electrons from one conducting particle to the next when the inter-particle gap is sufficiently less), and (3) electric field radiation[38].
Volume resistivity were calculated through the parallel resistance readings taken from the LCR meter by placing electrodes on opposite faces of a test sample. Effect of frequency on volume resistivity of SBR/GPN rubber nanocomposites is shown in fig. 5. At lower frequency, there is a decrease in volume resistivity by increasing the filler content. But at higher frequency the nanocomposites exhibited a significant decrease in electrical resistivity at GPN concentration in the range of 0.75–1.0 Phr as the percolation limit. At lower concentration the nanocomposite is insulator with higher electrical resistivity throughout the frequency similar to that of the unfilled polymer. Above the percolation threshold and higher frequency, a reduction in electrical resistivity was associated with the increase in GPN content due to the increase in conductive pathways, electron hopping and electric field radiation.
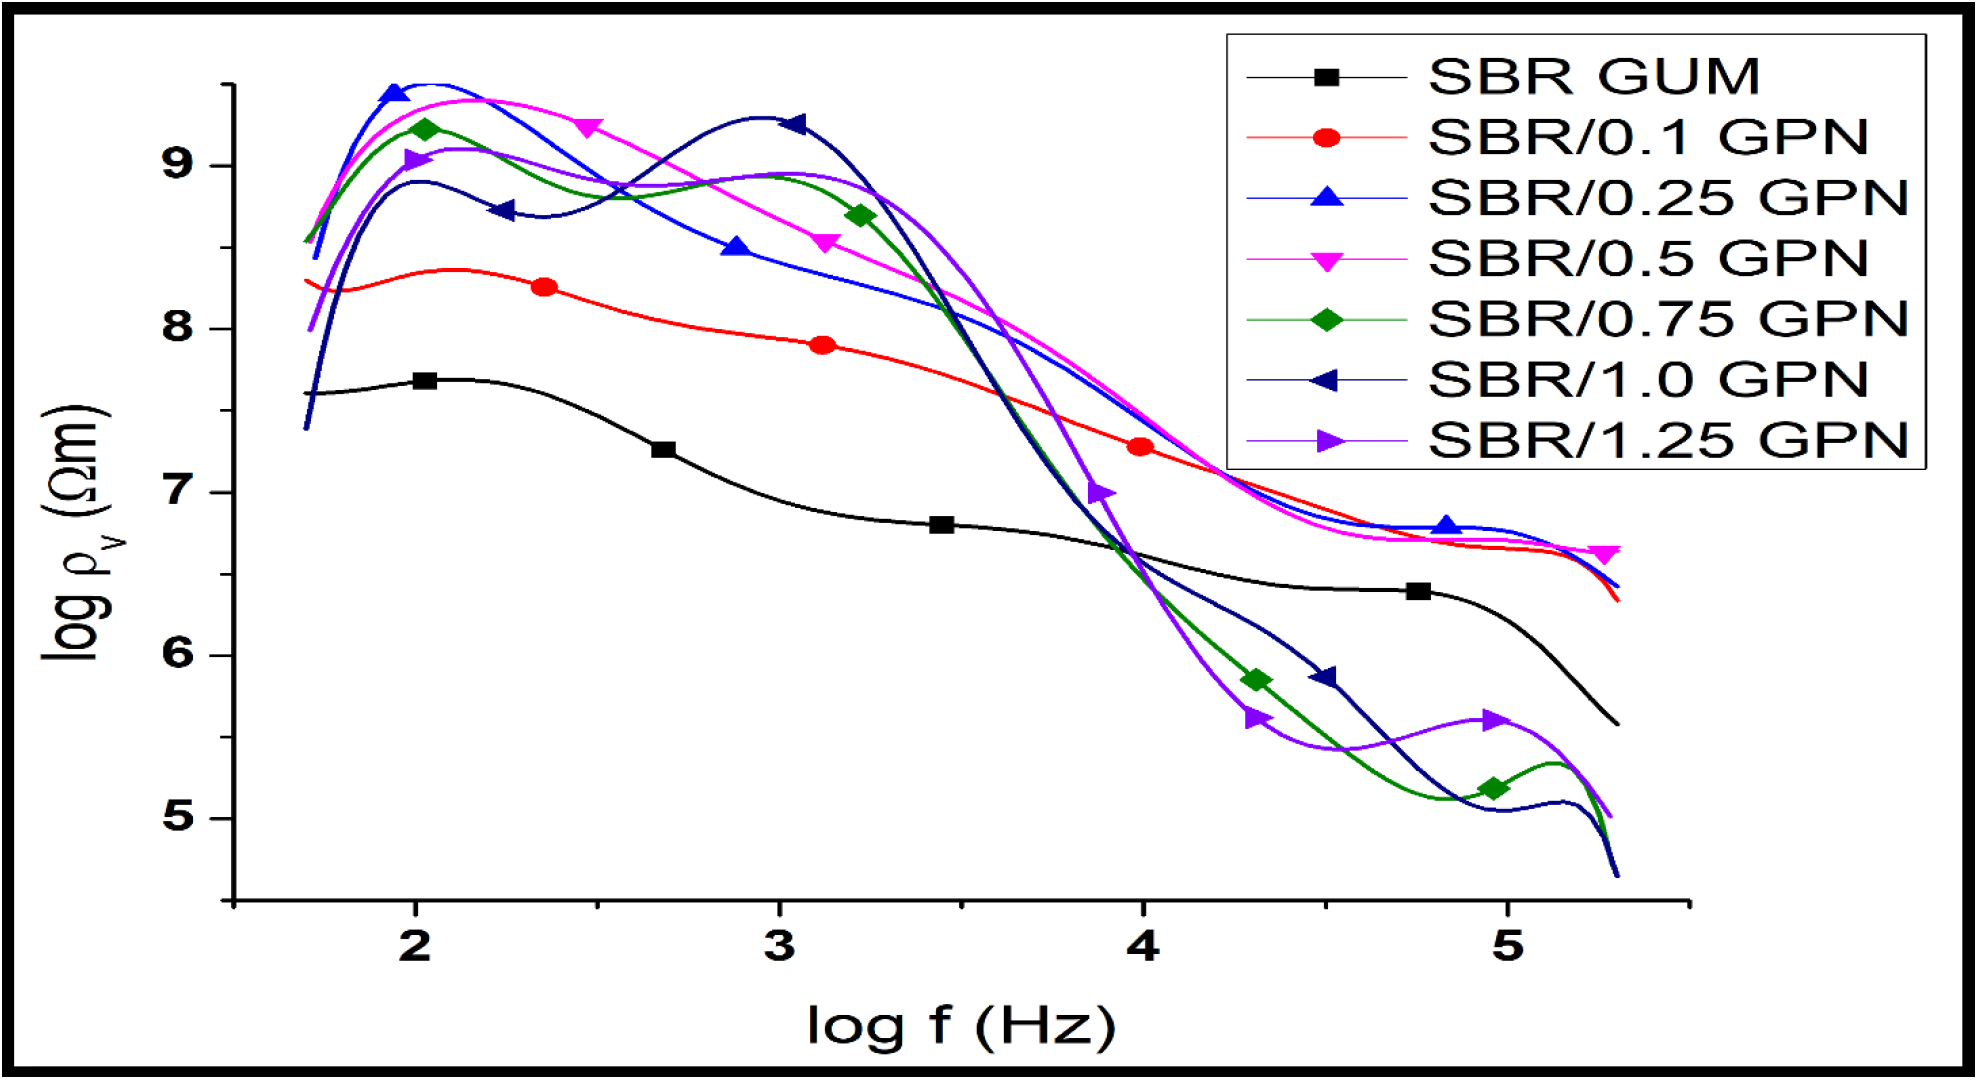
Fig. 5.: Effect of frequency on volume resistivity of SBR/GPN nanocomposites
The electrical conductivity was calculated by inversing the volume resistivity. The variation of electrical conductivity of different composites with frequency of applied electric field is shown in fig. 6. The figure illustrates that the composites near the percolation limit (containing 0.75, 1.0 and 1.25 Phr of GPN filler) show a frequency dependent region of electrical conductivity. By increasing GPN loading, the electrical conductivity of SBR/GPN rubber nanocomposites rises dramatically at higher frequency. When compared to unfilled SBR, the electrical conductivity at 100 kHz is improved by 105% and 118% of magnitude of the SBR/ 0.75 GPN and SBR/ 1 GPN nanocomposites respectively.
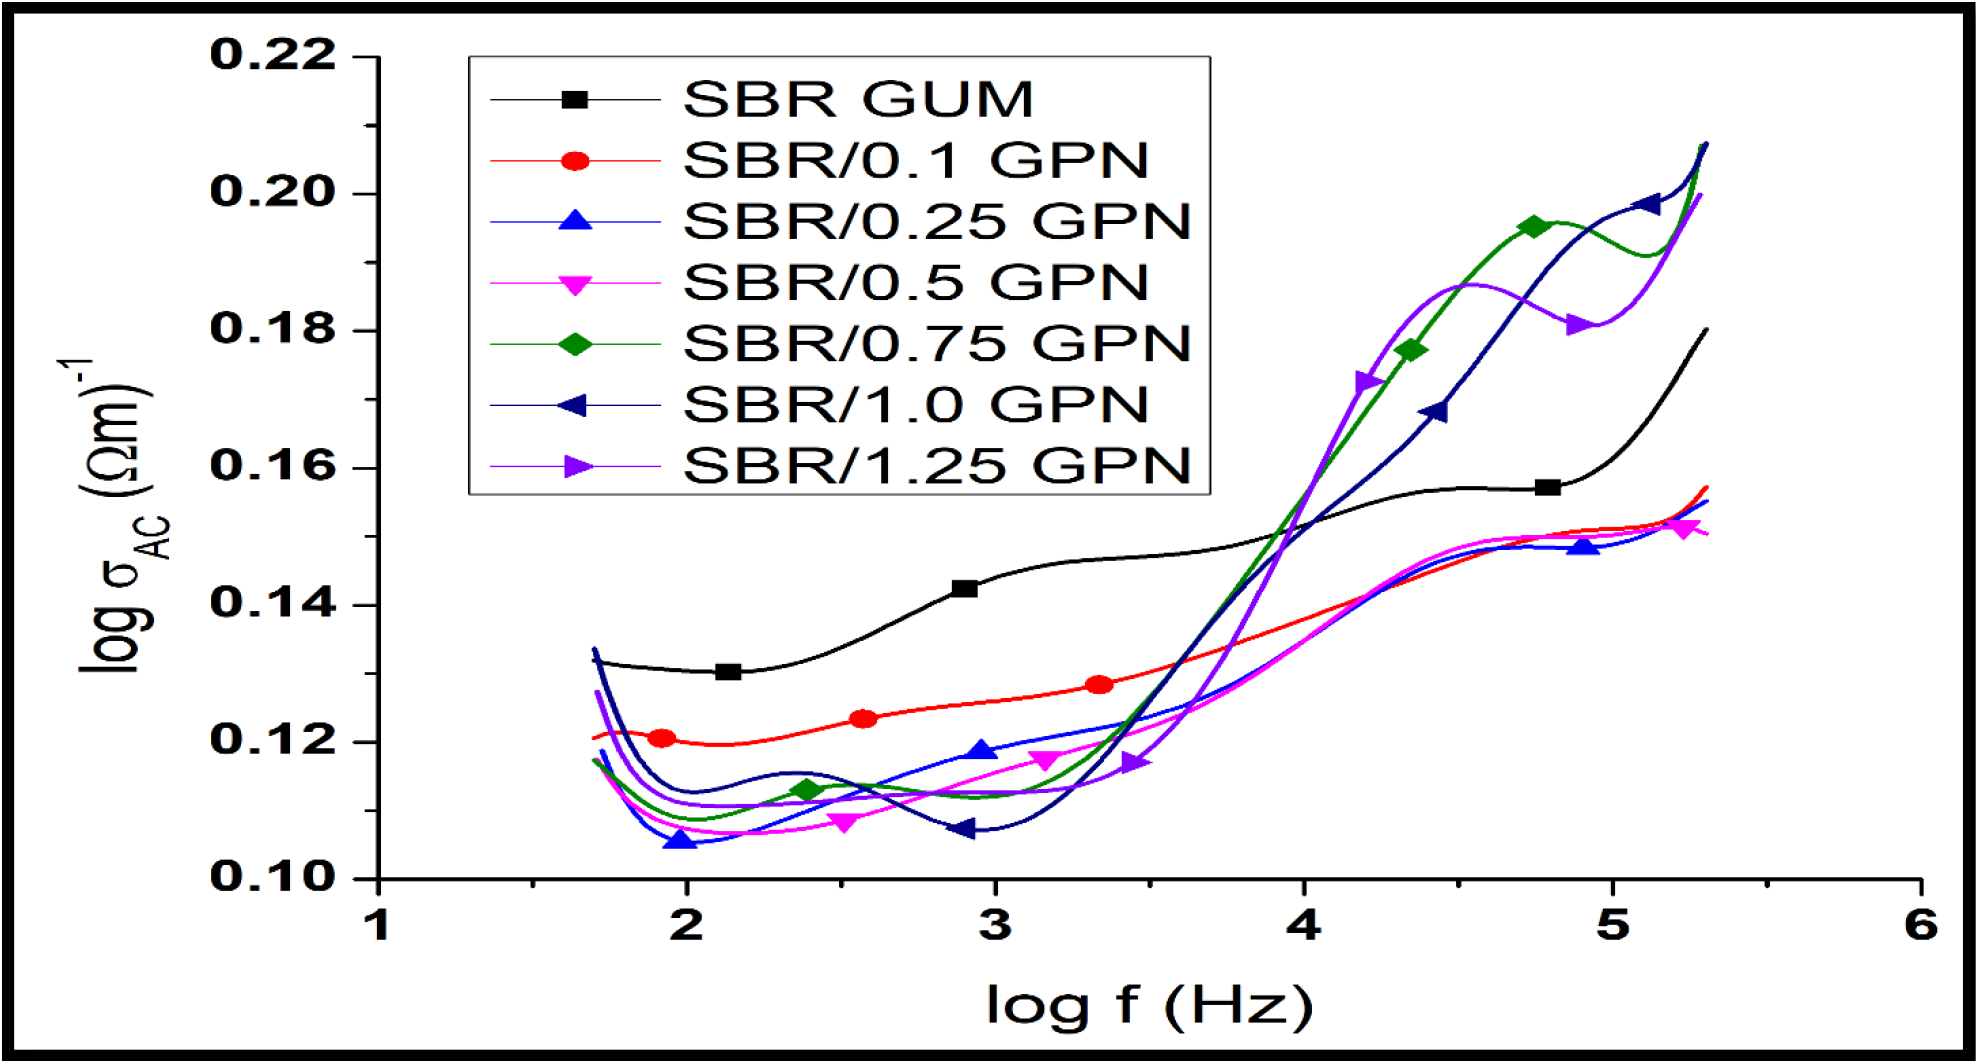
Fig. 6.: Effect of frequency on electrical conductivity of SBR/GPN nanocomposites
For both 0.1 and 0.25 Phr loaded composites conductivity was found to be marginally dependent on frequency. The electrical conductivity of the composites at and above the percolation (containing 0.75, 1.0 and 1.25 Phr of GPN filler) exhibited total frequency independent nature in the measured frequency range. In the composites with 0.1 and 0.25 Phr of filler, the frequency independent conductivity recorded can be attributed to resistive conduction through the bulk composite. On the other hand, at high frequencies, conductivity appears to be proportional to frequency due to the capacitance of the host medium between the conducting particles or aggregates. Also in these composites the continuous conductive network has just started to form with many conductive filler particles coming close to each other which give rise to appreciable increase in conductivity. This can be explained as follows. At high frequencies, the electrons are sufficiently excited so that they can hop from one conducting cluster to another adding to the conductivity that is already existing because of the smaller inter-particle gap. This leads to the increase in conductivity of these composites after a critical frequency (fc)[39]. The fc for composites containing 0.75, 1.0 and 1.25 Phr of GPN filler were found to be < “100 kHz after which there is a marginal increase in conductivity with frequency and then high increase at higher frequencies.
It can be seen that at relatively high frequencies the hopping becomes very dominant so that the conductivity of the composites near percolation approaches conductivity of the composites above percolation. Also it can be interpreted that the formation of a continuous conductive network minimizes the hopping effect and this can be observed from the crossover of the conductivity of the composite containing 0.25 and 0.5 Phr of GPN filler to a higher value than that of the composite containing 0.1 Phr of GPN filler.
The permittivity or dielectric constant (ɛ′) of the composites were calculated through the parallel capacitance readings taken from the LCR meter. The variation of ɛ′ with the frequency of the composites were studied and presented in fig. 7. From the figure it can be observed that the dielectric constant increases with increase in filler content and decreases with increase in frequency. At high frequencies, ɛ′ attains high values exponentially with increase in filler content.
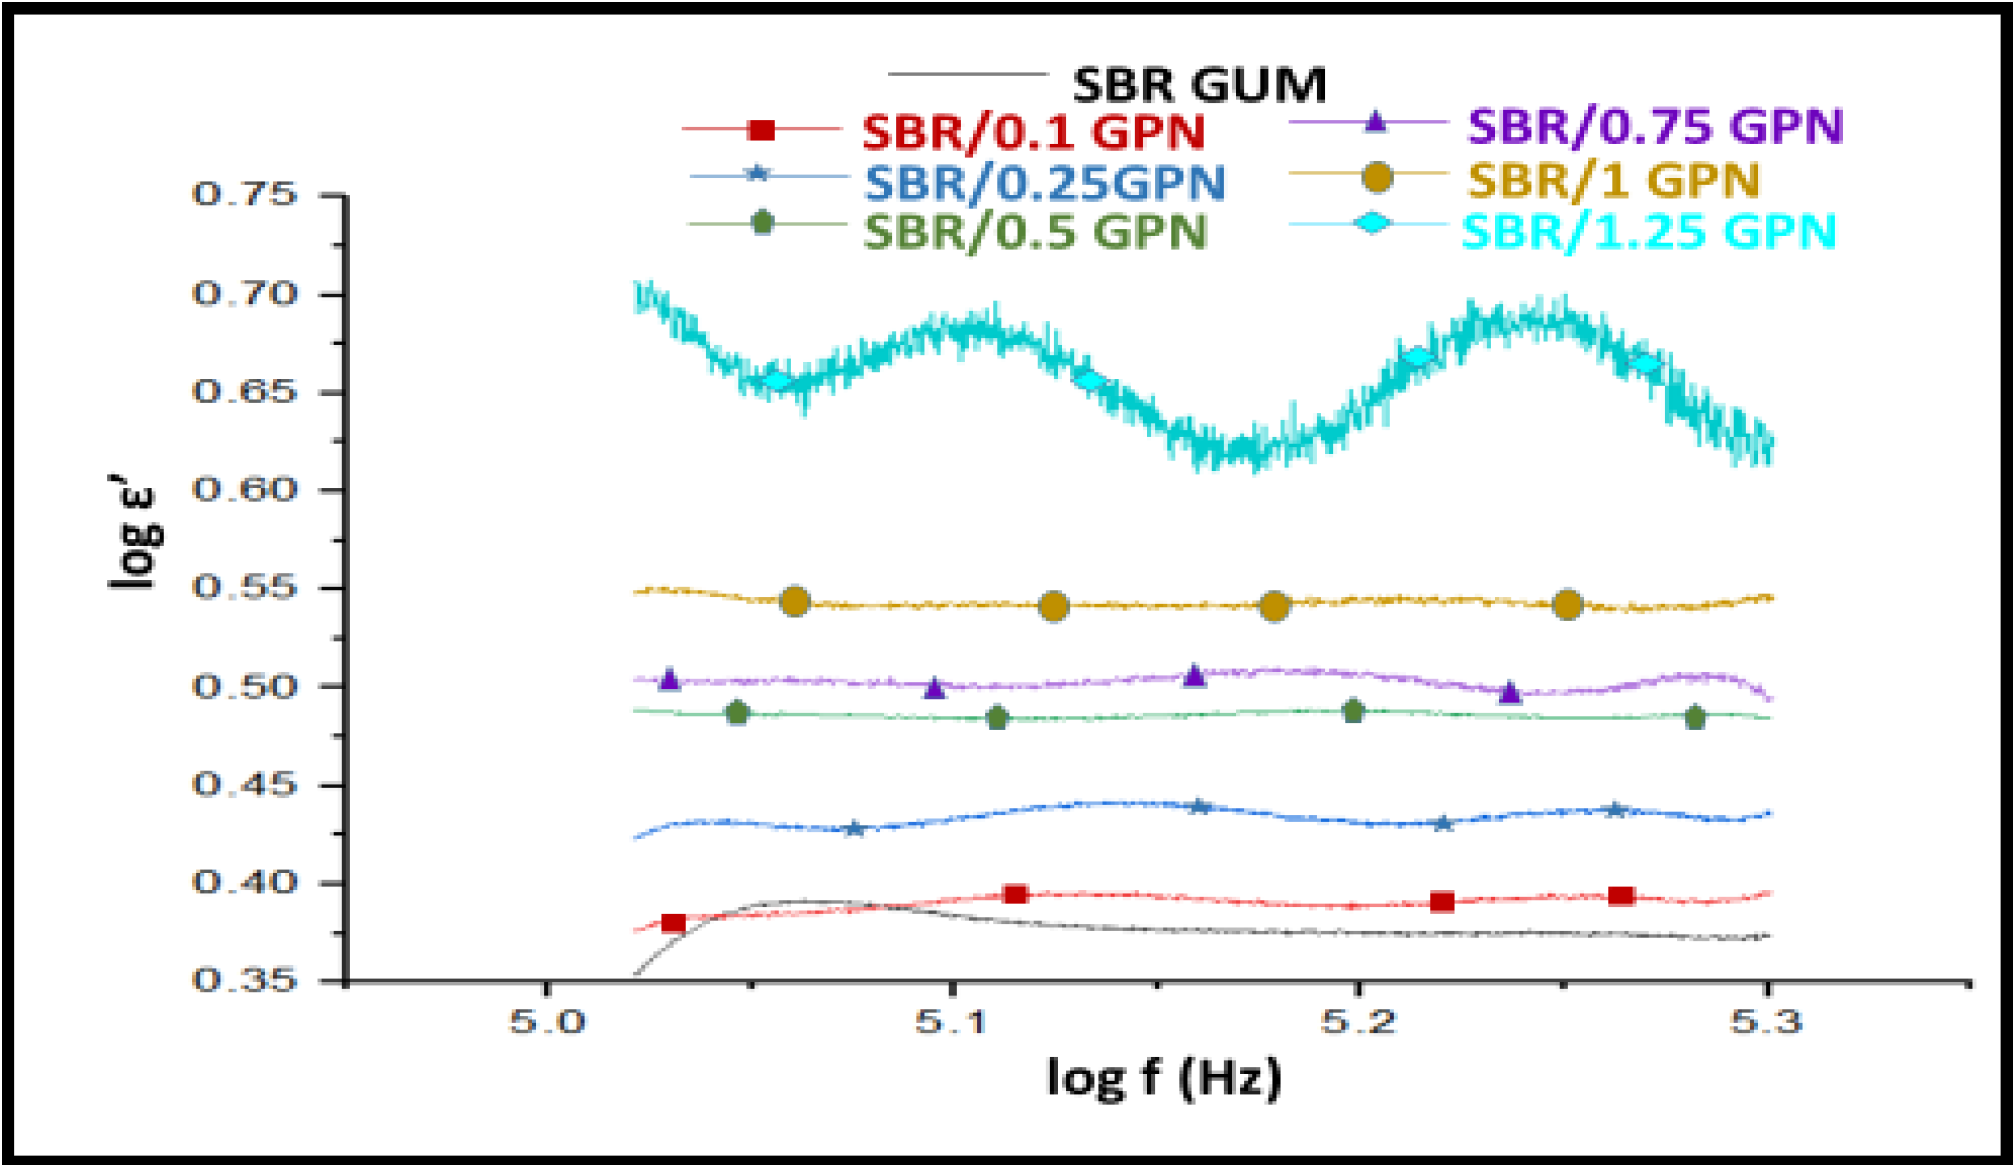
Fig. 7.: Effect of frequency on dielectric constant of SBR/GPN nanocomposites
3.4.2 Effect of applied pressure on Electrical properties
The variation of volume resistivity and electrical conductivity of the composites with applied pressure at a constant frequency of 100 kHz is shown in fig. 8. The volume resistivity decreases with increasing applied pressure and the electrical conductivity increases with increase in pressure up to a certain amount of pressure and then becomes constant. This behaviour of change in conductivity against applied pressure is found to be true only for composites near percolation (1.0, 0.25 and 0.5 Phr) loading of filler whereas in the case of composites containing 0.75, 1.0 and 1.25 Phr (at and above percolation) loading of filler the effect of pressure is found to be marginal. Whenever, a polymer composite is subjected to pressure two phenomena takes place simultaneously: (i) the breakdown of the existing conducting networks under the applied pressure and (ii) the formation of new conducting paths because of the slow movement of the polymer chains along with the filler aggregates under the applied pressure[40]. In the case of lower filler loadings, the conducting network available for the flow of current itself is very less and hence the breakdown process is relatively slower than the movement of polymer chains with the filler aggregates. This facilitates an appreciable decrease in the inter-filler aggregate distance forming new conducting paths thereby giving rise to the chance of more conduction. Also at these small inter-filler aggregate gaps the electron tunnelling mechanism of conduction also takes place. Thus, there is an increase in conductivity with pressure, but, after a critical pressure the polymer chains are unable to move further making the effect of pressure insignificant. In the case of higher filler loading the movement of polymer chains is hindered by the enormously available rigid filler aggregates thus formation of new paths becomes negligible. Also in these composites there is a complete continuous conductive network and the smaller destructions caused by the applied pressure has lesser effect. Hence, the effect of pressure on the conductivity of these composites is negligible.
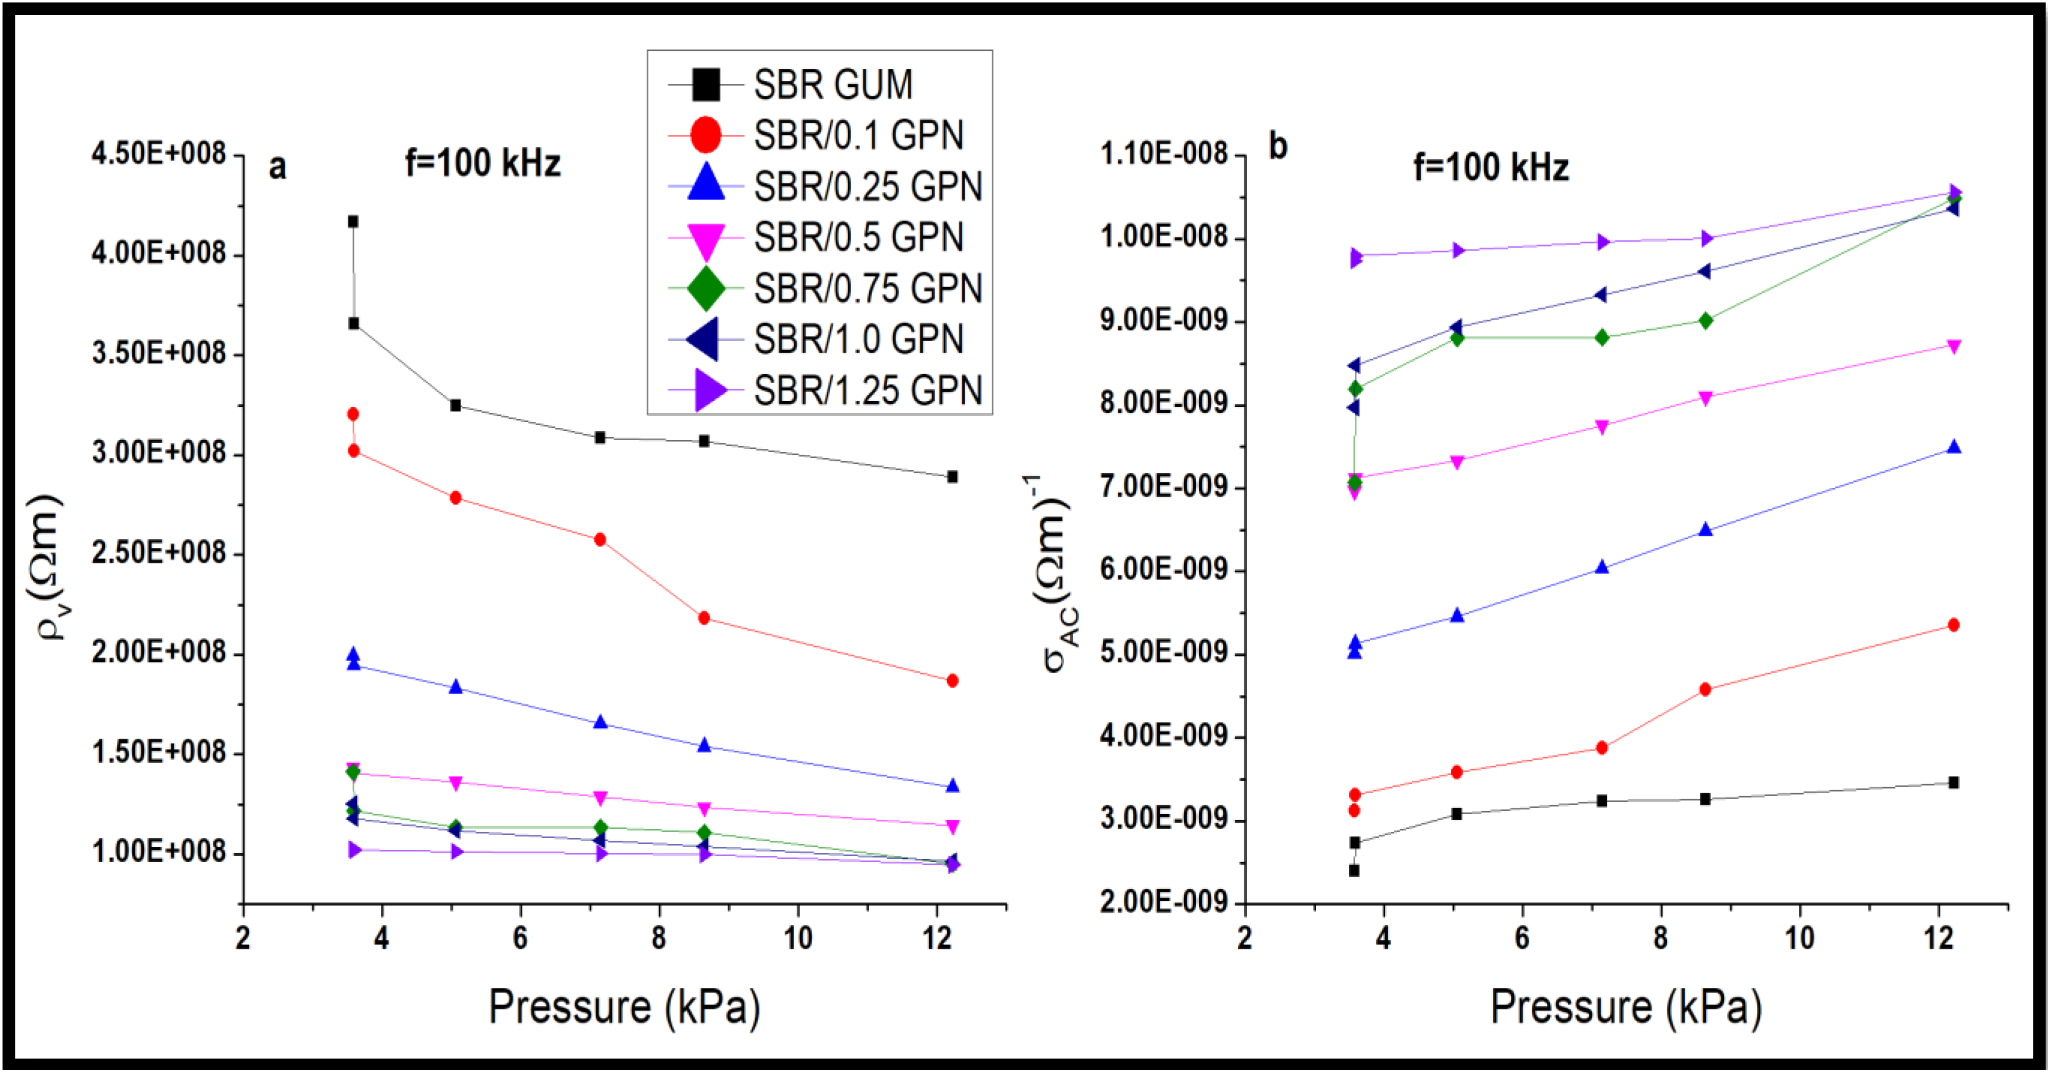
Fig. 8.: Effect of pressure on a) volume resistivity and b) electrical conductivity of SBR/GPN nanocomposites
3.4.3 Effect of temperature on Electrical properties
The effect of temperature on the volume resistivity and electrical conductivity of the composites was investigated at a constant frequency of 100 kHz as shown in fig. 9. The figure demonstrates that for all nanocomposites, the conductivity increases as when the temperature increases. At higher temperature and at high frequency of applied electric field, it can be assumed that all the three conducting mechanisms mentioned earlier will be operating and the net result has an enhanced effect, i.e., conduction through electron hopping gets magnified. Also, the increase in temperature perhaps has some positive influence on the flow of current by the enhanced effect of electric field 37. The effect of dipoles and interfacial polarization gets enhanced at higher temperature and leads to increased conductivity.
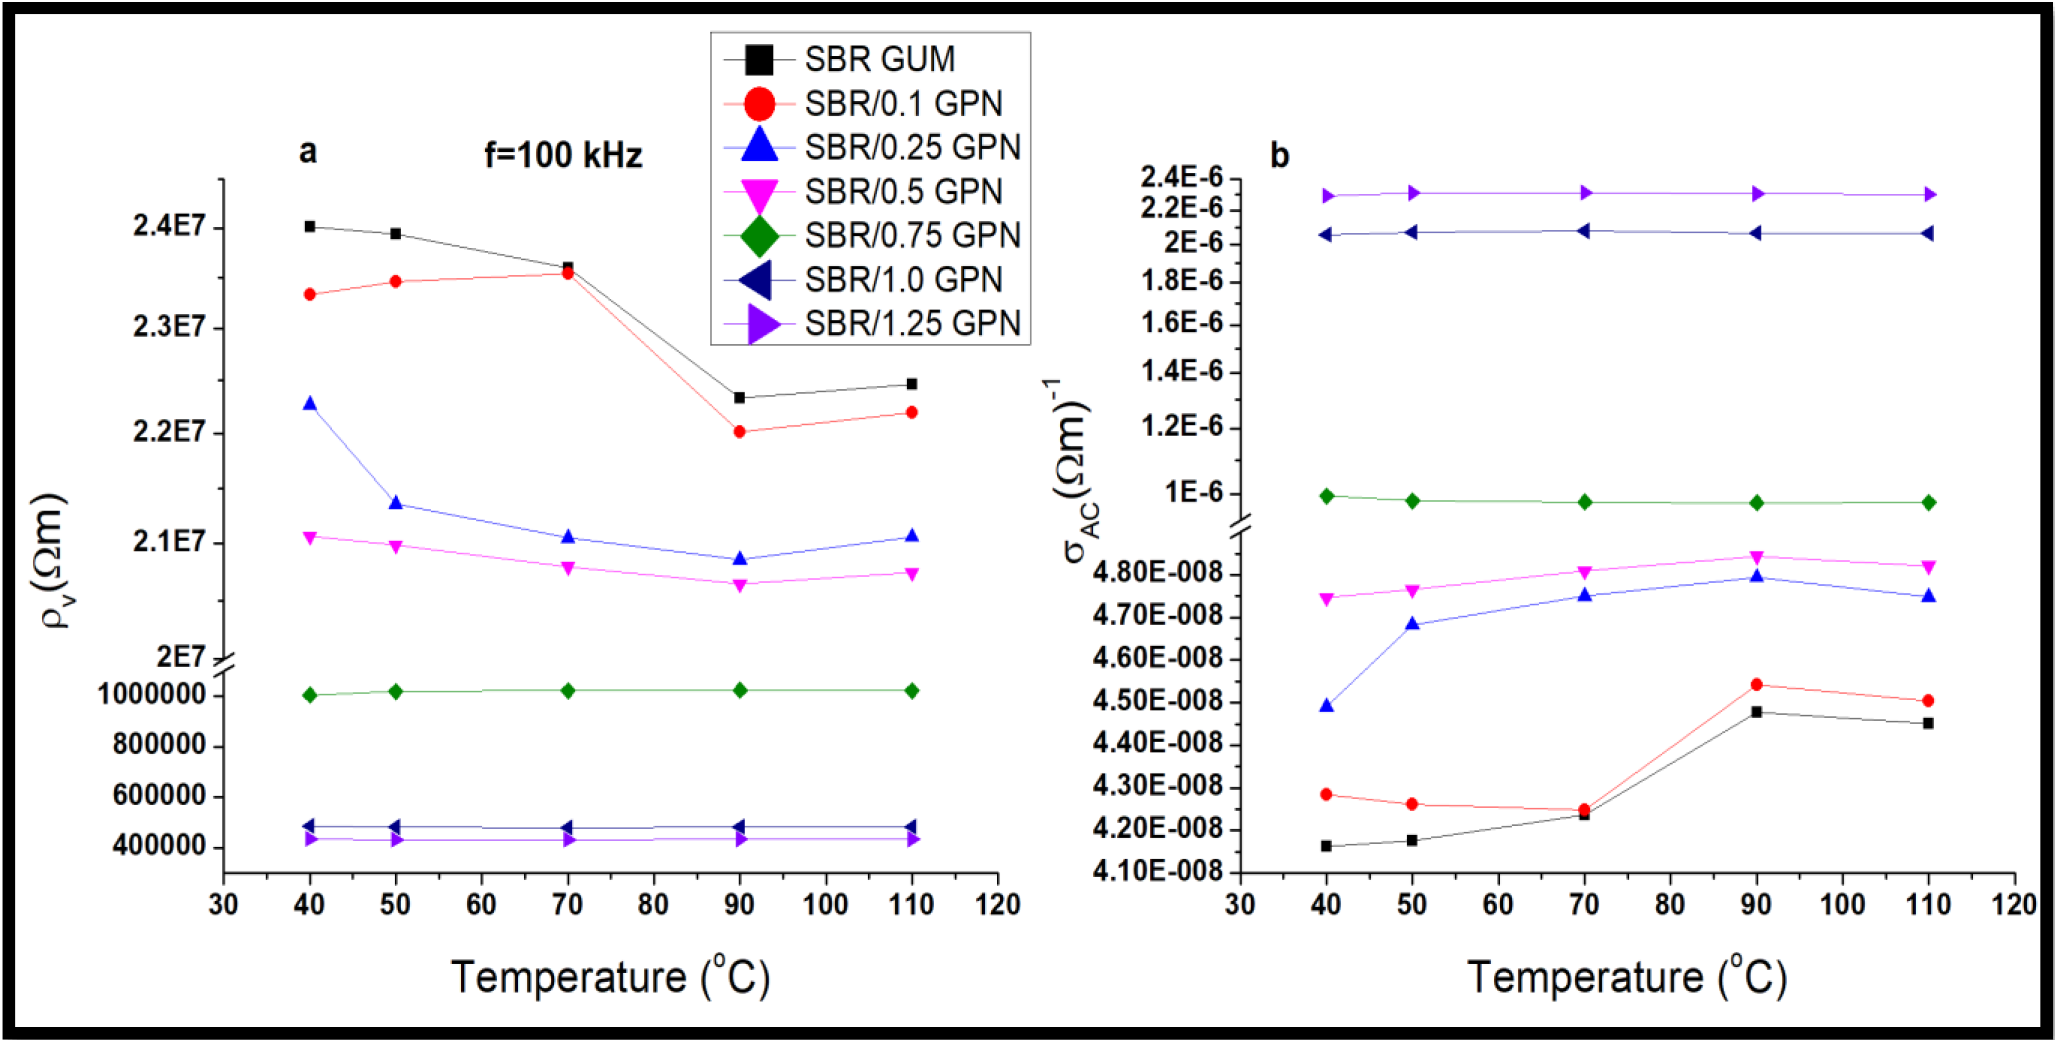
Fig. 9.: Effect of temperature on a) volume resistivity and b) electrical conductivity of SBR/GPN nanocomposites
The property of nanocomposites depends on the nature of filler and rubber, mode of dispersion, interfacial interaction, compatibilisation and so on. This report contains detailed insight of the effect of graphene platelet nano-powder on the styrene butadiene rubber. In this work, graphene platelet nano-powder is incorporated into SBR and rheological, electrical and mechanical properties of styrene butadiene rubber was studied by varying the filler content. Graphene platelet nano-powder is compounded with SBR rubber in an open two roll mixing mill.
When GPN filler is added to SBR vulcanizates, the torque difference increases. Nanocomposites of SBR filled with GPN filler had better mechanical properties. It has been observed that there is a gradual increase in electrical conductivity by increasing the amount of nanofiller. The addition of GPN filler tends to increase the dielectric constant and electrical conductivity of the nanocomposites. The electrical conductivity at 100 kHz is improved by 105% and 118% of magnitude of the SBR/0.75 GPN and SBR/ 1 GPN nanocomposites respectively compared to unfilled SBR. The lower volume resistivity value confirms better conducting path observed in SBR/GPN nanocomposites enhanced with GPN filler. The improvement in electrical conductivity and dielectric constant with the effect of applied pressure and temperature on the nanocomposites at a constant frequency of 100 kHz also can be observed to a certain amount of pressure and temperature. This type of nanocomposites may find its applications as pressure and strain sensors, electromagnetic shielding elastomers, flexible strain sensors and so on.
References
1. Araby, S., Zhang, L., Kuan, H.-C., Dai, J.-B., Majewski, P., Ma, J. (2013). Polymer, 54, 3663–3670. [Google Scholar]
2. Bagotia, N., Choudhary, V., Sharma, D. K. (2018). Polym Adv Technol, 29, 1547–1567. [Google Scholar]
3. Thomas, P. C., Tomlal Jose, E., Selvin Thomas, P., Thomas, S., Joseph, K. (2010). Polym Compos, 31, 1515–1524. [Google Scholar]
4. Yang, J., Tian, M., Jia, Q.-X., Zhang, L.-Q., Li, X.-L. (2006). J. Appl. Polym. Sci., 102, 4007–4015. [Google Scholar]
5. Witt, N., Tang, Y., Ye, L., Fang, L. (2013). Materials & Design, 45, 548–554. [Google Scholar]
6. Fuse, N., Homma, H., Okamoto, T. (2014). IEEE Trans. Dielect. Electr. Insul., 21, 571–581. [Google Scholar]
7. Murugesan, A., Lakshmanan Saraswathy, J., Chandran, R. (2022). International Polymer Processing, 37, 505–522. [Google Scholar]
8. Kumar, M. S. S., Raju, N. M. S., Sampath, P. S., Jayakumari, L. S. (2014). Rev. Adv. Material Science, 38, 40–54. [Google Scholar]
9. Wu, J., Huang, G., Li, H., Wu, S., Liu, Y., Zheng, J. (2022). Polymer, 54, 1930–1937. [Google Scholar]
10. T. J. Pinnavaia, G. W. Beall 12/2000 edn. (2000). p. 320. [Google Scholar]
11. Tang, M., Xing, W., Wu, J., Huang, G., Xiang, K., Guo, L., Li, G. (2015). J. Mater. Chem. A, 2015, 3, 5942-5948. [Google Scholar]
12. Ozbas, B., Neill, C. D., Register, R. A., Aksay, I. A., Prud, Homme, R. K., Adamson, D. H. (2012). Journal of Polymer Science Part B: Polymer Physics, 50, 910–916. [Google Scholar]
13. Yang, Z., Liu, J., Liao, R., Yang, G., Wu, X., Tang, Z., Guo, B., Zhang, L., Ma, Y., Nie, Q., Wang, F. (2016). Composites Science and Technology, 132, 68–75. [Google Scholar]
14. Katsnelson, M. I. Materials Today, 2007, 10, 20-27. [Google Scholar]
15. Hummers, W. S., Offeman, R. E. (2058). J. Am. Chem. Soc., 80, 1339-1339. [Google Scholar]
16. Marcano, D. C., Kosynkin, D. V., Berlin, J. M., Sinitskii, A., Sun, Z., Slesarev, A., Alemany, L. B., Lu, W., Tour, J. M. (2010). ACS Nano, 4, 4806–4814. [Google Scholar]
17. Zhang, H., Xing, W., Li, H., Xie, Z., Huang, G., Wu, J. (2019). Advanced Industrial and Engineering Polymer Research, 2, 32-41. [Google Scholar]
18. Hwang, W.-G., Wei, K.-H., Wu, C.-M. (2004). Polym Eng Sci, 44, 2117-2124. [Google Scholar]
19. Mensah, B., Gupta, K. C., Kim, H., Wang, W., Jeong, K.-U., Nah, C. (2018). Polymer Testing, 68, 160-184. [Google Scholar]
20. Yan, P., Yujia, H., Qi, W., Yong, Z., Guangsu, H., Qichao, R., Jinrong, W. (2020). Carbon, 166, 56-63. [Google Scholar]
21. Liu, J., Zhao, F., Tao, Q., Cao, J., Yu, Y., Zhang, X. (2019). Mater. Horiz., 6, 1892-1898. [Google Scholar]
22. Hatami, K., Grady, B. P., Ulmer, M. C. (2009). J. Geotech. Geoenviron. Eng., 135, 863-874. [Google Scholar]
23. Lipomi, D. J., Vosgueritchian, M., Tee, B. C.-K., Hellstrom, S. L., Lee, J. A., Fox, C. H., Bao, Z. (2011). Nature Nanotech, 6, 788-792. [Google Scholar]
24. Kang, H., Tang, Y., Yao, L., Yang, F., Fang, Q., Hui, D. (2017). Composites Part B: Engineering, 112, 1-7. [Google Scholar]
25. Hernández, M., del Mar Bernal, M., Verdejo, R., Ezquerra, T. A., López-Manchado, M. A. (2012). Composites Science and Technology, 73, 40-46. [Google Scholar]
26. Valentini, L., Bittolo Bon, S., Lopez-Manchado, M. A., Verdejo, R., Pappalardo, L., Bolognini, A., Alvino, A., Borsini, S., Berardo, A., Pugno, N. M. (2012). Composites Science and Technology, 128, 123–130. [Google Scholar]
27. Kasi, E., Josephraj, F. X., Murugesan, A. K., Pandian, B. (2021). Mater. Plast., 58, 34-46. [Google Scholar]
28. Kim, D. Y., Park, J. W., Lee, D. Y., Seo, K. H. (2020). 14. [Google Scholar]
29. Vishvanathperumal, S., Navaneethakrishnan, V., Anand, G., Gopalakannan, S. (2020). Adv Sci Engng Med, 12, 632-642. [Google Scholar]
30. Mensah, B., Kim, S., Arepalli, S., Nah, C. (2014). Journal of Applied Polymer Science, 131. [Google Scholar]
31. Wu, J., Xing, W., Huang, G., Li, H., Tang, M., Wu, S., Liu, Y. (2013). Polymer, 54, 3314-3323. [Google Scholar]
32. Varghese, T. V., Ajith Kumar, H., Anitha, S., Ratheesh, S., Rajeev, R. S., Lakshmana Rao, V. (2013). Carbon, 61, 476–486. [Google Scholar]
33. Xie, Z.-T., Fu, X., Wei, L.-Y., Luo, M.-C., Liu, Y.-H., Ling, F.-W., Huang, C., Huang, G., Wu, J. (2017). Polymer, 118, 30–39. [Google Scholar]
34. Habib, N. A., Jabbar, A. S., Hassan, F. L., Intan, N. I. (2021). J. Phys.: Conf. Ser., 1795, 012072. [Google Scholar]
35. Ravikumar, K., Palanivelu, K., Ravichandran, K. (2015). AMM, 766-767, 377-382. [Google Scholar]
36. Mohanraj, G. T., Chaki, T. K., Chakraborty, A., Khastgir, D. (2007). J. Appl. Polym. Sci., 104, 986-995. [Google Scholar]
37. Mohanraj, G. T., Chaki, T. K., Chakraborty, A., Khastgir, D. (2004). J. Appl. Polym. Sci., 92, 2179-2188. [Google Scholar]
38. Smith, W. R. (1967). J. Appl. Polym. Sci., 11, 2079-2079. [Google Scholar]
39. Psarras, G. C., Manolakaki, E., Tsangaris, G. M. (2003). Composites Part A: Applied Science and Manufacturing, 34, 1187-1198. [Google Scholar]
40. Sau, K. P., Chaki, T. K., Khastgir, D. (2000). Rubber Chemistry and Technology, 73, 310-324. [Google Scholar]
Cite This Article
 Copyright © 2023 The Author(s). Published by Tech Science Press.
This work is licensed under a Creative Commons Attribution 4.0 International License , which permits unrestricted use, distribution, and reproduction in any medium, provided the original work is properly cited.


 Submit a Paper
 Propose a Special lssue
 View Full Text
 Download PDF
 Downloads
 Citation Tools