 Open Access
ARTICLE
Chiral Copolymers of (R)-N-(1-Phenyl-Ethyl) Methacrylamide (R-NPEMAM) and 2-Hydroxy Ethyl Methacrylate (HEMA): Investigation of PhysicoChemical Behavior, Thermal Properties and Degradation Kinetics
Defence Materials and Stores Research and Development Establishment (DMSRDE), G. T. Road, Kanpur-208013, India.
* Corresponding Author: e-mail:
Journal of Polymer Materials 2023, 40(1-2), 105-123. https://doi.org/10.32381/JPM.2023.40.1-2.9
Abstract
In this paper, we report the microstructural investigation and influence of H-bonding on the thermal behavior e.g., glass transition (Tg ) and thermal degradation of chiral copolymers of (R)- N-(1-phenyl-ethyl) methacrylamide (R-NPEMAM) and 2-hydroxy ethyl methacrylate (HEMA). The Tg increases with the increase of chiral unit content in the copolymers and then attains optimum at around 25 mole % of chiral content. Thereafter it decreases with the increase of chiral content. The effect of copolymer composition and secondary interaction associated with the Hbonding on the thermal properties of these copolymers was also studied. Secondary interaction, specifically H-bonding has been interpreted using FTIR analysis. The copolymers thermally degrade in three stages. The first and third stages of degradation are associated with the chiral comonomer (R-NPEMAM) whereas the second stage indicates the degradation due to HEMA unit present in the copolymer chain. The activation energies for these degradations of the copolymers have been evaluated using Flynn-Wall and Kissinger method.Keywords
Chiral polymers due to their dissymmetric nature and chiroptical properties have attracted extensive attention of chemists, biologist, pharmacists and material scientists[1–5]. Synthetic chiral polymers and polymers with helical conformation have been focused to mimic biological activity like natural polymers e.g., peptides and proteins[6–12]. This class of chiral polymers finds its application in biotechnology such as artificial neurons in smart robotics, synthetic muscles in intelligent devices, scaffold matrixes in tissue engineering and other nano-devices[13–14]. Other potential applications of chiral polymers due to their chiroptical properties have been explored in the field of optical and non-linear optical and optoelectronic application[15–20]. These include chiroptical switch[21–24], optical wave guide [25] and optical information storage[26–27]. The dissymmetric chiral polymers are widely used as chiral polymeric catalysts for asymmetric organic synthesis[28–33] and as chiral stationary phases (CSP) in chromatographic separation processes [34–37].
One of the simplest methods of synthesizing chiral polymers involves the polymerization of optically active chiral monomers because it does not require expensive chiral catalysts and design of sophisticated synthetic procedures[38–40]. Also many unique properties could be combined by copolymerization of chiral monomers with other comonomers. We have focused on the synthesis of chiral polymers and copolymers and studying their chiroptical properties as well as tuning of polymer chain helicity and optical activity [6, 41–42]. Recently, the copolymerization of a chiral monomer, (R)-N-(l-phenyl-ethyl) methacrylamide with 2-hydroxy ethyl methacrylate and its chiroptical properties have been reported [43]. As it is very important to understand the thermal properties of polymers while considering polymers for any one of their possible applications, we have mainly focused on the investigation on thermal properties of these chiral copolymers.
Thermal properties of copolymers depend on the nature of the constituents (comonomers), arrangements of the comonomers and any other specific interactions associated with the copolymer microstructures. Thermal degradation behavior of graft copolymers of carboxymethyl cellulose with vinyl monomers like acrylamide, dimethylacrylamide, N-vinyl pyrrolidone, 2-acrylamido-2-methyl-1 -propane sulphonic acid (AMPS) and vinyl caprolactum (VCL) was reported[44]. All these graft copolymers have shown multistep process of their thermal degradation. Similarly, ethylene-vinyl acetate copolymer has undergone two-step degradation: an acetate pyrolysis of the copolymer leaving a polyunsaturated linear hydrocarbon, followed by the breakdown of the hydrocarbon backbone [45]. Thermal degradation kinetics of poly(methyl methacrylate)-b-poly(styrene) block copolymers has been reported[46]. The block copolymers exhibited two glass transitions because of two segments (PMMA and PS segments) and also two-staged thermal degradations. It was also found that the introduction of the PS chain remarkably enhanced the thermal stability of the copolymer, thus endowing the block copolymers high activation energy for thermal degradation. Thermal stability and degradation of PS-b-PMMA block and P(S-r-MMA) random copolymers were described[47]. The temperature corresponding to the maximum of the main monomer loss is similar for the block and random copolymers. However, the onset of the main degradation for the random copolymers is observed at a temperature 50°C lower than the one for the block copolymers. In random copolymers, the successive evolution of the two monomers occurred in parallel fashion, indicating the occurrence of depolymerization via an unzipping process. In contrast, in case of the block copolymers, the two chemically different blocks depolymerized at different temperatures due to their distinct thermal stabilities.
The activation energies for thermal degradation of poly(acrylic acid-styrene oxide) copolymers were observed to be in the range of 161.86 kJ. mol−1 to 285.74 kJ/mol [48]. Thermal degradation of a copolymer of glycidyl azide polymer (GAP) and poly(bis(azidomethyl) oxetane (Poly(BAMO)), which is an energetic thermoplastic elastomer (ETPE) was reported to exhibit two stages of degradation at two temperatures[49]. Kinetic analysis suggested that the activation energy of the main degradation step was around 145kJ/mol and for the second shoulder it was around 220kJ/ mol. The thermal degradation and the kinetic parameters of poly(n-buthyl methacrylate-b-styrene) diblock copolymer were investigated by TGA analysis[50]. TGA curves showed one-staged degradation. The activation energies of thermal degradation of the copolymer were 112.52, 116.54 and 113.41kJ/mole as determined by the Kissinger's, Flynn-Wall-Ozawa and Tang methods, respectively.
In this investigation, we focused on the thermal properties of chiral copolymers of (R)-N-(1-phenyl-ethyl) methacrylamide with 2-hydroxy ethyl methacrylate. The microstructural effect associated with the copolymer composition and secondary interaction, especially H-bonding on the thermal properties of such copolymers is also discussed. The thermal degradation kinetics especially the activation energies of thermal degradation of the copolymer were determined by the Kissinger's and Flynn-Wall methods.
The chemicals, (R)-1-phenyl-ethyl amine and methacryloyl chloride (Alfa Aesar); ethanol, methanol, hexane and NaOH (Samir Tech Chem. Pvt. Ltd.) were used as received. 2-Hydroxy ethyl methacrylate (HEMA) (97%, Lancaster) was purified, vacuum distilled and stored at 5°C in a refrigerator before use. Toluene (Ranbaxy) was dried over calcium chloride for 24h, refluxed with sodium metal and finally distilled prior to use. Benzoyl peroxide (BPO) (ACROSS) was recrystallized twice from cold chloroform, dried in a vacuum desiccator at room temperature and stored in dark at 5°C in a refrigerator before use.
The chiral monomer, (R)-N-(1-phenyl-ethyl) methacrylamide was synthesized by the condensation reaction of (R)-1-phenyl-ethyl amine and methacryloyl chloride as per the reported method[41]. Chiral copolymers of chiral monomer, (R)-N-(1-phenyl-ethyl) methacrylamide (R-NPEMAM) and 2-hydroxy ethyl methacrylate (HEMA) were obtained by free radical polymerization of the comonomers of different molar feed composition using benzoyl peroxide (BPO) initiator (1wt% of total monomer) at 80°C under N2 atmosphere in toluene (Scheme-1)[43]. The copolymer samples were purified by reprecipitation technique using ethanol as a solvent. The copolymers were dried at 70°C under vacuum.
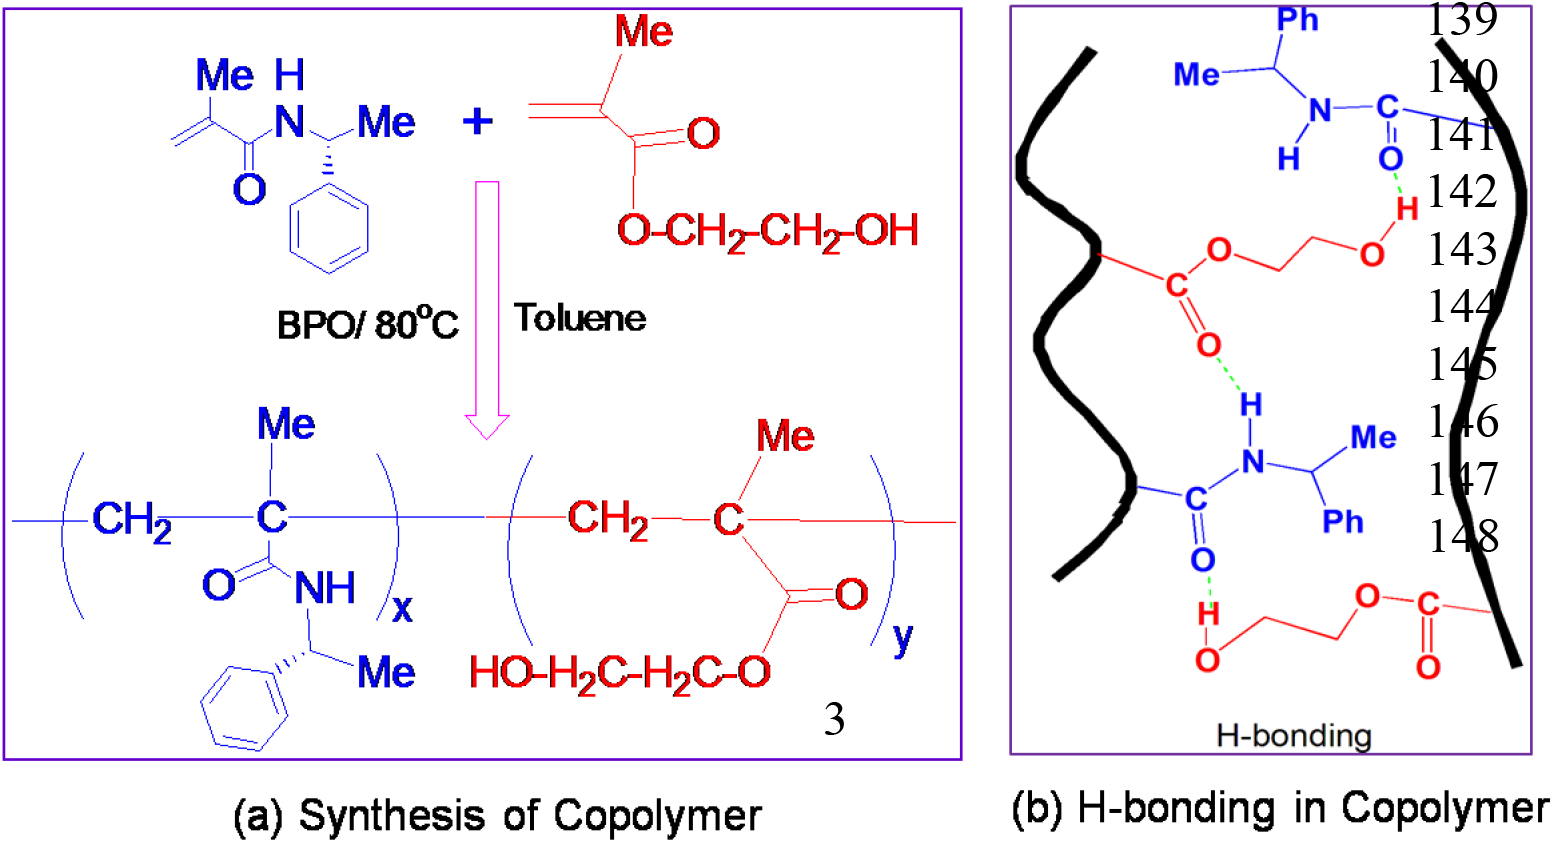
Scheme 1: (a) Synthesis of chiral copolymers of (R)-N-(1-phenyl-ethyl) methacrylamide (R-NPEMAM) and HEMA (abbreviated as PRMH) and (b) copolymer structure showing H-bonding
The purified chiral copolymer (PRMH) samples were used for their characterization. The thermal behavior of the copolymers was accomplished by differential scanning calorimetry (DSC), thermogravimetry (TG) and differential thermogravimetry (DTG). The micro-structural analysis was carried by FTIR analysis.
2.3.1 Differential Scanning Calorimetry (DSC)
DSC curves were obtained using a DSC Q100 differential scanning calorimeter (TA Instruments, USA). Samples of about 5 mg in aluminium pans and nitrogen flow rate of 50 ml/min were used and heat flow vs temperature data were obtained with a scanning rate of 10°C/min.
The glass transition temperatures of the copolymers were measured with the following thermal cycles: from ambient to 160°C, back to the ambient temperature and then to 160°C; all at 10°C/min. The first cycle was used to dry the samples and more to erase any thermal history prevailing in the samples. The results given are from the second heating cycle. The Tg values were obtained at the inflection point of the jump of heat capacity.
TGA thermograms were taken from TGA/STDA 851e Thermogravimetric Analyzer (Mettler Toledo, Switzerland.) under Ar-flow (40 ml/min). Samples of about 5 mg were heated from room temperature to 700°C at the heating rate of 20°C/min, 10°C/min, and 5°C/min.
FTIR spectra of the copolymers were recorded with KBr pellets using a Perkin Elemer RX-1 spectrophotometer at room temperature with a spectral resolution of 1 cm−1.
In this paper, the thermal properties of chiral copolymers of (R)-N-(1-phenyl-ethyl) methacrylamide (R-NPEMAM) and HEMA are reported. Specific interaction especially H-bonding associated with such copolymers has been investigated by FTIR analysis and its effect on such properties; especially the glass transition temperatures have been presented.
Some of the properties as well as the calculated sequence distribution of these copolymers are given in Table 1. The copolymer composition was estimated from the NMR analysis of the copolymers. The reactivity ratios of copolymerization of R-NPEMAM and HEMA were determined using the Kelen-Tudos methodology which were described previously[43]. The values of r1 (= 0.133) and r2 (=1.042) were calculated, where chiral monomer is designated as monomer 1 (say, M1) and HEMA as monomer 2 (say, M2). In general, the microstructure of a copolymer i.e., the sequence distribution of monomers in a copolymer chain is calculated from knowledge of the monomer reactivity ratios and monomer feed composition using statistical relations[51–52]. Hence, the following formulae were used:

4 (Nx)1 = P11 (x−1) P12, where, P11 = 1−P12 (3)
5 (Nx)2 = P22 (x−1) P21 where, P22 = 1−P21 (4)
Where, Pij is the conditional probability of the addition of monomer j to a growing chain terminated with an chain propagating radical i and X = [M1]/[M2] is the composition of the monomer feed. The (Nx)1 and (Nx)2 are the number fractions of sequence of monomer 1 (i.e., chiral monomer) and monomer 2 (i.e., HEMA) respectively. The calculated values of P12 and P21 based on the above equations are given in Table 1. Similarly, the other sequence like diads, triads can be calculated. A plot of such sequence of chiral monomer in the copolymer is plotted in Fig. 1. The microstructure analysis reveals that for example PRMH-5 copolymer has 88.2% composition of isolated R-NPEMAM units, 10.4% of diads, 1.2% of triads and so on. Moreover, the diads and triads sequence of R-NPEMAM units attain optimum at more than 60–65% composition of R-NPEMAM units.
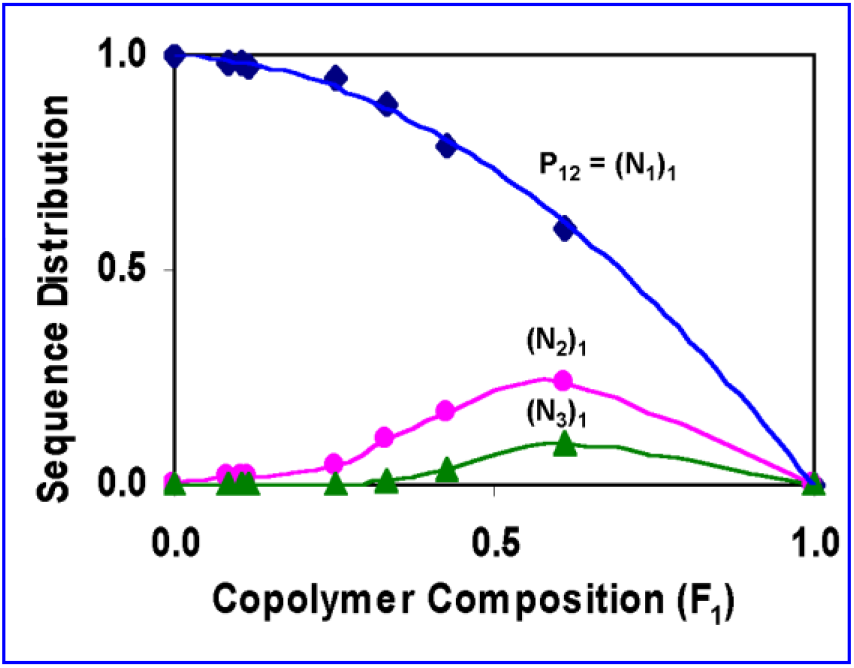
Fig. 1.: Sequence Distribution of R-NPEMAM in the copolymers
5.1 Glass Transition Temperature
The glass transition temperatures (Tg) of the chiral copolymers were measured by DSC analysis. The observed Tg values are depicted in the DSC thermograms (Fig. 2). A single Tg value was clearly observed for each of the copolymer and the value depends on the copolymer composition suggesting the copolymers are statistical in all composition. Moreover, single glass transition temperatures of the copolymers indicate that these copolymers are homogeneous [53].
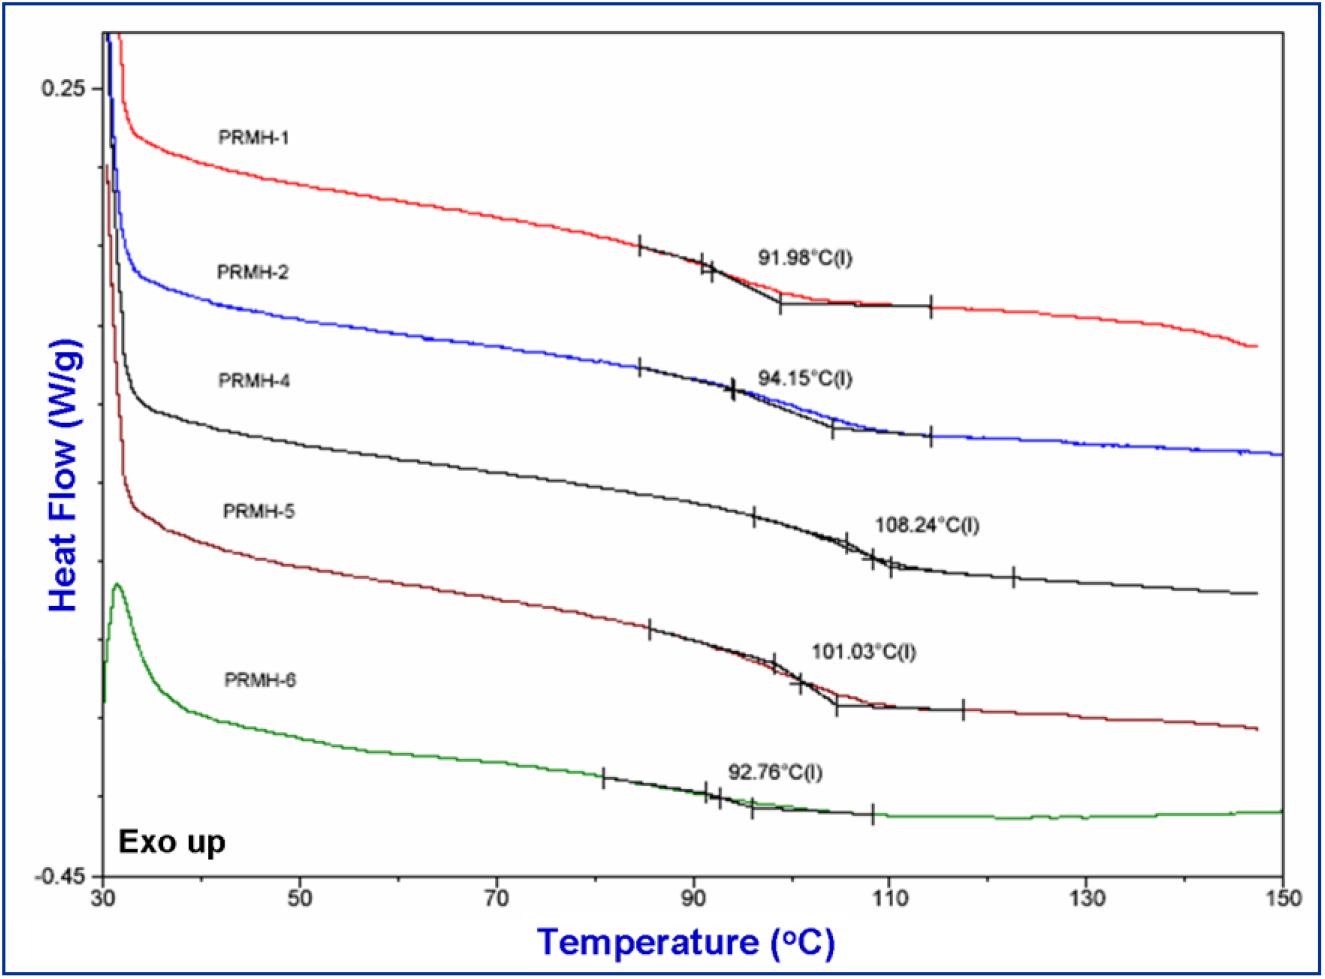
Fig. 2(a).: DSC curves of various chiral copolymers
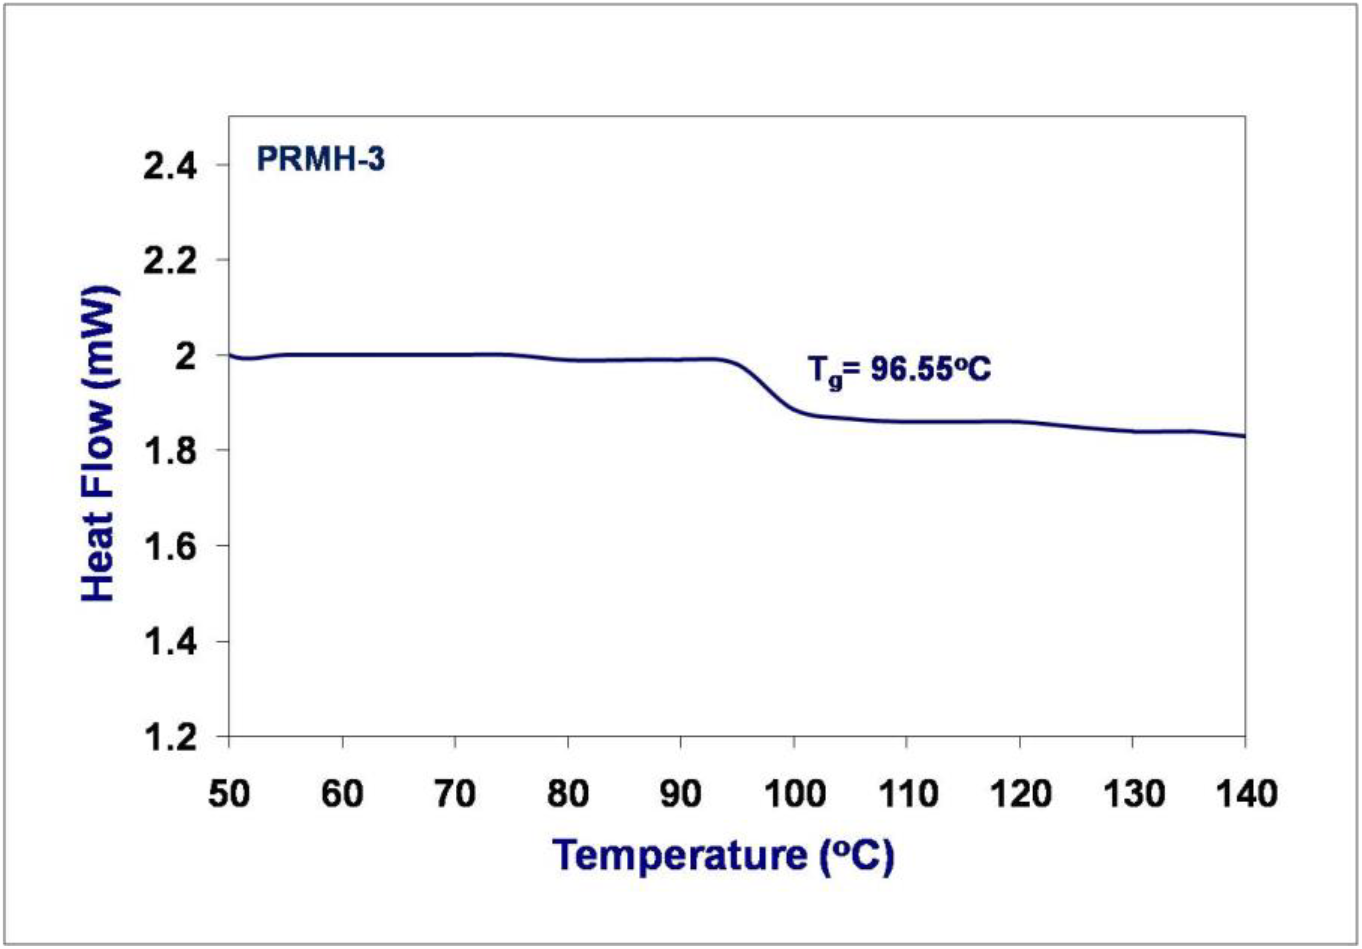
Fig. 2(b).: DSC curve of PRMH-3 chiral copolymer
However, the Tg values are high for all these copolymers when compared with that of poly(2-hydroxy ethyl methacrylate) homopolymer as its reported value is 87°C[54]. Chiral comonomer contains bulky aromatic ring whereas the achiral monomer, HEMA has flexible pendant group. Hence it is apparent that the Tg may increase due to chain stiffening effect of the bulky structure of the chiral unit in the copolymers.
In order to understand the detail behavior of glass transition of such copolymers, the Tg values are plotted against the chiral content in the copolymers (Fig. 3). However, the variation of Tg does not follow linear relationship with the chiral content. Although at the initial stage, the Tg increases with the chiral content, but this variation attains optimum value at the chiral content of about 25 mole % and then slightly decreases. This might be due to the disturbance of the uniformity of the polymeric chain due to the higher content of the bulky chiral unit. The chemical structures of the copolymers suggest high possibility of secondary interactions including H-bonding in the copolymers studied here.
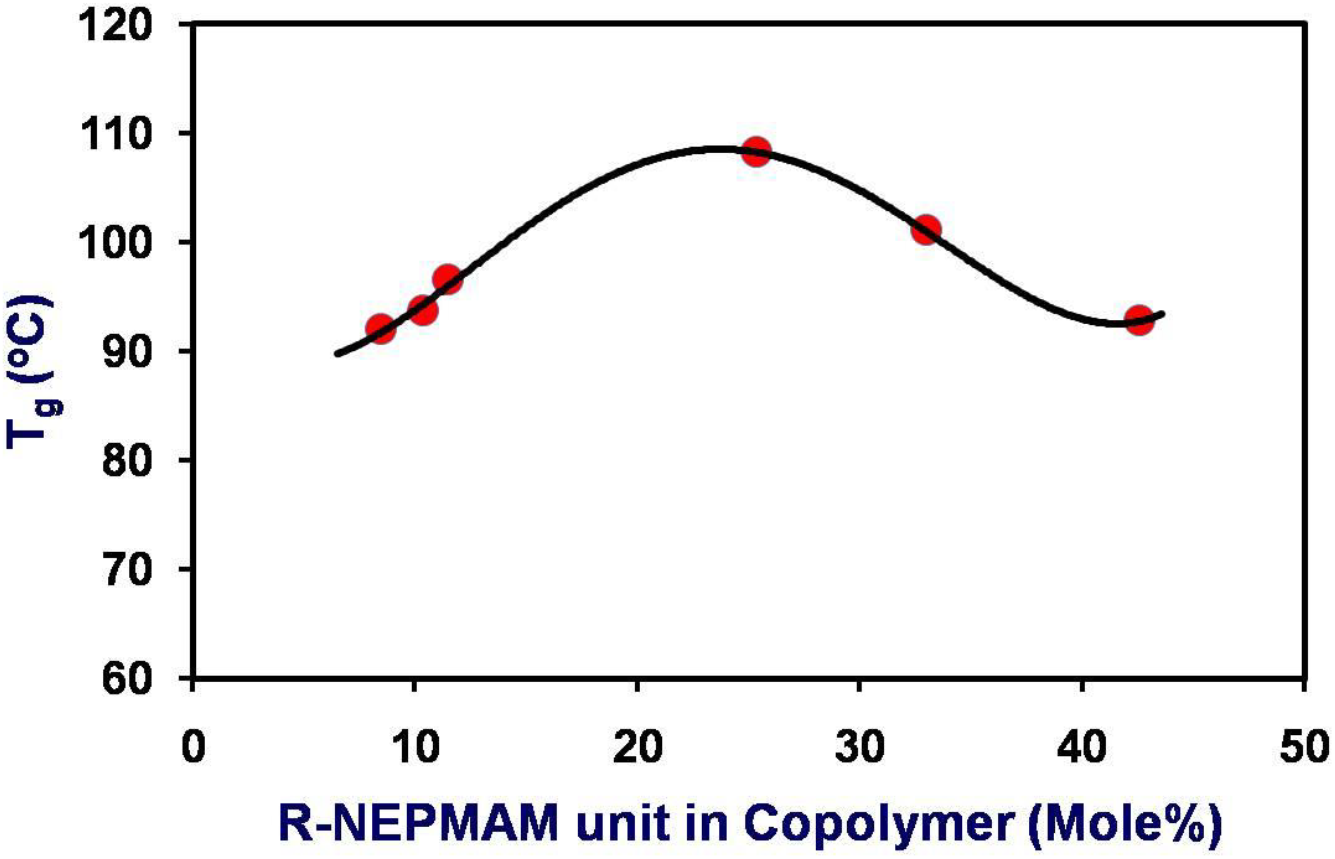
Fig. 3.: Variation of T with the chiral content in the copolymers
In general, the Tg depends on the polymer structure, chain flexibility and secondary interactions including H-bonding in the polymeric chains. Again the nature of groups directly attached to the backbone plays significant role due to steric repulsion and/or tendency to form H-bonding. The chain flexibility is reduced by ring structures like phenylene. In these copolymers, the nature of the groups attached to the polymer backbone has widely varied characteristics. The chiral unit, R-NPEMAM contains the bulky aromatic ring structure. On the other hand, highly flexible pendant group, ethyl hydroxy (-CH2-CH2-OH) is present in the HEMA unit. Moreover, the presence of amide (-CONH-) of R-NPEMAM and hydroxyl (-OH) as well as ester (-COO-) groups of HEMA have the possibility of forming H-bonding (intra and intermolecular H-bonding). It is also well known that H-bonding significantly influences glass transition (Tg) (See also next section).
5.2 Correlation of Tg of Copolymers with Equations
The dependency of the glass transition temperature on the composition of a block, graft, and random copolymer as well as of a polymer blend has been studied for many systems using the free volume theory suggested by the Fox rule [55]. Over the years, a number of empirical equations have been proposed to predict the variations in glass transition temperatures of copolymers and miscible blends as a function of composition such as those by Gordon-Taylor[56], Johnston[57], and Couchman [58–59]. These are formulated in terms of pure components and are based on thermodynamic arguments. Although these relations have been applied successfully to some copolymers and blend systems, there are still systems where the deviations are significant, particularly systems having specific interactions [60–63]. The Kwei equation [64] is most popular and is usually employed for copolymers and blend systems displaying specific interactions including H-bonding:
Where, w1 and w2 are the weight fractions of the components, Tg1 and Tg2 are the corresponding glass-transition temperatures, and k and q are fitting constants. The parameter k is associated with the specific volume of the components and the difference of the thermal expansion coefficient between the glassy and amorphous states of the components. Both free volume and thermal expansion coefficient for the glass transition behavior of polymer blends and/or copolymers are considered.
The parameter ‘q’ corresponds to the strength of specific interactions (strength of H-bonding) in the system, reflecting a balance between the breaking of self-association and the forming of the inter-association interactions (H-bonding). This equation is employed for copolymers and blend systems [62, 65–66]. Fig. 3 illustrates the dependence of Tg on the composition of the PRMH copolymers studied here. The glass transition temperature of the copolymers initially increases with increase of R-NPEMAM unit which may be because of the H-bonding interaction due to inclusion of −CONH-group into the copolymer systems. On the other hand, as the concentration of R-NPEMAM unit increases, the bulky pendant group of this unit may take the lead of steric hindrance which causes disruption of H-bonding interaction, particularly where the both R-NPEMAM units are placed sequentially. Thus Tg falls off after inclusion of 25 mole% of R-NPEMAM unit in the copolymers. Hence this composition may be considered as the optimum which maximum secondary interaction including H-bonding leads to maximum Tg values. Again if we considered the sequence distribution of R-NPEMAM units in the copolymers (Fig. 1), it is clearly observed that the diads, (N2)1 and triads, (N3)1 almost start increasing measurably at about 25 to 30 mole% of chiral unit in the copolymers. Hence this sequence distribution supports the observed results of glass transition temperatures of the copolymers and the scientific arguments stated above in this favor (See also next section).
In view of the observed results of the glass transition obtained by DSC analysis and the chemical structures of the copolymers it is believed that specific interactions must exist in these copolymers. FTIR spectroscopy is one of the most powerful tools for investigating the specific interactions specially H-bonding in polymers. Fig. 4 displays FTIR spectra of several (R-NPMEMA-Co-HEMA) copolymers containing various mole percent of R-NPEMAM and HEMA units. The peak assignments are given in Table 2.
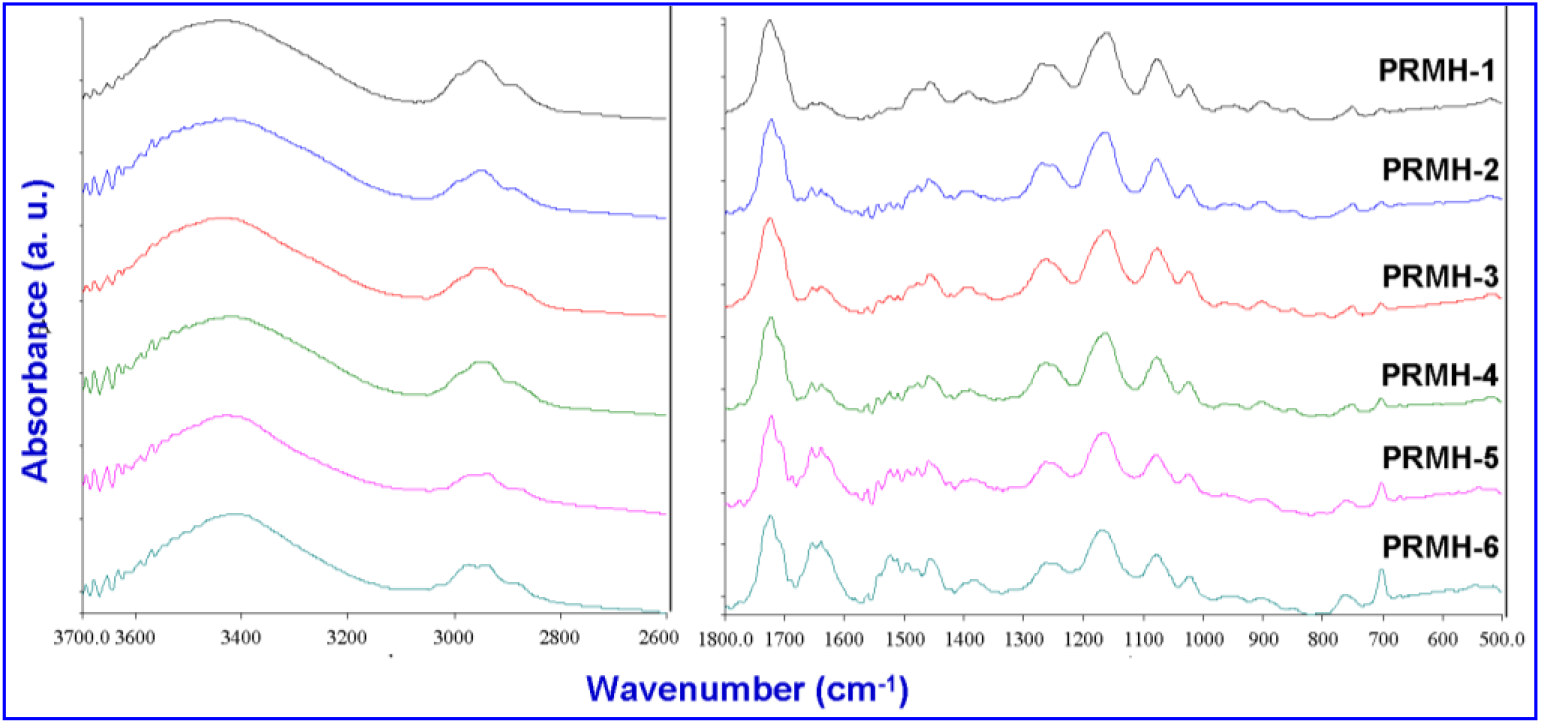
Fig. 4.: FTIR spectra of PRMH copolymers

The C=O stretching corresponds to the free carbonyl group of −COO- for the pure polyHEMA is observed at 1725 cm−1. Pure poly (R-NPEMAM) exhibits two IR bands at 1651 and 1527 cm−1 corresponding to the C=O stretching of −CONH-(amide I band) and N-H bending of CONH (amide II band), respectively[41]. The amide II band in general has intensity lower than that of the carbonyl absorption. In PRMH copolymers, the position of the main signal for the free C=O groups of HEMA unit did not change much. It may imply that C=O of HEMA units did not involve in H-bonding. On the other hand, we also observe a new peak at about 1708 cm−1. It is an indication of the involvement of C=O on the formation of H-bonding. Thus two types of C=O of HEMA units are: one free C=O (1722 cm−1) and H-bonded C=O (1708 cm−1).
The formation of H-bonding is prominently observed in consideration of amide I band. This band is split into two and is more prominent with the increase of R-NPEMAM content in the copolymers (PRMH-1 to PRMH-6). Other than the amide I band at 1654 cm−1, a new peak at 1637 cm−1 is appeared. The appearance of this peak at lower energy certainly indicates that it is H-bonded amide I band. The small valley at 1624 cm−1 which is observed for the copolymer having higher content of R-NPEMAM corresponds to amide I group of R-NPEMAM where H-bonding is occurring via self-association. Fig. 5 shows scale expanded FTIR spectra of the copolymers in the range of 1800–1500 cm−1. Inside is the scale expanded FTIR spectrum of PRMH-5 from which the splitting is observed more clearly.
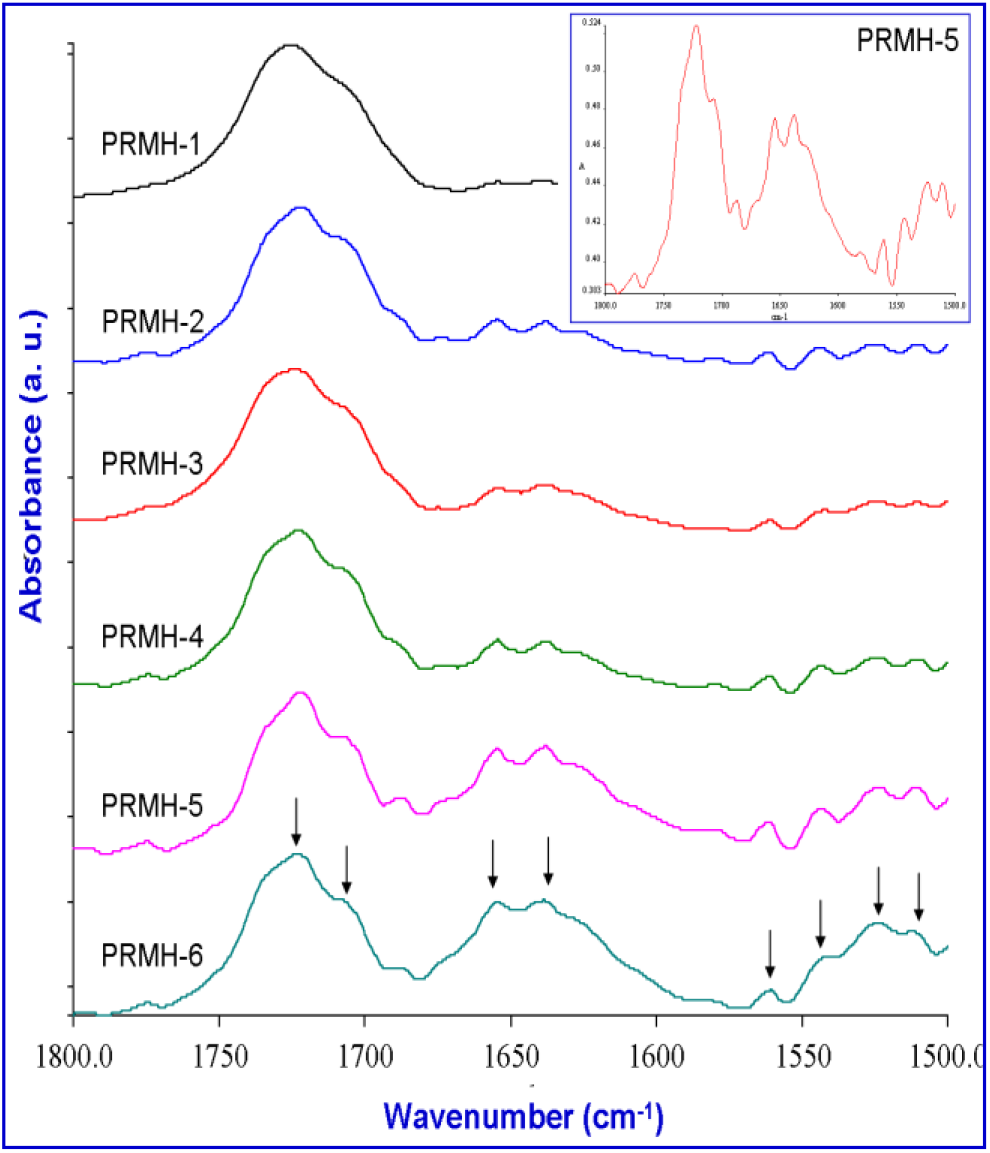
Fig. 5.: Scale expanded FTIR spectra at 1800–1500 cm−1 of (R-NPMEMA-Co-HEMA)
The area under the carbonyl stretching of HEMA unit decreases with decreasing HEMA content (from PRMH-1 to PRMH-6), which is also obvious. However, at the same time, two types of C=O of HEMA (one free C=O and another H-bonded C=O) is increasingly prominent in the same direction (i.e., with increasing R-NPEMAM content (from PRMH-1 to PRMH-6). This indicates the involvement of C=O in H-bonding inter-molecularly but not intra-molecularly (Scheme-1b).
Thus there are: (i) free C=O of HEMA units at 1722 cm−1, (ii) H-bonded C=O of HEMA units at 1708 cm−1, (iii) free amide-I group of R-NPEMAM units at 1654 cm−1, (iv) H-bonded amide-I groups at 1637 cm−1.
The involvement of hydroxyl group (OH) of HEMA on H-bonding is not conclusive because its IR band at 3414 cm−1 merges with the N-H trans stretching (3335 cm−1) of R-NPEMAM. However, the amide-II band at 1500 cm−1 can also be examined. Four splitting of this band suggests not only its involvement in H-bonding but also its involvement in H-bonding through three different types of group. The four peaks of amide-II band might be due to : (a) free N-H (amide-II band), (b) H-bonded N-H through carbonyl group of HEMA (N-H...O=C of COO), (c) H-bonded N-H through hydroxyl group of HEMA (N-H.O-H) and (d) H-bonded N-H through C=O of amide-I (N-H...O=C of CONH).
TG thermograms of chiral copolymers of various composition are shown in Fig. 6. TG and DTG thermograms, of a typical copolymer, are shown in Figs. 7 and 8. These indicate that the thermal degradation of chiral copolymers occurs in three stages. The initial degradation temperature and final degradation temperature were determined from the TG curves. From DTG curves, the maximum temperatures of weight loss were noted. The results are given in Table 3.
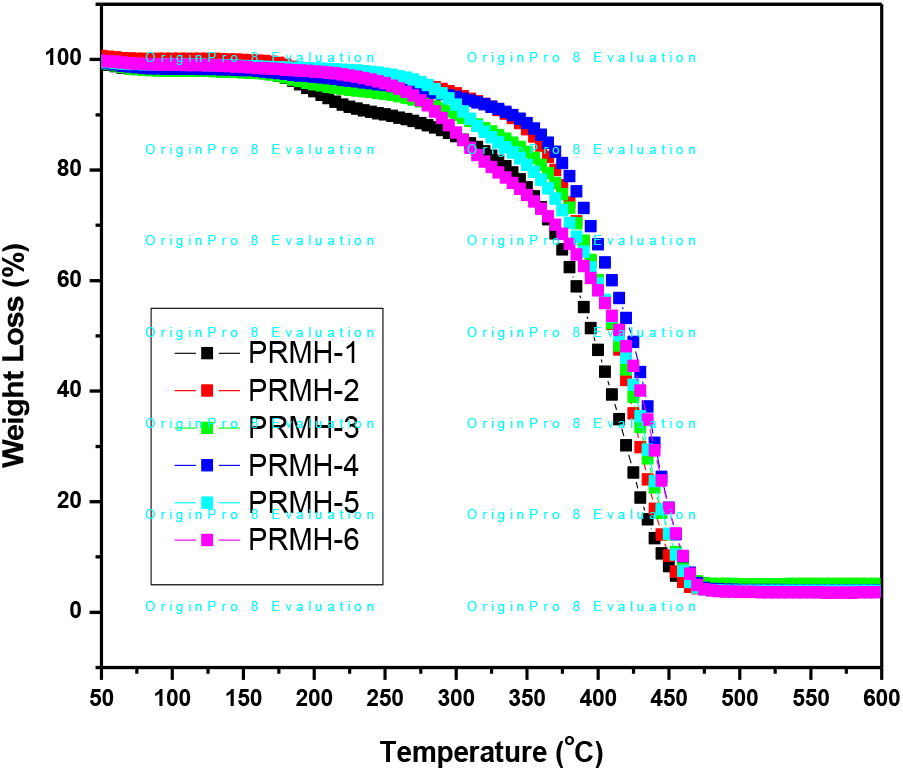
Fig. 6.: TGA thermograms of chiral copolymers
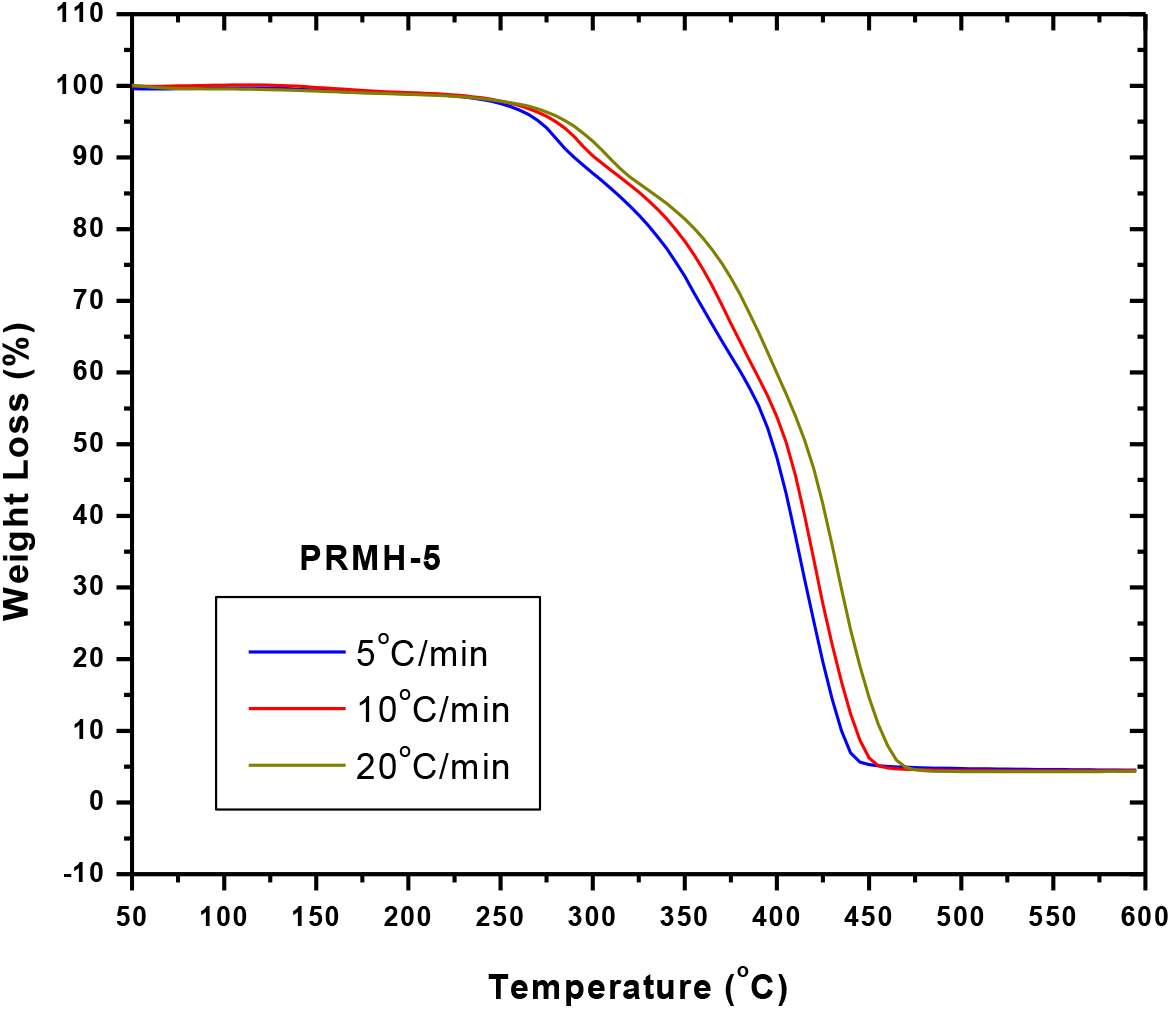
Fig. 7.: TGA thermograms of PRMH-5 obtained at different rate of heating under Ar atmosphere
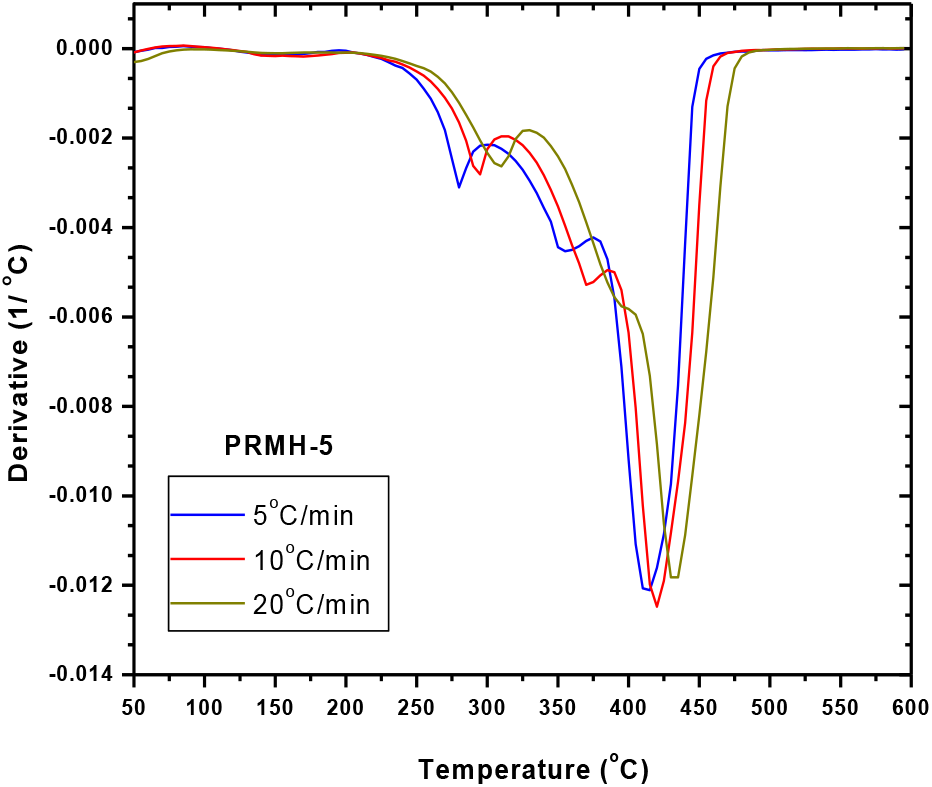
Fig. 8.: Derivative TGA thermograms of chiral copolymer: PRMH-5 at different rate of heating

We observed the two stages of degradation of homopolymer of the chiral monomer, R-NPEMAM at 295°C and 400°C (DTG peaks, heating rate of 10°C/min, Ar-atmosphere)[41]. Two stages of degradation of similar kind of polymer, polyacrylamide was also reported[67]. On the other hand, the thermal degradation of polyHEMA was reported as one reaction stage, which was reflected as single peak at 361°C in the DTG curve (heating rate of 10°C/min, N2-atmosphere)[68]. In this case of thermal degradation of chiral copolymer, degradation occurred in three stages: at 292°C, 372°C and 419°C (DTG peaks, heating rate of 10°C/min, Ar-atmosphere) (Table 3). Hence it is very much conclusive that the first and third stages of degradations are associated with the chiral comonomer (R-NPEMAM) whereas the second stage degradation indicates the degradation due to HEMA unit present in the copolymer chain.
Thermal degradation of a chiral copolymer, PRMH-5 was studied at different heating rates viz. 5, 10 and 20°C/min in order to study and understand the thermal degradation kinetics of the copolymers (Figs. 7 and 8).
5.5 Evaluation of Kinetic Parameters of Degradation
Thermal degradation of a chiral copolymer, PDMH-5 was studied at three different heating rate e.g., 5, 10, and 20°C/min in order to determine the thermal degradation kinetics of the chiral copolymers (Figs. 7 and 8). The kinetic parameters are calculated from the TG and DTG curves using the well known Flynn and Wall [69] and Kissinger [70] methods. The activation energy of a polymer degradation process is obtained from the following equations:
Flynn and Wall method:
Kissinger method:
Where, Ea is the activation energy (kcal/mole), B is the heating rate (°C/min) and T is absolute temperature (K) and R is the gas constant. Tm is the temperature at which maximum weight loss is observed as a peak maximum on the DTG curve.
Based on the Flynn and Wall method, the energy of activation is obtained from the slope of the plot of logB versus 1/T for a given value of degree of conversion (α) (where, α =WT/Wα, with WT being the weight loss at the reaction temperature, T and Wα the weight loss at the end of the process). This method requires several curves at different heating rates. However, the energy of activation is obtained from the slope of a plot of ln(B/Tm2) versus 1/Tm using the Kissinger method. It allows the calculation from one point (maximum on DTG curve) at several heating rates.
Both the plots for the degradation of the chiral copolymer (PRMH-5) are shown in Figs. 9 and 10. The activation energies for three different stages of thermal degradation of the chiral copolymer are measured to be 128.32, 105.06 and 258.95 kJ/mol respectively based on Flynn-Wall method; whereas the values are 186.90, 267.65 and 178.99 kJ/mol respectively using Kissinger method (Table 4).
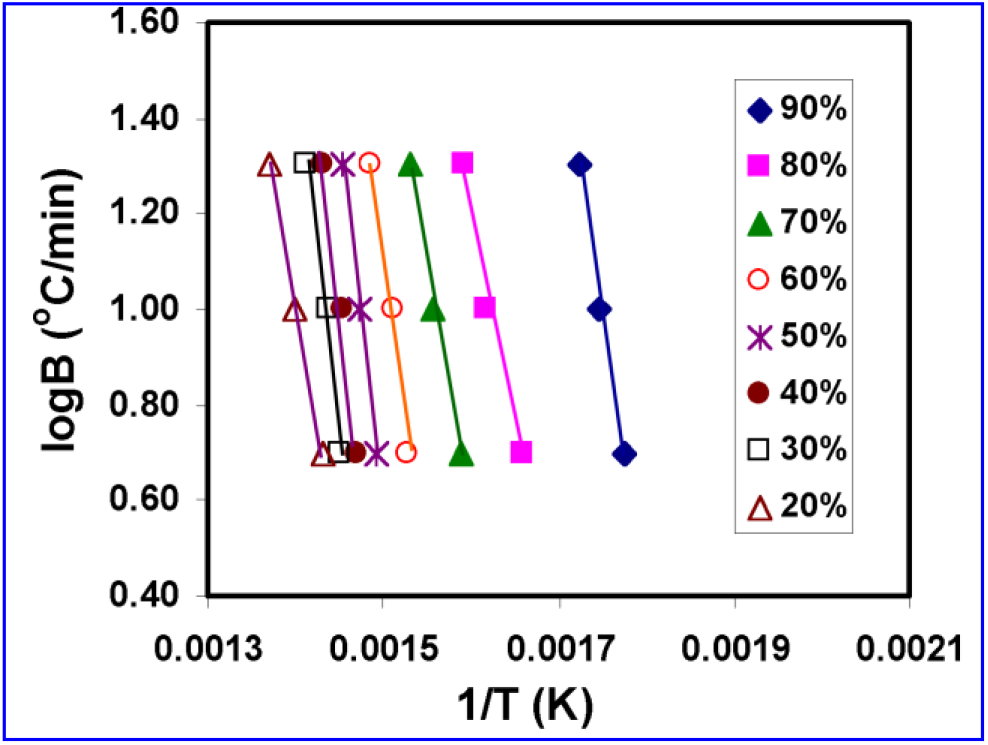
Fig. 9.: LogB vs reciprocal of absolute temperature for Flynn-Wall’s thod
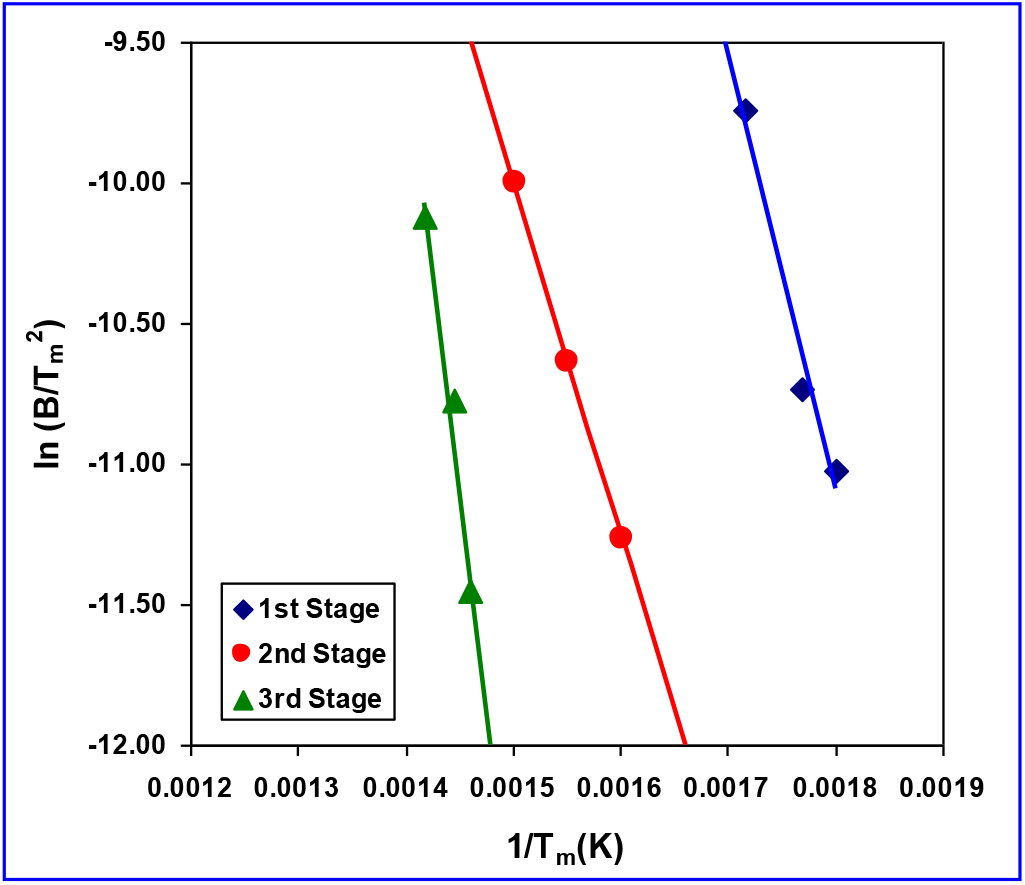
Fig. 10.: Arrhenenius type plots for determination of kinetic parameter based on Kissinger’s method

We observed the variation of glass transition (Tg) temperatures along with the compositions of the chiral copolymers of (R)-N-(l-phenyl-ethyl) methacrylamide (R-NPEMAM) and 2-hydroxy ethyl methacrylate (HEMA). The glass transition temperature attains an optimum value at around 25 mole % of chiral content. Using FTIR spectroscopy we investigated the hydrogen bonding interactions among the copolymer chains, which are found to be intermolecular, not intramolecular. The copolymers thermally degrade in three stages. The first and third stages of degradation are associated with the chiral comonomer whereas the second stage indicates the degradation due to HEMA unit present in the copolymer chain. The activation energies for three different stages of thermal degradation of the chiral copolymer based on Flynn-Wall method are found to be 128.32, 105.06 and 258.95 kJ/mol respectively; whereas the values are 186.90, 267.65 and 178.99 kJ/mol respectively using Kissinger method.
Acknowledgement: The authors sincerely acknowledge Dr. Mayank Dwivedi, Director of establishment for necessary support to carry out the research work. They are also thankful to Ms. Preeti for thermal analysis of the copolymer samples.
References
1. Itsuno, S. (2005). Prog Polym Sci, 30: 540. [Google Scholar]
2. Yashima, E., Maeda, K. (2008). Macromolecules, 41: 3. [Google Scholar]
3. Okoshi, K., Kajilani, T., Nagai, K., Yashima, E. (2008). Macromolecules, 41: 258. [Google Scholar]
4. Liu, J.-H., Chiu, Y.-H., Chiu, T.-H. (2009). Macromolecules, 42: 3715. [Google Scholar]
5. Jia, H., Teraguchi, M., Aoki, T., Abe, Y., Kaneko, T., Hadano S., Namikoshi, T., Marwanta E. (2009). Macromolecules, 42: 17. [Google Scholar]
6. Bag, D. S., Dutta, D., Shami, T. C., Rao, K. U. B. (2009). J. Polym. Sci. Polym. Chem., 47: 2228. [Google Scholar]
7. Maeda, K., Goto, H., Yashima, E. (2001). Macromolecules, 34: 1160. [Google Scholar]
8. Nagai, K., Katsuhiro, M., Takaeyama, Y., Sakajiri, K., Yashima, E. (2005). Macromolecules, 38: 5444. [Google Scholar]
9. Lai, L. M., Lam, J. W. Y., Cheuk, K. K. L., Sung, H. H. Y., Williams, I. D., Tang B. Z. (2005). J Polym Sci Polym Chem, 43: 3706. [Google Scholar]
10. Cheuk, K. K. L., Lam, J. W. Y., Lai, B. S., Xie, Y., Tang, B. Z. (2007). Macromolecules, 40: 2633. [Google Scholar]
11. Gao, G., Sanda, F., Masuda, T. (2003). Macromolecules, 36: 3932. [Google Scholar]
12. F. Sanda, K. Terada, T. Masuda (2003). Macromolecules, 36: 8149. [Google Scholar]
13. Neenan, T., Marcolongo, M., Valentini, R. F.editors (1999). Biomedical materials-Drug delivery, implants and tissue engineering. MRS: Warrendale, PA. [Google Scholar]
14. Cheuk, K. K. L., Li, B., Lam, J. W. Y., Chen, J., Bai, C., Tang B Z. (2003). In: Gao, H., Fuchs, H., Chen, D. (editorsAdvanced nanomaterials and nanodevices, pp. 87–107, Philadelphia, PA: Institute of Physics Publishing Ltd. [Google Scholar]
15. Angiolini, L., Benelli, T., Giorgini, L., Salateli¡, E., Bozio, R., Dauru A, Pedron D. (2005). Eur Polym. J., 41: 2045. [Google Scholar]
16. Angiolini, L., Benelli, T., Giorgini, L., Bozio, R., Dauru, A., Pedron D. (2003). Synt Metals, 139: 743. [Google Scholar]
17. Rodlert, M., Vestberg, R., Malmstorm, E., Persson, M., Lindgren, M. (2002). Synth. Metals,127: 37. [Google Scholar]
18. M. V. Kozlovsky (2002). Synth Metals, 127: 67. [Google Scholar]
19. Kauranen, M., Verbiest, T., Elshocht, SV., Persoons, A. (1998). Optical Mat., 9: 286. [Google Scholar]
20. M. Kauranen, T. Verbiest, J. J. Maki, A. Persoons (1996). Synth Metals, 81: 117. [Google Scholar]
21. A. P. Davis (1999). Nature, 401: 120. [Google Scholar]
22. B. L. Feringa, RA. Delden, N. Koumura, E. Geertsema (2000). Chem Rev, 100: 1789. [Google Scholar]
23. R. A. Delden, M. K. J. Wiel, B. L. Feringa (2004). Chem Commun, 200. [Google Scholar]
24. S. Y. Kim, M. Fujiki, A. Ohira, G. Kwak, Y. Kawakami. Macromolecules, 37: 4321. [Google Scholar]
25. Z. L. Liu, G. C. Sun, Q. L. Huang, K. L. Yao (1999). Meas Sci Techno, 10: 374. [Google Scholar]
26. J. H. Liu, P. C. Yang (2004). J Appi Polym Sci, 91: 3693. [Google Scholar]
27. M. V. Kozlovsky (2002). Synth Metals, 127: 67. [Google Scholar]
28. Y. Okamoto, T. Nakano (1994). Chem Rev, 94: 349. [Google Scholar]
29. Reggelin, M., Doerr, S., Klussmann, M., Schultz, M., Holbach, M. (2001). Proc Natl Acad Sci, 101: 5461. [Google Scholar]
30. L. Pu (1999). Chem. Eur. J., 5: 2227. [Google Scholar]
31. W. R. Rousch, J. M. Hawkins, R. H. Grubbs (1988). Chemtract: Org Chem, 1: 21. [Google Scholar]
32. L. Pu (1998) Tet Assymm, 9: 1457. [Google Scholar]
33. Sivaguru, J., Poon, T., Franz, R., Jockusch, S., Adam, W., Turro N. J. (2004). J Am Chem Soc, 126: 10816. [Google Scholar]
34. Okamoto, Y., Hatada, K. (1988). In: Zief, M., Crane, L. J. (editorsChromatographic chiral separations, p. 199, New York: Mercel Dekker. [Google Scholar]
35. Lee, S. B., Mitchell, D. T., Trofin, L., Nevanen, T. K., Soderlind, H., Martin C R. (2002). Science, 296: 2198. [Google Scholar]
36. Lee, H. S., Hong, J. J. (2000). Chromatogr, A868: 189. [Google Scholar]
37. Palmer, C. P., McCarney, J. P. (2004). J Chromatogr A, 104: 159. [Google Scholar]
38. Wu, J., Nakano, T., Okamoto, Y. (1999). J Polym Sci Polym Chem, 37: 2645. [Google Scholar]
39. Nakano, T., Mori, M., Okamoto, Y. (1993). Macromolecules, 26: 867. [Google Scholar]
40. Okamoto, Y., Nishikawa, M., Nakano, T., Yashima, E., Hatada, K. (1995). Macromolecules, 28: 5135. [Google Scholar]
41. Bag, D. S., Shami, T. C., Rao, K. U. B. (2008). J Polym Mater, 25: 51. [Google Scholar]
42. Bag, D. S., Shami, T. C., Rao, K. U. B. (2008). Chirality-2008: 20b International Symposium on Chirality, 6-9 July, Geneva, Switzerland. [Google Scholar]
43. Bag, D. S. and Rao, K. U. B. (2010). Polymer International, 59: 501. [Google Scholar]
44. A. Srivastava, P. Mandal and R. Kumar (2016). Int J Biol Macromol, 87: 357. [Google Scholar]
45. B. J. McGrattan (1994). Applied. Spectroscopy., 48: 1472. [Google Scholar]
46. Guan, X., Ma, X., Zhou, H., Chen, F., Li, Z. (1915). J. Thermoplastic Composite Materials, 30: 691. [Google Scholar]
47. V. Gianotti, D. Antonioli, K. Sparnacci, M. Laus, T. J. Giammaria, F. F. Lupi, G. Seguini and M. Perego (2013). Macromolecules, 46: 8224–8234. [Google Scholar]
48. N. Colak, A. Yagan, Z. Tez (2003). Polymer-Plastics Technology and Engineering, 42: 389. [Google Scholar]
49. S. Pisharath and H.-G. Ang (2007). Polymer Degradation and Stability, 92: 1365. [Google Scholar]
50. A. Kurt (2009). J. Appl. Polym. Sci., 114: 624. [Google Scholar]
51. Terrell, D. A. (1989). In: Allen, G. and Bevington, J. C. (EditorsComprehensives polymer science, vol. 3. Ch.15. Oxford: Pergamon Press. [Google Scholar]
52. H. J. Harwood, W. M. J. Ritchey (1964). J. Polym Sci. Polym. Phys., 2: 601. [Google Scholar]
53. L. A. Utracki (1989). Polymer Alloy and Blends. Munich, Germany: Hanser Publisher. [Google Scholar]
54. T. Caykara, C. Ozyurek, O. Kantoglu and B. Erdogan (2003). Polym. Degrad. Stab., 80: 339. [Google Scholar]
55. T. G. Fox (1956). J. Appl. Bull. Am. Phys. Soc., 1: 123. [Google Scholar]
56. M. Gordon and J. S. Taylor (1952). J. Appl. Chem., 2: 493. [Google Scholar]
57. N. W. Johnston (1976). J. Macromol. Sci. Macromol. Chem., C14: 215. [Google Scholar]
58. P. Couchman and F. E. Karasz (1978). Macromolecules, 11: 1156. [Google Scholar]
59. P. R. Couchman (1991). Macromolecules, 24: 5772. [Google Scholar]
60. S. W. Kuo and F. C. Chang (2001). Macromolecules, 34: 5224. [Google Scholar]
61. T. P. Yang, E. M. Pearce and T. K. Kwei (1989). Macromolecules, 22: 1813. [Google Scholar]
62. S. W. Kuo, H. C. Kao and F. C. Chang (2003). Polymer, 44: 6873. [Google Scholar]
63. L. F. Wang, E. M. Pearce and T. K. Kwei (1991). J. Polym. Sci. Polym. Phys. Ed., 29: 619. [Google Scholar]
64. T. K. Kwei (1984). J. Polym. Sci. Polym. Lett. Ed., 22: 307. [Google Scholar]
65. P. C. Painter, J. F. Grafomd and M. M. Coleman (1991). Macromolecules, 24: 5630. [Google Scholar]
66. S. W. Kuo and H. T. Tsai (1991, Macromolecules, 24: 5630. [Google Scholar]
67. M.-H. Yang (1998). Polym. Test., 17: 191. [Google Scholar]
68. T. Caykara, C. Ozyurek, O. Kantouglu and B. Erdogan (2003). Poly. Degrad. Stab., 80: 339. [Google Scholar]
69. J. H. Flynn and L. A. Wall (1966). J. Polym. Sci. B, 4: 323. [Google Scholar]
70. H. E. Kissinger (1957). Anal. Chem, 29: 1702. [Google Scholar]
Cite This Article
 Copyright © 2023 The Author(s). Published by Tech Science Press.
This work is licensed under a Creative Commons Attribution 4.0 International License , which permits unrestricted use, distribution, and reproduction in any medium, provided the original work is properly cited.


 Submit a Paper
 Propose a Special lssue
 View Full Text
 Download PDF
 Downloads
 Citation Tools