 Open Access
ARTICLE
Enhancing the Performance of Polylactic Acid (PLA) Reinforcing with Sawdust, Rice Husk, and Bagasse Particles
1
Department of Mechanical Engineering, Saveetha Engineering College (Autonomous),
Saveetha Nagar, Thandalam, Chennai-602105, India.
2
Department of Mechanical Engineering, Sri Sivasubramaniya Nadar College of Engineering,
OMR, Kalavakkam, Chennai - 603110, India.
3
Department of Computer Science and Engineering, St. Joseph’s College of Engineering,
OMR, Chennai -600119, India.
* Corresponding Author: e-mail:
Journal of Polymer Materials 2022, 39(3-4), 269-281. https://doi.org/10.32381/JPM.2022.39.3-4.7
Abstract
Polylactic acid (PLA) is the most popular thermoplastic biopolymer providing a stiffness and strength alternative to fossil-based plastics. It is also the most promising biodegradable polymer on the market right now, thus gaining a substitute for conservative artificial polymers. Therefore, the current research focuses on synthesizing and mechanical characterization of particlereinforced PLA composites. The hot compression molding technique was used to fabricate PLA-based composites with 0, 2.5, 5, and 7.5 weight % of sawdust, rice husk, and bagasse particle reinforcements to enhance the performance of the PLA. The pellets of PLA matrix were taken with an average size of 3 mm and particle reinforcements of an average size of 50 m were used as the raw materials. After processing the PLA composites, microstructural and mechanical characterization studies were carried out to check the uniform distribution of the reinforced particles on the PLA matrix and the improvement in their strength, respectively. The results found hardness varied from 29.7 to 36.1 Shore D, tensile strength from 46.2 to 62.5 MPa, impact strength from 14.5 to 17.4 kJ/m2 and flexural strength from 78.9 to 93 MPa from all processed composites. In addition, SEM images were taken to perform a microstructural evaluation of the PMCs.Also, from characterization studies, it was found that the PLA with 5 wt.% reinforcements showed better properties than 2.5 and 7.5% reinforcements. On the other hand, particle clustering was observed on the composites with a reinforcement of 7.5%, and hence it showed lesser performance. Moreover, PLA with 5% rice husk particle reinforcement showed superior performances compared with other reinforcements.
Keywords
Polymer composites have better mechanical characteristics like Tensile, Impact, Flexural, Hardness, Stiffness, and Toughness than traditional materials. Conversely, polymer composite of different combinations may seriously affect the environment and create other issues. Therefore, natural resources, such as particles or fillers, are employed in polymer matrix composites to resolve these constraints. Polylactic acid (PLA) is one of the most abundant biopolymers currently on the market, suited for product commercialization. As a result, scientists have looked at the feasibility of using natural fiber-reinforced PLA green composite as a substitute for non-renewable petroleum-based resources [1]. The type of fiber in fiber/matrix adhesion is critical since it determines the mechanical characteristics of biocomposites[2].
PLA is a green, biodegradable thermoplastic made from renewable resources like maize starch, wheat, or rice[3]. Due to the introduction of innovative materials and production techniques such as high cellulose content, low cost, biodegradability, and accessibility of supply, natural fibres, particularly jute fibers, have gained popularity in recent decades. Experimenting with innovative manufacturing procedures and materials while examining their mechanical behaviour under harsh conditions has recently become more popular.
Biodegradable composites are in high demand in today's market since they are both environmentally being and simple to construct. Fillers are routinely used to reduce the cost of polymers. Finely crushed inorganic elements like chalk, silica, and clay are commonly used as fillers. The presence of fill has been modified due to the material's mechanical qualities. In addition, fillers can improve other qualities of composite laminates, such as fire and smoke resistance, by lowering the organic content. Complete resins are also employed with composites to strengthen the dimensional control of molded products.
Narlıoğlu et al.[4] stated the research concerning the 3D printed PLA composites supplemented with pine sawdust was examined for thermal, morphological, and mechanical characteristics. Test samples were created using a 3D printer according to mechanical test standards to assess the mechanical characteristics of the acquired filaments. The filaments made from mixes containing the largest percentage of wood sawdust (20%) could be printed in a 3D printer without any difficulties. However, according to the mechanical test findings, adding wood sawdust to the clean PLA polymer resulted in a drop in the tensile strength values of the composites. Also, applying wood sawdust to the clean PLA polymer affected the composites' tensile strength.
On the other hand, the flexural strength of wood sawdust/PLA composites was gradually improved. As a result, waste pine sawdust was found to be a suitable reinforcing material for creating composite filament for 3D printing applications and for being compatible with PLA polymer extrusion. As a result, sawdust may be used as a high-quality 3D polymeric material production waste source.
Consequently, researchers continuously produce natural particle-reinforced polymer matrix composites because natural fillers are readily available, such as sawdust, rice husk, bagasse, etc., are used as reinforcement in polymer composites, and they are also used biodegradable. Then, compression moulding, hand layup, extrusion processes, etc., are used to create a polymer composite. After that, the specimens are expurgated following ASTM guidelines for mechanical tests like hardness, tensile, impact, and flexural strength [5].
Praveen Kumara et al. [6] found that natural fibers have many benefits, including accessibility, biodegradability, low cost, reduced density, fewer health concerns, and environmentally friendly nature. Polymer composites are a new sustainable material with better mechanical properties for real-world applications. Researchers observed that using filler elements while reducing organic content in composite laminates improved composite performance. The influence of natural fillers on fiber-reinforced polymer matrix composites was discussed.
Kumar et al.[7] investigated the rice husk particles loaded with Polylactic acid composites with weight percentages of 90/10, 80/20, 80/30, and 70/30 were used in three-body abrasive wear experiments following ASTM G65 dry Silica sand particles as a third body at 300m for weights of 9.81, 29.46, and 49.65 N using a Rubber Wheel Abrasion Tester (RWAT) with 106microns. According to the experiment results, weight loss rises as applied stress increases, and wear resistance improves as fiber content increases in PLA composites. Wear resistance is highest in the composite with 30% rice husk fiber. The damaged surfaces were studied using a Scanning Electron Microscope (SEM).
Wu et al. [8] examined two or more printing filaments that were developed employing biodegradable Poly (lactic acid) (PLA) and lengthy rice husk composites (RH). The characteristics of PLA/RH biocomposites were strengthened using PLA grafted with acrylic acid (PLA-g-AA) and rice husk treated with a coupling agent (TRH). Biocomposite materials were analyzed in form, mechanical characteristics, water absorption, and biodegradability.
Yoganandam et al.[9] conferred the thermal properties of Calotropis procera (CP) particles with PLA. The composites were created using a two-step injection molding procedure, with the CP particle weights varied to 0, 5, 1, 15, and 20 accordingly. The melt flow index, heat deflection temperature, Vicat softening point, and other parameters were determined via dynamic mechanical testing. By reducing polymer mobility, the inclusion of CP particles increased the composite's thermal stability.
Bartos et al. [10] determined that injection molding was used to make PLA/sugarcane bagasse fiber composites from two fractions of fibers with distinct fiber properties. Compared to clean PLA, increasing the filler quantity resulted in a drop in tensile strength at 20 % loading filler. However, Young's modulus was raised by up to 13%. Anggono et al. [11] investigated the green composites created by combining PLA with sugarcane bagasse and RH to improve the performance of the PLA matrix. Sugarcane bagasse has a standard weight % ratio of 25%, whereas rice husk/PLA ratios vary between 0/75, 5/70, and 10/65, respectively. According to the findings, alkali-treated bagasse fibres produced higher flexural strength in PLA composites than steam-treated rice husk fibres.
Biocomposites or polymer composites materials generated from natural fibers and resin have improved due to growing interest in the long-term sustainability of material resources. According to the natural fibers described, sugarcane extracts are crushed to obtain their juice. A sugar plant produces roughly 30% bagasse throughout the whole crushing process. In several research projects, Bagasse has been investigated as a sustainable feedstock for power generation and the manufacturing of bio-based products.
From the literature, several investigations on PMCs' mechanical characteristics with various reinforcements have been carried out. However, there are few studies present on PMCs with particle reinforcements. As a result, the current study focuses on the synthesis and characterization of polymer-based composites utilizing PLA as the matrix and sawdust, rice husk, and bagasse as particle reinforcements (0, 2.5, 5, 7.5 wt. %).
2.1 Preparation of PLA Composites
Polylactic acid (PLA) pellets with an average size of 3 mm and three different fillers in the form of powders with an average size of 50 μm were used as raw materials to manufacture biodegradable polymer matrix composites. Sawdust, rice husk, and bagasse powders were used as reinforcing materials in proportions of 0, 2.5, 5, and 7.5 weight %. Bagasse, sawdust, rice husk, and PLA have densities of 0.12, 0.21, 1.8, and 1.24 g/cm3, respectively. Figures 1(a-e) show the photographic views of the PLA pellets and selected three particle reinforcements.
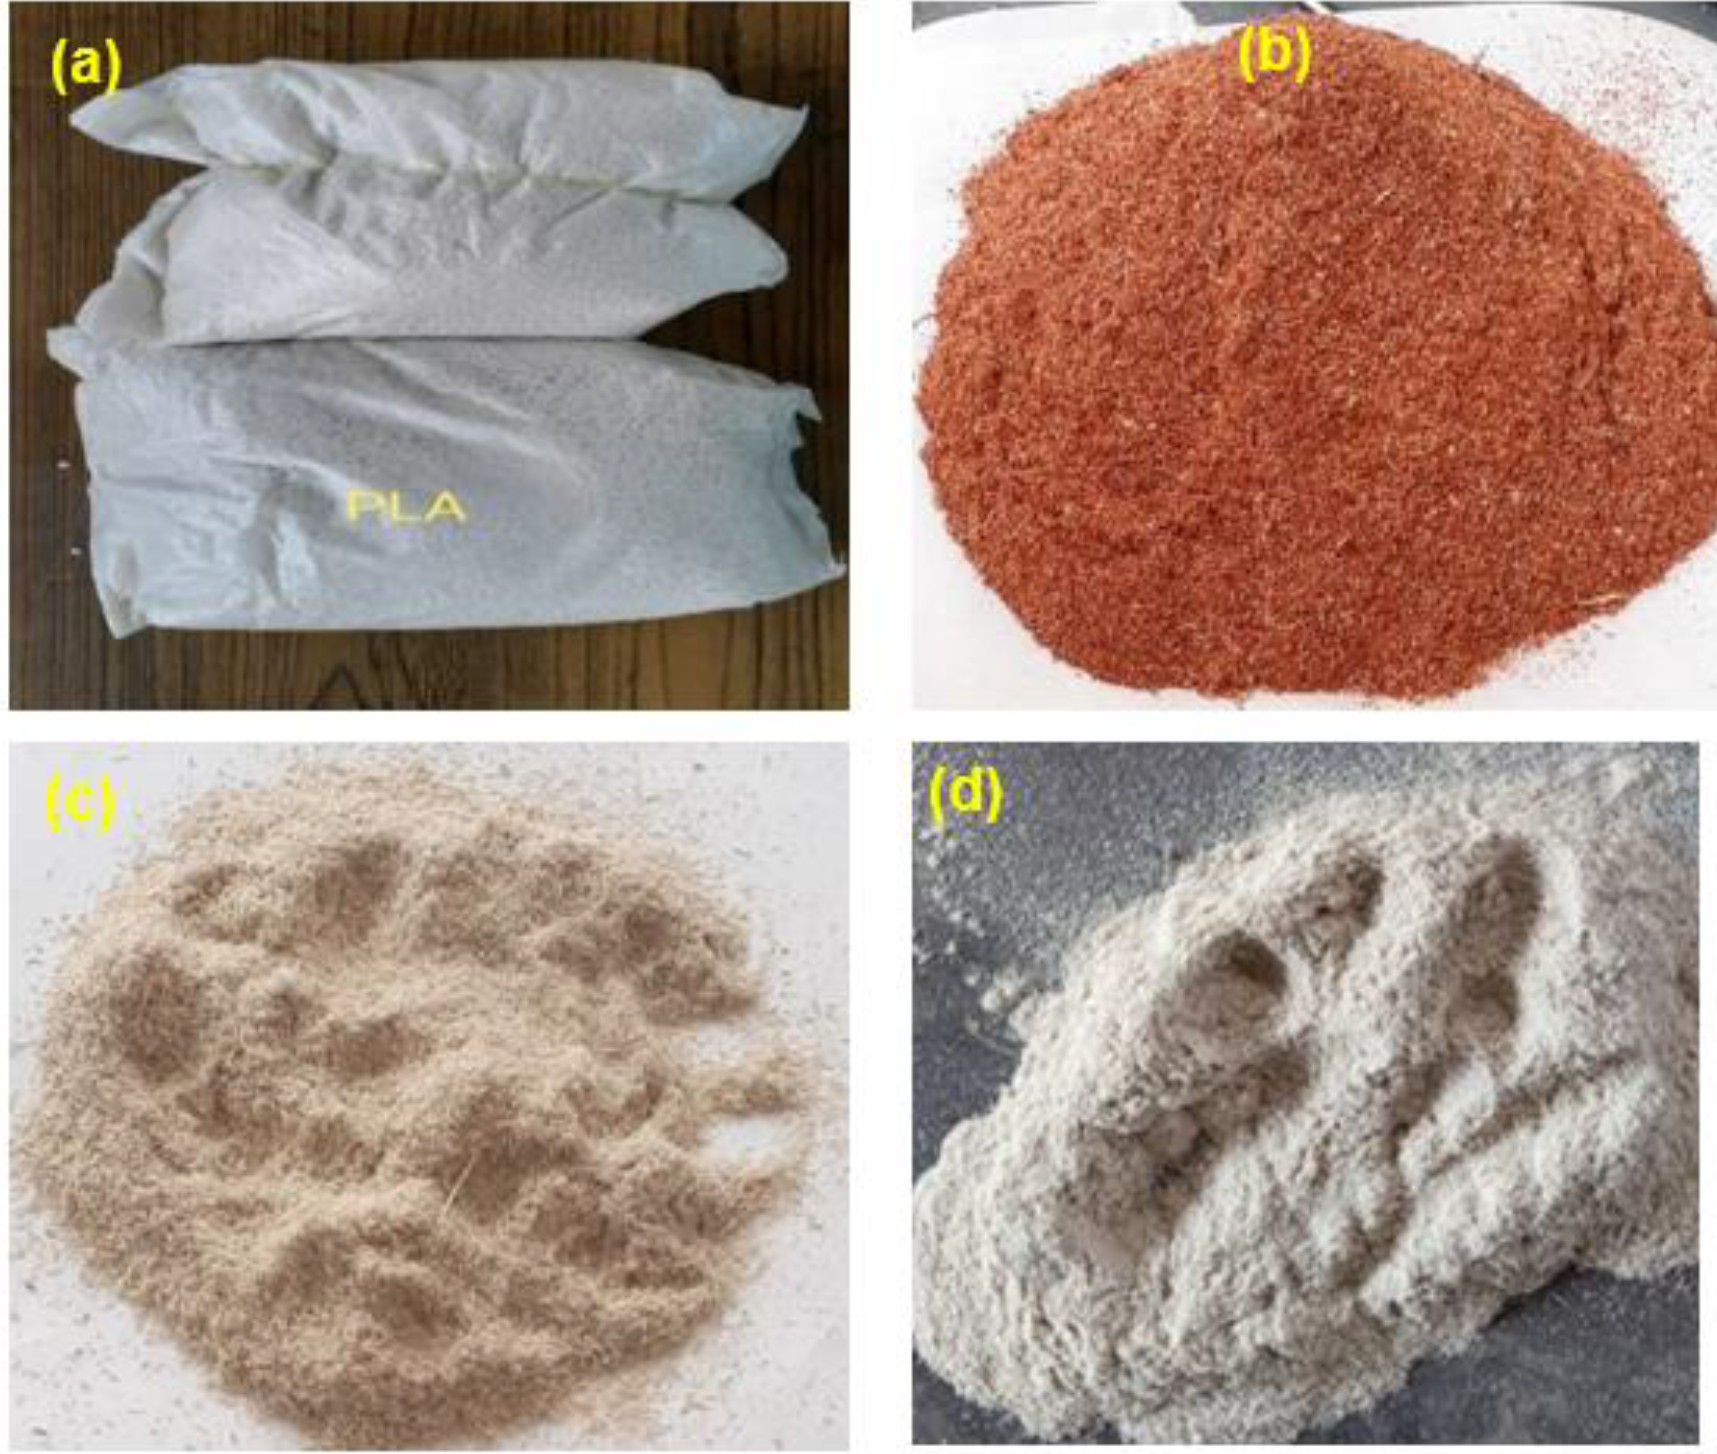
Figure 1. a) PLA pellets, b) Sawdust, c) Rice husk, d) Bagasse
The PLA pellets were hot-pressed in a compression molding machine. The study was conducted at the Department of Polymer Engineering, B.S. Abdur Rahman Crescent Institute of Science and Technology, Chennai, India.
The pellets were heated in the machine until they reached 160°C, and the reinforcement powders were uniformly sprinkled throughout the semisolid PLA matrix's whole surface. To achieve maximum densification and homogenous mixing of the reinforcement powders, the composites were pressed for 5 minutes at 1.5 bar in a hydraulic compression molding machine. The temperature, pressure, and timing values were taken from the literature [10-12] and a few trials were conducted to process the PMCs.
The above technique was used to manufacture PLA with Sawdust (SD), Rice husk (RH), and Bagasse (BAG) composites. Figure 2(a) shows the processed PLA, PLA+SD, PLA+RH, and PLA+BAG composites and Figure 2(b) shows the thickness of the composite at 4mm.

Figure 2. (i) Composites of size 150 x 150 x 4 mm, (a) PLA + SD, (b) PLA + BAG, (c) PLA, (d) PLA + RH (ii) Composite indicates the thickness of 4 mm
This study focused on the effect of reinforcement's particles wt% addition on the PLA matrix to improve the mechanical properties. As a result, the wt % of reinforcements varied from 0 to 7.5%, with an interval of 2.5%. Finally, 10 different PLA-based composites were processed.
To study the changes in properties of PLA with addition of particle reinforcements, materials testing samples were cut using Computer Numerical Control (CNC) Abrasive Water Jet Machining (AWJM) from the composites according to ASTM standards for Microstructure Analysis, Hardness (E407), Tensile (D638), Flexural (D790), Impact (D256), and Soil Burial tests (D6400). In addition, Scanning Electron Microscopy (SEM) was used to analyze the materials' morphological properties. These experiments focus on developing biodegradable polymer composites for general-purpose engineering applications that may efficiently replace conventional polymeric and metal components.
2.3 Preparation of Testing Samples using CNC AWJM
Abrasive Water Jet Machining (AWJM) was used to cut standard testing samples as per different ASTM standards since it does not deform or modify the material structure at the place of the cut for both metal matrix and polymer matrix composites owing to high heat. In the case of another machining, the material is melted, burnt, or evaporated away, like in laser machining. In certain materials, intense heat alters the structure of the metal at spots of the cutting. In most metals, it also restricts the thickness of a cut. Therefore, the CNC software combined with AWJM can cut thicker sheets while maintaining the material's composition.
2.4 Mechanical Characterization of PLA Composites
To ensure the presence and uniform distribution of selected reinforcements on the PLA matrix, samples were cut from the ten processed composites used in this study with a size of 10 x 30 x 4 mm. The SEM was used to capture the microstructure images of all samples with 500 X which are shown in Figure 3.
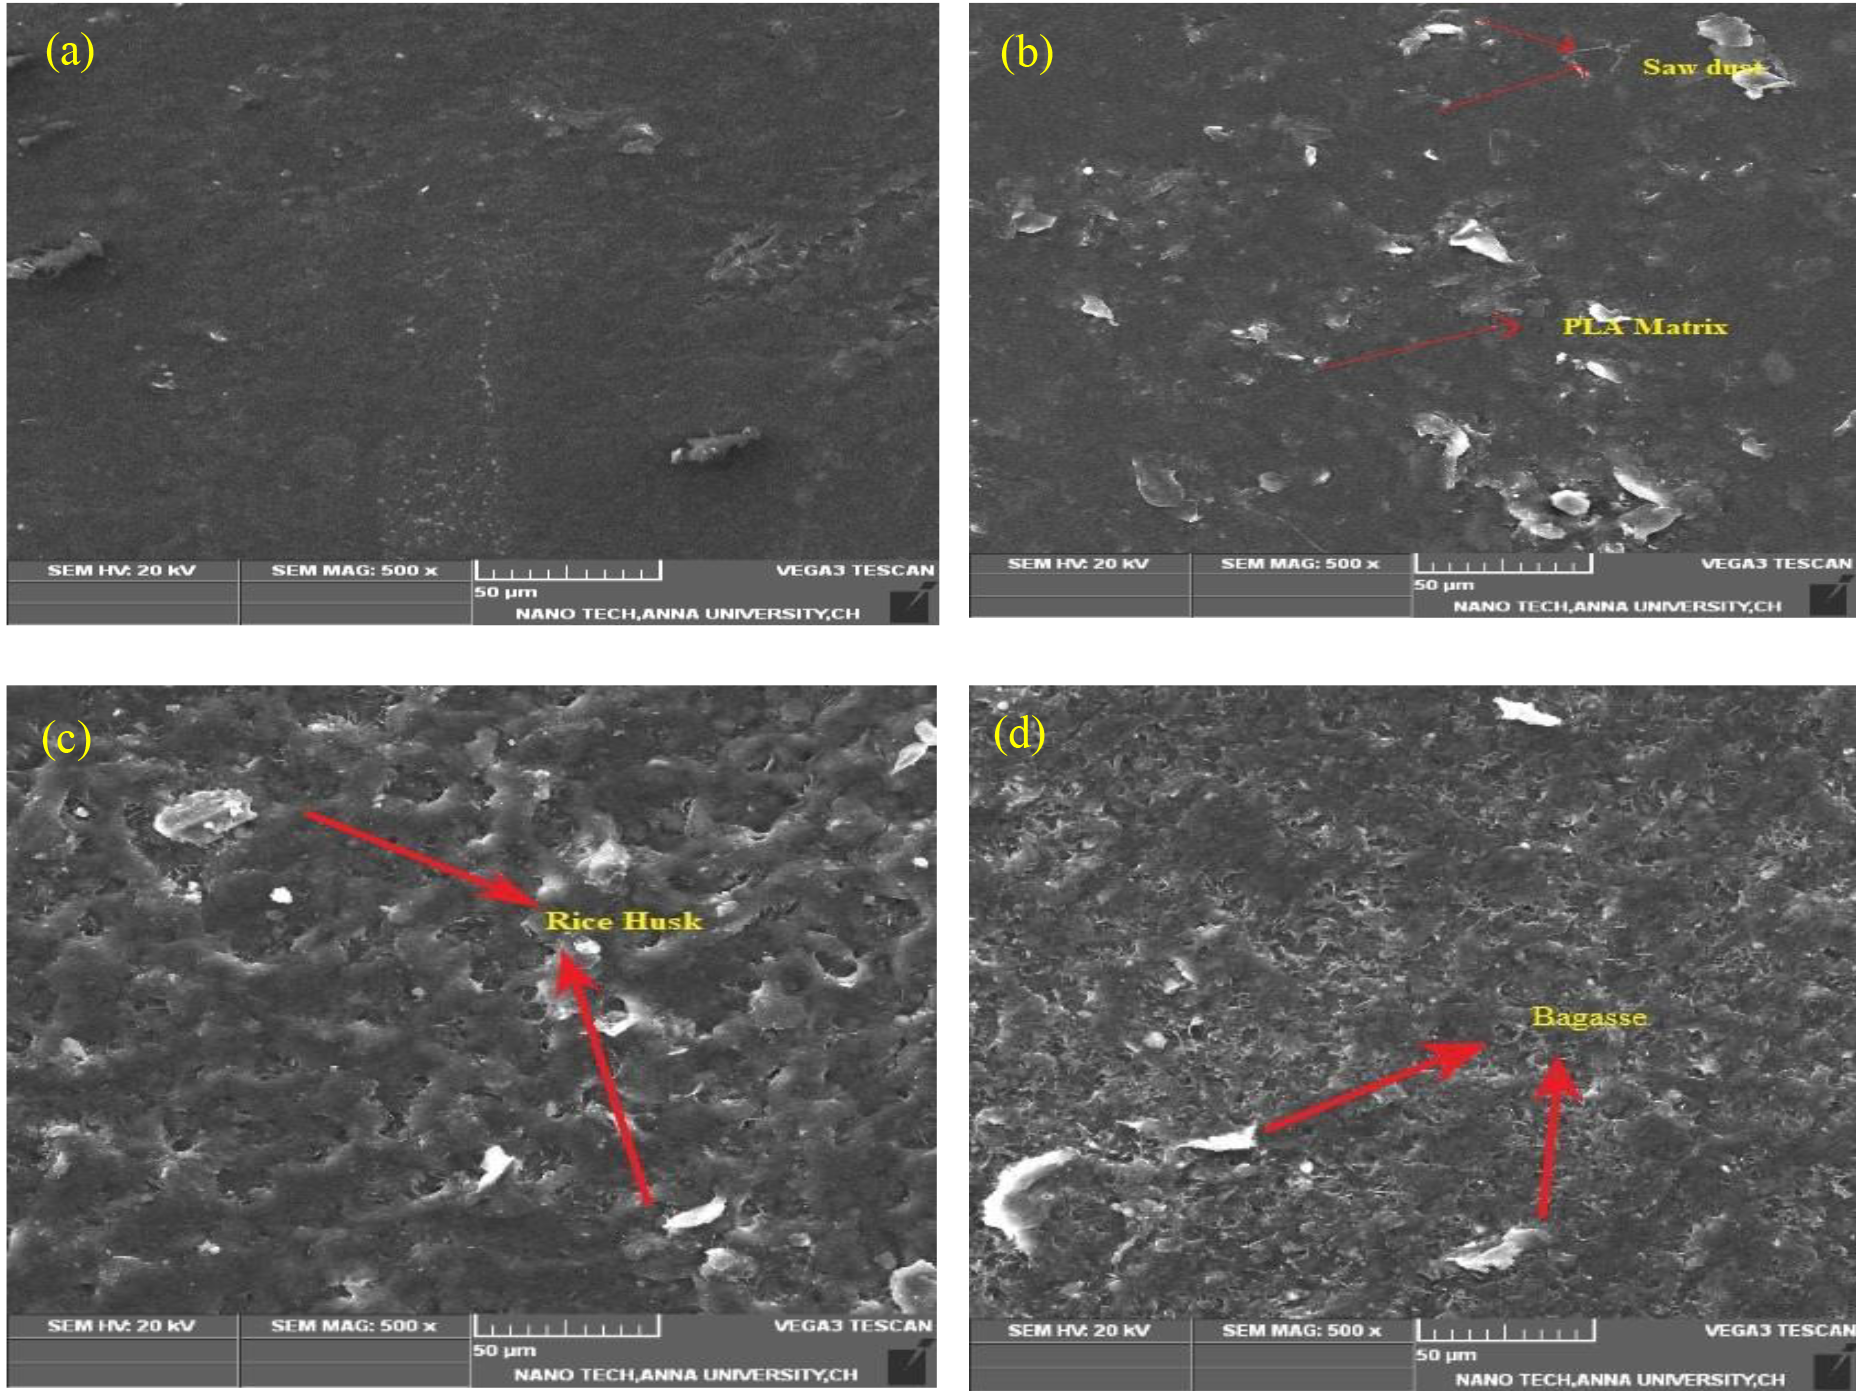
Figure 3. a) PLA, b) PLA + SD, c) PLA + RH and d) PLA + BAG
Figure 3 (a-d) shows the microstructure images of PLA and PLA + 2.5% composites. The first image shows only the PLA and white spots as a distribution of the reinforcements in the matrix of three composites shown in Figures 3(b to d). Also, the reinforcement particle shapes are varying from spherical to filament with random orientation and distribution.
Figure 4 shows the microstructure images PLA + 5% composites. The white spot appearances are 5% reinforcements in the matrix of three composites shown in Figures 6 (a to c). From the image, it was found that all three reinforcement particles are distributed well with the spherical shape which caused the strong bond between PLA and reinforcements that resist the deformation during different loading.
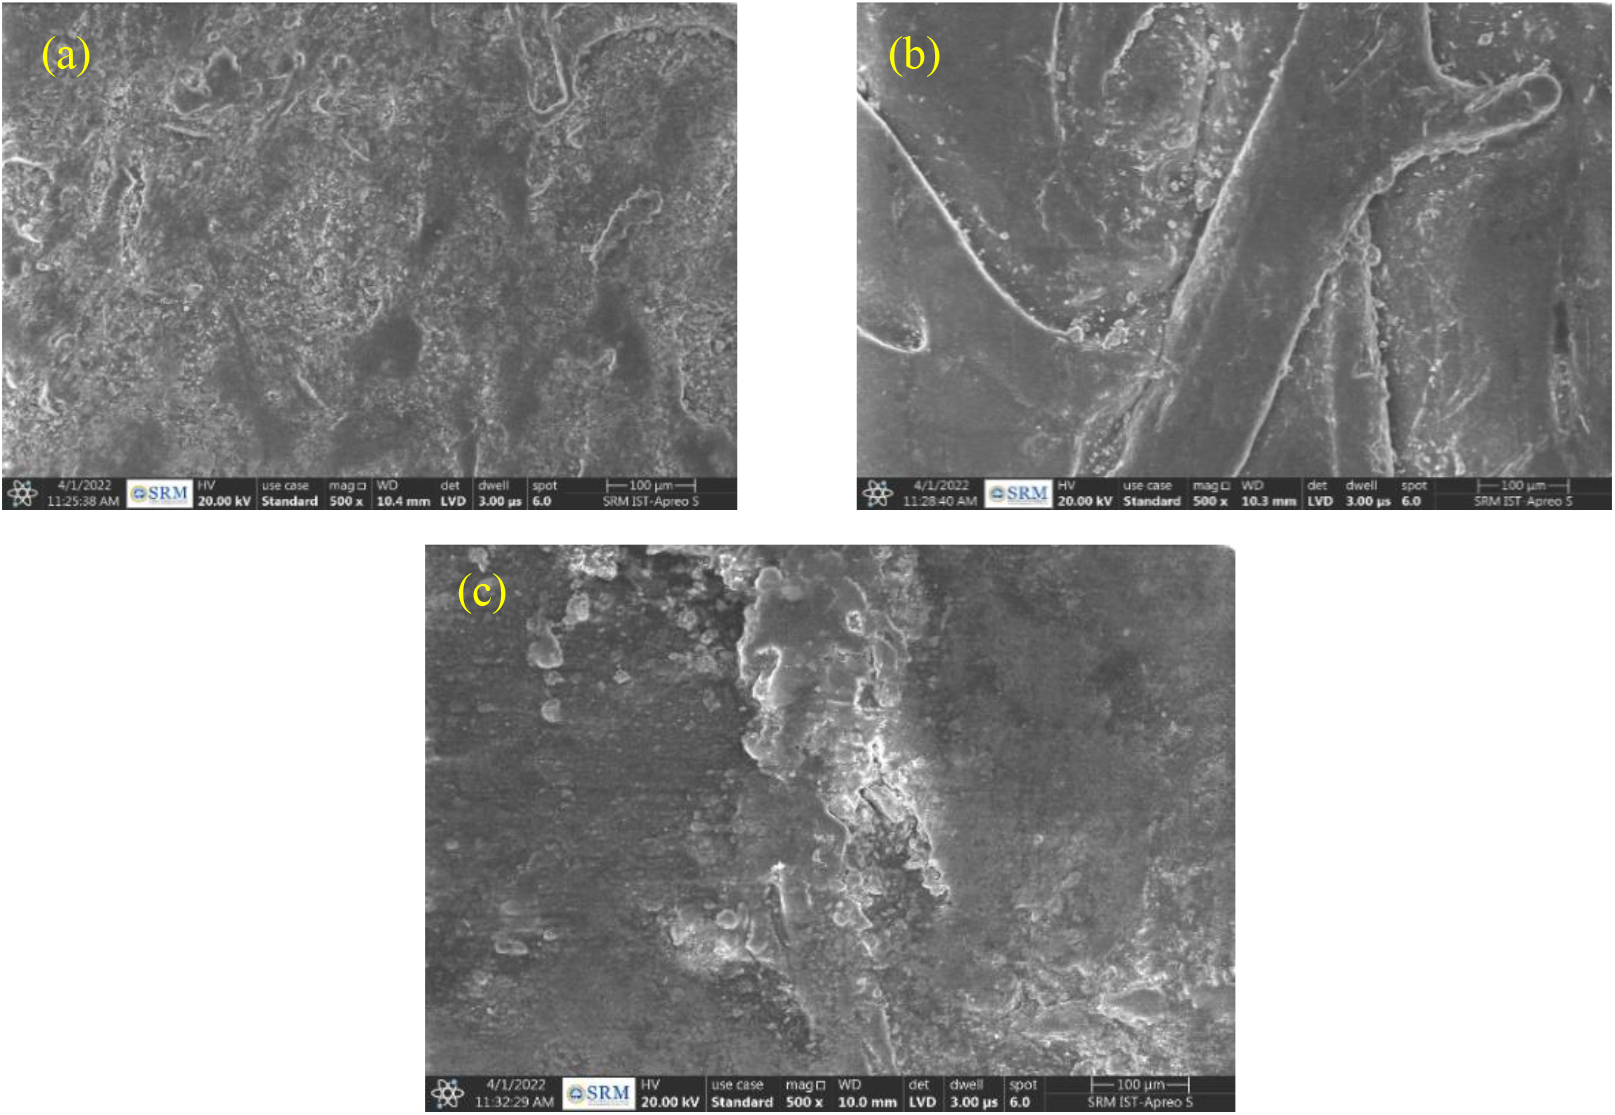
Figure 4. Microstructure of a) PLA + SD, b) PLA + BAG, c) PLA + RH
Figure 5 shows the microstructure images PLA + 7.5% composites. The white spots appearances are the 7.5% reinforcements in the matrix of three composites which are shown in Figures 5 (a to c). From the above three sets of microstructure images obtained from all composites, it was found that the PLA composites with 5% reinforcements show a uniform distribution compared with the other two wt. percentages. The composites with 7.5% reinforcements show clustering or agglomeration of reinforcements on the matrix in more places compared with PLA with 5% reinforcements. The presence of more amount of reinforcements (7.5%) in the matrix is unstable to distribute properly during the processing of the composites which reduced the plastic flow and barrier to dislocation movement of the composites[13].
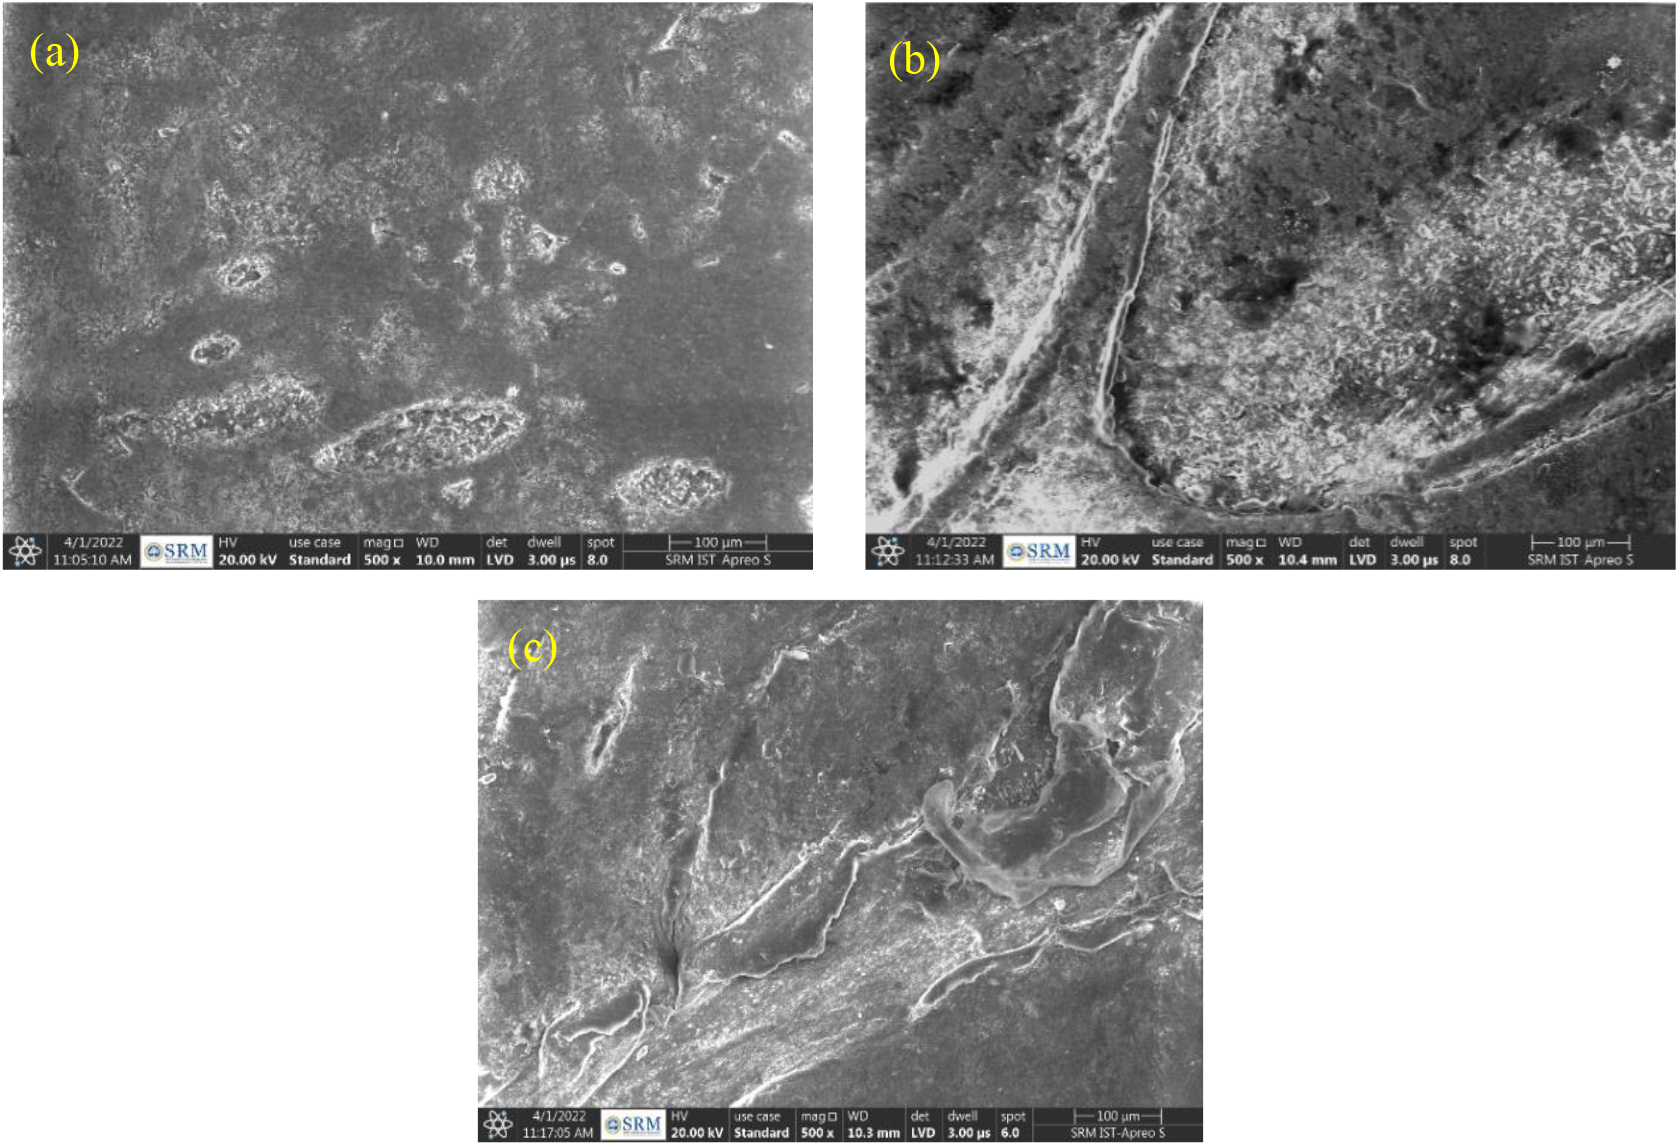
Figure 5. Microstructure of a) PLA + SD, b) PLA + BAG, c) PLA + RH
2.5 Hardness Analysis of PLA Composites
The samples with 65 x 15 x 4 mm sizes were used for the hardness testing. Three hardness readings were taken for all ten composites, and the average value was calculated for each material and used in the study.
The hardness results of all ten samples are summarized and are shown in Figure 6 as a bar chart. For the addition of reinforcements with 2.5% into the matrix, all mechanical properties are getting increased compared with the base matrix and at the same time, its performance is lower than 5%. The reason is that the addition of the hard particles (2.5%) increases the intermolecular force and bonding between the matrix and reinforcements with reduced deformation during the external loading. It was found that the hardness value increases with the increase of wt. % reinforcements up to 5% because when the reinforcements are added to a ductile PLA matrix, the hardness of the PLA is increased and then it starts decreasing [14]. The reason is that the agglomeration of reinforcements in the matrix weakens matrix-reinforcement bonding along with its properties of the composite by 7.5% more than PLA with 5% particles. PLA with 5% reinforcement showed a high hardness of 36.1 Shore D due to a proper stirring process's uniform distribution of reinforcements. Therefore, with the addition of reinforcement up to 5%, the hardness was increased by 21.6%. The PLA with RH showed a higher hardness value among the composites than other reinforcements due to higher density and high silica content. It resists moisture penetration and fungal decomposition compared with other reinforcements, making it helpful in strengthening the PMCs.
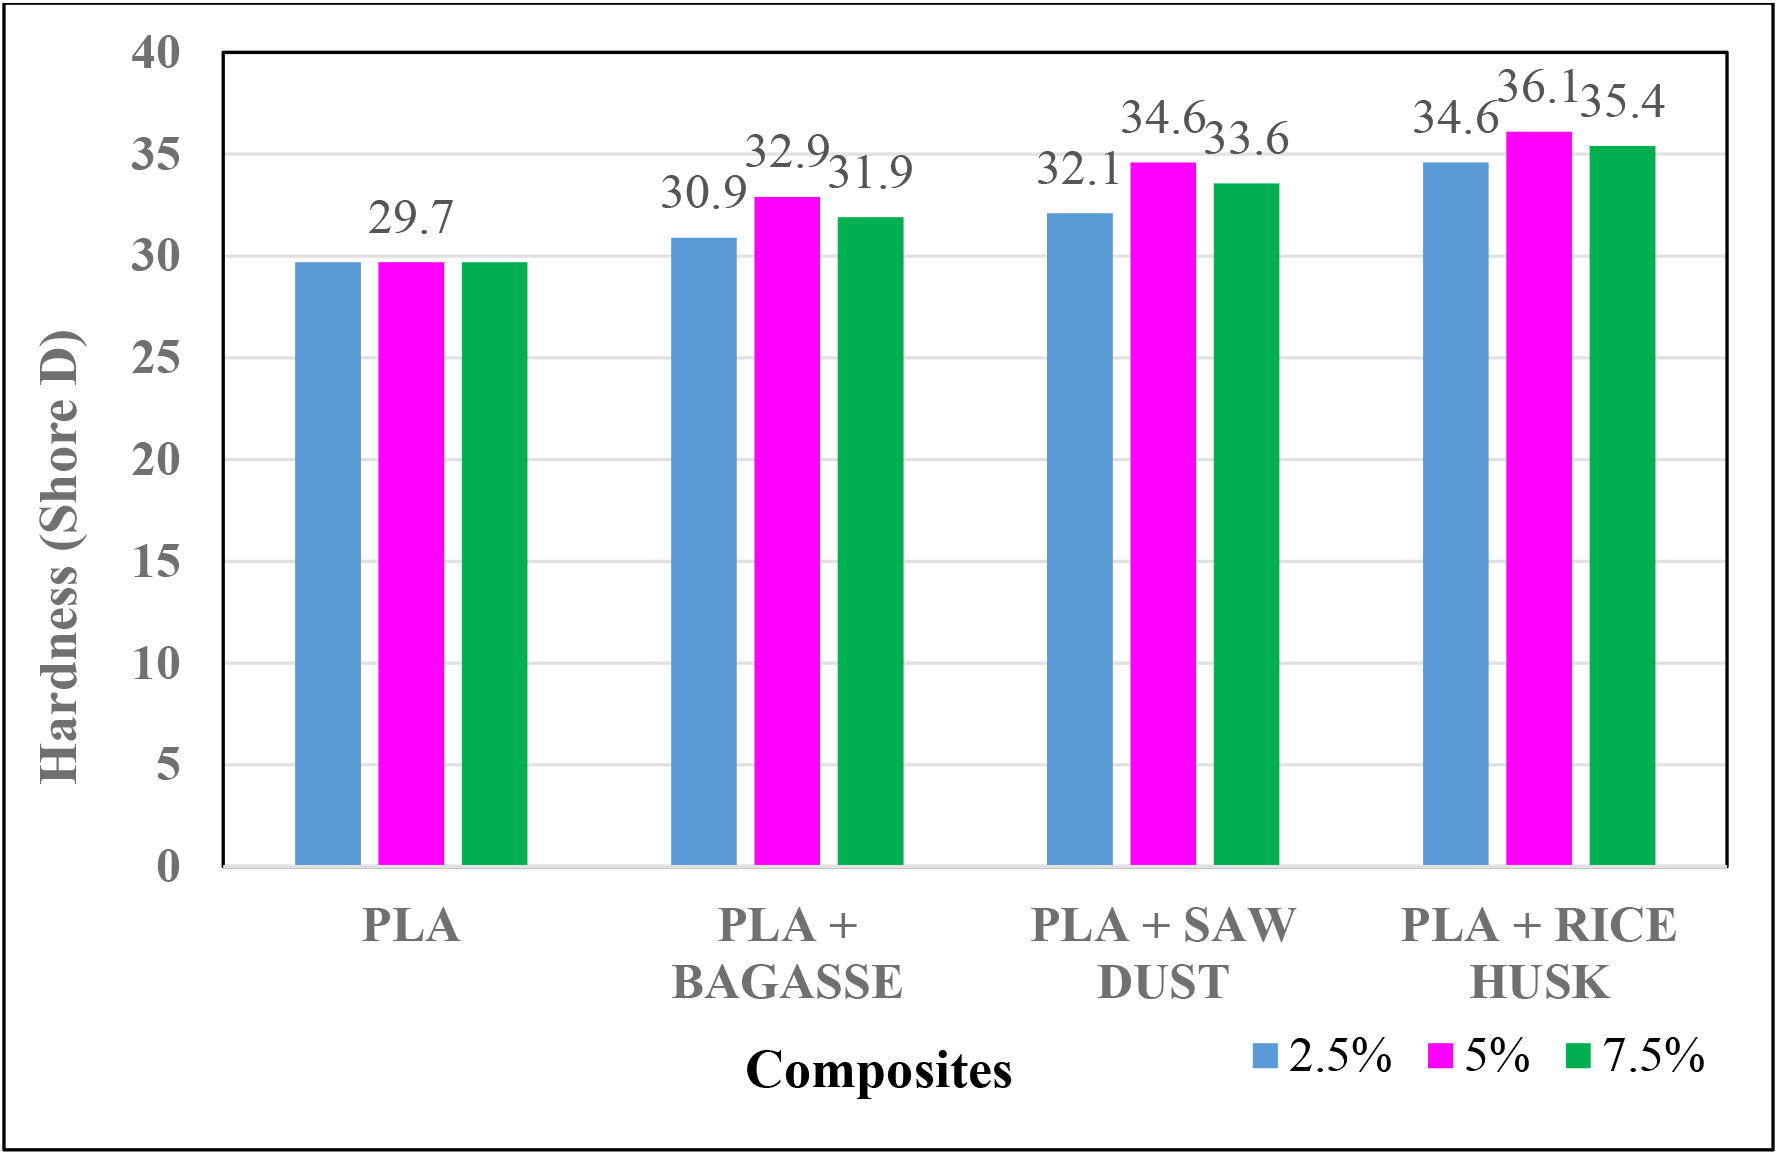
Figure 6. Variation of hardness
2.6 Analysis of Tensile Strength of PLA Composites
Figure 7 shows the universal tensile testing (UTM) with a specimen during the test. Rectangular dog bone shape samples (70 X 10 X4) mm sizes were cut from all composites and PLA as per ASTM D638 and used for tensile testing. Three tensile readings were taken for all ten composites and the average value was calculated for each material and is used in the current analysis. Tensile tests were performed using a 5-ton capacity Fuel Instruments and Engineers Pvt. Ltd (FIE) make a universal testing machine at a 1 mm/min crosshead speed with a maximum load of 10 kN. Three specimens were examined for each PMC, and the mean value was given.
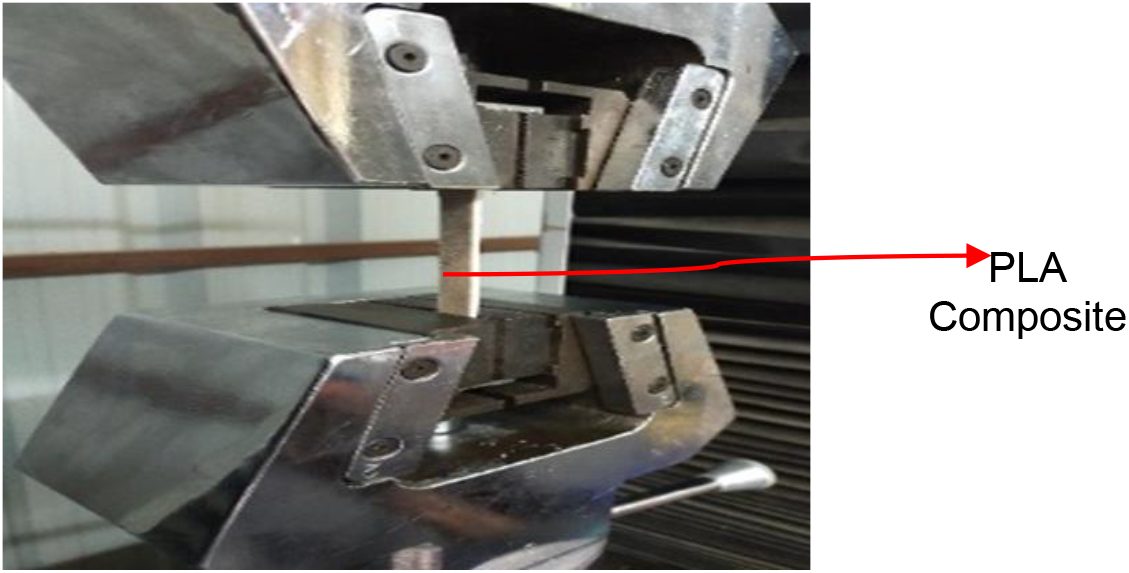
Figure 7. A typical sample in a tensile testing machine
The reinforcements in the PLA matrix improve the load-bearing capacity and resist crack propagation, which increases the tensile strength from 46.2 MPa to 62.5 MPa for a composite with RH of 5% reinforcement (Figure 8). This is due to the greater cellulose and volatile matter concentration, as well as enhanced particle adherence to the matrix, which helps to improve tensile strength [15]. Also, the presence of these reinforcing particles at grain boundaries, which resist dislocation movement, was attributed to the rise in UTS of PLA composites [16]. From the above graph, the composite with 5% reinforcements showed a higher tensile strength value and after that, it started decreasing. The 7.5% composite has less tensile strength than 5% due to the cluster formation of the reinforcement particles.

Figure 8. Variation of Tensile strength
Stress-strain curves were recorded during tensile testing to understand the ductility and failure nature of the PLA matrix and composites. Figure 9 shows the typical curves taken during the testing of PLA with 5% reinforcements which showed higher properties.
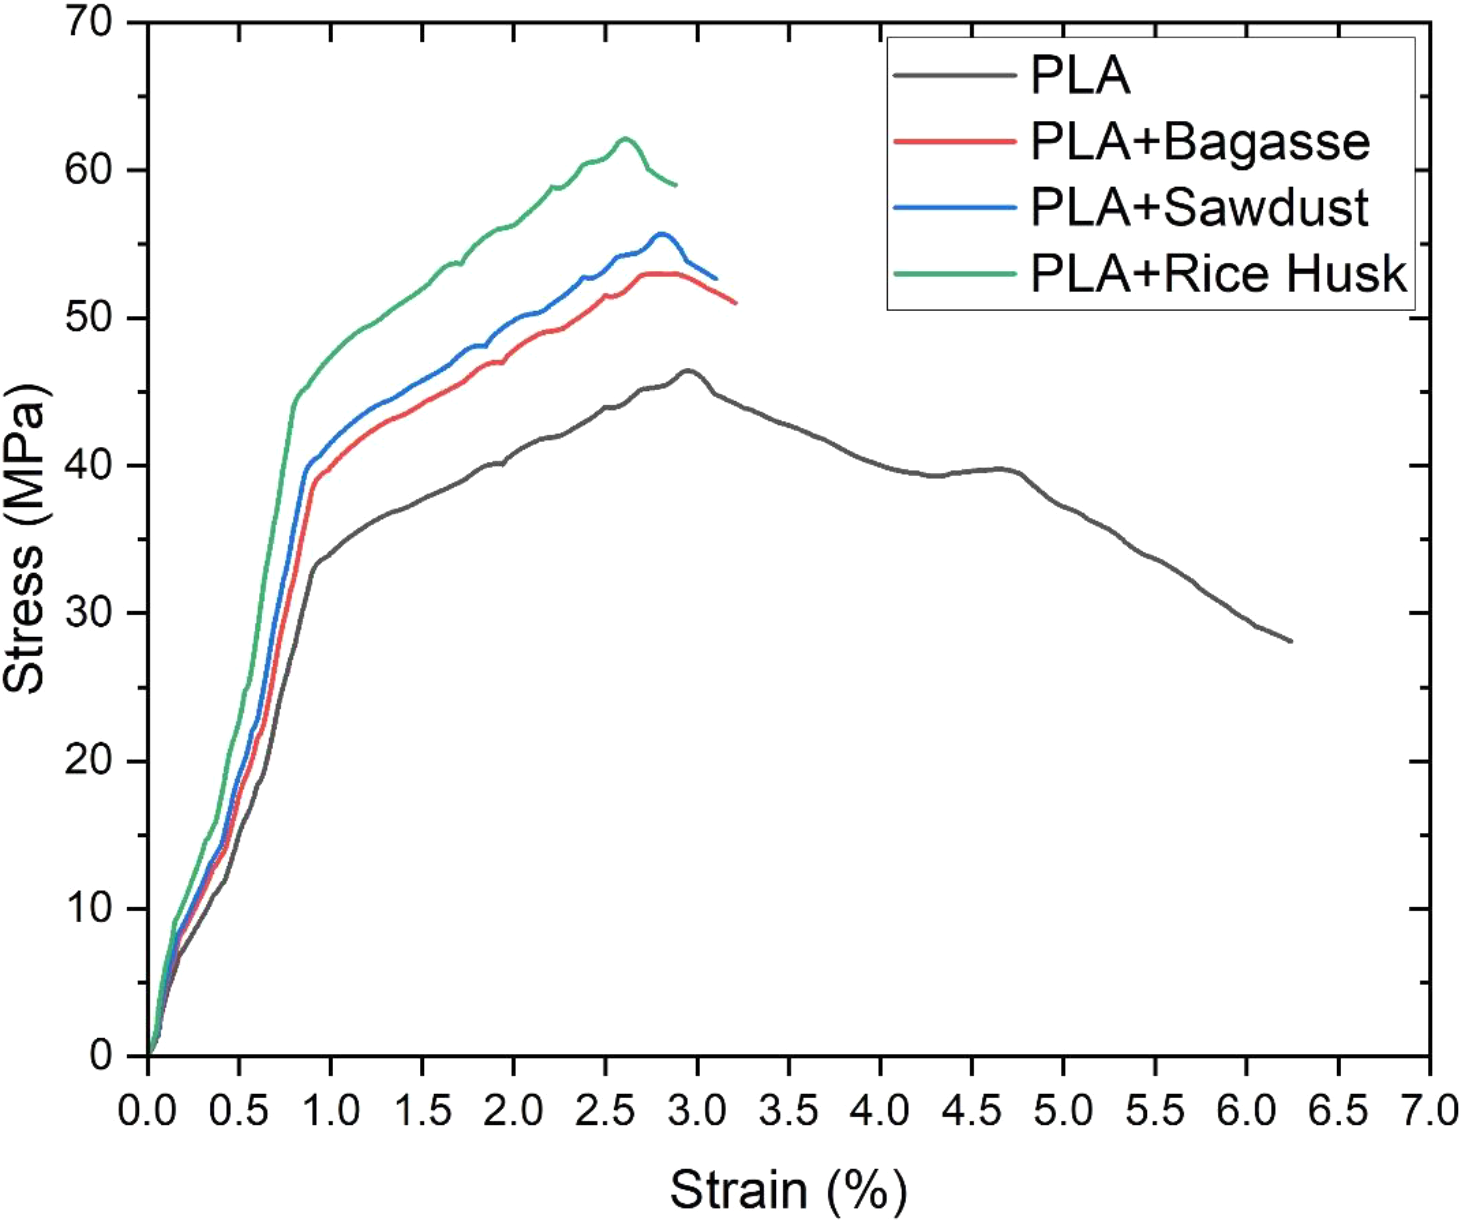
Figure 9. Stress-strain curves for PLA+5% reinforcements
2.7 Flexural Strength Analysis of PLA Composites
Rectangular shape samples with (125 x 13 x 4) mm sizes were cut as per ASTM D790 standards for the flexural testing from all processed composites and PLA. The three-point bending study was used to collect three readings for all ten composites and the average value was obtained for each material.
The addition of reinforcements in the PLA matrix showed a good trend for Flexural Strength (FS). Overall, FS improved from 78.9 MPa to 92.95 MPa for a composite with RH of 5%, which shows a 17.8% improvement. The composite with 5% reinforcements showed a higher flexural strength value and after that, it started decreasing (Figure 10) with the help of additional fillers with PLA matrix, the plastic encapsulation's shear resistance is increased and thus FS was increased (The 7.5 % composites have less flexural strength than 5% due to the clustering of poor dispersion of the reinforced particles)[17].
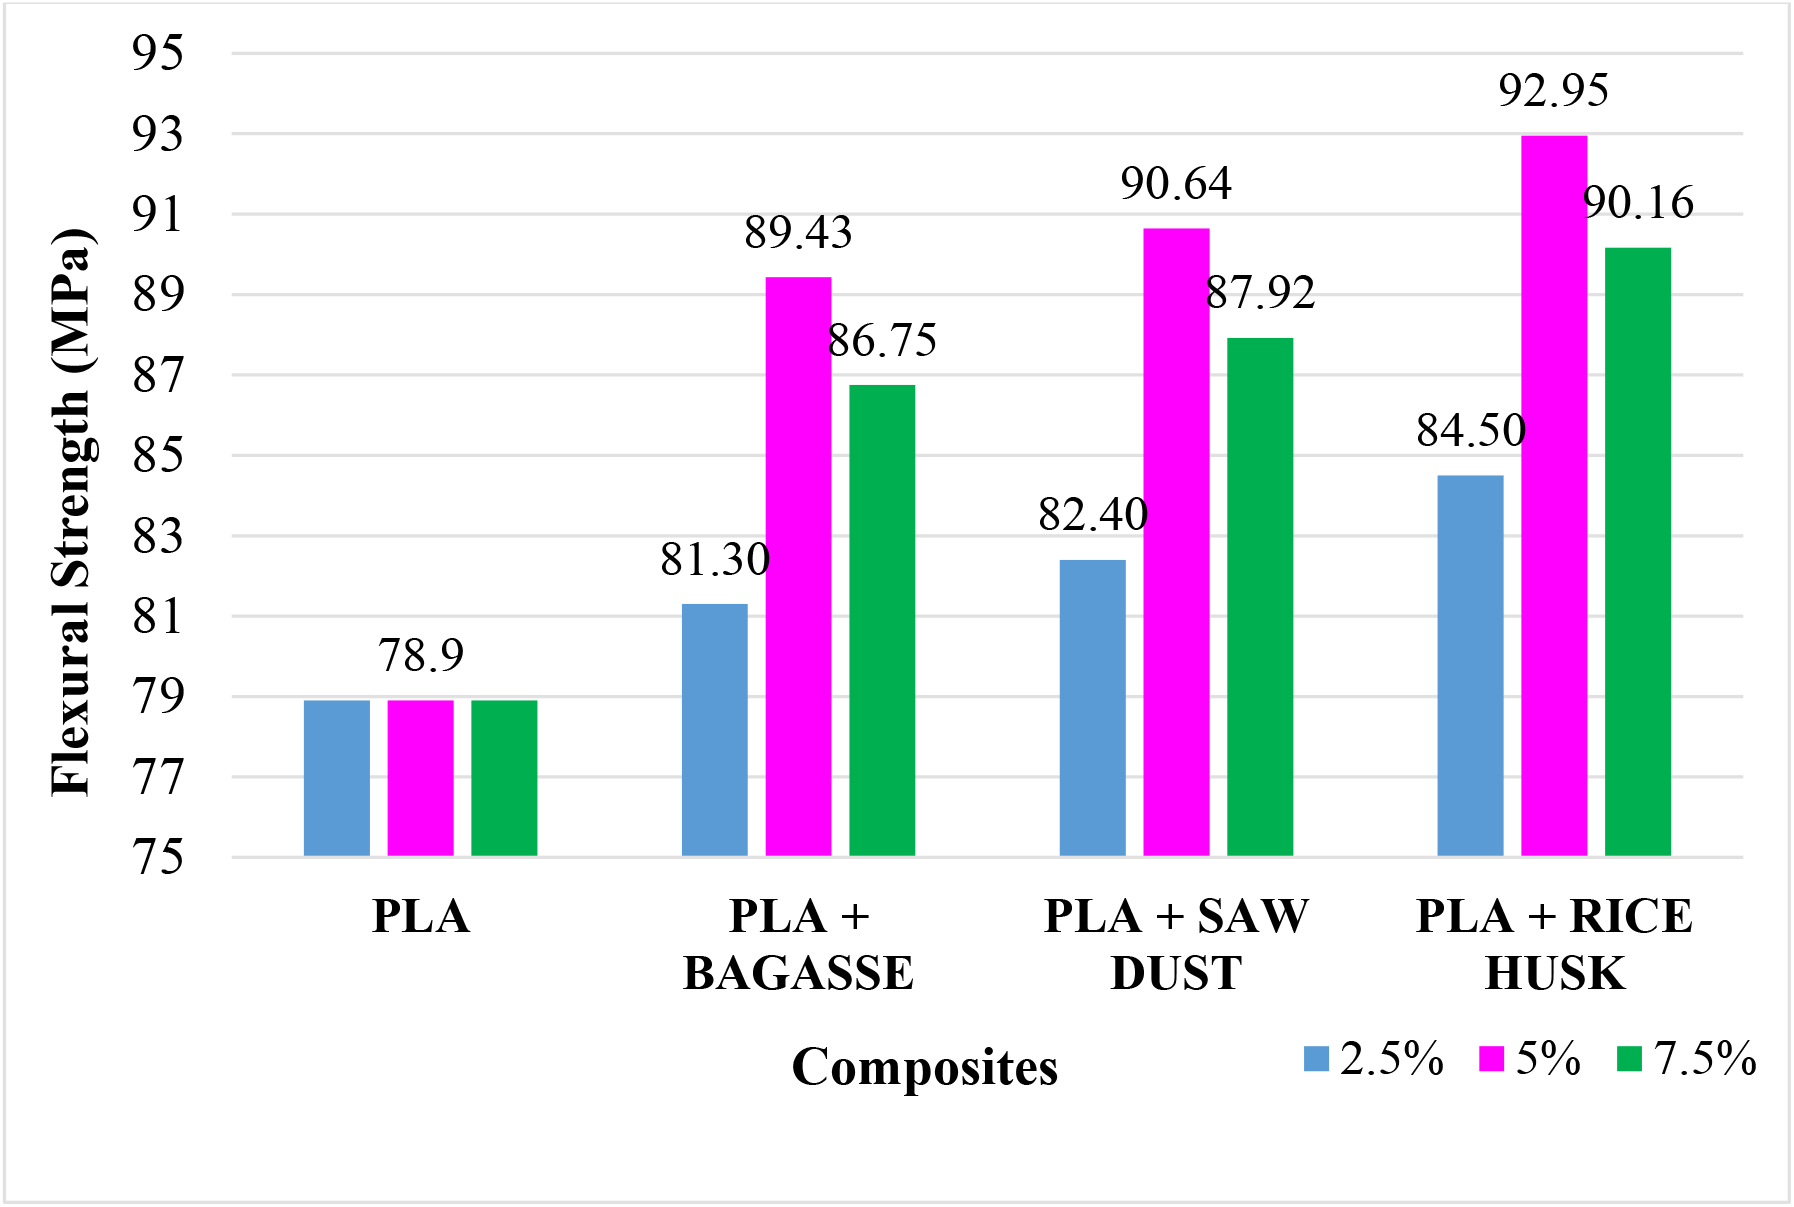
Figure 10. Variation of Flexural strength
2.8 Impact Strength Analysis of PLA Composites
Rectangular shape samples with (125 x 13 x 4) mm sizes were cut as per ASTM D256 standards for impact testing.
The impact strength results of all ten samples are summarized and are shown in Figure 11 as a bar chart. When the hard reinforcements are added to a ductile PLA matrix, the impact of the PLA increases from 0 to 5% with an interval of 2.5%. Because the hard reinforcement particles share the load with the matrix and reduce the dislocation density in the grain boundaries, which increases rigidity and impact strength[18]. Agglomeration of reinforcements in the matrix weakens the properties of the composite by 7.5% than PLA with 5%. As a result, a high impact strength of 17.4 kJ/m2 was observed for the PLA with 5% reinforcements. Also, the PLA with RH showed a high impact strength among the composites since RH has higher density, hardness, tensile and flexural strength along with better silica content compared with the other two reinforcements.
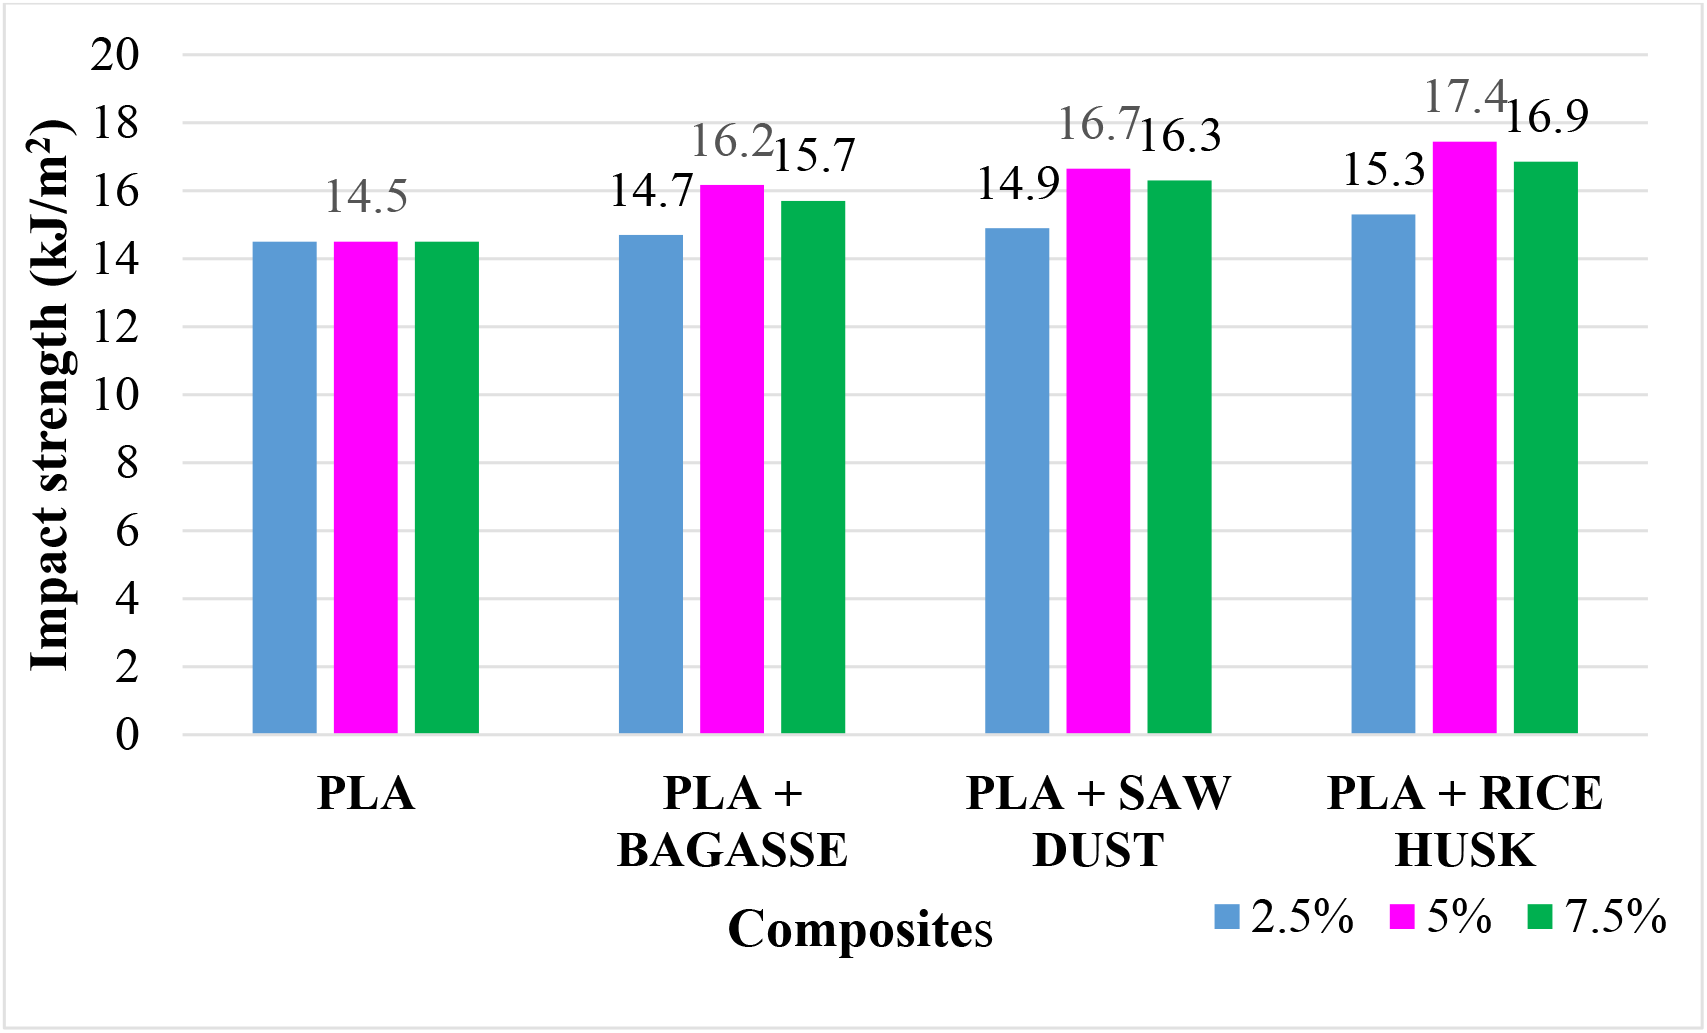
Figure 11. Variation of Impact strength
• PLA-based particulate composites were successfully fabricated using a hot compression molding process from PLA, PLA + Sawdust, Rice Husk, and Bagasse reinforcement powders in 0, 2.5, 5 & 7.5wt%.
• The raw materials used were PLA pellets of an average size of 3 mm, and the mean average size of all reinforcements is 50 μm.
• The microstructural analysis obtained from SEM images observed the homogeneous distribution of PLA with 5% reinforcements over other composites.
• The mechanical characterization results found that hardness, tensile, flexural, and impact strength value was high for PLA + Rice husk composite compared with other PMCs.
• The maximum hardness, tensile, flexural and impact strength of 36.1 Shore D, 62.5 MPa, 92.95 MPa, and 17.4 kJ/m2 were observed for the composite of PLA with 5% rice husk particle reinforcements since it has higher density, silica content, and resistance to moisture penetration.
References
1. A. Madhan Kumar, and K. Jayakumar, J. Chin. Inst. Eng. 45(2022): 437. [Google Scholar]
2. R.A. Ilyas, S. M. Sapuan, M. M. Harussani, M. Y. A. Y. Hakimi, M. Z. M. Haziq, M. S. N. Atikah, and M. R. M. Asyraf, Polymers. 13(2021): 1326. [Google Scholar]
3. R.L. Shogren, W.M. Doane, D.Garlotta, J.W. Lawton, and J.L. Willett, Polym. Degrad. Stab. 79(2003): 405. [Google Scholar]
4. N. Narlýoðlu, T. Salan, and M.H. Alma, BioResources. 16(2021): 5467 [Google Scholar]
5. J. Inbakumar, Parivendhan, and S. Ramesh, Trans. Can. Soc. Mech. Eng. 42(2018): 280. [Google Scholar]
6. J. Praveenkumar, P. Madhu, T.G. Yashas Gowda, M.R. Sanjay, and S. Siengchin, J. Text. Inst. 113(2022): 231. [Google Scholar]
7. S. Kumar, L. Mahadevaswamy, H.R. Hemaraju, and Y.S. Varadarajan, Mater. Today: Proc. 52 (2021): 599. [Google Scholar]
8. C.S. Wu, and C.H. Tsou, 2019, J. Polym. Res. 26 (2019): 1. [Google Scholar]
9. K. Yoganandam, V. Shanmugam, A. Vasudevan, A. Vinodh, D. Nagaprasad, N. Stalin, B. Karthick, A.C. Malla, and M. Bharani, Adv. Mater. Sci. Eng. 26 (2021): 1. [Google Scholar]
10. A. Bartos, K. Nagy, J. Anggono, H. Purwaningsih, J. Móczó, and B. Pukánszky, Compos. Part A Appl. Sci. Manuf. 143 (2021): 106273. [Google Scholar]
11. J. Anggono, BILY. Budiarto, S. Sugondo, and H. Purwaningsih, Materials Science Forum. 1000 (2020): 193. [Google Scholar]
12. A.H.D. Abdullah, O.D. Putri, A.K. Fikriyyah, R.C. Nissa, S. Hidayat, R.F. Septiyanto, M. Karina, and R. Satoto, Polym-Plast. Tech. Mat. 59 (2020): 1259. [Google Scholar]
13. K. Jayakumar, Jose Mathew, M. A. Joseph, R. Suresh Kumar, A. K. Shukla, and M. G. Samuel, Mater. Manuf. Process. 28 (2013): 991. [Google Scholar]
14. Ayrilmis, Nadir, Mirko Kariz, Milan Šernek, and ManjaKitekKuzman, J. Adv. Manuf. Technol. 115(2021): 3233 [Google Scholar]
15. T.T.L. Doan, H.M. Brodowsky, and E. Mäder, Composites from Renewable and Sustainable Materials; InTech: London, UK, pp.1-24, https://doi.org/10.5772/65264. [Google Scholar] [CrossRef]
16. A. Dhandapani, S. Krishnasamy, T. Ungtrakul, S.M.K. Thiagamani, R. Nagarajan, C. Muthukumar, and G. Chinnachamy, Appl. Sci. Eng. Prog. 14(2021): 606. [Google Scholar]
17. P.K. Bajpai, Inderdeep Singh, and Jitendra Madaan, J. Thermoplast. Compos. Mater. 27(2014): 52. [Google Scholar]
18. V.H. Carneiro, S.D. Rawson, H. Puga, and P.J. Withers, Sci. Rep. 11(2021): 1. [Google Scholar]
Cite This Article
 Copyright © 2022 The Author(s). Published by Tech Science Press.
This work is licensed under a Creative Commons Attribution 4.0 International License , which permits unrestricted use, distribution, and reproduction in any medium, provided the original work is properly cited.


 Submit a Paper
 Propose a Special lssue
 View Full Text
 Download PDF
 Downloads
 Citation Tools