 Open Access
ARTICLE
Comparative Investigations on Fracture Toughness and Damping Response of Fabric Reinforced Epoxy Composites
Associate Professor, Department of M.E., Future Institute of Engineering and Technology, Bareilly -243202, India.
* Corresponding Author: e-mail:
Journal of Polymer Materials 2022, 39(3-4), 255-267. https://doi.org/10.32381/JPM.2022.39.3-4.6
Abstract
Studies were conducted to observe the effect of fracture toughness and damping response on fabric reinforced epoxy polymer composites. The samples of glass fabric, kevlar fabric and carbon fabric having 15wt%, 25wt%, 35wt%, 45wt% and 55wt % fabric content were prepared and tested following ASTM standards. Fracture toughness, peak load and increase in energy absorption are determined for the fabric-epoxy composites. Effect of temperature on storage modulus, loss modulus and tan delta values for various percentages of fabric epoxy composites are noticed and corresponding damping response behaviour is determined. The results revealed that reduction in strength at higher percentage of fabric content is due to improper bonding between fabric and epoxy resin. Higher peak load values and increased values of energy absorption are observed at lower percentage of fabric content. Kevlar fabric proves to be beneficial for specific energy absorption capability. Strength retention capability at higher temperature is far better for carbon fabric epoxy combinations. Composites with lower fabric content retain much higher temperature and peak load. Also the experimental findings are in close proximity with that of theoretical results.Keywords
The fibers are also known as the reinforcing phase carry the structural load, reduce thermal stresses and provide desired mechanical properties [1, 2]. Glass, carbon, aramid and graphite are generally used as fiber reinforcement. Glass and carbon are the most common materials as fiber reinforcement. Fiber reinforced polymers are further classified as randomly oriented chopped fiber, unidirectional and woven fiber reinforced polymer materials[3, 4].
Composites are developed for superior mechanical strength and better wear resistance properties. The performance of a composite material depends on various factors. Each factor has its unique importance and can alter the performance of the composite material. Factors which can alter the performance of composite material are percentage of fiber/ filler material, effect of fiber orientation, effect of fiber length on wear rate, effect of fiber treatment and/or filler particle coating, effect of type of wear on composite material [5, 6]. Composites are known for its unique properties and different testing parameters ensure its effectiveness when subjected to wide variety of applications. Tests for flexural toughness and damping behaviour are used to determine the versatility of laminar composites when subjected to heat and pressure [7]. Major issues incorporated with polymer matrix composites are its susceptibility to damage from heat which leads to its limited utilization in practical applications [8]. Sharma et al. [9] while studying the static and dynamic mechanical properties of multiscale bulky paper interleaved kevlar fiber composites noticed that addition of bulky paper interleaves and dispersed MWCNT improve interlaminar and interfacial properties. Bulut et al. [10] also observed that tough and high performance kevlar fibers proved to be highly effective in improving the damping capacity even that of glass fiber if used as a hybrid composite laminates. Hybridization of glass fiber reinforced epoxy laminates with multi wall carbon nano tubes leads to increase in flexural strength, toughness, natural frequencies and damping ratios i.e. the addition of multi walled carbon nano tube along with glass fiber reinforced epoxy proved to be beneficial in increasing the damping response of the composites [11].
Furthermore, fiber orientation and stacking sequence would simultaneously affect the damping and stiffness properties. Interface region is also an important parameter and will affect the damping properties to a great extent[12]. Also mixing of high strength polystyrene along with epoxy is an effective way to enhance the damping response of composite material when subjected to loading. Also the presence of high strength polystyrene in epoxy may reduce / delay in crack propagation and break moment [13]. Above text clearly reveals that fracture toughness and damping response plays an important role in determining the behaviour of laminar composites when subjected to vibrations and loading. Although research have been done to determine the performance of laminar composites yet the current research specifically focuses on the most popularly used artificial fabric reinforced epoxy composites when subjected to transverse loading. Special attention is focussed to determine the load retention capability of composites when subjected to elevated temperatures and variable loading.
2. PRELIMINARY INVESTIGATION ON POLYMER COMPOSITES
2.1 Material and Sample Preparation
Reinforcing materials used in the experimentation are glass fabric, aramid fabric (kevlar 29) and carbon fabric originally supplied from Fibro Tech Chemicals, New Delhi having specifications as shown in Table 1. The low temperature curing epoxy resin (LY556) and corresponding hardener (HY951) mixed in the ratio of 10:1 are used as the matrix material. Epoxy resin and corresponding hardener are supplied by Ciba Geigy India Ltd. The glass, carbon and kevlar fabric composites were prepared by using simple hand lay-up technique. Corresponding layers of fabric and epoxy are added one above the other to get the desired thickness of composite laminate. The composite are then left for solidification for 24 hours at a pressure of about 100gm/cm2. Similar, procedure was adopted for all the selected compositions (i.e. 15wt%, 25wt%, 35wt%, 45wt% and 55wt %) of glass, kevlar and carbon fabric respectively. The composites are fabricated in the form of slabs of sizes 250mm x 250mm having required thickness. The specimens are then cut following ASTM standards and required testing will be performed.

2.2 Fracture Toughness of Polymer Composites
Fracture testing is used to determine the growth of delamination in composite laminates. Tests were conducted to determine the behavior of composite materials towards fracture toughness. The property measured is known as fracture toughness. Fracture specimens of sizes 180mm long and 25mm wide with an initial crack length of 20mm are cut by a saw. The test standard for testing of fracture toughness is ASTME740M-03 [14]. Fracture testing is performed by Instron 1152 using three point bending with a span length of 30mm and a travel speed of 0.5mm/min. The effect of load on the displacement of the specimen is measured for each weight percent of fabric reinforcement.
2.3 Thermo Mechanical Testing using Dynamic Mechanical Analyzer (DMA)
Tests were conducted to determine the behaviour of the material towards thermos-dynamic response as per ASTM D 7028-07 [15]. Dynamic mechanical analyzer (DMA) testing instrument is used to notice the behaviour of glass, kevlar and carbon fabric reinforced epoxy composites with the rise in temperature. The experiments are conducted in a nitrogen atmosphere at a fixed frequency of 1 Hz, heating rate of 2°C/min, temperature range of 29°C –250°C and at a strain of 1% on rectangular samples with approximate sample dimensions of 56 x 12 x 2 mm using NETZSCH DMA 242 instrument in bending mode [16, 17].
Experiments have been conducted to evaluate the damping behaviour of the material during mechanical vibrations under cyclic loading. The better the damping behaviour of the material the more the material is subjected to stock and vibrations. Loss modulus, storage modulus and tan delta are evaluated to determine the behaviour of the glass, kevlar and carbon fabric with the rise in temperature of composites.
Damping factor (Tanδ) is given by
3.1 Fracture Toughness of Glass, Kevlar and Carbon Fabric Reinforced Epoxy Composites
Figure 1 shows a graph of load versus displacement for 15wt. %, 25wt. %, 35wt. %, 45wt. % and 55wt. % glass fabric reinforced epoxy composites. As the initial crack was observed, the cracked section responded to the loading in a linear manner, non linear curve is due to the spalling of the specimen, the failure at the fracture point and a sudden drop in the value of the load is observed at corresponding displacements. The second and third peak value of load is due the redistribution of internal stresses with the increase in the value of displacement. It is noted that the specimen with higher fabric content especially 45wt% and 55wt% bears less load for the corresponding displacement in comparison to that with lower fabric content i.e. 15wt%, 25wt% and 35wt%. The main reason for this behavior is that at higher glass fabric content the binding between the molecules of fabric and epoxy reduces.
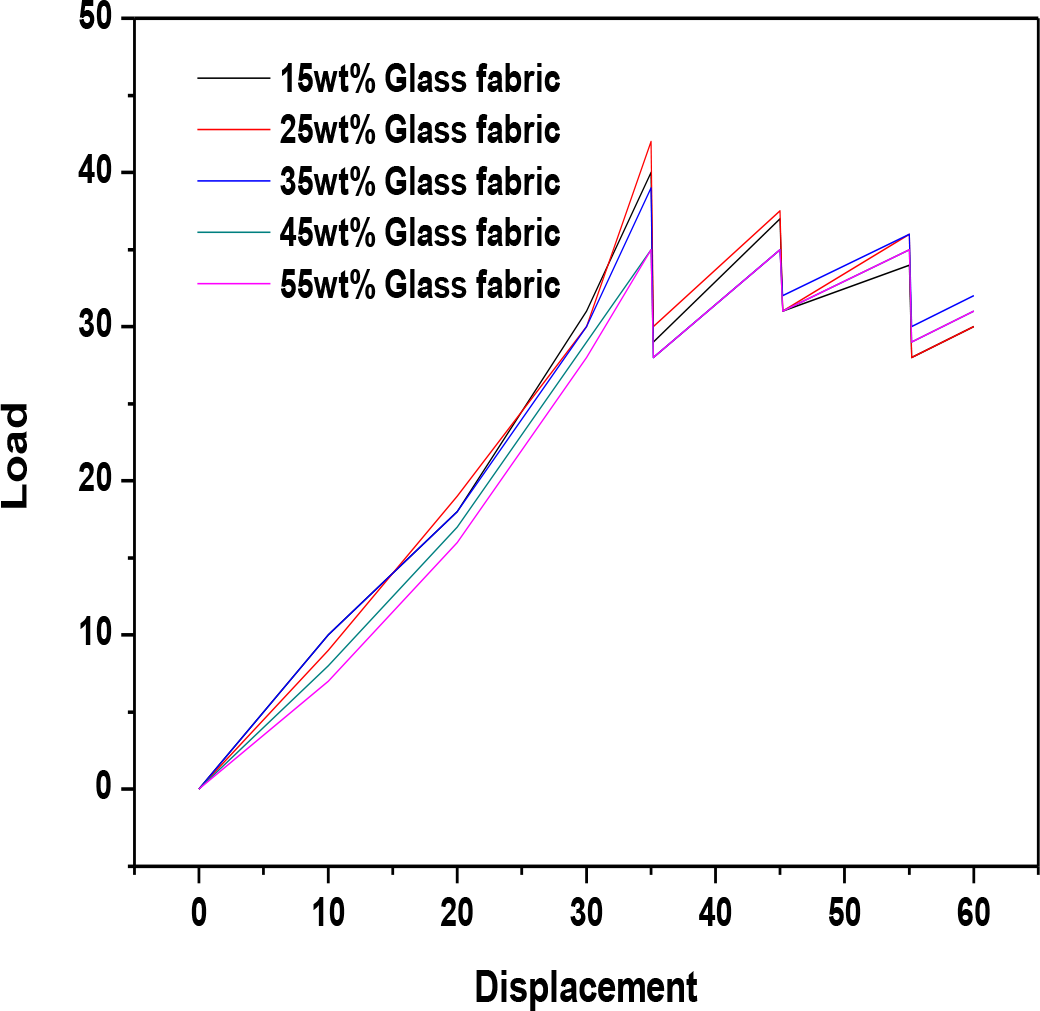
Figure 1. Fracture toughness of glass fabric reinforced epoxy composites
Figure 2 shows a graph of load versus displacement for 15wt%, 25wt. %, 35wt. %, 45wt. % and 55wt. % kevlar fabric reinforced epoxy composites. From the figure 2 it is clear that kevlar fabric bears more spalling to peak load value in comparison to that of glass fabric reinforced epoxy composites. This may be due the fact that the synthetic nature (higher ductility) and higher compressive strength of carbon fabric in comparison to that of glass and kevlar fabric. A remarkable decrease in load was then observed after the first peak load as a result of increase in fracture area of the specimen. The sections of the graph as shown in figure 1-3 after the peak load is due the ductile characteristics and redistribution of internal stresses inside the material of the specimen.
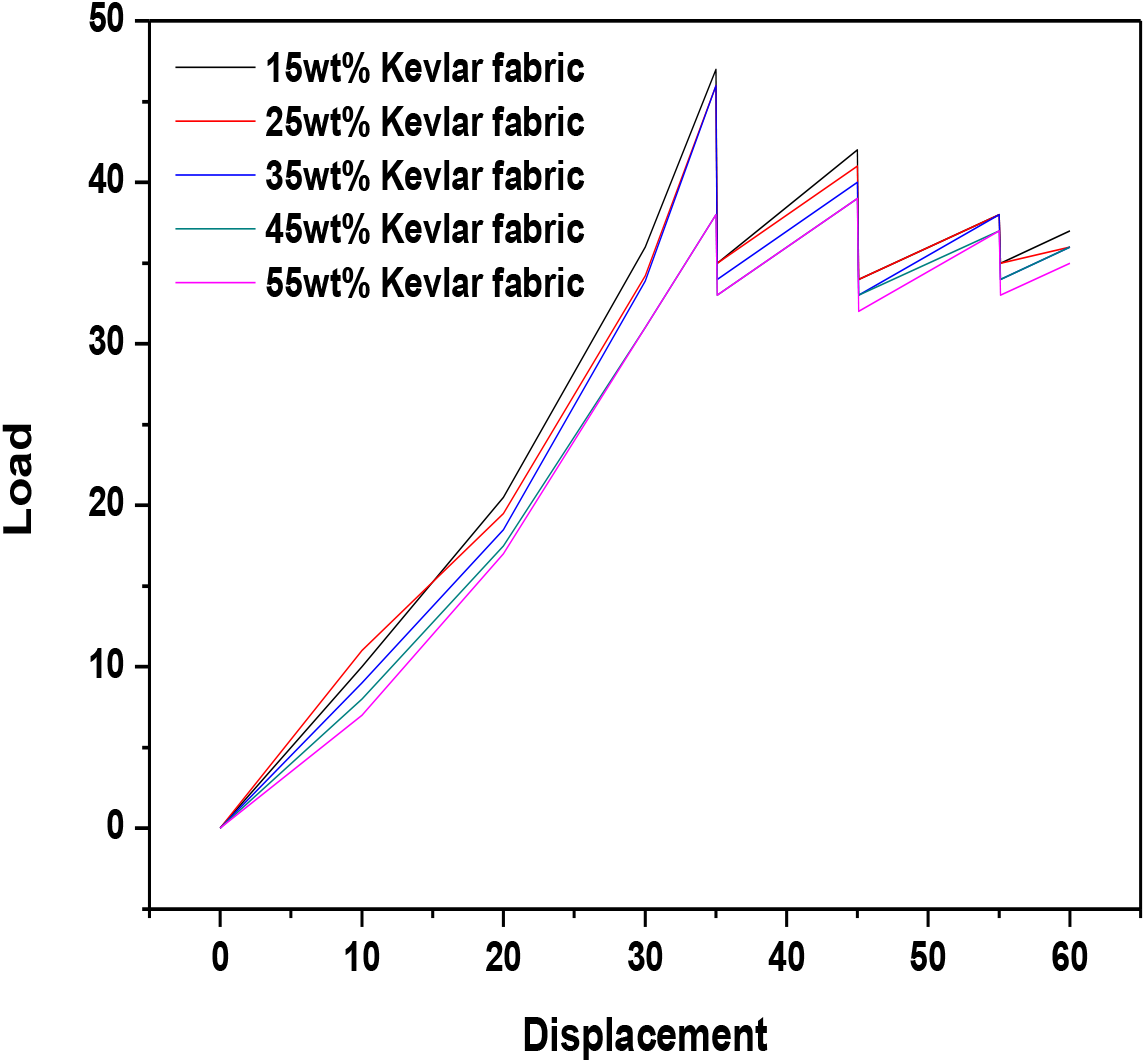
Figure 2. Fracture toughness of kevlar fabric reinforced epoxy composites
Figure 3 shows a graph of load versus displacement for 15wt.%, 25wt.%, 35wt.%, 45wt.% and 55wt. % carbon fabric reinforced epoxy composites. The load bearing capability of carbon fabric with respect to displacement lies in between to that of glass fabric and kevlar fabric reinforced epoxy composites. Also the types of cracks noticed in kevlar fabric and carbon fabric is of flexural – shear in nature whereas the cracks in glass fabric epoxy composites are purely flexural in nature. Carbon and kevlar fabric are most commonly used in wide variety of applications due to its unique tendency to transfer loads much effectively and leads to minimization in failure tendency when subjected to loading.
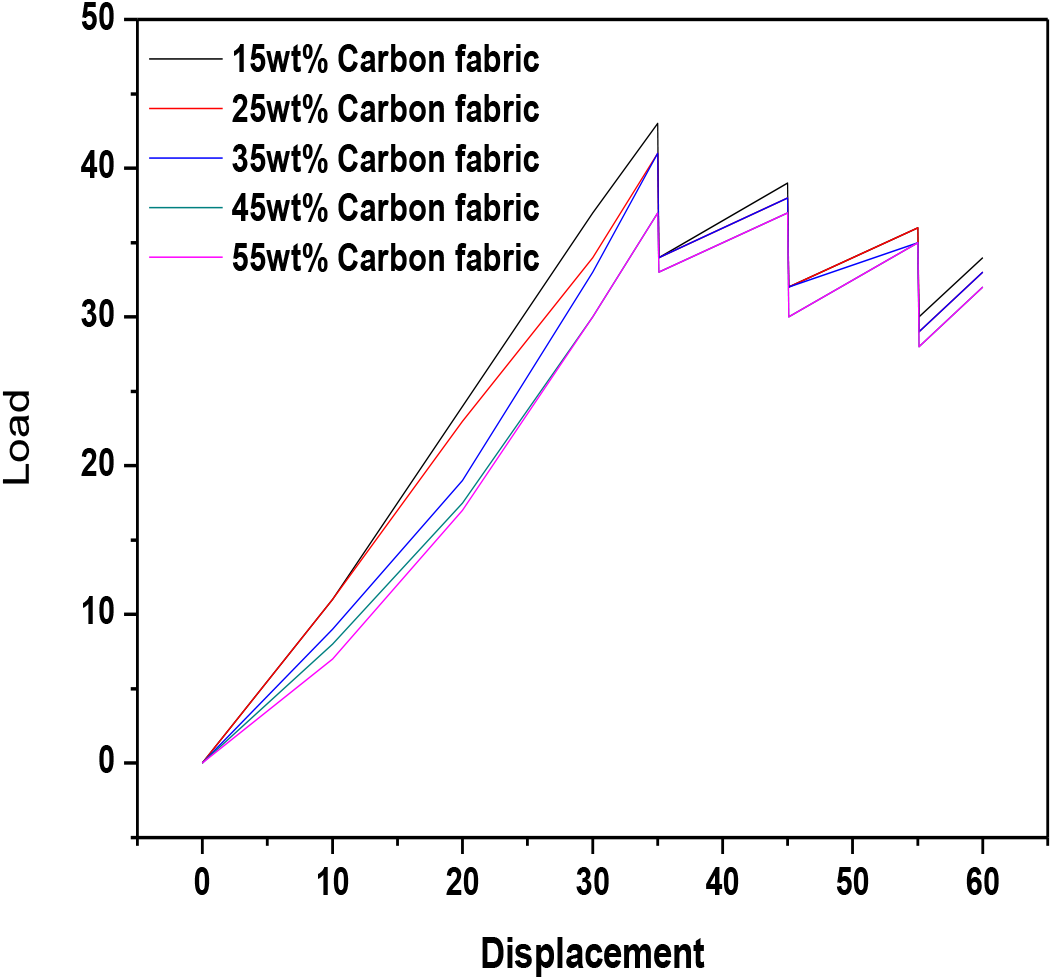
Figure 3. Fracture toughness of carbon fabric reinforced epoxy composites
3.2 Energy Absorption Capacities of Glass, Kevlar and Carbon Fabric Reinforced Epoxy Composites
The energy absorption capabilities were estimated for glass, kevlar and carbon fabric reinforced epoxy composites. Higher energy absorption capabilities were obtained for kevlar fabric epoxy composites in comparison to that of glass and carbon fabric epoxy composites. From table 2 clearly shows that the energy absorption capability of 15-35wt% kevlar fabric is highest followed by carbon and glass fabric epoxy composites. Also the highest energy absorption capability of epoxy + 25wt% kevlar fabric is 124% higher followed by 120% for epoxy + 15wt% kevlar fabric composites. The higher energy absorbing capability of kevlar fabric is due to the stiffness of kevlar fabric and its high young's modulus in comparison to that of glass and carbon fabric.

3.3 Thermo Mechanical Properties of Glass, Kevlar and Carbon Fabric Reinforced Composite
Dynamic mechanical analysis have been carried out on glass fabric, kevlar fabric and carbon fabric reinforced epoxy composites with the change in the percentage of fabric reinforcement to evaluate the effect of storage modulus (E′), loss modulus (E″) and damping parameter (Tanδ) as a function of temperature.
3.3.1 Effect of temperature on storage modulus of glass, kevlar and carbon fabric
Figure 4, 5 and 6 shows a graph of storage modulus versus temperature for glass, Kevlar and carbon fabric reinforced epoxy composites respectively. In the starting i.e. when the temperature is from 0°C to 60°C the value of storage modulus is higher for glass, kevlar and carbon fabric specimens because the molecules of fiber and the matrix are tightly and closely packed providing high resistance to the movement of molecules within the structure? As the temperature further rises sudden decrease in the value of storage modulus is noticed. Storage modulus values are nearly constant up to 68°C for glass fabric, 78°C for kevlar fabric composites and 82°C for carbon fabric reinforced composites (Region 1). The constant value of storage modulus is due to the glassy regime. In glassy regime the value of storage modulus remains constant with the increase in the value of temperature. Increasing the temperature beyond 68°C, 78°C and 82°C for glass, kevlar and carbon fabric respectively results in sharp decline in the values of storage modulus. The sharp decrease in the values of storage modulus is due to the fact that the material starts losing its strength with the increase in temperature and starts converting from glassy state to rubbery state. The sharp decrease in the values of storage modulus is noticed up to 100°C for glass, 110°C for kevlar and 114°C for carbon reinforced composites (region 2).
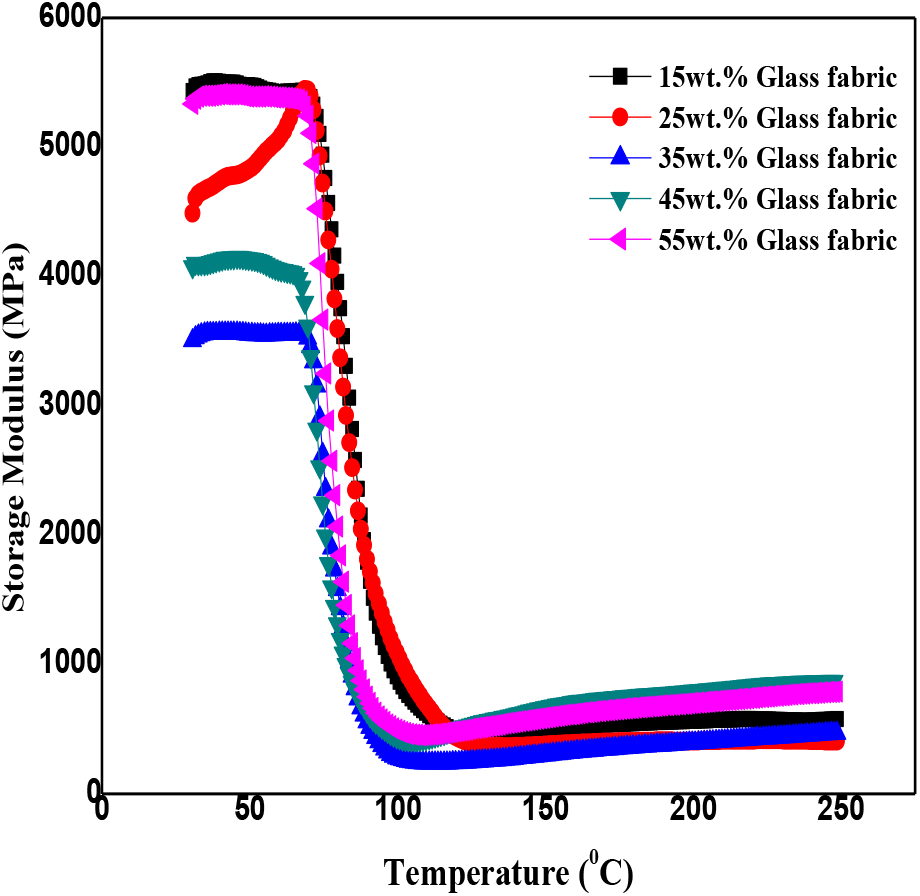
Figure 4. Storage modulus of glass fabric reinforced epoxy composites
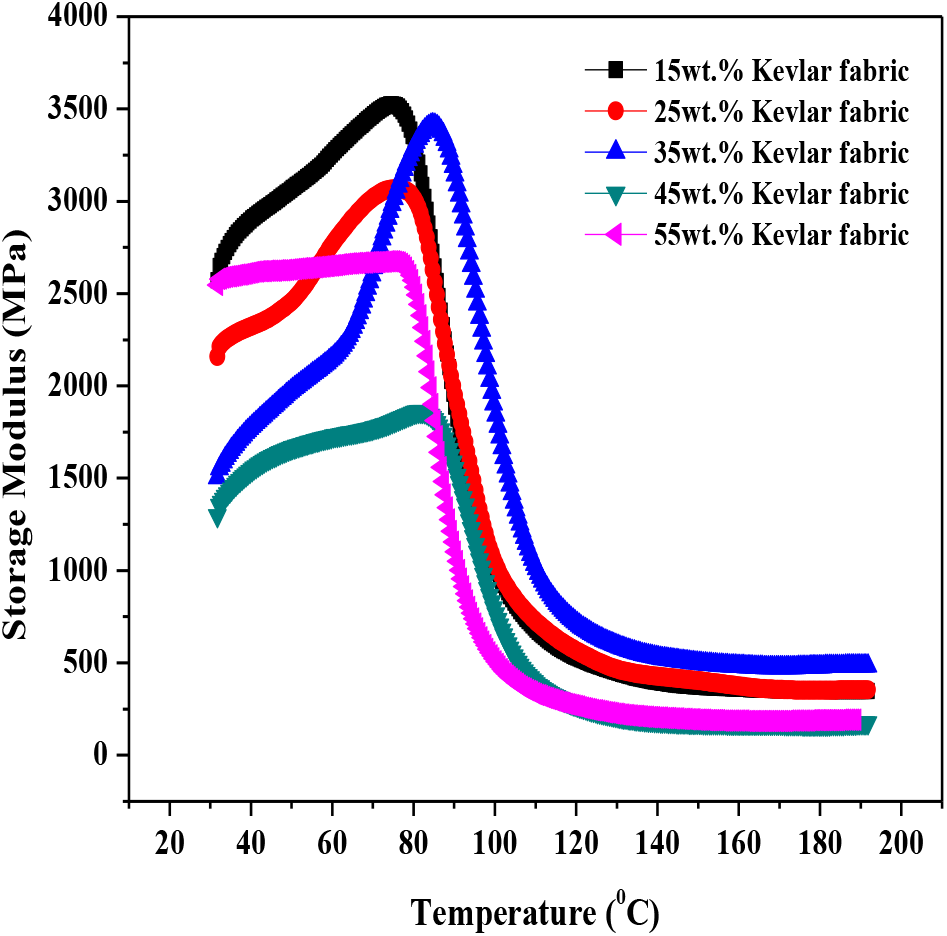
Figure 5. Storage modulus of kevlar fabric reinforced epoxy composites
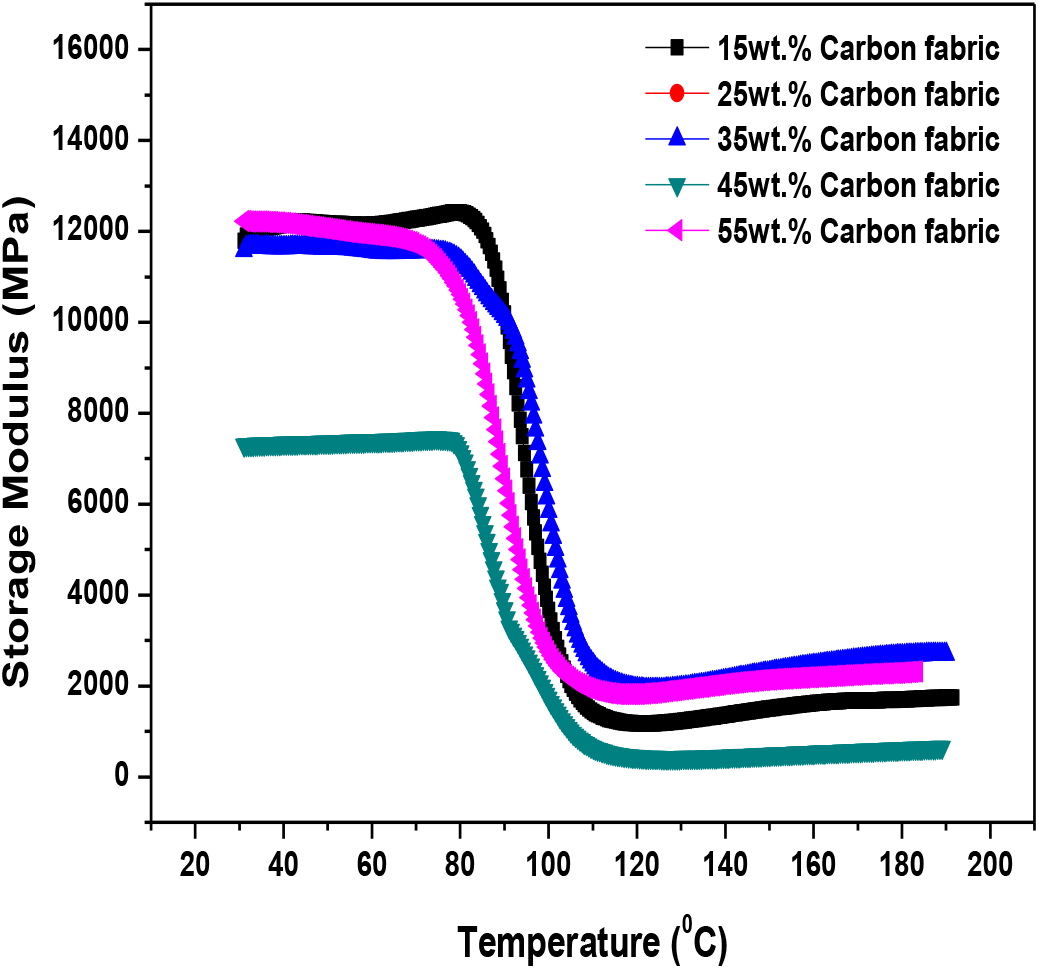
Figure 6. Storage modulus of carbon fabric reinforced epoxy composites
Increasing the values of temperature beyond will not produce appreciable effect on the properties of fibrous composites. The values of storage modulus nearly tend to zero which shows rubbery state beyond 100°C temperature. In rubbery region the material shows his viscous nature and does not stores energy further (Region 3). On comparison it is noticed that the values of carbon composites are exceptionally higher followed by kevlar and glass epoxy composites and the transition from glassy to rubbery regime is faster in glass composites than that of kevlar and carbon composites, this may be due to the material of fabric and its susceptibility towards rise in temperature. The higher values of storage modulus in glassy state is due to the fact that in glassy state, the contribution of elastic modulus is more than the viscous modulus whereas in glassy to rubbery state the material is in glass transition stage in which a change from glass state into rubber-elastic state takes place, from glassy to rubbery state, the storage modulus falls during heating to a level of one-thousandth to ten-thousandth of its original value[18]. However, at elevated temperature (rubbery region) there is a slight improvement in the value of storage modulus. Daiane et al. [19] observed that although mechanical properties improved for higher fiber content, the glass transition temperature does not have significant effect with the increase in reinforcement.
3.3.2 Effect of temperature on loss modulus of glass, kevlar and carbon fabric
In figure 7, 8 and 9 shows the graph of loss modulus verses temperature for glass, kevlar and carbon reinforced epoxy matrix composites respectively. The values of loss modulus determine the loss in energy storage capability of the material specimen with the increase in temperature. The values of loss modulus nearly remain constant up to 68°C, 78°C and 82°C i.e. the loss is minimum up to this temperature and composite material maintains its strength due to internal resistance. No appreciate change in the properties is noticed up to critical temperature limits of 68°C, 78°C and 82°C for glass, kevlar and carbon fabric respectively.
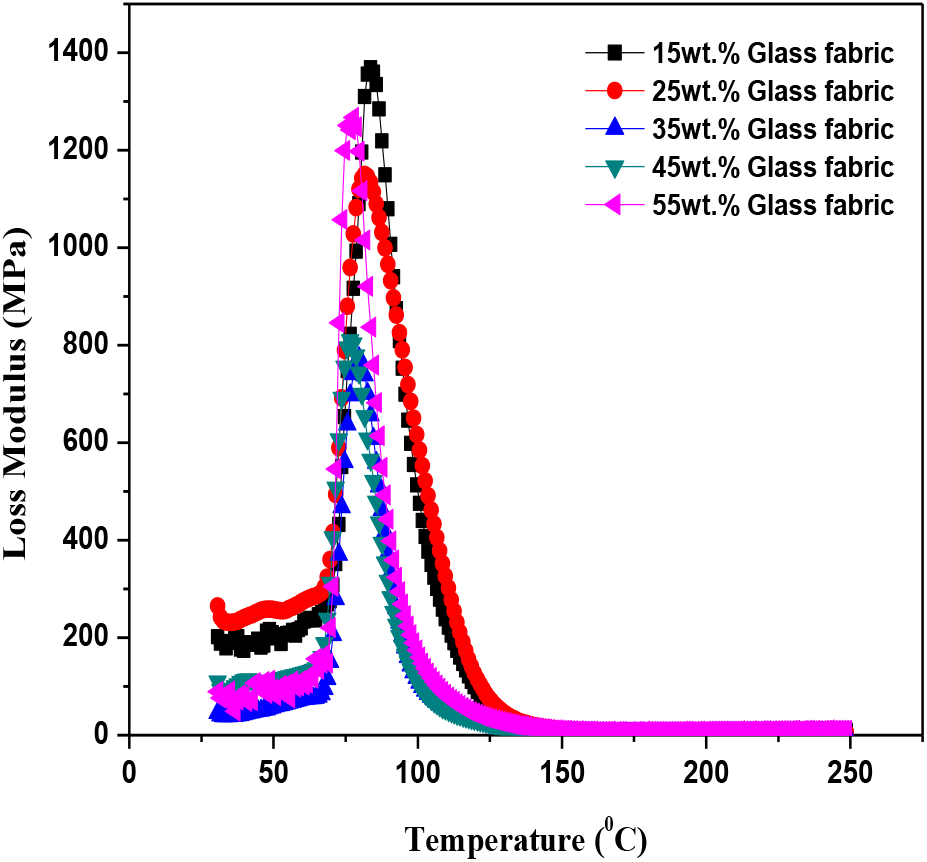
Figure 7. Loss modulus of glass fabric reinforced epoxy composites
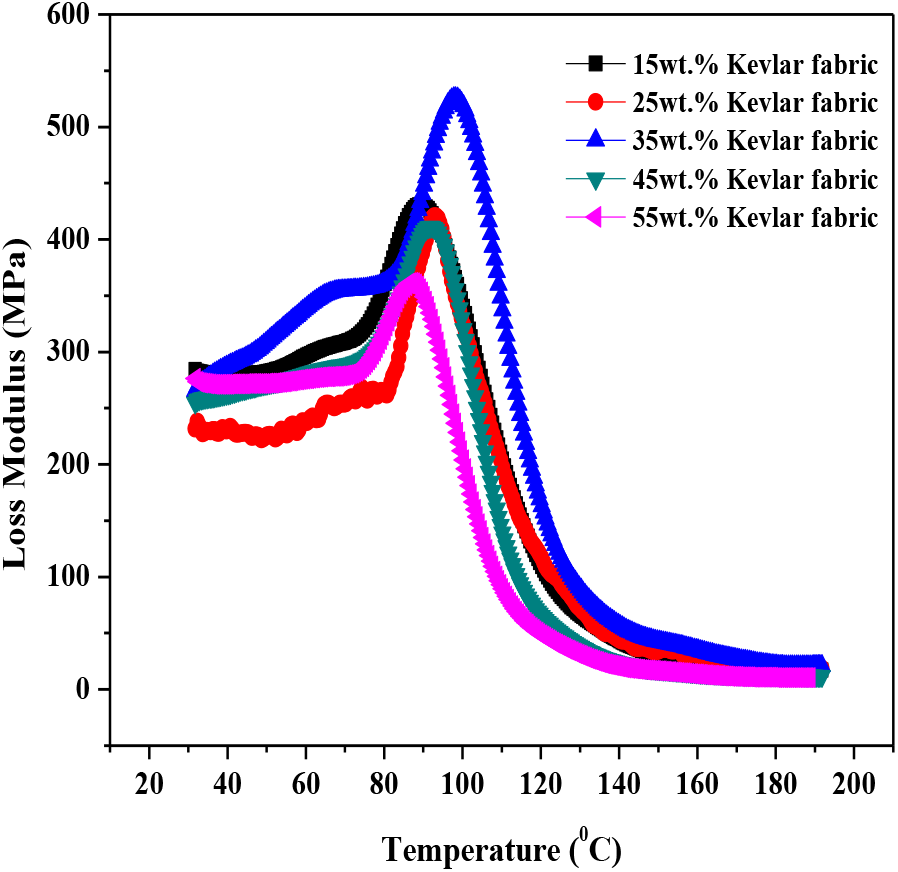
Figure 8. Loss modulus of kevlar fabric reinforced epoxy composites
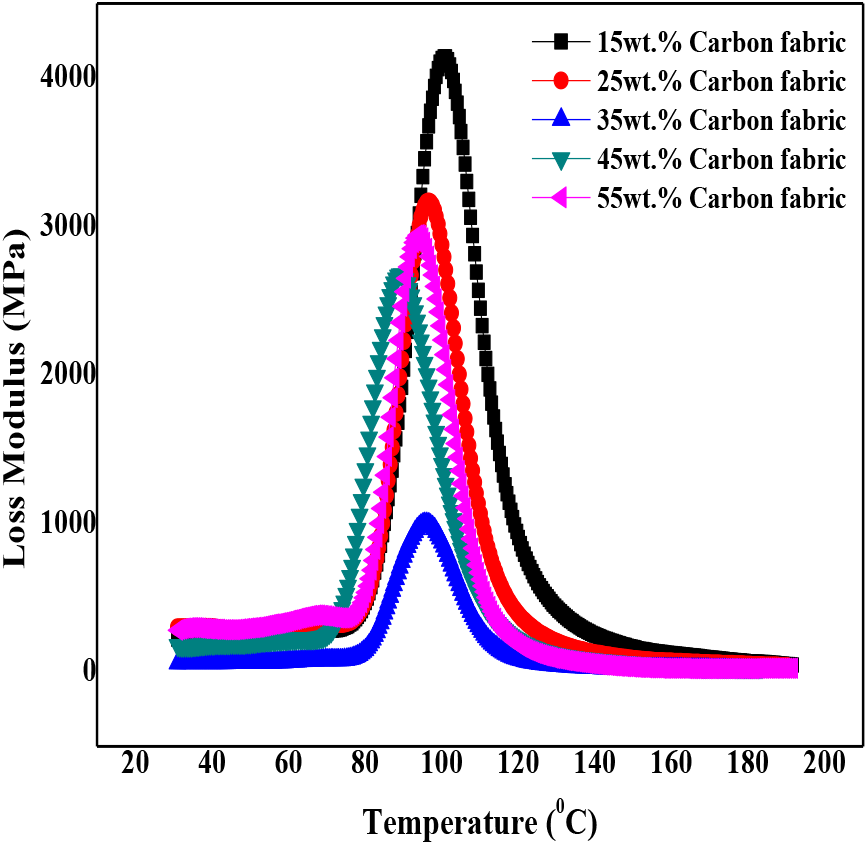
Figure 9. Loss modulus of carbon fabric reinforced epoxy composites
Increasing the value of temperature beyond 68°C, 78°C and 82°C result in sharp change in the value of loss modulus. Initially the values of loss modulus increases sharply, attain a peak value and then start decreasing rapidly. This is due to the fact that increasing temperature beyond critical limit results in decease in strength and internal properties of the polymer composite material in turn result in sharp increase in the value of loss modulus as shown in figure 7. Increasing the temperature beyond 100°C for glass, 110°C for kevlar and 114°C for carbon, the value of loss modulus almost attains a straight line with the slight decrease in the value of loss modulus is noticed with the increase in the value of temperature. This may be due to the fact that after appreciable decrease in internal strength of the material and the material changes from glassy to rubbery regime, internal strength of the material gets degraded and the values of loss modulus nearly remains content. It has also observed that for the composites with lower fabric content the shift in the loss modulus peak is more towards higher temperature [20]. This can be clearly verified from figure 9 i.e. for 15wt% glass fabric composites peak value of loss modulus is more than that for other percentage of fabric reinforcement. Also while comparing the loss modulus values of glass, kevlar and carbon fabric it is noticed that the loss modulus values of carbon fabric is the highest followed by glass fabric and kevlar fabric epoxy composites.
3.3.3 Effect of temperature on tan delta values of glass, kevlar and carbon fabric
Figure 10, 11 and 12 shows the behavior of tan delta for glass, kevlar and carbon fabric reinforced epoxy matrix composites respectively. The value of tan delta is a ratio of storage modulus to loss modulus and is measure of damping capacity of the material. By plotting the graph between temperature and tan delta values it has been established that the value of tan delta is proportional to the percentage of fabric reinforcement i.e. the value of tan delta attains a peak value at maximum percentage of fabric reinforcement. On comparing tan delta plots for glass, kevlar and carbon reinforced composites it has been noticed that the highest peak value of tan delta is obtained for 55wt% fabric reinforcement for glass reinforced composite. From figure 11 it is clearly shown that the overall damping response of kevlar fabric is better in comparison to that of glass and carbon fabric composites. The tan delta values for glass fabric 0.65 Hz whereas the tan delta value for kevlar and carbon fabric 0.38 Hz and 0.55 Hz respectively. Also in case of carbon fabric reinforced composites the peak value of tan delta attains at maximum temperature i.e. 114° C which is comparatively lower for glass and Kevlar fabric reinforced epoxy composites.
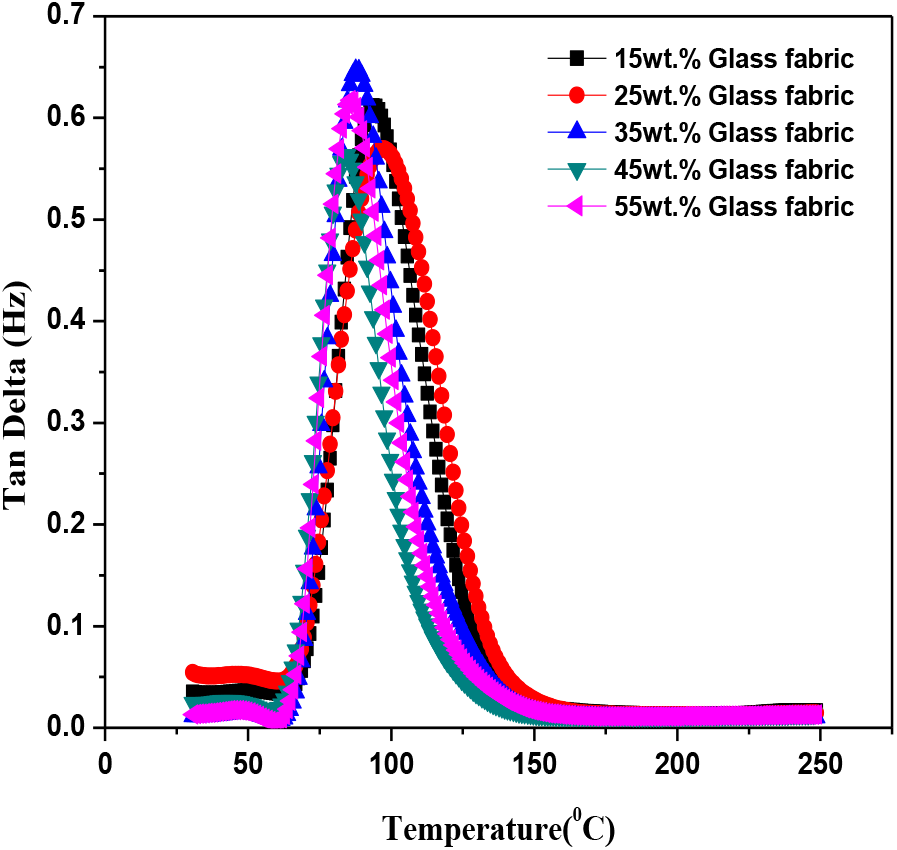
Figure 10. Tan Delta of glass fabric reinforced epoxy composites
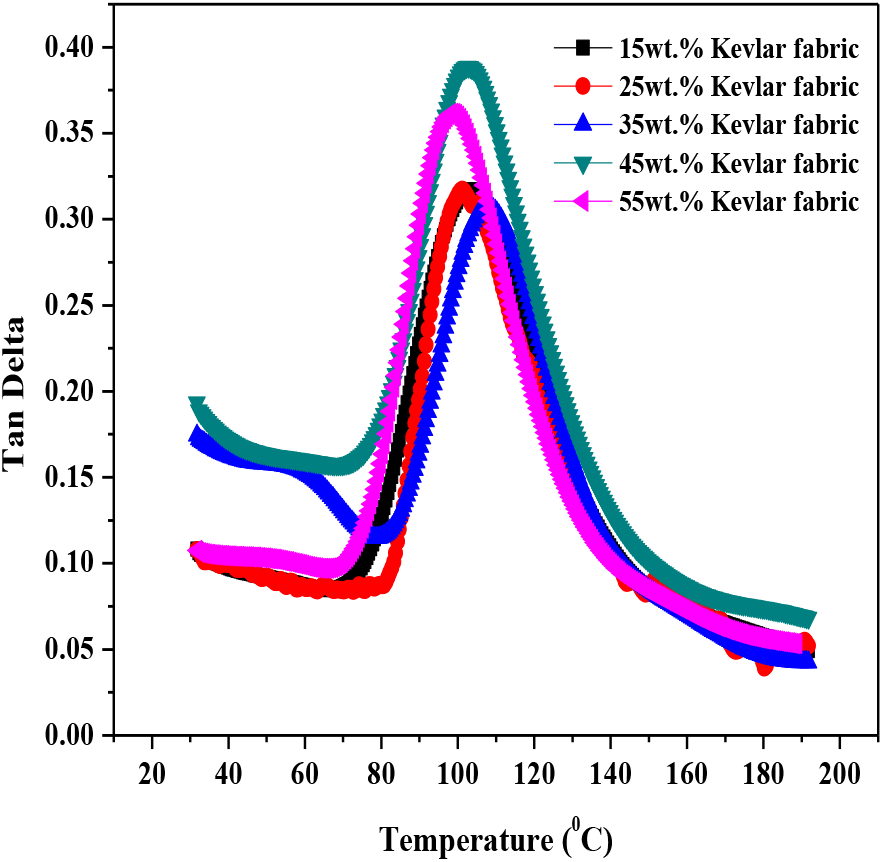
Figure 11. Tan Delta of kevlar fabric reinforced epoxy composites
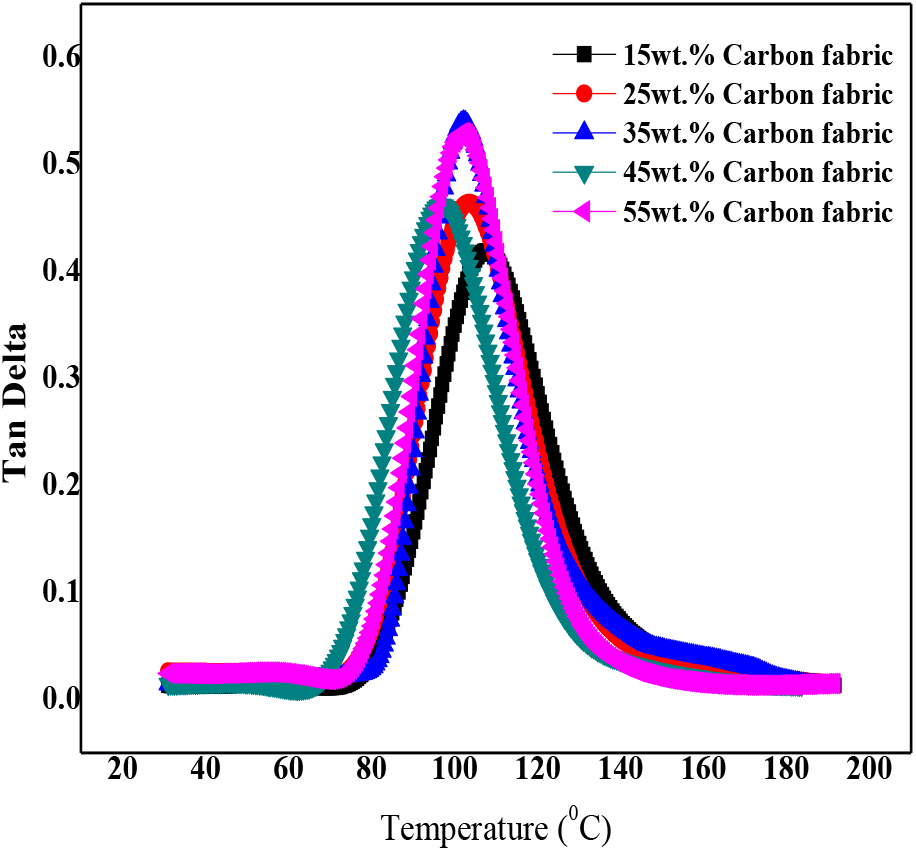
Figure 12. Tan Delta of carbon fabric reinforced epoxy composites
Based on the analysis performed to notice the effect of fracture toughness and damping response on glass, kevlar and carbon fabric reinforced epoxy composites following conclusions have been drawn:
• Composite specimens having higher fabric content bears less load for the corresponding displacement in comparison to that having lower fabric content. This is due to the fact that at higher fabric weight content the adhesion between the fabric and epoxy decreases which leads in reduction in strength.
• Kevlar fabric bears more spalling to peak load value in comparison to that of glass and carbon fabric reinforced epoxy composites. This may be due the synthetic nature (higher ductility) and higher compressive strength of kevlar fabric in comparison to that of glass and carbon fabric.
• Types of cracks noticed in kevlar and carbon fabric epoxy composites is of flexural – shear in nature whereas the cracks in glass fabric epoxy composites are purely flexure in nature.
• Higher energy absorption capabilities were obtained for kevlar fabric composites. The highest energy absorption is for composites having 25wt.% kevlar fabric epoxy followed by composites with 15wt% kevlar fabric in their epoxy composites.
• The energy storage capability of carbon fabric at elevated temperature is better in comparison to that of kevlar and glass fabric. Pure carbon fabric epoxy composites having strong retention in its properties are up to 82°C. Increasing the temperature beyond 82°C results in slight degradation in its properties.
• It has also observed that the strength retention capacity is better for composites with lower fabric content in comparison to the composites having higher fabric content.
• Overall damping response of kevlar fabric is far better in comparison to that of glass and carbon fabric composites. Also in case of carbon fabric reinforced composites the peak value of tan delta attains at maximum temperature i.e. 114°C.
References
1. P. K. Rohatgi, P. J. Blau and C. S. Yust. (Eds.“Tribology of Composite Materials”, ASM International, Materials Park, OH, 1990. [Google Scholar]
2. I. M. Hutchings, Tribology, Friction and Wear of Engineering Materials, CRC Press: London, 1992. [Google Scholar]
3. P. K. Mallick (Eds“Fiber Reinforced Composite: Materials, Manufacturing and Design”, Marcel Dekkar: New York, 1993. [Google Scholar]
4. P. H. Shipway and N. K. Ngao, Wear, 255 (2003) p.742. [Google Scholar]
5. X. Jia and X. M. Ling, J. Univ. Sci. Technol, Beijing, 10, (2003) p.44. [Google Scholar]
6. K. C. Ludema, Friction, Wear, Lubrication: A Textbook in Tribology, CRC Press LLC, 1996. [Google Scholar]
7. S. Feih, E. Boiocchi, G. Mathys, Z. Mathys, A. Gibson and A. Mouritz, Compos. B. Eng., 42(3),(2011) p.350 [Google Scholar]
8. N. K. Kim, S. Dutta and D. Bhattacharyya, Compos Sci Technol, 162, (2018) p.64. [Google Scholar]
9. S. Sharma, S. R. Dhakata, A. Majumdar and B. P. Singh, Carbon, 152, (2019) p.631. [Google Scholar]
10. M. Bulut, A. Erklig and E. Yeter, J. Compos. Mater., 50(14),(2015) p. 23. [Google Scholar]
11. U. A. Khashaba, Compos.: Part A, 68, (2015) p.164 [Google Scholar]
12. X. Tang and X. Yan, J. Ind. Text, 49(6),(2018) p.693. [Google Scholar]
13. Y. Rostamiyam, A. H. Mashhadzadeh and A. Fereidoon, Sci. Eng. Compos, 22(3),(2015) p.223 [Google Scholar]
14. American Society for Testing and Materials (ASTM). Standard E740M-03 (2016Standard Practice for Fracture Testing with Surface–Crack Tension Specimens, ASTM International, West Conshohocken, PA, 2016. [Google Scholar]
15. American Society for Testing and Materials (ASTM). Standard D7028-07 (2015standard test method for glass transition temperature (DMA Tg) of polymer matrix composites by Dynamic Mechanical Analysis (DMA), ASTM International, West Conshohocken, PA, 2015. [Google Scholar]
16. K. P. Menard (EdsDynamic Mechanical Analysis: A Practical Introduction, CRC Press 2008. [Google Scholar]
17. E. A. Turi (EdsThermal Characterization of Polymeric Materials, Academic Press, 1997. [Google Scholar]
18. H. L. Ornaghi, H. Silva, A. J. Zattera and S. C. Amico, Compos, Mat. Sci. and Eng. Part A, 528, (2011) p.7285. [Google Scholar]
19. D. Romanzini, A. Lavoratti, H. L. Ornaghi and S. C. Amico, Mater. Des., 47, (2013) p.9. [Google Scholar]
20. H. L. O. Jr, A. S. Bolner, R. Fiorio, A. J. Zattera and S. C. Amico, J. Appl. Polym. Sci, 118(2),(2010) p.887. [Google Scholar]
Cite This Article
 Copyright © 2022 The Author(s). Published by Tech Science Press.
This work is licensed under a Creative Commons Attribution 4.0 International License , which permits unrestricted use, distribution, and reproduction in any medium, provided the original work is properly cited.


 Submit a Paper
 Propose a Special lssue
 View Full Text
 Download PDF
 Downloads
 Citation Tools