
 Submit a Paper
 Propose a Special lssue
 Open Access
ARTICLE

Research on Robustness of Charging Station Networks under Multiple Recommended Charging Methods for Electric Vehicles
1 School of Information and Communication Engineering, Nanjing Institute of Technology, Nanjing, 211167, China
2 School of Automation, Nanjing Institute of Technology, Nanjing, 211167, China
* Corresponding Author: Peng Geng. Email:
Journal on Internet of Things 2024, 6, 1-16. https://doi.org/10.32604/jiot.2024.053584
Received 05 May 2024; Accepted 20 June 2024; Issue published 24 July 2024
 View Full Text
 Download PDF
Abstract
With the rapid development of electric vehicles, the requirements for charging stations are getting higher and higher. In this study, we constructed a charging station topology network in Nanjing through the Space-L method, mapping charging stations as network nodes and constructing edges through road relationships. The experiment introduced five EV charging recommendation strategies (based on distance, number of fast charging piles, user preference, price, and overall rating) used to simulate disordered charging caused by different user preferences, and the impact of the network dynamic robustness in case of node failure is explored by simulating the load-capacity cascade failure model. In this paper, two important metrics for evaluating network robustness are selected: the relative size of the maximum connected subgraph and the network efficiency. The experimental results point out that in the price recommendation strategy, the network stability significantly decreases when the node failure ratio reaches 75.4%, while the fast charging quantity recommendation strategy significantly decreases when the node failure ratio is 62.3%. Therefore, the robustness of the charging station network is best under the price recommendation, while the network robustness is poor under the fast charging quantity recommendation.While the network robustness is poor under preference recommendation. Based on this finding, this study particularly emphasizes that in the process of improving the robustness of the charging station network, it is necessary to comprehensively consider the market demand and guide users to charge in an orderly manner by reasonably adjusting the price strategy. This strategy not only effectively prevents network stability problems that may result from disorderly charging behavior, but also enhances the ability of the charging network to resist node failure and improves the overall dynamic robustness of the network.Keywords
In the context of the growing global emphasis on sustainable development, new energy vehicles are increasingly recognized as a crucial means to alleviate environmental pollution and reduce dependence on traditional energy sources. Consequently, their adoption rate is steadily increasing. However, with the widespread application of new energy vehicles, the issue of the layout and site selection of charging stations has progressively highlighted its significance. The arrangement of charging stations not only directly affects the utilization rate of charging facilities but also relates to the convenience of user charging and even the enhancement of the entire charging network’s operational efficiency. Therefore, how to effectively guide the charging behavior of EV users to improve the network robustness is the main issue of current research.
In the field of electric vehicle (EV) charging station research, Deb et al. investigated the impact of EV charging station loads on distribution network voltage stability, power losses, reliability metrics, and economic losses [1]. Li et al. developed Optimal Charging Station Deployment (OCSD), which utilizes a system based on historical EV taxi trajectory data, roadmap data, and available charging station information to optimize charging station layout and operation [2]. Ahmad et al. discussed the impacts of EV loads on the distribution network, environmental impacts, and economic impacts [3]. Huang et al. proposed two optimization models for two different charging modes (fast charging and slow charging) aiming to minimize the total cost [4]. Hosseini et al. proposed a Bayesian network (BN) model that takes into account not only quantitative but also qualitative (subjective) factors [5]. Yang et al. presented the problem of designing an EV battery service network taking into account customer satisfaction [6]. Yang et al. proposed a data-driven approach to optimizing the charging network of an EV by eliminating redundant charging stations from the existing charging station networks [7]. Qin et al. minimized the waiting time required for charging by spatially and temporally scheduling charging [8]. These research efforts have provided insights and approaches from multiple perspectives for the planning, operation, and optimization of EV charging stations; nevertheless, there is a dearth of systematic research on the critical area of charging station network robustness.
In light of this, the present paper aims to fill this research gap by constructing a topological network of charging stations and a load-capacity cascading failure model. We simulate network scenarios based on recommending strategies that comprehensively consider key factors such as the distance from users to charging stations, user preferences for charging stations, total charging costs, and the number of fast-charging piles. This paper delves into the robustness of charging station networks. Moreover, we employ network efficiency and connectivity as metrics to evaluate network performance, providing a comprehensive analysis of the robustness of charging station networks.
In the field of EV charging coordination strategy research, literature [9] developed a charging scheduling strategy using a Markov chain model combined with stochastic considerations of charging demand, aiming to effectively reduce the peak-to-valley difference in electricity demand and reduce the charging cost for users. Another study [10] designed a charging recommendation mechanism aiming to minimize the total charging time of taxis by analyzing their GPS data. Although existing charging post-recommendation algorithms have made progress on specific objectives, such as reducing charging cost [9] and shortening charging time [10], these studies tend to focus on a single optimization objective and lack a comprehensive and balanced solution.
This study aims to fill a gap in the existing research field by constructing a charging station topology network model in which each charging station is considered a node in the network and the corresponding nodes are connected to each other through an edge when there is a road network connection between two charging stations. In addition, this study constructs a load-capacity cascade failure model and introduces five recommended strategies to analyze the specific impact on the robustness of the charging station network. The model assumes that once a charging station receives a load that exceeds its capacity limit, the station becomes unavailable and transfers the load it was carrying to neighboring stations. This mechanism leads to a redistribution of loads in the network, which in turn triggers a series of cascading failures, posing a potential threat to the stability of the network. The study further analyzes the robustness of the charging station network in depth, using the relative size of the maximum connectivity subgraph and the network efficiency as a measure of robustness. Given that the disorderly charging behavior of electric vehicles may trigger group effects and pose potential threats to the stability of the power grid, it is particularly important to systematically analyze the robustness of the charging station network.
Through this research, we hope to more accurately reveal the intrinsic principles of the robustness of charging station networks and propose targeted preventative measures to enhance the safety and reliability of the entire charging station network. This will not only help promote the further development of new energy vehicles but also offer theoretical support and practical guidance for the optimized layout and efficient operation of charging station networks.
The remainder of this paper is structured as follows. Section 2 introduces the proposed construction of the charging station topological network and the load-capacity cascading failure model, along with the recommendation strategy method. In Section 3, we evaluate the charging station network and analyze the experimental results. Finally, in Section 4, we conclude and discuss future work.
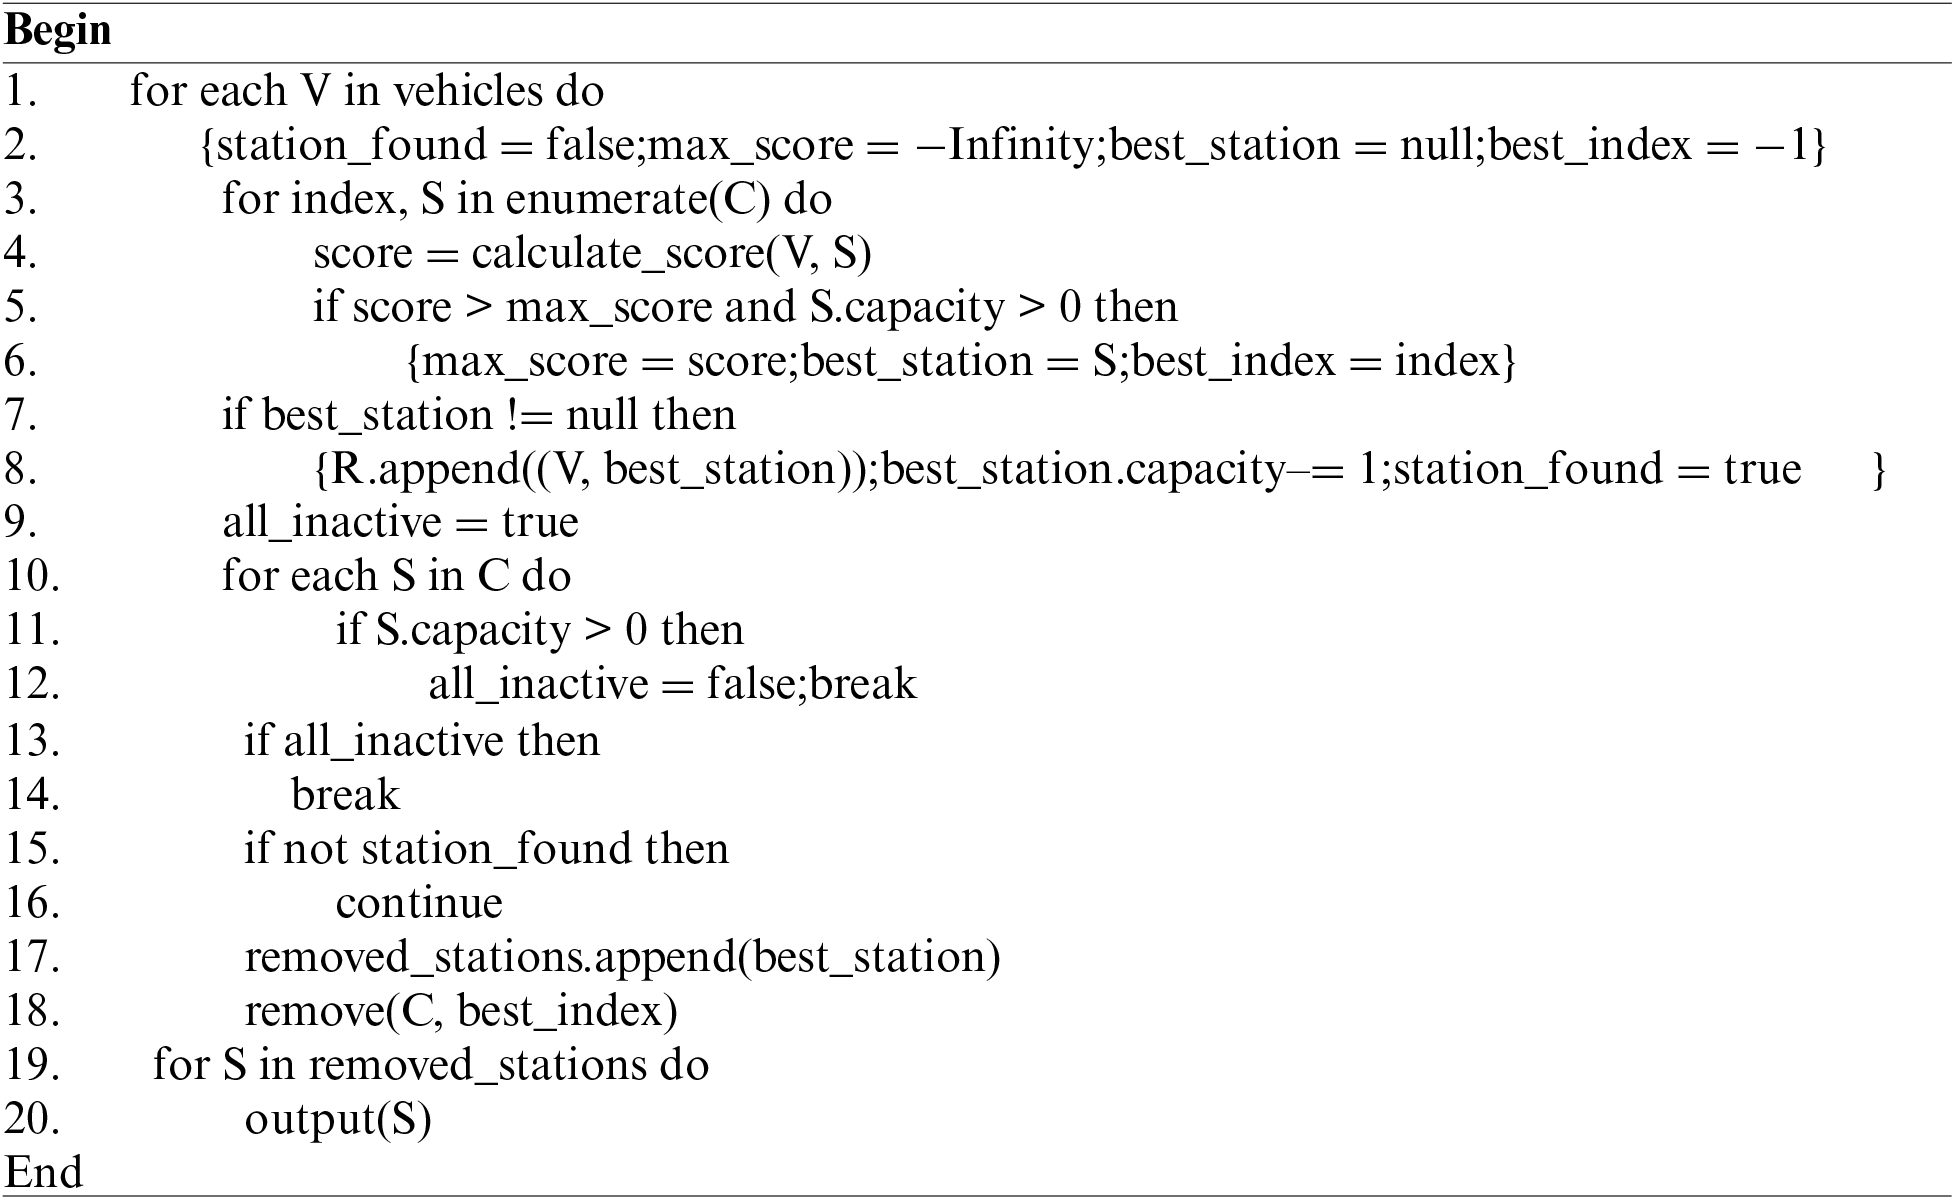
This study initially selects Global Positioning System (GPS) data of online ride-hailing vehicles and charging station data in Nanjing, Jiangsu Province, as the fundamental information sources. To identify charging behaviors, we assume that the longest parking duration at the start time during a day for each ride-hailing vehicle signifies the beginning of the charging period. Subsequently, we introduce the Space-L method to construct the Nanjing charging station network model. Within this network, a load-capacity cascading failure model is established. Next, five electric vehicle charging recommendation strategies are introduced, including distance recommendation, fast-charging pile quantity recommendation, preference recommendation, price recommendation, and comprehensive recommendation, which recommend the corresponding charging stations for each vehicle in chronological order. When the load of the charging station exceeds its own capacity, the load carried by the charging station is assigned to the neighboring nodes, which triggers the cascade failure effect. In addition, this study analyses the dynamic robustness of the model and the impact of the recommended policy on the robustness. The exact flow of this study is shown in Fig. 1. The following is the pseudo-code of this thesis.
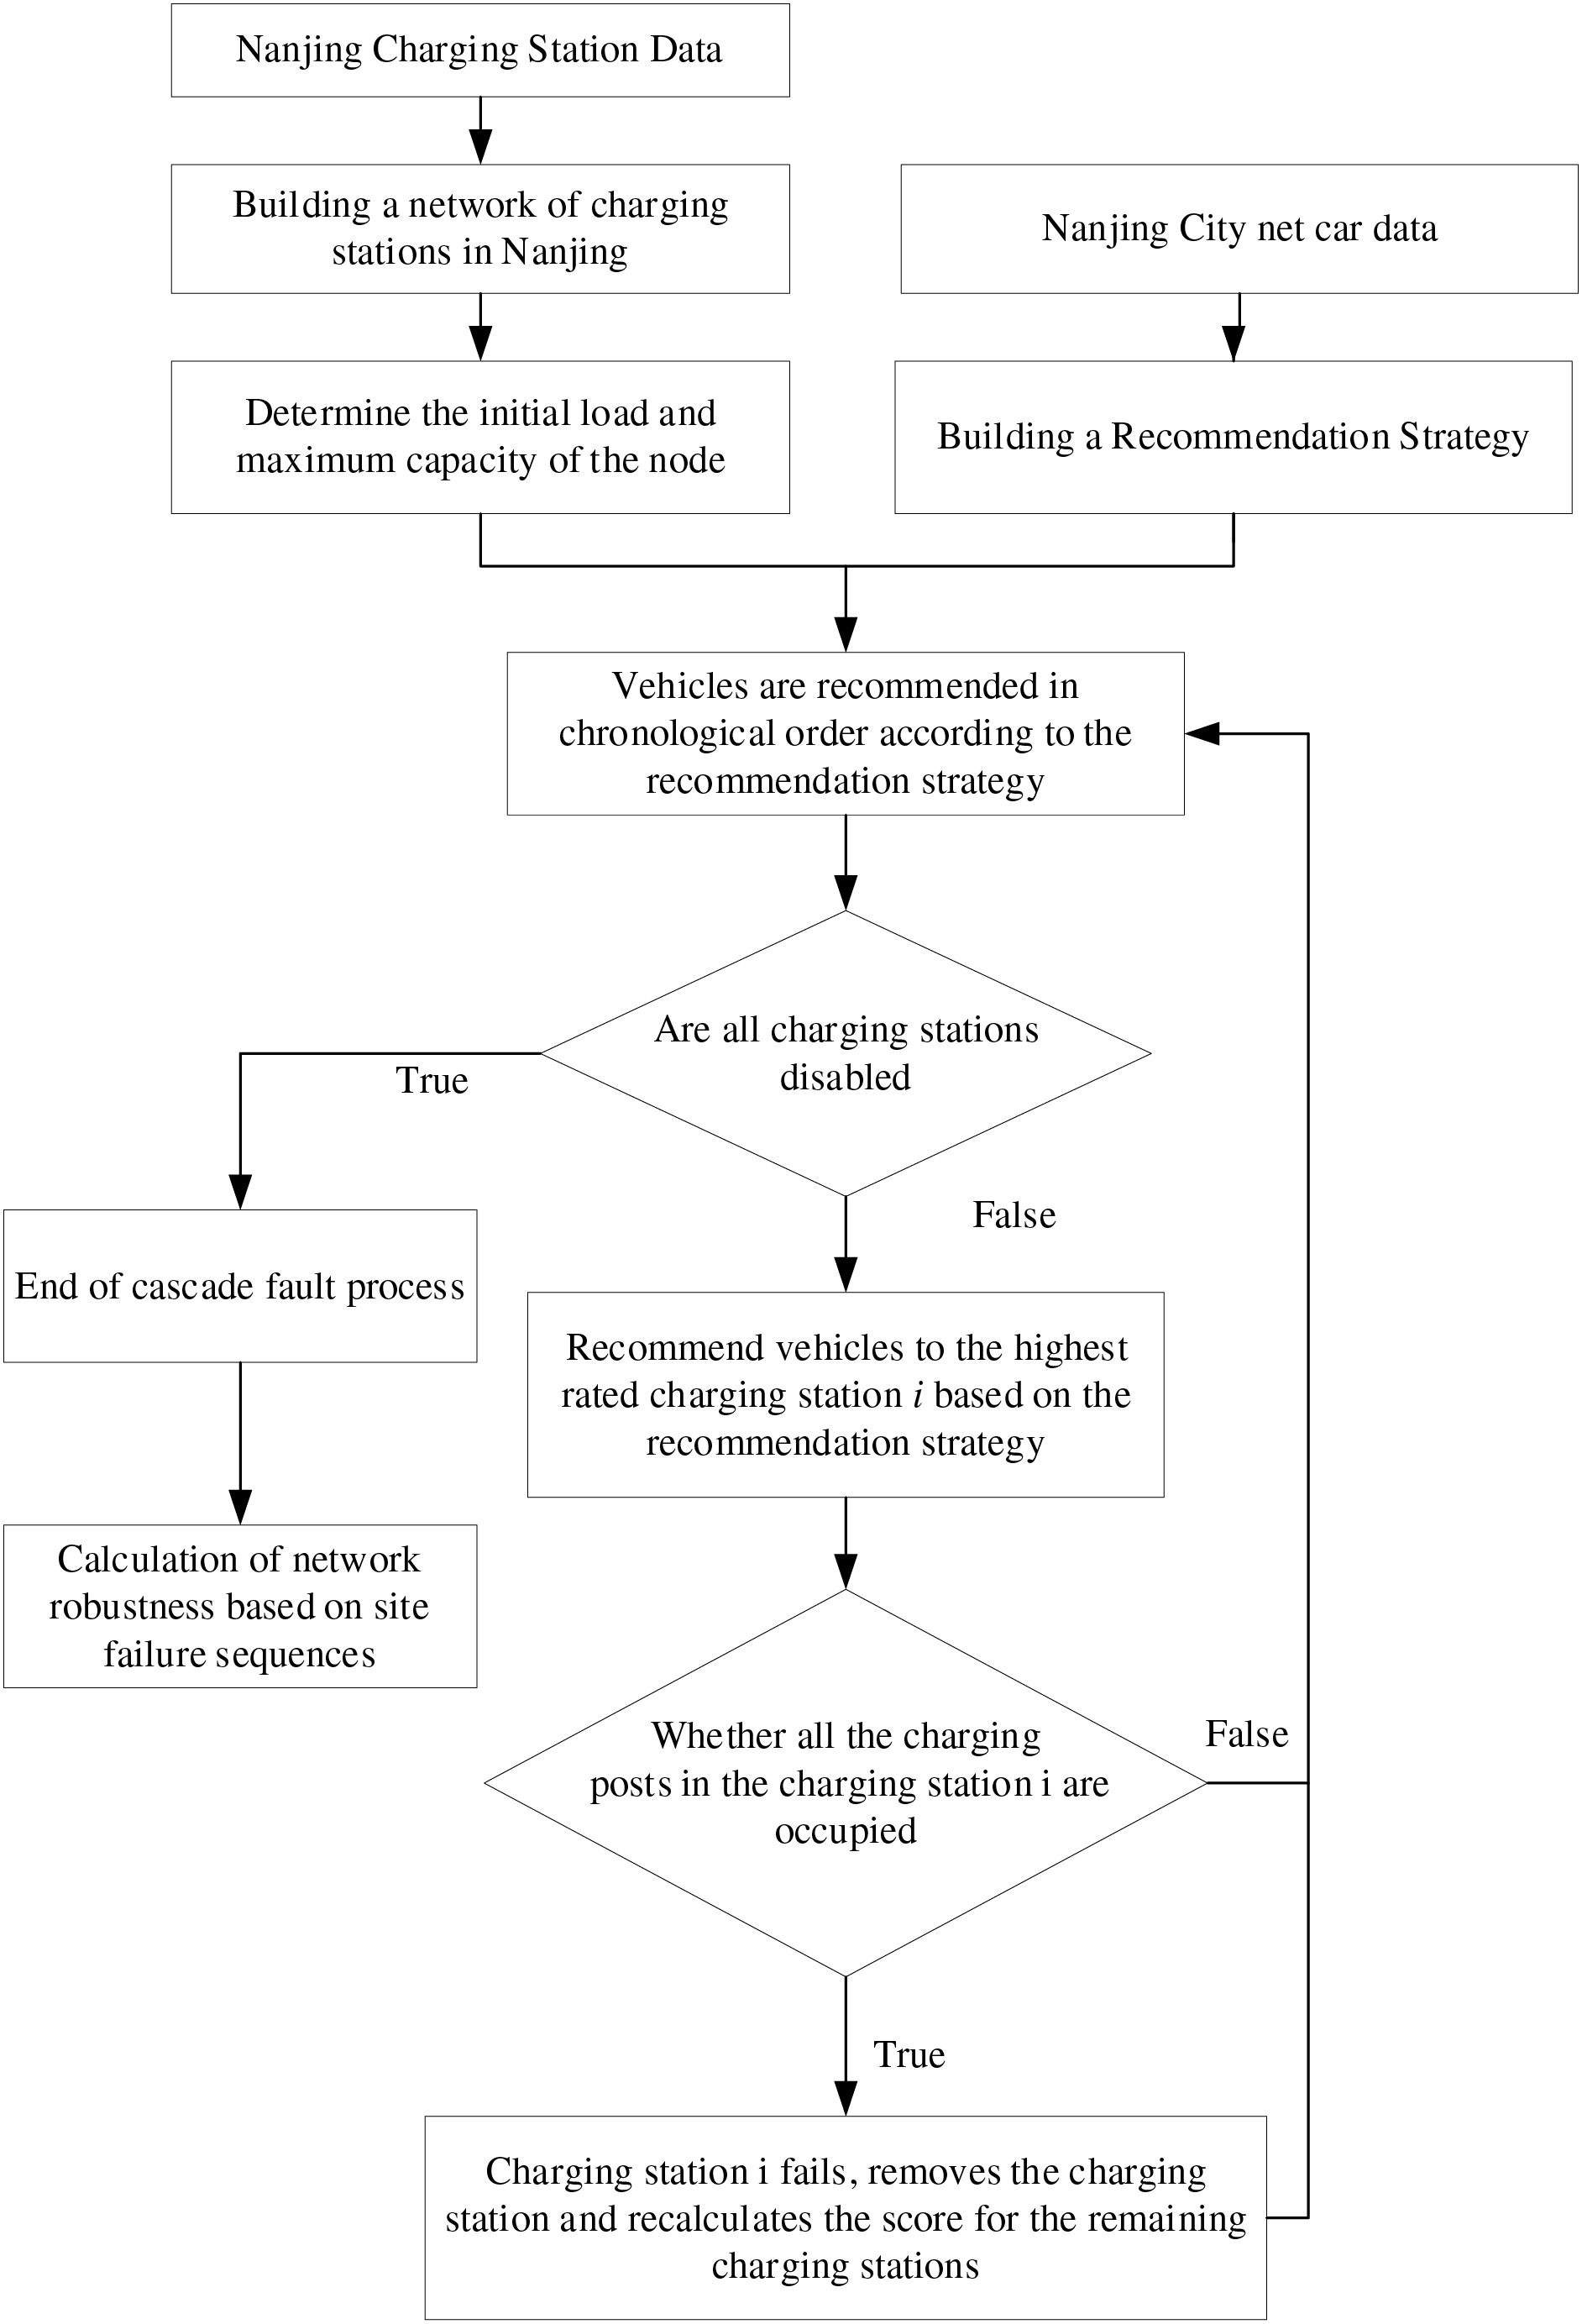
Figure 1: Model framework diagram
R: This is an empty list to store the recommended vehicle-charging station pairing results
S: Charging station
C: List of charging stations
V: Vehicle
2.1 Charging Station Network Construction
Existing network construction methods can mainly be summarized into four types: Space-L [11], Space-P [12], Space-B [13], and Space-C [14]. The core of the Space-L method lies in transforming real-life trajectories and public transit stops into nodes within the network, with edges representing the physical connections between stops. If two stops in reality are not connected, they are not directly linked in the network model either. This transformation intuitively depicts the topological structure of transportation networks and provides significant value for analyzing the network’s own construction and fundamental operational performance.
In this study, we apply the Space-L method to establish the charging station network model. The model uses charging stations as nodes and determines whether to establish an edge between nodes based on the direct road connection within 10 kilometers. This not only visually presents the structure of the charging station network but also facilitates a macroscopic analysis of the network’s layout and functionality. The topology of the established Nanjing charging station network model is shown in Fig. 2.
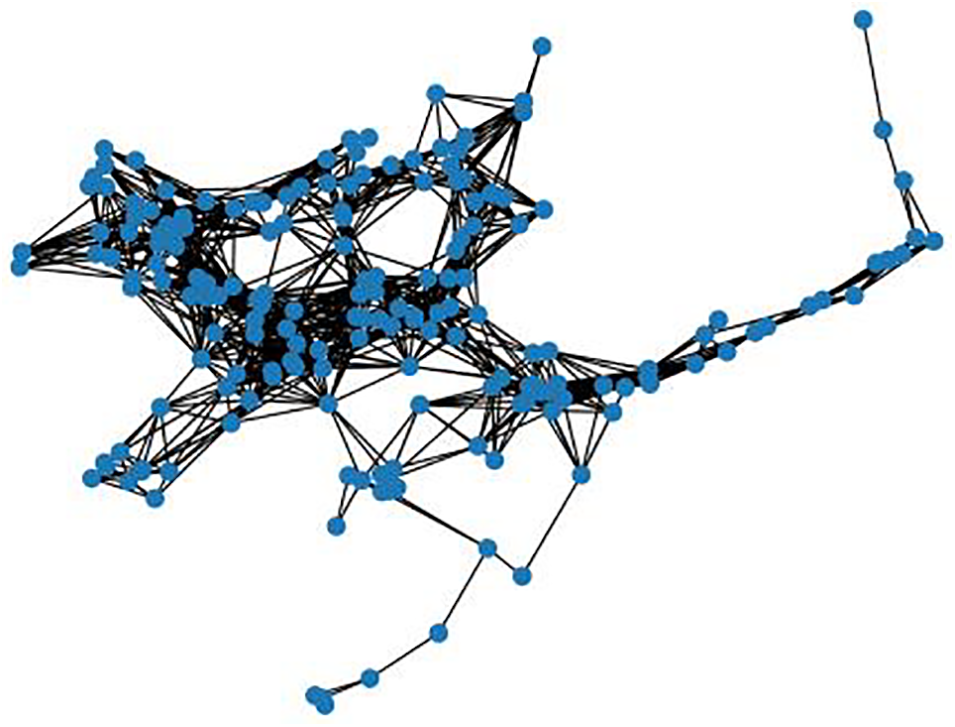
Figure 2: Topology of Nanjing charging station network
2.2 Recommendation Strategy Construction
In order to evaluate the robustness of the network, five recommendation strategies based on electric vehicle (EV) charging demand are selected in this study to mimic the users’ psychological preferences so as to simulate the disordered charging caused by different user preferences. Specifically, these include distance recommendation, fast-charging pile quantity recommendation, preference recommendation, price recommendation, and total score recommendation [15].
Distance Recommendation Strategy: This strategy calculates the physical distance (in meters) between each vehicle and all charging stations based on Nanjing’s road network data. Considering consumers’ tendency to choose nearby charging, this method optimizes travel paths to help users shorten journey times and improve overall efficiency.
Fast-Charging Pile Quantity Recommendation Strategy: This strategy makes recommendations based on the number of fast-charging piles provided by charging stations in Nanjing. Fast-charging piles at charging stations are highly attractive to users because they significantly reduce the time cost of charging electric vehicles. The recommendation system prioritizes stations with a greater number of fast-charging piles, thereby enhancing the convenience and efficiency of user charging.
Preference Recommendation Strategy: In the initial analysis phase of this strategy, the distance between ride-hailing vehicles and all charging stations within Nanjing is calculated, and charging stations within a 10-kilometer range are selected. If there are more than five stations within the range, five are randomly chosen; if fewer than five, all available stations are included. Subsequently, random preference values (integers from 1 to 10) are generated for these charging stations to simulate user satisfaction levels, thereby inferring their future choices of charging stations.
Price Recommendation Strategy: In this strategy, price information from various charging stations in Nanjing is collected, including charging fees and service fees at different times, with the total defined as the cost per kilowatt-hour (unit: yuan/kWh). The recommendation system guides users to stations with lower total costs to alleviate their financial burden.
Total Score Recommendation Strategy: This comprehensive strategy takes into account four factors: charging cost, time efficiency, user preference, and geographical location. It transforms the multi-objective planning problem into a fuzzy single-objective planning problem, assigns corresponding weights according to the importance of each objective function, performs linear weighted processing, and derives the final comprehensive score to recommend the best charging station to users.
In summary, the above recommendation strategies are constructed to improve network robustness by guiding the charging behavior of EV users.
2.3 Construction of the Load-Capacity Cascading Failure Model
If a site receives more load than its own capacity, it will also fail and the load it carries will be further distributed to its neighboring sites, thus triggering a cascade failure scenario [16]. In this thesis, for the new energy vehicle charging station network, the quantitative metric of load is defined as the total number of charging requests processed by the current charging station. Load is a real-time variable, which can visually reflect the usage of the charging station at any moment in time. At each time point t, each charging station i receives a certain number of charging requests, which is denoted by Ri (t), and the load quantity Li is defined as the total number of charging requests processed by charging station i at time t. Therefore, in each iteration, when a new charging request arrives, Li (t) is updated with the new number of requests Ri (t). The real-time load of the charging station, Li (t), is given by the following equation:
In this study, ‘Capacity’ is used to describe the maximum service capacity of the charging station, i.e., how many electric vehicles can be charged at the same time, which directly reflects the efficiency of the charging station’s charging pile utilization. Therefore, if charging station i has Pi charging piles, its capacity Ci at any given moment t can be calculated by subtracting the number of currently occupied charging piles (i.e., the load Li (t)) from the total number of charging piles Pi, as given in the following equation:
Upon completion of the above steps, the model will advance to the next time point t + 1, and repeat the process to simulate the dynamic behavior of the charging station network over successive periods. The iteration of the model will continue until a specific termination condition is met. The termination condition of this model is defined as all the charging stations reaching the failure state at the same time, i.e., at any time point t, the whole charging network is considered to have reached the failure state if all the charging stations have a load Li (t) greater than their capacity Ci. Specifically, if Li (t) > Ci is satisfied at a time point t for all charging stations i in the network, the iteration of the whole charging network terminates at this time point.
By simulating cascading failures, this study aims to reveal the robustness of the charging station network when faced with overloading situations and to provide a scientific basis for developing preventive measures and improving the robustness of the charging network.
In this study, we aim to construct and optimize the charging station network model to enhance its stability in the face of unexpected events and provide theoretical support for the robustness of the charging station network. The study first adopts the Space-L method to construct a topological network model of charging stations in Nanjing, Jiangsu Province, based on the GPS data of networked vehicles in Nanjing. In this model, each charging station is abstracted as a node in the network, while the road links between nodes are represented by edges. Further, we introduce a load-capacity cascade failure model in this network, where the load is defined as the number of charging requests currently being processed by the charging station, Capacity, on the other hand, refers to the number of electric vehicles that a charging station can serve at the same time, i.e., its charging post utilization rate.
In this study, five EV charging recommendation strategies (based on distance, number of fast charging piles, user preference, price, and overall score) are designed to mimic users’ psychological preferences. When the load of a charging station exceeds its capacity, the station is regarded as a failed node and its load is redistributed to neighboring nodes, triggering cascade failure, which has an impact on the stable operation of the network. Therefore, the study and prevention of cascading failure is important to ensure the stability of the charging station network. Through dynamic robustness analysis, this study aims to reduce the potential impact of cascade failure on the network.
To ensure the accuracy of the analysis, this study selected the GPS data of the network from 23 to 27 October 2019, compared the charging behaviors on weekdays and weekends, and divided the data into five intervals according to different times of the day (0–8 h, 8–11 h, 11–17 h, 17–22 h, and 22–24 h) in order to carry out a detailed time period analysis. On this basis, the experiment used the five charging recommendation strategies described previously to simulate the load transfer to neighboring stations when the charging station load is overloaded. It is found that the results of network robustness analysis for each time period under different recommendation strategies are consistent, therefore, this paper takes the time period of 0–8 h on weekdays as an example to explore in depth the key factors affecting the dynamic robustness of the network under different recommendation strategies.
This experiment is written in Python in pycharm 2021 and conducted on a computer equipped with 16 GB RAM and AMD Ryzen 7 5800 H with Radeon Graphics@3.20 GHz processor. The charging cost data of the charging station is obtained from “ChargeBar”, the latitude and longitude data is obtained from Baidu map API, and the geographic coordinate system is wgs84. The distance from the EV to the charging station is obtained from “OpenStreetMap” to obtain road network data for calculation. The GPS data of Nanjing, Jiangsu Province on the 23rd and 27th of October 2019 were selected, and about 6,000 vehicles operated on each of these five days.
Before this experimental simulation, the following assumptions were made:
1. Each ride-hailing vehicle is an electric vehicle.
2. Each ride-hailing vehicle charges once a day.
3. The start time of the longest parking duration during the day is considered the charging demand time.
4. The recommended charging station for each ride-hailing vehicle prioritizes the use of fast-charging piles.
5. Each ride-hailing vehicle can also travel to a recommended charging station when its battery is low.
6. Each ride-hailing vehicle will be driven to the recommended charging station to charge when the battery is low, and no further consideration will be given to the next charging station.
7. The type, battery capacity, and battery SoC are the same for each ride-hailing vehicle.
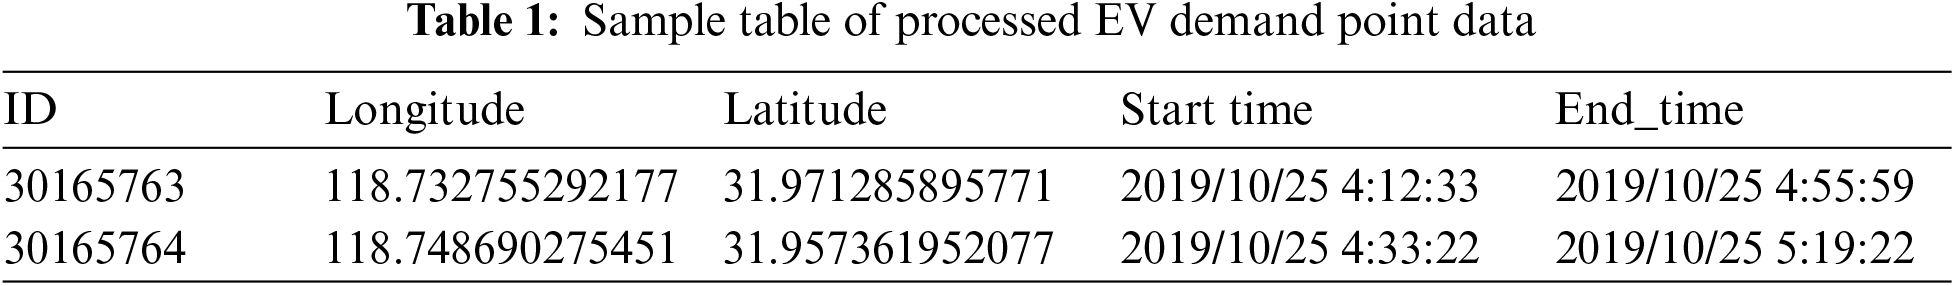
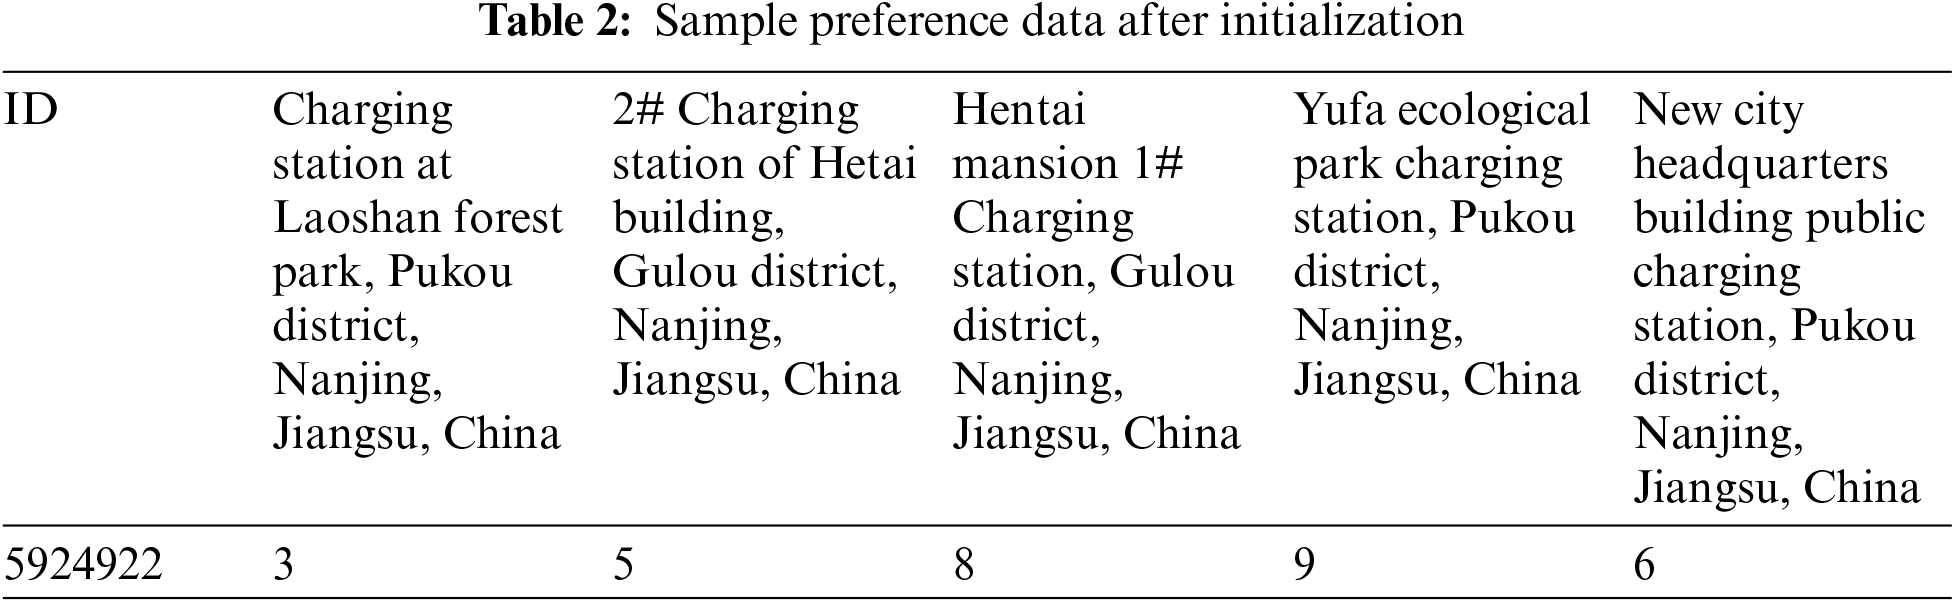
The start_time represents the start time and end_time represents the end time of the GPS data record of the netbook car in Nanjing used in this paper, and the start time to the end time is the period of the netbook car that has the longest stopping time in this day. The user preference data for charging stations used in this study is calculated based on the latitude and longitude data for charging stations within 10 km and randomly initialized from 1–10 for five of the charging stations, and if there are fewer than five charging stations within 10 km then the preference is initialized for all charging stations within 10 km. The preprocessed network car data is shown in Table 1 and the preference degree data is shown in Table 2.
3.3 Recommendation Model Simulation
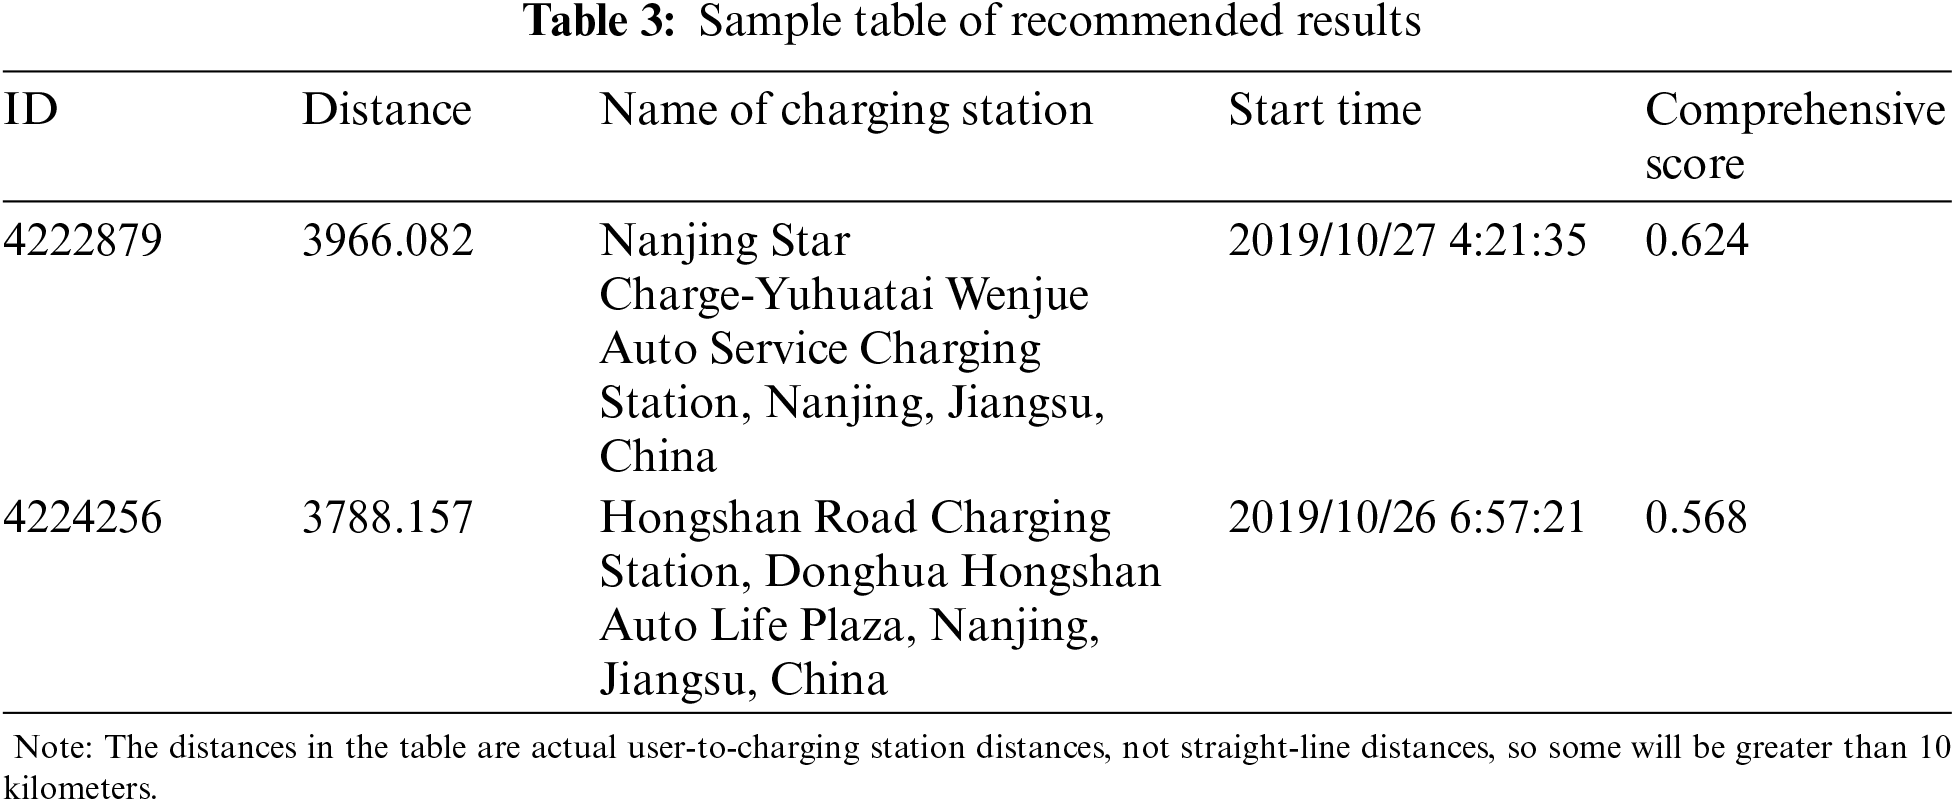
In this paper, the total score recommendation strategy, the weights of charging price, charging time, preference of charging station, and distance to charging station are set as 0.38, 0.32, 0.25, and 0.05. The recommended output is shown in Table 3.
The robustness of a network means that the network maintains most of its connectivity and functionality after removing some nodes. This means that the network is resilient to node failures, attacks, or other anomalies. Robustness can be measured in many ways, and in this study, maximum connectivity subgraph and network efficiency are used as evaluation metrics. If some nodes are removed, maximum connectivity subgraph and network efficiency, then the network is considered to have high robustness.
(1) Nodal degree
In the topology study of charging station networks, node degree is a basic and important metric, which indicates the number of other charging stations that a charging station is directly connected to. The level of node degree directly reflects the connectivity breadth of the charging station in the network and is a key indicator for assessing the network connectivity density and the closeness of the relationship between nodes. A charging station with a high node degree usually plays the role of a hub in the network, which has an important impact on the stability and scalability of the network.
(2) Number of nodes
The number of node mediators is another important indicator of node centrality in a network, which describes how often a node acts as a mediator of paths between other pairs of nodes in the network. Specifically, charging stations with a high node mediator number act as key intermediary points for information transfer and resource allocation in the network, and their location is critical to the overall efficiency and performance of the network. The analysis of the number of node mediators helps to identify key nodes in the network, which are of particular value in optimizing the network structure, improving the efficiency of resource allocation, and developing emergency response strategies. The study of node mediators provides a deeper understanding of the dynamic characteristics and potential optimization space of charging station networks.
(3) Maximum connectivity subgraph
Connectivity is an important metric for assessing the structural robustness of a network, reflecting its ability to maintain connectivity in the event of node or link failures. Mathematically, it is defined as the scale of the largest connected subgraph relative to the total size of the network and can be calculated using the following formula [17]:
where |V’d| is the number of nodes in the largest connected subgraph, and |Vd| represents the total number of nodes in the network. The value of connectivity ranges between 0 and 1, with a higher value indicating stronger overall connectivity of the network. Even if some nodes fail, the network can still maintain a high degree of connectivity, thus reflecting the good robustness of the network.
(4) Network efficiency
Network efficiency measures the efficiency of information transmission within the network. It is based on the average of the reciprocals of the shortest paths between all pairs of nodes in the network. A network with high efficiency can maintain efficient information transmission even when nodes fail, making network efficiency an important metric for measuring network robustness. The formula for network efficiency is as follows [18]:
where |Vd| is the total number of nodes, and did is the shortest path between node i and node j. The denominator |Vd|(|Vd|– 1) accounts for all possible combinations of node pairs in the network, while the numerator is the sum of the reciprocals of the shortest paths between these node pairs. It is worth noting that when there is no path connecting node i and node j, the distance can be considered infinite, and its reciprocal is zero.
(5) Node failure ratio
Node failure ratio is an important metric to assess the robustness and fault tolerance of the network, which can help in assessing the magnitude of the attack on the network, the node failure ratio is calculated using the following formula:
where |V| represents the number of failed nodes in the network and |Vd| represents the total number of nodes in the charging station network.
The maximum connectivity subgraph and efficiency of the network can be quantitatively evaluated by the above formulae and used as objective metrics for evaluating the robustness of the net-work. In empirical analyses, the change of these two metrics can be calculated by simulating the network subjected to random failures or purposeful attacks to study the robustness properties of the network.
3.5 Experimental Results and Analysis
In this study, we introduce five recommendation strategies based on distance, number of fast-charging piles, user preference, price, and total rating, which have not been explored in previous analyses of the dynamic robustness of EV charging station networks. These five strategy simulations provide a unique perspective to analyze and understand the influencing factors of charging network robustness. In a significant difference from the work of Zhang et al. [19], Zhang et al. focused on modeling the impact of random attacks and four specific malicious attacks on charging station network robustness. In contrast, our study focuses on modeling the dynamic impact of user behavior on the robustness of charging station networks through different recommendation strategies. The analysis of experimental results in this study is divided into two main parts: dynamic robustness analysis and recommendation strategy analysis.
In the dynamic robustness analysis section, we focus on evaluating the stability and generalization ability of the network under different conditions. To this end, we examined the relative size of the maximum connected subgraph of the network as well as the network efficiency metrics and compared the performance under various scenarios through simulation experiments with real data tests. As shown in Figs. 3 and 4, under the influence of different recommendation strategies, both the network efficiency and the relative size of the maximum connected subgraph show a decreasing trend as the node failure ratio increases. In particular, the data in the figures show that the relative size of the maximum connected subgraph shows a sharp decrease at specific node failure ratios under five different recommendation strategies. Table 4 provides the node failure ratios that lead to a sharp decrease in the relative size of the maximum connected subgraph under each recommendation strategy, as well as the higher and lower values where the relative size of the maximum connected subgraph decreases sharply. In addition, the network efficiency and robustness evaluations under these node failure ratios are listed in the table, thus providing a quantitative perspective for evaluating the impact of different strategies on network stability. The failure of the five stations under these five node failure ratios results in a sharp decrease in the relative size of the maximum connectivity subgraph and the charging station network is essentially paralyzed. Therefore, these five nodes are considered to be the critical nodes of the network, and they are essential for maintaining the integrity and functionality of the entire charging network. The failed critical nodes are shown in Fig. 5. The changes in network performance metrics under the failure ratio of critical nodes are shown in Table 4. Sites that fail under the preference recommendation strategy are not considered in the dynamic robustness analysis due to the random nature of their generation. However, it is worth noting that the other four failed sites are geographically close to each other and they are more densely connected. While this dense connectivity facilitates the rapid reorganization of the network after the failure of a single site, it also increases the vulnerability of the network, as the failure of a single site may have a knock-on effect on neighboring sites. The node degrees of these four sites are 13, 26, 20, and 23, while the node medians are 0.0227, 0.0460, 0.0041, and 0.0137, respectively, showing their different roles and importance in the network; however, it is worth noting that not all sites identified as critical nodes have high node degrees or high node medians. This observation suggests that when assessing the importance of a node, it is important not to rely solely on the two metrics of node degree or node mediator number. Instead, a more comprehensive assessment framework that takes into account the multiple roles and potential influence of nodes in the network is needed.
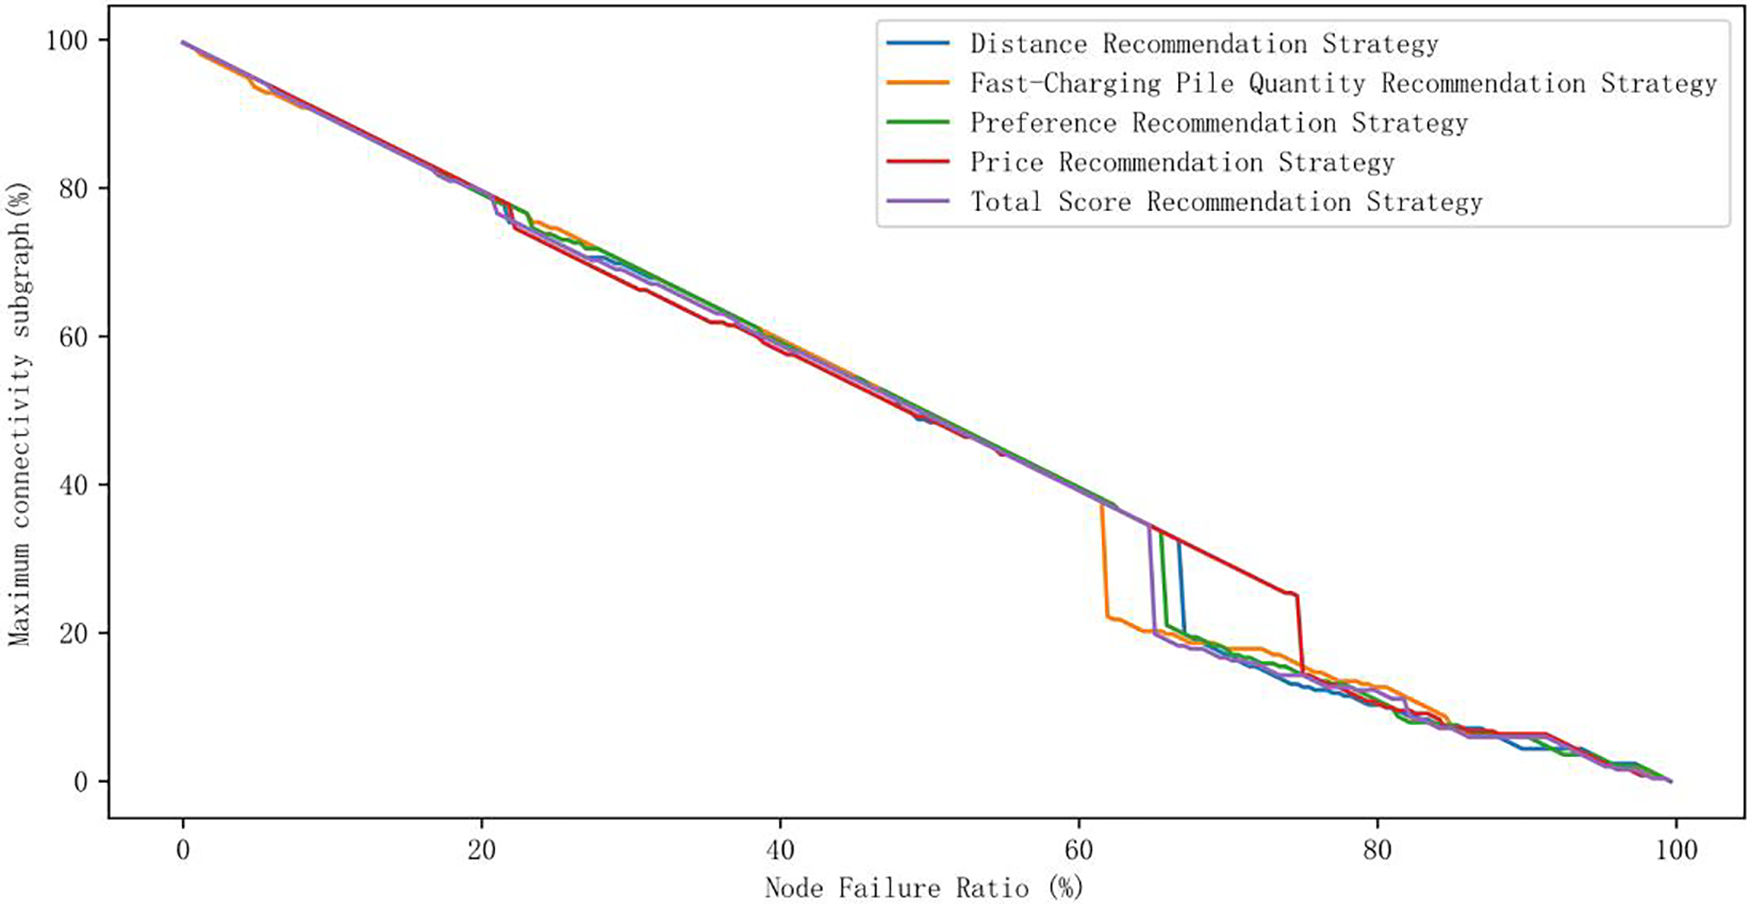
Figure 3: Maximum connectivity subgraph
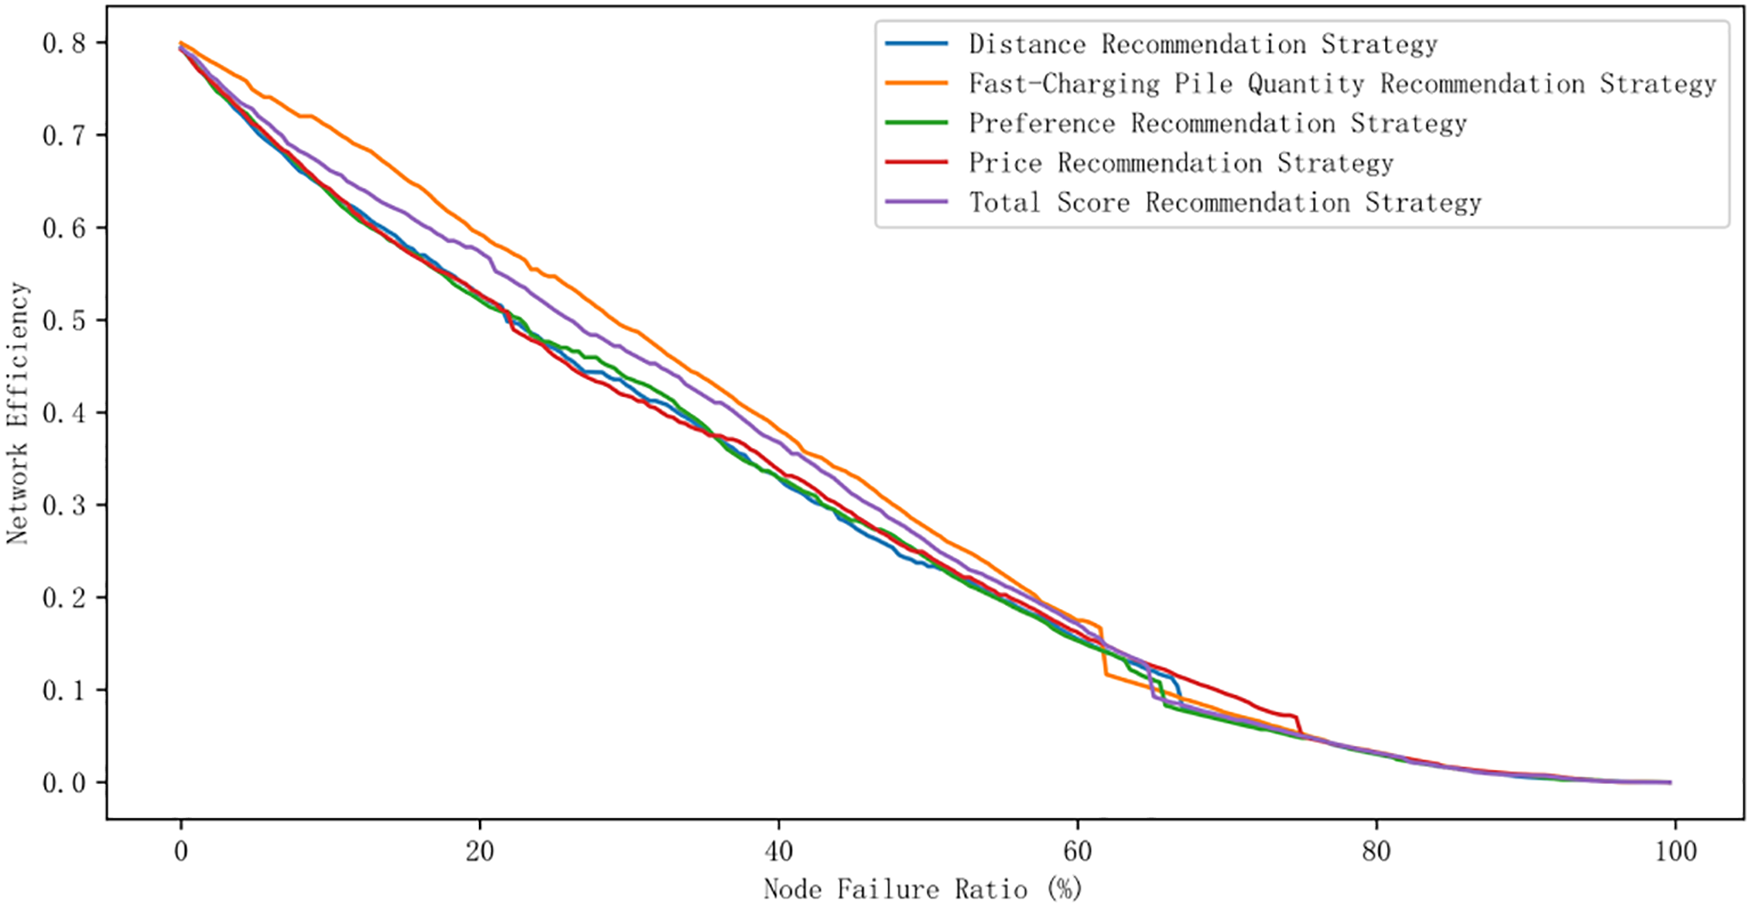
Figure 4: Network efficiency

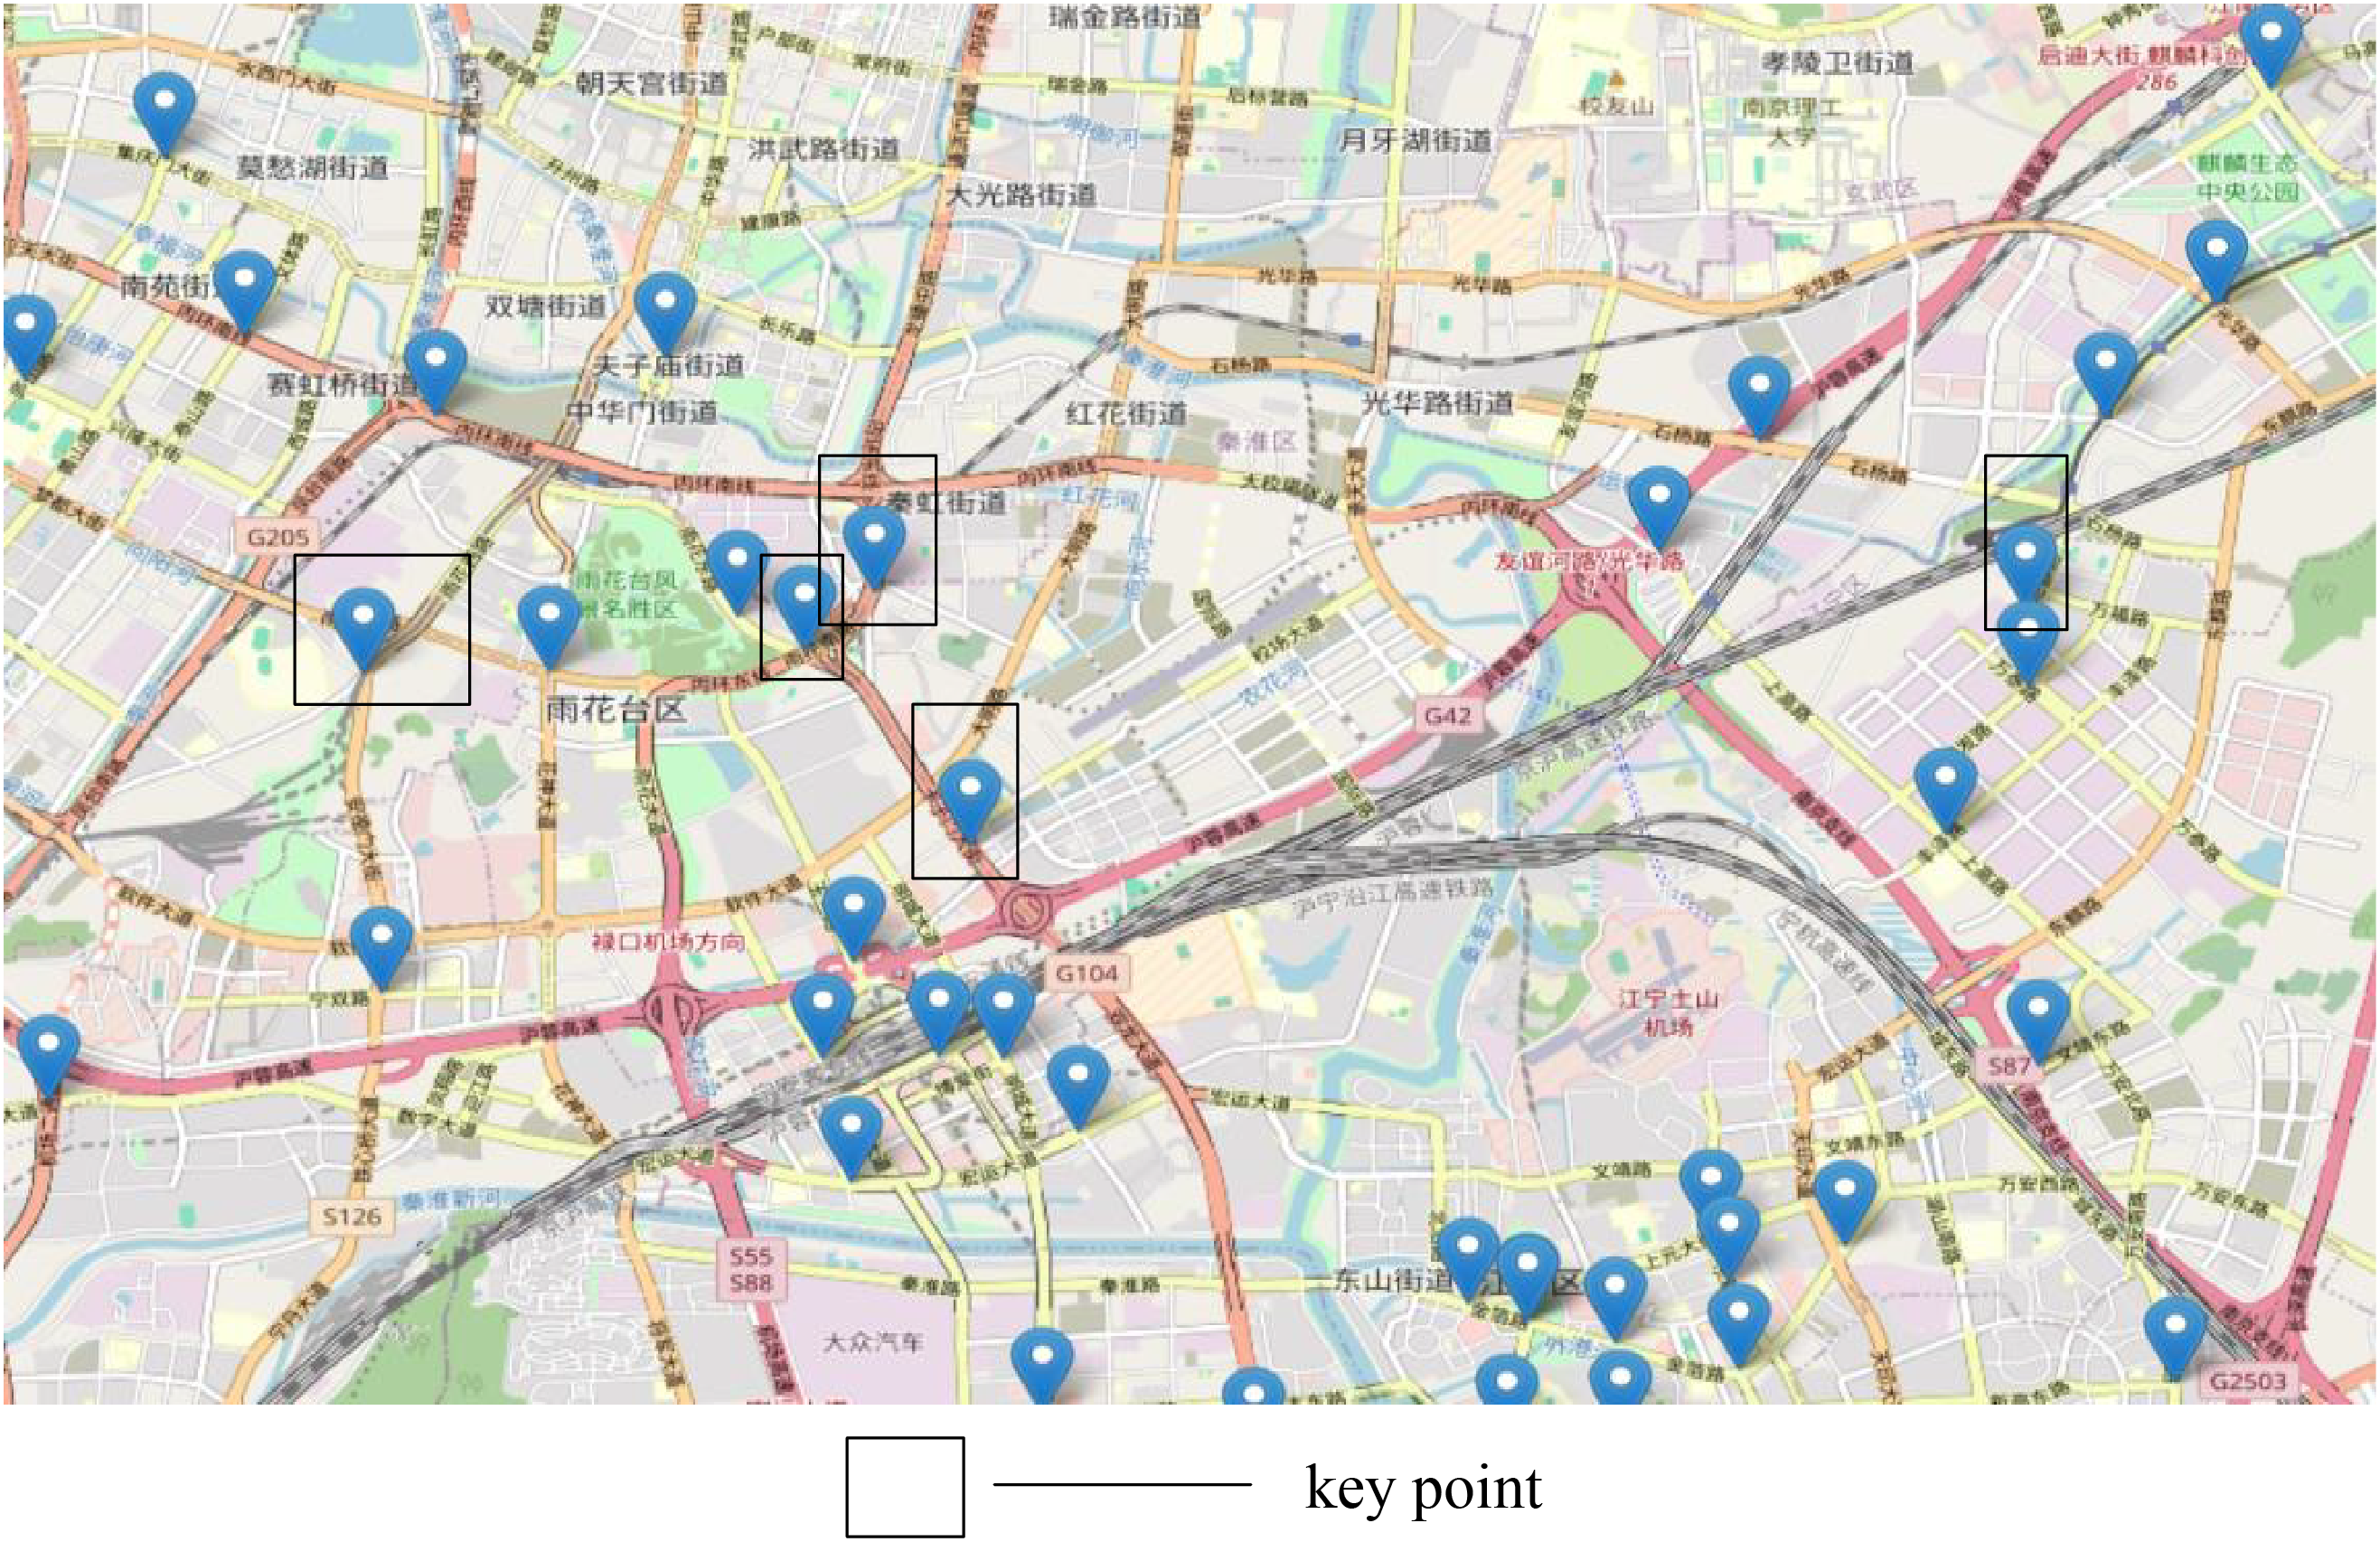
Figure 5: Distribution of key nodes
On the other hand, the recommendation strategy analysis section aims to provide insights into how recommendation strategies affect the robustness of the network. The recommendation strategies mimic users’ psychological preferences, thus simulating the disordered charging caused by different user preferences. The changes in network performance metrics under different recommendation strategies are shown in Table 4, where the network stability is significantly reduced in the price recommendation strategy when the node failure ratio reaches 75.4%, while the fast charging quantity recommendation is significantly reduced when the node failure ratio is 62.3%. Based on this finding, in the process of improving the network robustness of charging stations, it is necessary to comprehensively consider the market demand and guide users to charge in an orderly manner by reasonably adjusting the price, which not only effectively prevents the network stability problem caused by disorderly charging behavior, but also enhances the ability of the charging network to resist node failure and improves the overall dynamic robustness of the network.
The analytical results of this study show that regardless of the recommendation strategy adopted, the failure of key nodes affects the network not only in their own failure but also in the chain reaction they may trigger, which can quickly spread to the entire network. Furthermore, we note that not all key nodes have a high node degree or high node median. This finding emphasizes the need for a more comprehensive assessment framework that takes into account the multiple roles and potential influence of nodes in the network when assessing node importance. In addition, the price recommendation strategy is effective in maintaining the stability of the charging network, while the preference recommendation strategy is poor. These findings provide important references for the planning and management of charging networks, pointing out areas to focus on in future research and strategy development. Appropriate price adjustment is often more effective in motivating users to charge in an orderly manner and preventing network stability problems caused by disordered charging behavior induced by personal preferences.
In this study, we constructed a charging station network model in Nanjing using the Space-L method, and through a series of empirical analyses, we deeply explored the effects of five EV charging recommendation strategies (distance priority, number of fast-charging piles priority, user preference, price orientation, and total score) on the dynamic robustness of the charging station network. The core innovation of this study is to mimic various users’ psychological preferences with different recommendation strategies to simulate the impact of users’ disordered charging on the robustness of the charging station network. The experimental results show that the failure of key nodes significantly affects the network connectivity under various recommendation strategies, and we find that reasonable adjustment of prices can effectively prevent disordered charging behaviors, enhance the charging station network’s resilience against node failure, and improve the overall dynamic robustness of the network. This finding suggests that when designing recommendation systems for charging networks, we should pay attention to the moderating role of the price factor and its potential value in guiding user behavior and maintaining network stability.
Therefore, this study suggests that a market-based dynamic pricing mechanism should be used in the operation and management of charging networks to incentivize users to make more rational charging choices. In this way, not only can the negative impact of disorderly charging behavior on network stability be reduced, but also the adaptability and resilience of the network to various contingencies can be improved. Ultimately, this price-led strategy will help build a more robust, efficient, and user-friendly charging network environment.
Looking ahead, with the rapid development of the electric vehicle market and technological iteration, the planning and management of charging infrastructure need to be closely integrated with GIS technology and real-time big data analysis to achieve more precise and efficient optimization of charging station layouts. The theoretical model established in this study and the conclusions drawn provide a solid theoretical basis for the future planning and policy-making of urban charging facilities, helping decision-makers better meet the ever-changing market demands and promote the charging network towards a higher level of dynamic robustness. It also encourages further exploration and practice of innovative charging service strategies and intelligent dispatching methods to comprehensively enhance the operational efficiency and service quality of the charging network in complex network environments.
Acknowledgement: None.
Funding Statement: This work was supported by the Jiangsu Science and Technology Think Tank Program (Youth) Project (JSKX24085), and the Jiangsu Provincial College Students Innovation and Entrepreneurship Training Plan Project (202311276097Y).
Author Contributions: The authors confirm contribution to the paper as follows: study conception and design: Miao Liu, Peng Geng; data collection: Miao Liu; analysis and interpretation of results: Miao Liu, Lei Feng, Yexun Yuan; draft manuscript preparation: Miao Liu, Chi Zhang. All authors reviewed the results and approved the final version of the manuscript.
Availability of Data and Materials: Not applicable.
Conflicts of Interest: The authors declare that they have no conflicts of interest to report regarding the present study.
References
1. S. Deb, K. Tammi, K. Kalita, and P. Mahanta, “Impact of electric vehicle charging station load on distribution network,” Energies, vol. 11, no. 1, pp. 178, Jan. 2018. doi: 10.3390/en11010178. [Google Scholar] [CrossRef]
2. Y. Li, J. Luo, C. Y. Chow, K. L. Chan, Y. Ding and F. Zhang, “Growing the charging station network for electric vehicles with trajectory data analytics,” in 2015 IEEE 31st Int. Conf. Data Eng., Seoul, Republic of Korea, NV, 2015, pp. 1376–1387. [Google Scholar]
3. F. Ahmad, A. Iqbal, I. Ashraf, M. Marzband, and I. khan, “Optimal location of electric vehicle charging station and its impact on distribution network: A review,” Energy Rep., vol. 8, pp. 2314–2333, Nov. 2022. doi: 10.1016/j.egyr.2022.01.180. [Google Scholar] [CrossRef]
4. K. Huang, P. Kanaroglou, and X. Zhang, “The design of electric vehicle charging network,” Transp. Res., vol. 49, no. 2, pp. 1–17, Dec. 2016. doi: 10.1016/j.trd.2016.08.028. [Google Scholar] [CrossRef]
5. S. Hosseini and M. D. Sarder, “Development of a Bayesian network model for optimal site selection of electric vehicle charging station,” Int. J. Electr. Power Energy Syst., vol. 105, no. 4, pp. 110–122, Feb. 2019. doi: 10.1016/j.ijepes.2018.08.011. [Google Scholar] [CrossRef]
6. J. Yang, F. Guo, and M. Zhang, “Optimal planning of swapping/charging station network with customer satisfaction,” Transp. Res. Part E: Logist. Transp. Rev., vol. 103, no. 2498, pp. 174–197, Jul. 2017. doi: 10.1016/j.tre.2017.04.012. [Google Scholar] [CrossRef]
7. Y. Yang, Y. Zhang, and X. Meng, “A data-driven approach for optimizing the EV charging stations network,” IEEE Access, vol. 8, pp. 118572–118592, 2020. [Google Scholar]
8. H. Qin and W. Zhang, “Charging scheduling with minimal waiting in a network of electric vehicles and charging stations,” in Proc. Eighth ACM Int. Workshop Veh. Inter-Networking, Las Vegas, NV, USA, Sep. 2011, pp. 51–60. [Google Scholar]
9. W. Yu, J. Chen, and X. Yan, “Space–time evolution analysis of the Nanjing metro network based on a complex network,” Sustainability, vol. 11, no. 2, pp. 523, Nov. 2019. [Google Scholar]
10. X. Han, Z. Wei, Z. Hong, and S. Zhao, “Ordered charge control considering the uncertainty of charging a load of electric vehicles based on Markov chain,” Renew. Energy, vol. 161, no. 2, pp. 419–434, Dec. 2020. doi: 10.1016/j.renene.2020.07.013. [Google Scholar] [CrossRef]
11. Z. Tian et al., “Real-time charging station recommendation system for electric-vehicle taxis,” IEEE Trans. Intell. Transp. Syst., vol. 17, no. 11, pp. 3098–3109, Nov. 2016. doi: 10.1109/TITS.2016.2539201. [Google Scholar] [CrossRef]
12. Y. Gong, L. Tang, and H. Yi, “Selection of introduction schemes for Guanzhong intercity railway network based on complex network,” in Sixth Int. Conf. Transp. Eng., Chengdu, China, 2020, pp. 130–140. [Google Scholar]
13. Y. Chen, J. Xu, and M. Xu, “Finding community structure in spatially constrained complex networks,” Int. J. Geogr. Inf. Sci., vol. 29, no. 6, pp. 889–991, Apr. 2015. doi: 10.1080/13658816.2014.999244. [Google Scholar] [CrossRef]
14. C. Von Ferber, T. Holovatch, Y. Holovatch, and V. Palchykov, “Public transport networks: Empirical analysis and modeling,” Eur. Phys. J. B, vol. 68, no. 2, pp. 261–275, Mar. 2009. doi: 10.1140/epjb/e2009-00090-x. [Google Scholar] [CrossRef]
15. M. Liu, L. Feng, Y. Yuan, Y. Liu, and P. Geng, “Study on two-tier EV charging station recommendation strategy under multi-factor influence,” J. Artif. Intell., vol. 5, pp. 181–193, Dec. 2023. doi: 10.32604/jai.2023.046066. [Google Scholar] [CrossRef]
16. Y. Yang, B. Sun, S. Wang, Y. Li, and X. Li, “Controllability robustness against cascading failure for complex logistics networks based on nonlinear load-capacity model,” IEEE Access, vol. 8, pp. 7993–8003, 2020. [Google Scholar]
17. Y. Lou, L. Wang, and G. Chen, “Structural robustness of complex networks: A survey of a posteriori measures [feature],” IEEE Circuits Syst. Mag., vol. 23, pp. 12–35, 2023. [Google Scholar]
18. Q. Shang, B. Zhang, H. Li, and Y. Deng, “Identifying influential nodes: A new method based on network efficiency of edge weight updating,” Chaos, vol. 31, no. 3, pp. 053130, Mar. 2021. doi: 10.1063/5.0033197. [Google Scholar] [PubMed] [CrossRef]
19. P. Zhang, J. Chen, L. Tu, and L. Yin, “Layout evaluation of new energy vehicle charging stations: A perspective using the complex network robustness theory,” World Electric Veh. J., vol. 13, no. 7, pp. 127, Jul. 2022. [Google Scholar]
Cite This Article
 Copyright © 2024 The Author(s). Published by Tech Science Press.
This work is licensed under a Creative Commons Attribution 4.0 International License , which permits unrestricted use, distribution, and reproduction in any medium, provided the original work is properly cited.
 Downloads
 Citation Tools