
 Submit a Paper
 Propose a Special lssue
 Open Access
ARTICLE

Design of a Web Crawler for Water Quality Monitoring Data and Data Visualization
1 College of Engineering and Design, Hunan Normal University, Changsha, 410081, China
2 LIHERO Technology (Hunan) Co., Ltd., Changsha, 410205, China
3 Big Data Institute, Hunan University of Finance and Economics, Changsha, 410205, China
4 University Malaysia Sabah, Sabah, 88400, Malaysia
* Corresponding Author: Jianjun Zhang. Email:
Journal on Big Data 2022, 4(2), 135-143. https://doi.org/10.32604/jbd.2022.031024
Received 08 April 2022; Accepted 14 June 2022; Issue published 31 October 2022
 View Full Text
 Download PDF
Abstract
Many countries are paying more and more attention to the protection of water resources at present, and how to protect water resources has received extensive attention from society. Water quality monitoring is the key work to water resources protection. How to efficiently collect and analyze water quality monitoring data is an important aspect of water resources protection. In this paper, python programming tools and regular expressions were used to design a web crawler for the acquisition of water quality monitoring data from Global Freshwater Quality Database (GEMStat) sites, and the multi-thread parallelism was added to improve the efficiency in the process of downloading and parsing. In order to analyze and process the crawled water quality data, Pandas and Pyecharts are used to visualize the water quality data to show the intrinsic correlation and spatiotemporal relationship of the data.Keywords
Water is one of the important natural resources on which all life depends, the survival and development of human beings are inseparable from it [1,2]. According to surveys, as many as 25 million people around the world get sick and die from drinking polluted water every year [2]. However, most of these people live in developing countries. In some developing countries, because the quality of drinking water cannot be guaranteed, 70% of the people get sick and 30% die because of it [2]. Now countries are paying more and more attention to the protection of water resources, and how to protect water resources has received extensive attention from the society. Water quality monitoring is the key work of water resources protection. How to efficiently collect and analyze water quality monitoring data is an important aspect of water resources protection. However, water quality monitoring data is complex, time-sensitive, and diverse, and there are still problems such as incomplete data and insufficient intelligence [3]. How to efficiently obtain water quality monitoring data and analyze, and process it has become an urgent problem to be solved.
As one of the core elements of search engine technology, the crawler was invented by Alan Emtage at the University of Montreal in 1990 [4,5]. Since then, crawler technology has begun to develop rapidly. The current web crawlers can be divided into general web crawlers, focused web crawlers, incremental web crawlers, and Deep Web crawlers [6].
A general web crawler can start information crawling from an initial uniform resource locator (URL), and save the URL obtained on the page for information crawling, which is usually used for large-scale data collection [7]. This kind of crawler is simple in design and easy to implement, but inefficient, and there are many duplicate pages and junk pages.
Focused web crawlers can selectively access web pages and links on the internet according to the target URL that has been determined to obtain data information [8,9]. This is a conditional crawler that only collects useful information for users, which greatly improves the efficiency in both space and time [10].
Incremental web crawler only crawls newly added web content each time [9], through continuous superposition, the information crawling is completed [10]. The information pages crawled by Deep Web crawlers are deep web pages that require users to submit certain keywords to obtain relevant information [11]. The most important thing about this kind of web crawler is the form that the user needs to fill out [10], such as username, password, verification code, etc.
A complete web crawler program is mainly composed of three parts: the crawler scheduling terminal, the crawler core module, and the storage data module [12]. As shown in Fig. 1, the crawler scheduling terminal is the entrance of the entire crawler program, which is mainly used to control the start, execution, and stop of the entire crawler program, and to monitor the running status of the crawler [12]. The core module of the crawler is composed of three parts: the URL management part, the webpage download part, and the webpage analysis part. The URL management part transmits the URL waiting to be crawled to the webpage download part for webpage download, and then transmits the downloaded webpage content to the webpage analysis part to parse. Obtain the information that we need, and transmit the information to the data storage module for storage. In addition, each web page may have URLs pointing to other pages, and the web page parsing part will also parse these URLs and transmit them to the URL management part. For further crawling [12].
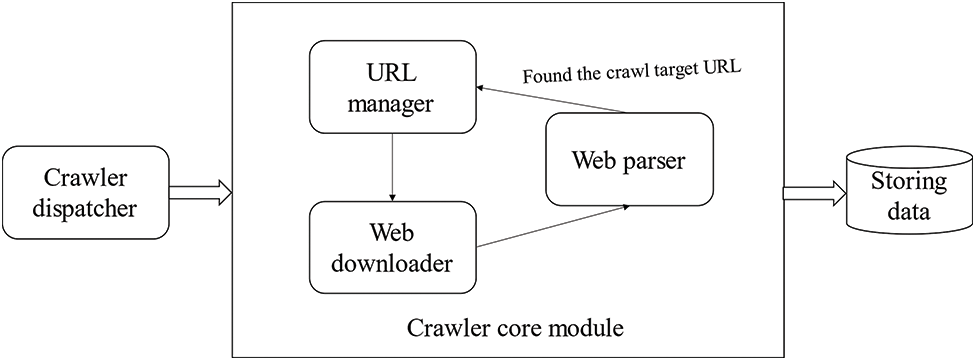
Figure 1: Working principle of crawler
2.2 Data Visualization Technology
2.2.1 Data Visualization Technology
In the human cognitive system, people’s cognition of most things begins with visual cognition. Vision transmits the specific shape of things to the brain, and the brain conducts in-depth analysis [13]. Data visualization is a science of technology research, its direction is the visual representation of data, a science and technology that assists users in analyzing and reasoning complex data through an interactive visual interface [14]. The basic process of data visualization is divided into the following steps: (1) Obtaining or collecting raw monitoring data; (2) Clearing useless data and outliers, and filling empty values; (3) Processing data by means of data mining, data integration, etc.; (4) The data results correspond to the visual structure; (5) Analyze the visualization results and study the inherent objective laws of the data [15]. To put it simply, through data and visualization, the rich and complex data collected is gathered into a chart and graphical display form, and the inherent information of the data is conveyed in this way process.
2.2.2 Common Data Visualization Methods and Tools
Data visualization is mainly aimed at conveying and communicating information clearly and effectively by means of graphical means. Common data visualization tools have many open-source tools and software such as R language, D3.js, Tableau, processing.js, Datawatch, Microsoft Excel, SAS, Infogram, Matplotlib and, Pyecharts in Python language.
These tools are used to deal with relatively complex and large-scale unstructured data. Their main purpose and function are to help users visualize the various attribute values of the data in the form of multi-dimensional data through intuitive observation of the data. It directly displays various attributes and variables of data, helps users observe and analyze data from different dimensions, and assists data users to observe and analyze data in a more in-depth, comprehensive, and detailed manner.
Python is an open-source computer programming language, which can optimize the quality of software and improve the work efficiency of software developers, and the programs written in Python are highly portable and robust. At the same time, Python is a dynamic computer programming language that can be used in software development, data processing, multimedia applications, and other fields.
GEMStat provides scientific data and information on the status and trends of inland water quality worldwide. Currently, the growing database contains more than 4 million rivers, lake, reservoir, wetland, and groundwater system entries from 75 countries and approximately 4,000 sites.
Enter the World Environmental Status Room through the Firefox browser, and then enter the GEMStat data portal to obtain the global water quality monitoring data, as shown in Fig. 2. The method of obtaining water quality monitoring data on this webpage is mainly by clicking on a certain site on the map or in the table, and a window will pop up to display the water quality information of the site, as shown in Fig. 3.
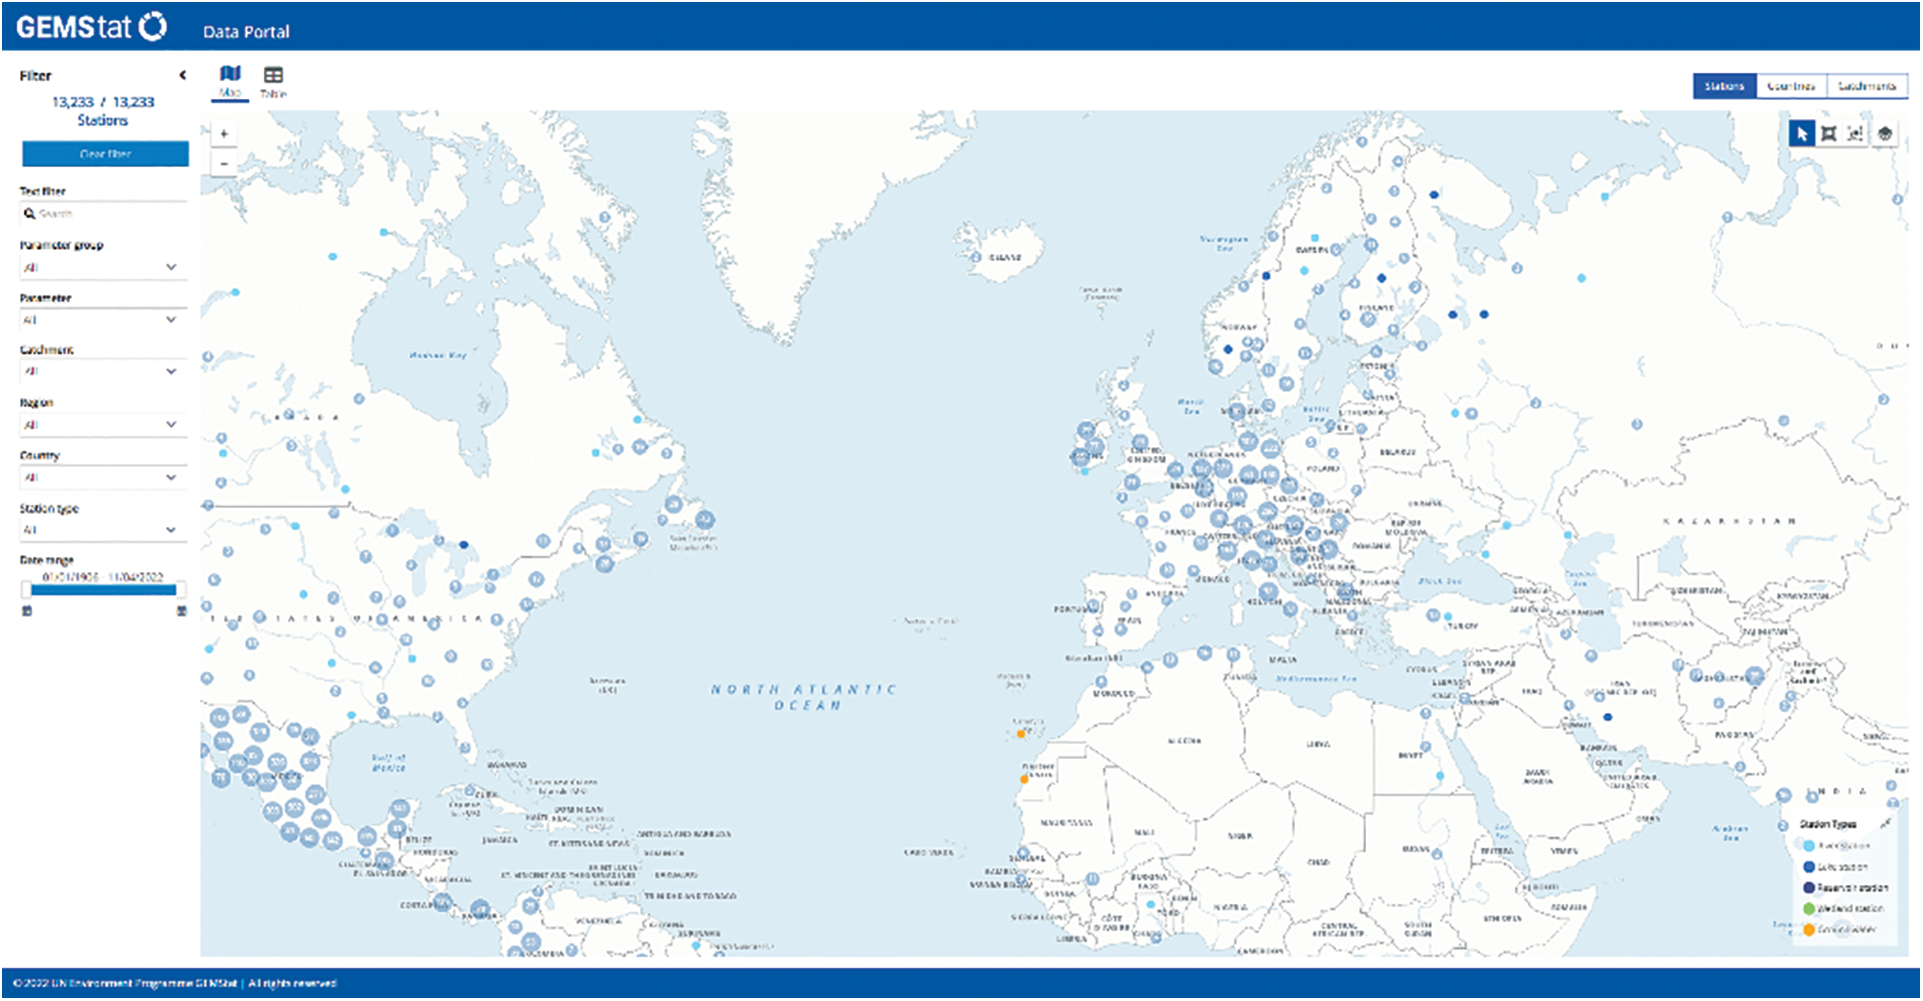
Figure 2: GEMStat data portal
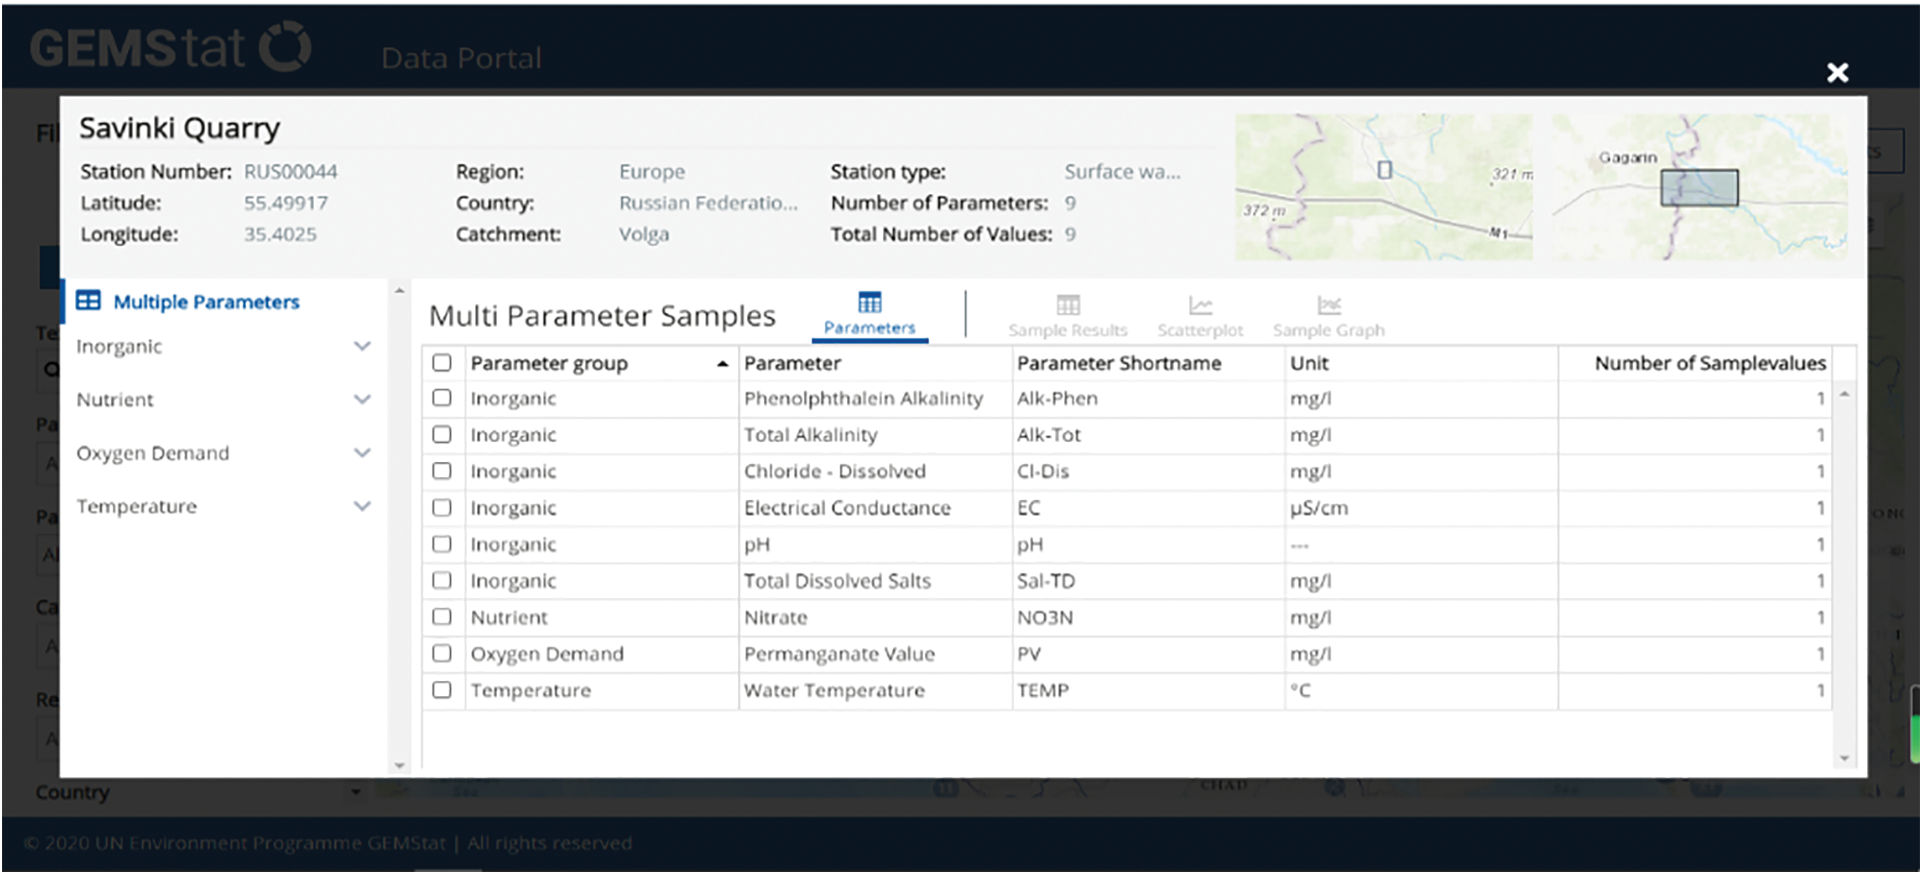
Figure 3: GEMStat water quality information
Therefore, before obtaining the data of this website, we must first obtain the information of each site. Through observation, we found that each site has a number: Station Number. So, we first need to find the file that stores this site number. And after entering developer mode, I found such a URL. The URL is requested in the browser and the page is shown in Fig. 4.
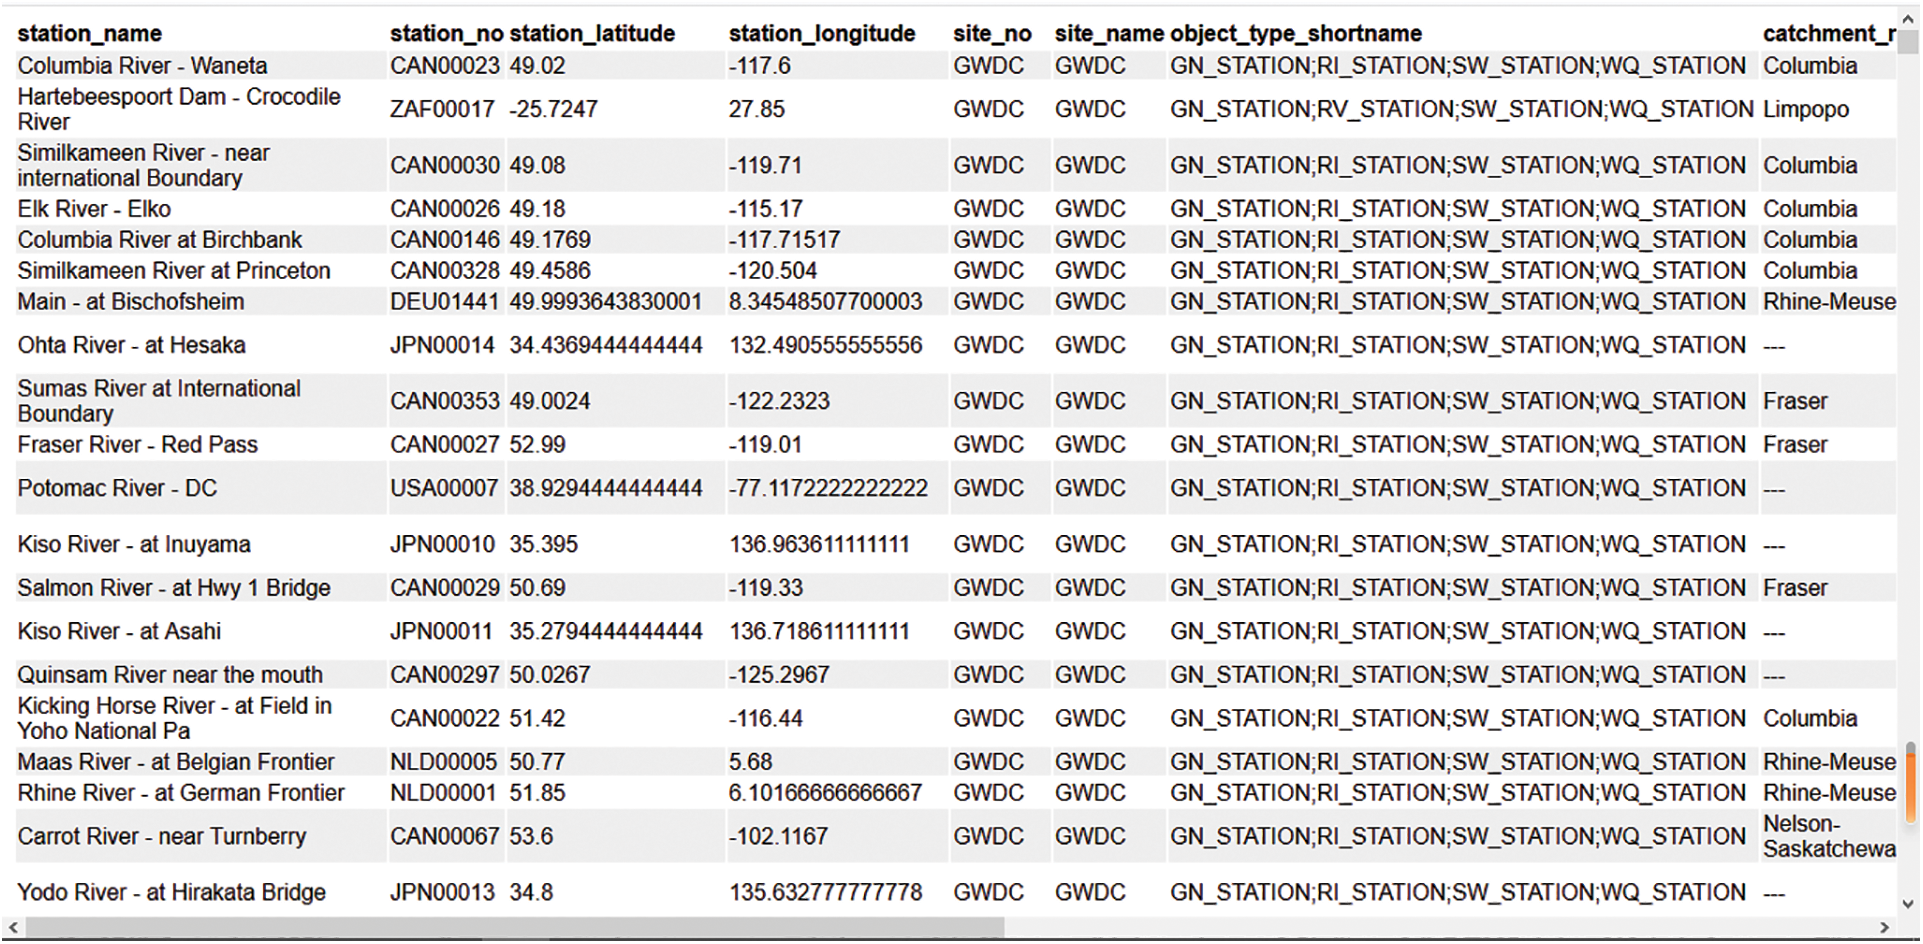
Figure 4: Site information page
According to the basic process of the crawler, the data crawler design of this website is shown in Fig. 5. The crawler design also includes four parts: preparation module, download module, parsing module, and data saving module. In the crawler program, the site information of all the sites monitored by the website and the index information of the detection indicators will be crawled first. After the user selects the crawling method, the URL formation to be crawled is listed according to the rules of the website data storage address URL, make a request to each URL, download the data, parse and save the data. After the crawling is over, the saved data page is shown in Fig. 6.
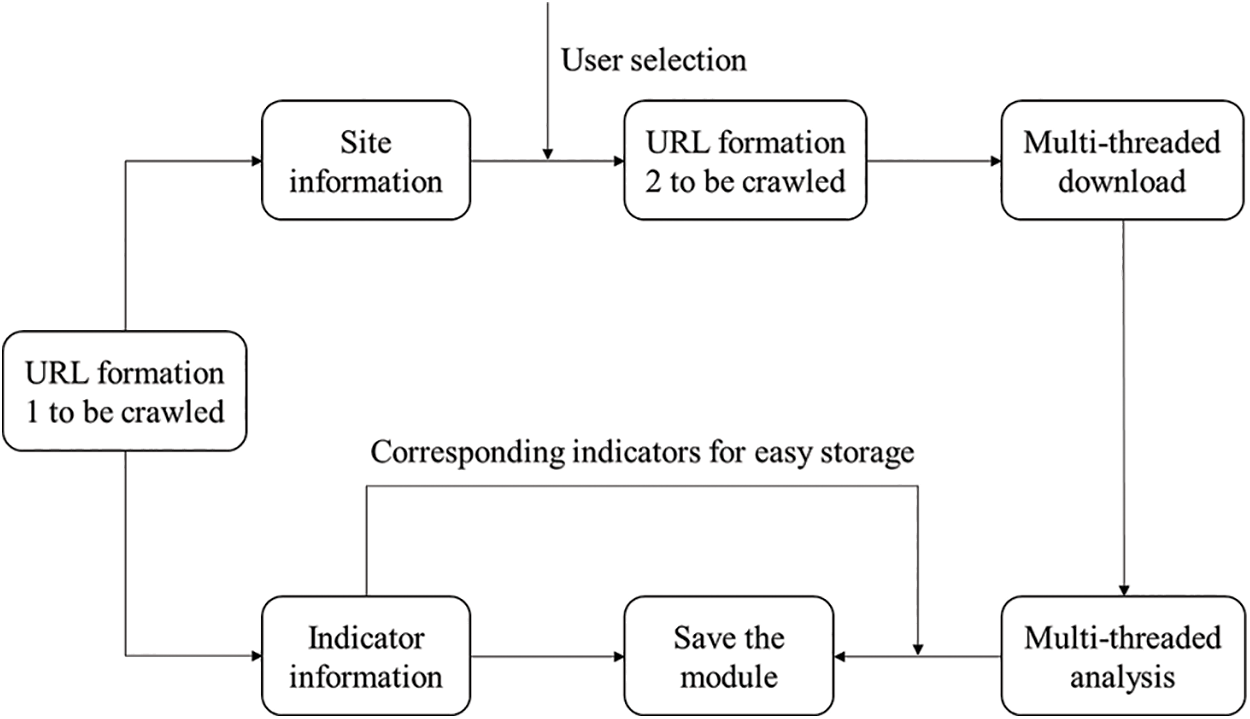
Figure 5: GEMStat data portal crawler design
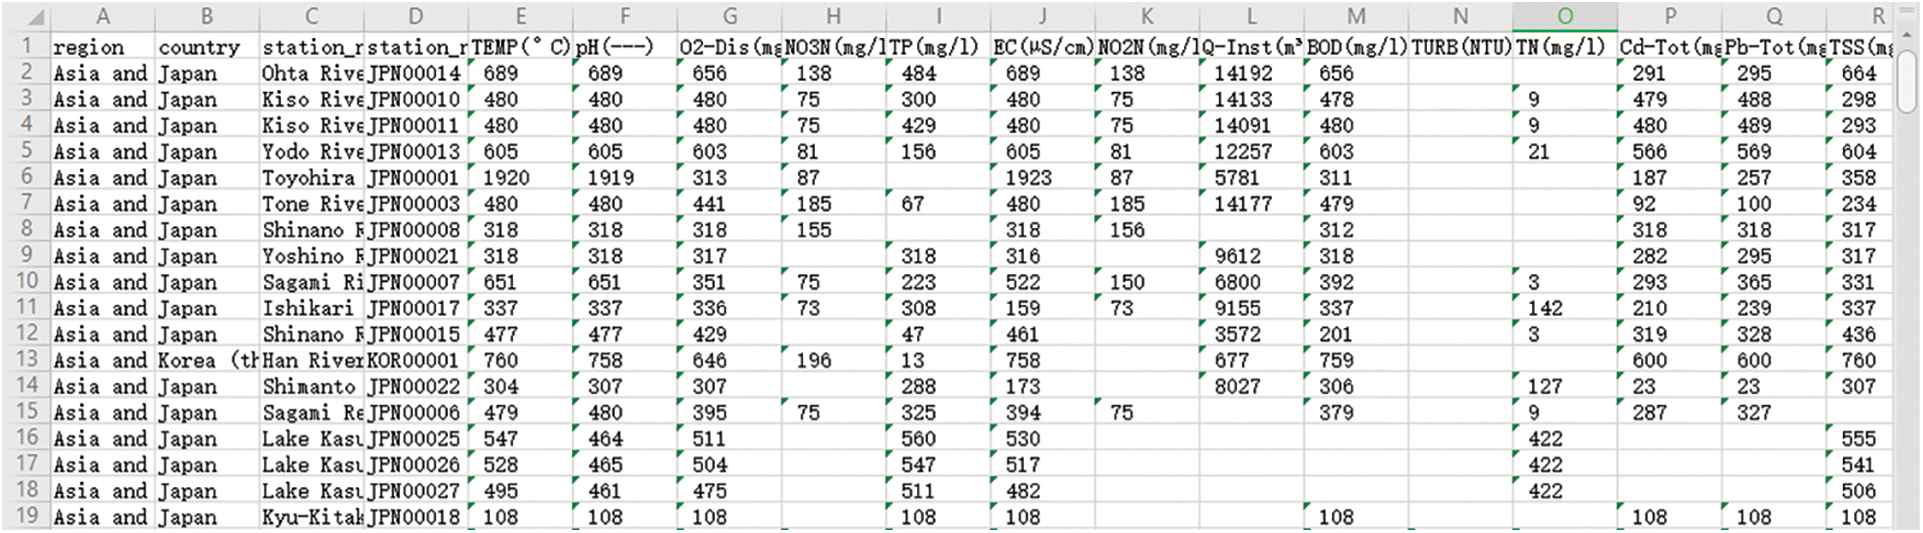
Figure 6: Partial data of GEMStat data portal
In order to test the designed crawler program, we use this program to crawl the data of the national water quality monitoring website and the data of the Asia and the Pacific region on the GEMStat website respectively and analyze the operation situation.
It took about 5 min to crawl all the data of the national water quality monitoring website, and it took about 27 min to crawl the data of the Asia and the Pacific region on the GEMStat website. This means it takes an hour to crawl the GEMStat. For further optimization, the time consumed by the crawler system to crawl two websites is analyzed separately.
(1) National water quality monitoring website
In order to facilitate time-consuming analysis, the time-consuming and total time-consuming of each module is displayed and shown in the following Table 1.
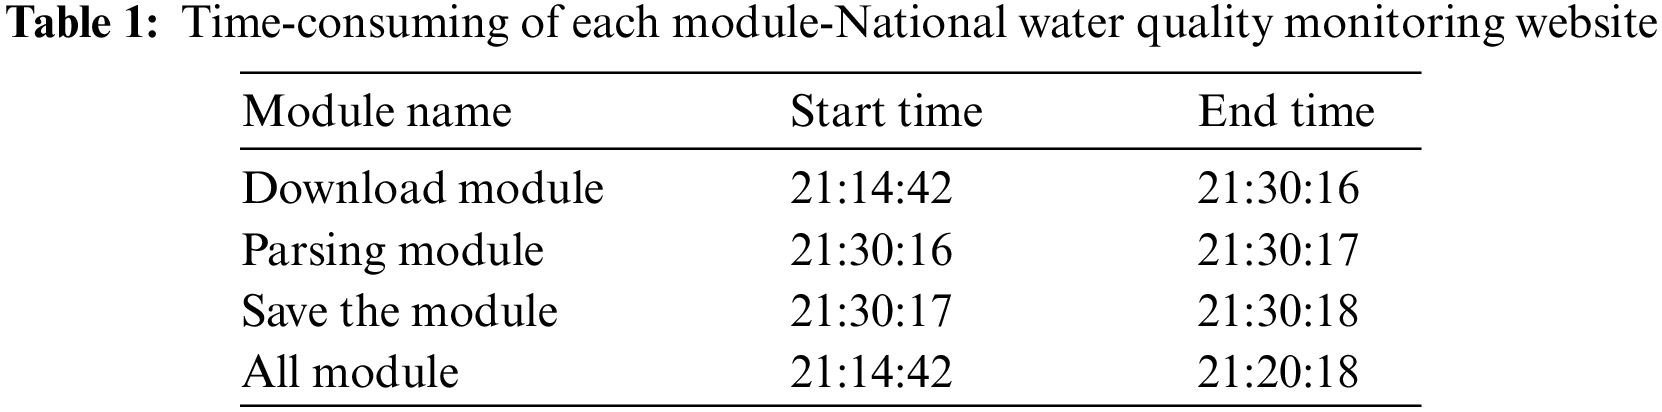
As shown in Table 1, it took 5 min and 36 s to crawl all the data from the national water quality monitoring website. Among them, it took 5 min and 34 s to download the module, while the parsing module and saving only took 1 s respectively. That is to say, in the running process of this crawler program, the time is mainly consumed in downloading the module, which is mainly because of in the crawler design, a delay of 0–3 s is added to the download part, which slows down the crawler speed. In the subsequent optimization process, an IP proxy can be set to shorten the delay, which can prevent IP from being blocked and improve crawler efficiency.
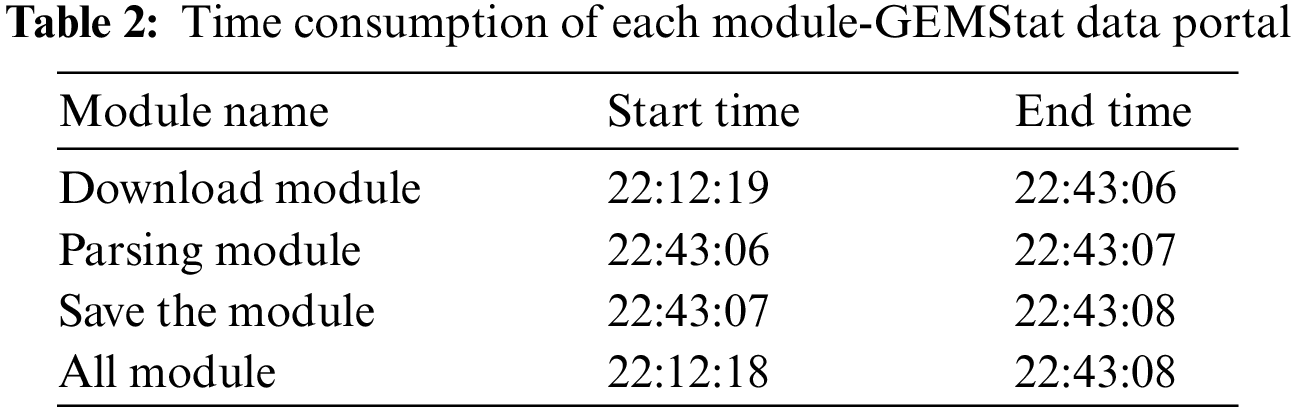
(2) GEMStat data portal
Running the crawler program, the time-consuming and total time-consuming of each module is shown in Table 2. It can be seen from Table 2 that it took 30 min and 50 s to crawl part of the data in Asia and the Pacific region of the GEMStat data portal. Among them, it takes 30 min and 47 s to download, and 1 s to analyze and save. Therefore, the crawler running time is mainly consumed by the delay setting of the download module.
4.2 Database Comparative Analysis
Comparing the water quality monitoring data crawling time of the National water quality monitoring station and the GEMStat data portal, when crawling all the data of the National water quality monitoring station, 1464 site data will be crawled. When crawling the Asia and the Pacific region data in the GEMStat data portal, it only needs to crawl the data of 617 sites, but it takes 25 min more than the previous crawler.
After analysis, there are a total of the following factors: GEMStat is an overseas website When downloading the data page of the National water quality monitoring station, generally one page will contain the information of dozens of sites, but the data page of this website can only be accessed through a single data page of a certain site, and the page will only have data of one site information. Therefore, even if the water quality monitoring information of the same number of sites on two websites is crawled, the time spent crawling the GEMStat website data is several times longer than the time spent crawling the National Water Quality Monitoring Station; In addition, the website contains water quality monitoring data of more than 12,000 sites around the world. Compared with the National Water Quality Monitoring Station, which only needs to monitor more than 1,400 sites across the country, when all the data is crawled, the amount of engineering is also larger.
For data visualization, two extension libraries, Matplotlib and Pyecharts in the Python library, are used to visualize the water quality monitoring data respectively. The Matplotlib drawing is shown in Fig. 7, and the Pyecharts drawing is shown in Fig. 8. Both visualization tools have their advantages, but through the comparison of the two visualization results, it is found that the interaction and readability of visualizing data using Pyecharts is stronger than the chart drawn by Matplotlib, the process of drawing a large amount of water quality data in Matplotlib is slow, and the visualization results are not beautiful, and Pyecharts has functions such as setting data axes, displaying data values in real-time, and configuring widgets. The line graph is drawn by Matplotlib simply displays the data. Due to too much data, only the basic change trend of water quality data can be seen from the graph, it is difficult to obtain effective information, and the user viewing experience is very poor.
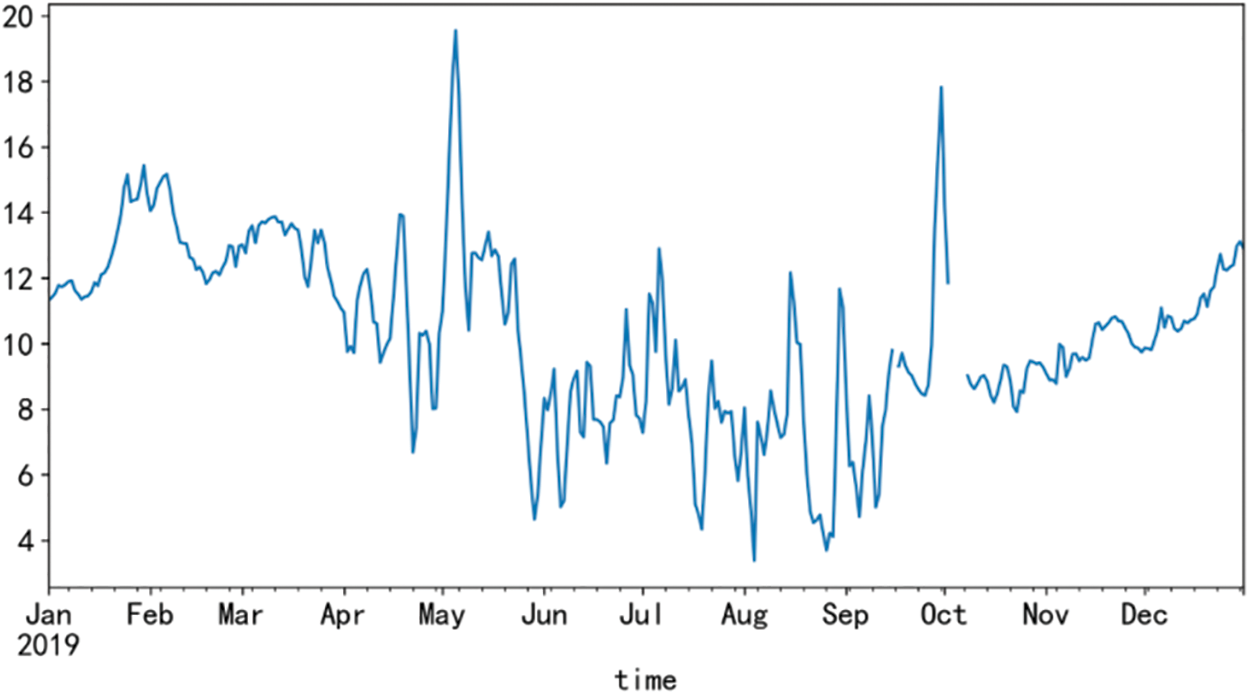
Figure 7: Matplotlib draws a line graph (dissolved oxygen)
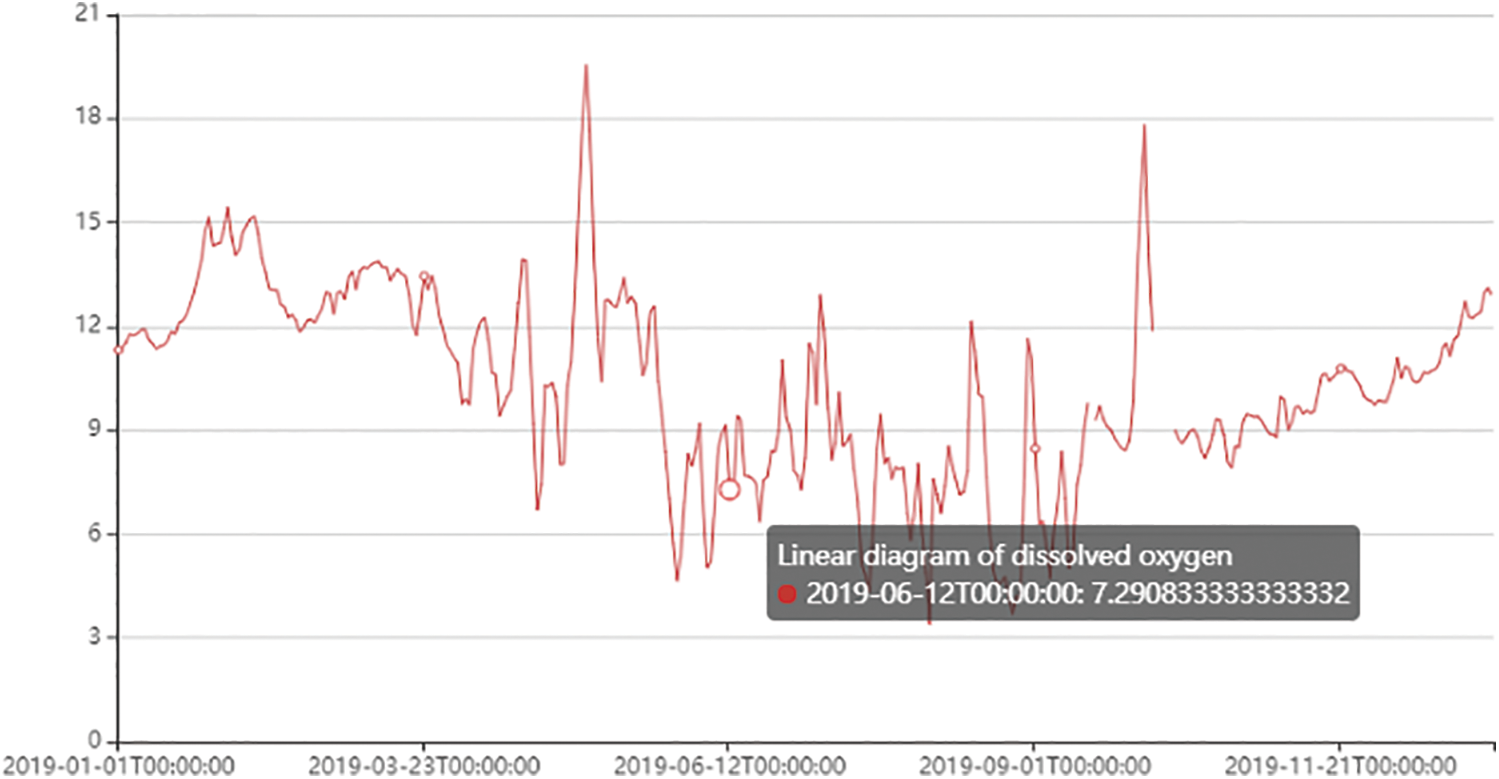
Figure 8: Pyecharts draws a line graph (dissolved oxygen)
In order to efficiently obtain water quality monitoring data and help water resources protection and utilization. In this paper, by using python programming tools and the regular expressions, we introduced how to design a web crawler for the acquisition of water quality monitoring data from GEMStat (Global Freshwater Quality Database) sites, and added multi-thread parallelism in the process of downloading and parsing to improve crawler efficiency; In order to analyze and process the crawled water quality data, the Pandas and Pyecharts libraries in Python are used to visualize the water quality data, so as to show the intrinsic correlation and spatiotemporal relationship of the data.
Acknowledgement: The authors would like to appreciate all anonymous reviewers for their insightful comments and constructive suggestions to polish this paper in high quality.
Funding Statement: This research was funded by the National Natural Science Foundation of China (No. 51775185), Scientific Research Fund of Hunan Province Education Department (18C0003), Research project on teaching reform in colleges and universities of Hunan Province Education Department (20190147), Innovation and Entrepreneurship Training Program for College Students in Hunan Province (2021-1980) and Hunan Normal University University-Industry Cooperation. This work is implemented at the 2011 Collaborative Innovation Center for Development and Utilization of Finance and Economics Big Data Property, Universities of Hunan Province, Open project, Grant Number 20181901CRP04.
Conflicts of Interest: The authors declare that they have no conflicts of interest to report regarding the present study.
References
1. Y. Zhang, “Talking about the status quo of surface water quality monitoring in my country,” Science and Technology Information, vol. 26, pp. 59, 2011. [Google Scholar]
2. Y. M. Wang, “Interpretation of the current situation of surface water quality monitoring in my country,” Theoretical Research on Urban Construction (Electronic Edition), vol. 4, no. 15, pp. 120, 2019. [Google Scholar]
3. G. P. Yuan, “Application of big data technology in water environment monitoring network and information platform of Dianchi lake basin,” Environment and Development, vol. 30, no. 11, pp. 146–147, 2018. [Google Scholar]
4. Y. K. Xing, “Information analysis of Dangdang webpage based on Scrapy framework crawler and data mining,” M.S. Dissertation, Xiangtan University, Xiangtan, 2020. [Google Scholar]
5. Y. Sun, “Design and implementation of web crawler system based on scrapy framework,” M.S. Dissertation, Beijing Jiaotong University, Beijing, 2019. [Google Scholar]
6. J. R. Zeng, Y. S. Zhang, J. Zhen, G. J. Huang and R. Y. Chen, “Implementation technology and application of web crawler for multi-data sources,” Computer Science, vol. 46, no. 5, pp. 304–309, 2019. [Google Scholar]
7. X. H. Zeng, “Research on Weibo web crawler based on topic,” M.S. Dissertation, Wuhan University of Technology, Wuhan, 2014. [Google Scholar]
8. J. B. Han, “Design and implementation of theme crawler for app store,” M.S. Dissertation, Southeast University, Jiangsu, 2018. [Google Scholar]
9. G. B. Cai, “Design and implementation of topic-oriented multi-threaded web crawler,” M.S. Dissertation, Northwest University for Nationalities, Gansu, 2017. [Google Scholar]
10. Z. C. Wen and S. H, “Design and implementation of web crawler based on Python,” Computer Programming Skills and Maintenance, vol. 27, no. 7, pp. 21–23, 2020. [Google Scholar]
11. W. Cheng, “Design and implementation of a web crawler for deep web data acquisition,” M.S. Dissertation, Central China Normal University, Wuhan, 2013. [Google Scholar]
12. Y. Zhang and Y. Q. Wu, “Program design of network data crawler based on Python,” Computer Programming Skills and Maintenance, vol. 27, no. 4, pp. 26–27, 2020. [Google Scholar]
13. D. A. Keim, “Information visualization and visual data mining,” IEEE Transactions on Visualization and Computer Graphics, vol. 27, no. 8, pp. 1–8, 2002. [Google Scholar]
14. J. J. Wang and W. X. Hong, “Visualization and visual analysis,” Journal of Yanshan University, vol. 34, no. 2, pp. 95–99, 2010. [Google Scholar]
15. S. K. Card, J. D. Mackinlay and B. Shneiderman, “Readings in Information Visualization-Using Vision to Think,” Series in Interactive Technologies, San Mateo: Morgan Kaufman Publishers Inc, 1999. [Google Scholar]
Cite This Article
 Copyright © 2022 The Author(s). Published by Tech Science Press.
This work is licensed under a Creative Commons Attribution 4.0 International License , which permits unrestricted use, distribution, and reproduction in any medium, provided the original work is properly cited.
 Downloads
 Citation Tools