DOI:10.32604/jbd.2022.027477
| Journal on Big Data DOI:10.32604/jbd.2022.027477 | |
| Article |
Restoration of Wind Speed in Qinzhou, Guangxi during Typhoon Rammasun
1School of Geographical Sciences, Nanjing University of Information Science & Technology, Nanjing, 210044, China
2School of Applied Meteorology, Nanjing University of Information Science & Technology, Nanjing, 210044, China
3Faculty of Science, the University of Auckland, Auckland, 1010, New Zealand
*Corresponding Author: Wenzheng Yu. Email: ywzheng519@126.com
Received: 04 March 2022; Accepted: 06 April 2022
Abstract: In 2014, Typhoon Rammasun invaded Qinzhou, Guangxi, causing damage to the wind tower sensor at 80 m in Qinzhou. In order to restore the wind speed at 80 m at that time, this paper was based on the hourly average wind speed data of the wind tower and meteorological station from 2017–2019, and constructed the wind speed related model of Meteorological Station and the wind measuring tower in Qinzhou, Moreover, this paper Based on the hourly average wind speed data of Qinzhou Meteorological Station in 2014, Restored the hourly average wind speed of the anemometer tower during Rammasun landfalled. The results showed it is significant correlation that the hourly mean wind speed of the wind tower at 80 m and the hourly mean wind speed of meteorological station at 100 m (R2 = 0.9632), and speed of the wind measuring tower and speed of meteorological station constitutes an equation, This equation is Y = 0.7834X. The hourly average wind speed of the wind tower at 80 m during the 2014 Rammasun Landing was restored using this model. See the results in Schedule 4.
Keywords: Typhoon Rammasun; restoration of wind speed; regression analysis
On March 11, 2021, the 14th Five-Year Plan set the goal of establishing carbon neutrality and carbon peak, and in order to cope with global climate change and promote sustainable development. This put forward higher requirements for China’s environmental governance and energy structure adjustment [1,2]. In September 2021, the phenomenon of “power rationing” occurred in northeast China, indicating that the country’s non-renewable energy gap had been increasing. In the face of the rising coal price and the requirements of the “dual carbon” target, the supply structure dominated by traditional thermal power generation was difficult to meet the demand of industrial and domestic electricity in China [3,4]. Therefore, in recent years, the proportion of renewable energy generation in China has gradually increased, among which, due to China’s unique monsoon conditions and geomorphic characteristics, wind power generation has been popularized throughout the country [5]. For wind power generation, the site selection and design of wind farms are key links for effective utilization of wind energy resources and optimization of economic benefits [6]. Wind load is an important parameter in the site selection and design of wind farm [7]. Fu et al. [8] researched the load characteristics of offshore wind turbine based on wind load and hydrodynamic load. Li et al. [9] researched the dynamic response of different floating wind farm platforms under wave load.
For the study of wind load, it is very important to determine the wind speed around the wind turbine, and wind measuring tower is one of the important means to observe wind speed [10]. Based on the wind speed observation data of 24 wind towers in Liaoning and Jilin Province, Wang et al. [11] revised the wind speed prediction products in the near layer. Wang et al. [12] believed that the representativeness of wind towers was one of the most important factors to determine the accuracy of wind resource assessment. Through case analysis, they believed that the representativeness of wind towers was better when the elevation difference was within 30 m.
Guangxi is located in the subtropical monsoon climate, adjacent to the South China Sea and affected by tropical maritime monsoon at the same time, and is one of the provinces most frequently affected by typhoons in China [13]. Typhoons have a wide range of influence and high central pressure, so designers often take the largest local typhoon as the research object to design wind turbines and select sites for wind farms [14]. In the past 50 years, among the most important typhoons affecting Guangxi, Typhoon Rammasun, no.9 in 2014, is the most typical [15–16]. Previous researches on “Rammasun” have achieved significant results. Qiao et al. [17] simulated the response changes of water level, ocean current and wave in the Red River Delta to typhoons, and obtained the response characteristics of hydrodynamic environment in the Sea area of the Red River Delta under the action of super typhoon “Rammasun”. Based on SST and path data of rammasun during its transit, Wang et al. [18] analyzed the environmental factors for the sharp strengthening of rammasun in the northern part of the south China sea.
The above researches provide theoretical and methodological support for analyzing the characteristics of typhoon Rammasun landing in Qinzhou, Guangxi. The research on the strong wind characteristics of Rammasun landing in Guangxi not only provided reference value for the prevention of natural disasters in Guangxi, but also played a key role in the site selection of wind farms and the design of wind turbines in Guangxi [19,20]. Wang et al. [21] analyzed the time-history transformation characteristics of wind shear, turbulence intensity and gust coefficient by using the observation data of Xuwen Wind farm in Guangdong province during the landfall of Rammasun, providing reference for transmission line design and wind turbine selection. Based on the typhoon disaster risk index model, Peng [22] evaluated the benefit of rammasun disaster prevention behavior by using meteorological data and disaster data during rammasun’s landing.
The wind tower can realize the observation of wind speed at different heights, and during Rammasun landing in Guangxi, the wind speed sensor out of the 80 m height of the Qinzhou wind tower was damaged. Therefore, this paper used the data of the Qinzhou wind tower in Guangxi in 2017, 2018, 2019 to build the correlation model of the wind speed between the Qinzhou Weather Station and the wind tower. The data of Qinzhou Weather Station in 2014 and correlative models were used to restore the hourly mean wind speed at the height of 80 m of the wind tower during Rammasun’s landing.
The remainder of this paper is organized as follows. Section 2 is described the study methods. Next, Section 3 is showed process of model-building. Then, Sections 4, 5 and 6 demonstrate and discusse the research results in detail, and finally, Section 7 presents the conclusions.
Correlation analysis is the analysis of the indeed linked signs in the whole, and the main body is the analysis of the causal signs in the whole. It is a process of describing the closeness of objective things and expressed with appropriate statistical indicators. Correlation analysis is applied in industry and agriculture, hydrology, meteorology, socio-economic and biology [23,24].
3 Wind Measuring Tower-Wind Speed Correlation Model of Qinzhou Station
3.1 Wind Measuring Tower Data Processing
At the same time, we selected the wind speed data of the wind measuring tower (U1) from 2017–2019 and Qinzhou Meteorological Station (U2) at the same period. The wind speed of the meteorological station was observed at 10 m, 100 m. we extracted the wind speed data of the two heights, and analyzed the ratio of the wind speed measured and the wind direction in the two sites. there was no wind direction of observation at 100 m, so we replaced data of 100 m height with data of 80 m height. Fig. 1 showed the wind speed ratio measured by the wind measuring tower and Qinzhou Meteorological Station, which is expressed as:
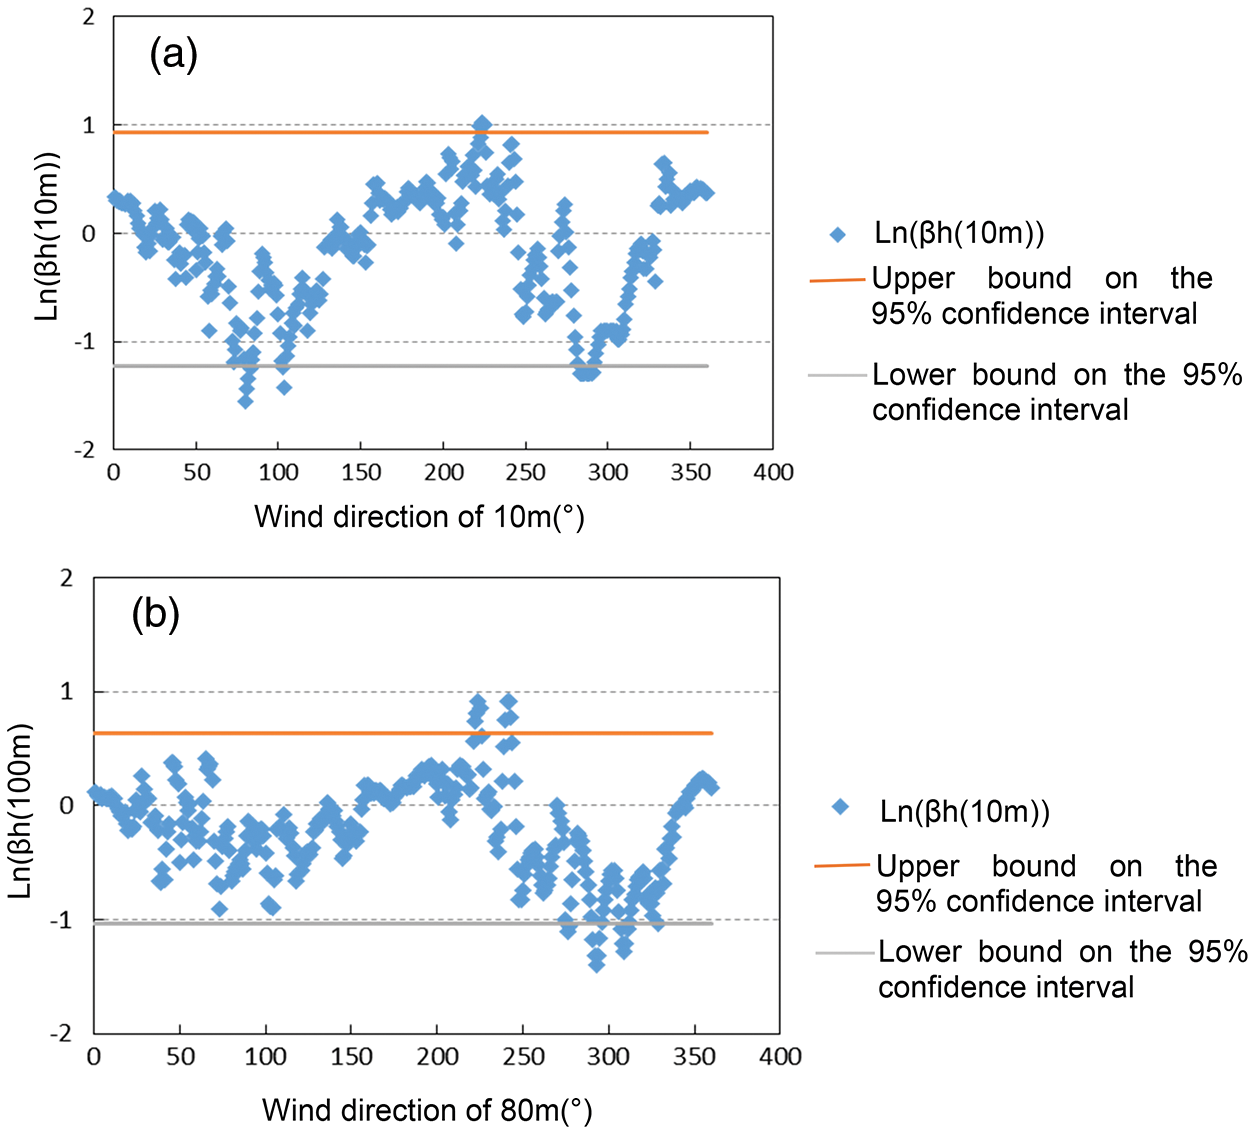
Figure 1: The change of the wind speed ratio between the wind measuring tower and the qinzhou meteorological station along with the wind direction: (a): 10 m, (b) 100 m
From Fig. 1, the y values of (a) and (b) were simultaneously lower than the confidence interval when the wind direction was 290 to 310. it indicated that the wind speed data of the wind measuring tower was much lower than the meteorological station data of the same period; while the y value at the wind direction of 220–240 was also higher than the confidence interval. It indicated that the wind speed data of the wind measuring tower was much higher than the meteorological station data of the same period. Therefore, it could be inferred that the data was inaccurate due to terrain occlusion, and the wind speed data from 220∼240 and 290∼310 should be avoided.
Fig. 2 is the wind direction diagram corresponding to each angle. n = 360. From Fig. 1, the angles of 220–240 and 290–310 are the southwest and northwest wind. From the historical analysis of typhoons in Qinzhou, this optimization does not affect the subsequent analysis of Typhoon Rammasun.
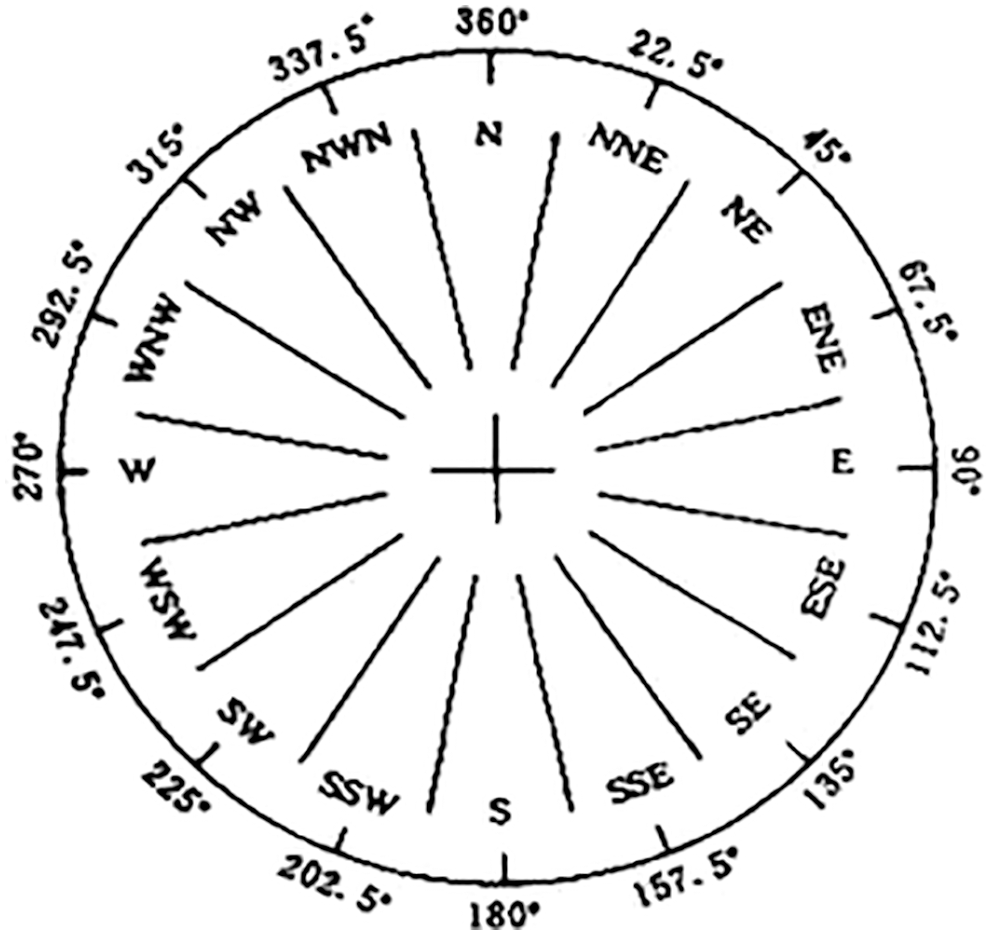
Figure 2: The angles correspond to the wind direction diagram
3.2 Correlation Analysis of Project Wind Measuring Tower and Meteorological Station
Based on the collated data in 3.1, and we picked out the hourly wind speed data for the same period in weather station data. We had counted the correlations of these two sets of data, meanwhile, built equation, where X is wind tower wind speed, Y for hourly wind speed of the weather station, R represent correlation coefficient of X and Y, n is the number of samples, F is the statistics used in F test, the following expression:
Among these, n1, n2 is the number of samples of X and Y. S1, S2 is its standard deviation. F reflect that the significance of the difference in the mean of the two-segment random elements under a given reliability condition. Equation rejects the null hypothesis when F > Fa [25].
Because the extreme wind speed focuses on the strong wind, and the wind speed of the weather station was generally small. So we selected data with an hourly average wind speed greater exceed or equal to 10 m/s as samples in the wind tower. As the same time, we also selected hourly average wind speed data of greater than or equal to 10 m/s as samples in weather station. Then, we statisticsed and analysised these samples.
Fig. 3 showed that the wind speed of 80 m was significantly correlative to the wind speed of Qinzhou weather Station. Its R2 was up to 0.9632, and F = 0.29 had passed the F test. The wind speed of 70, 50, 30, 10 m in the wind tower was significantly associated with the wind speed of Qinzhou Weather Station, and R2 was greater than 0.96. Combined with the actual situation, we selected the wind speed with the height of 80 m in wind tower and the height of 100 m in the weather station. We had used these data to construct the correlative equation. So the hourly average wind speed of 80 m height could be calculated from the average wind speed of 100 m hours of Qinzhou Weather Station. The final relevant equation:
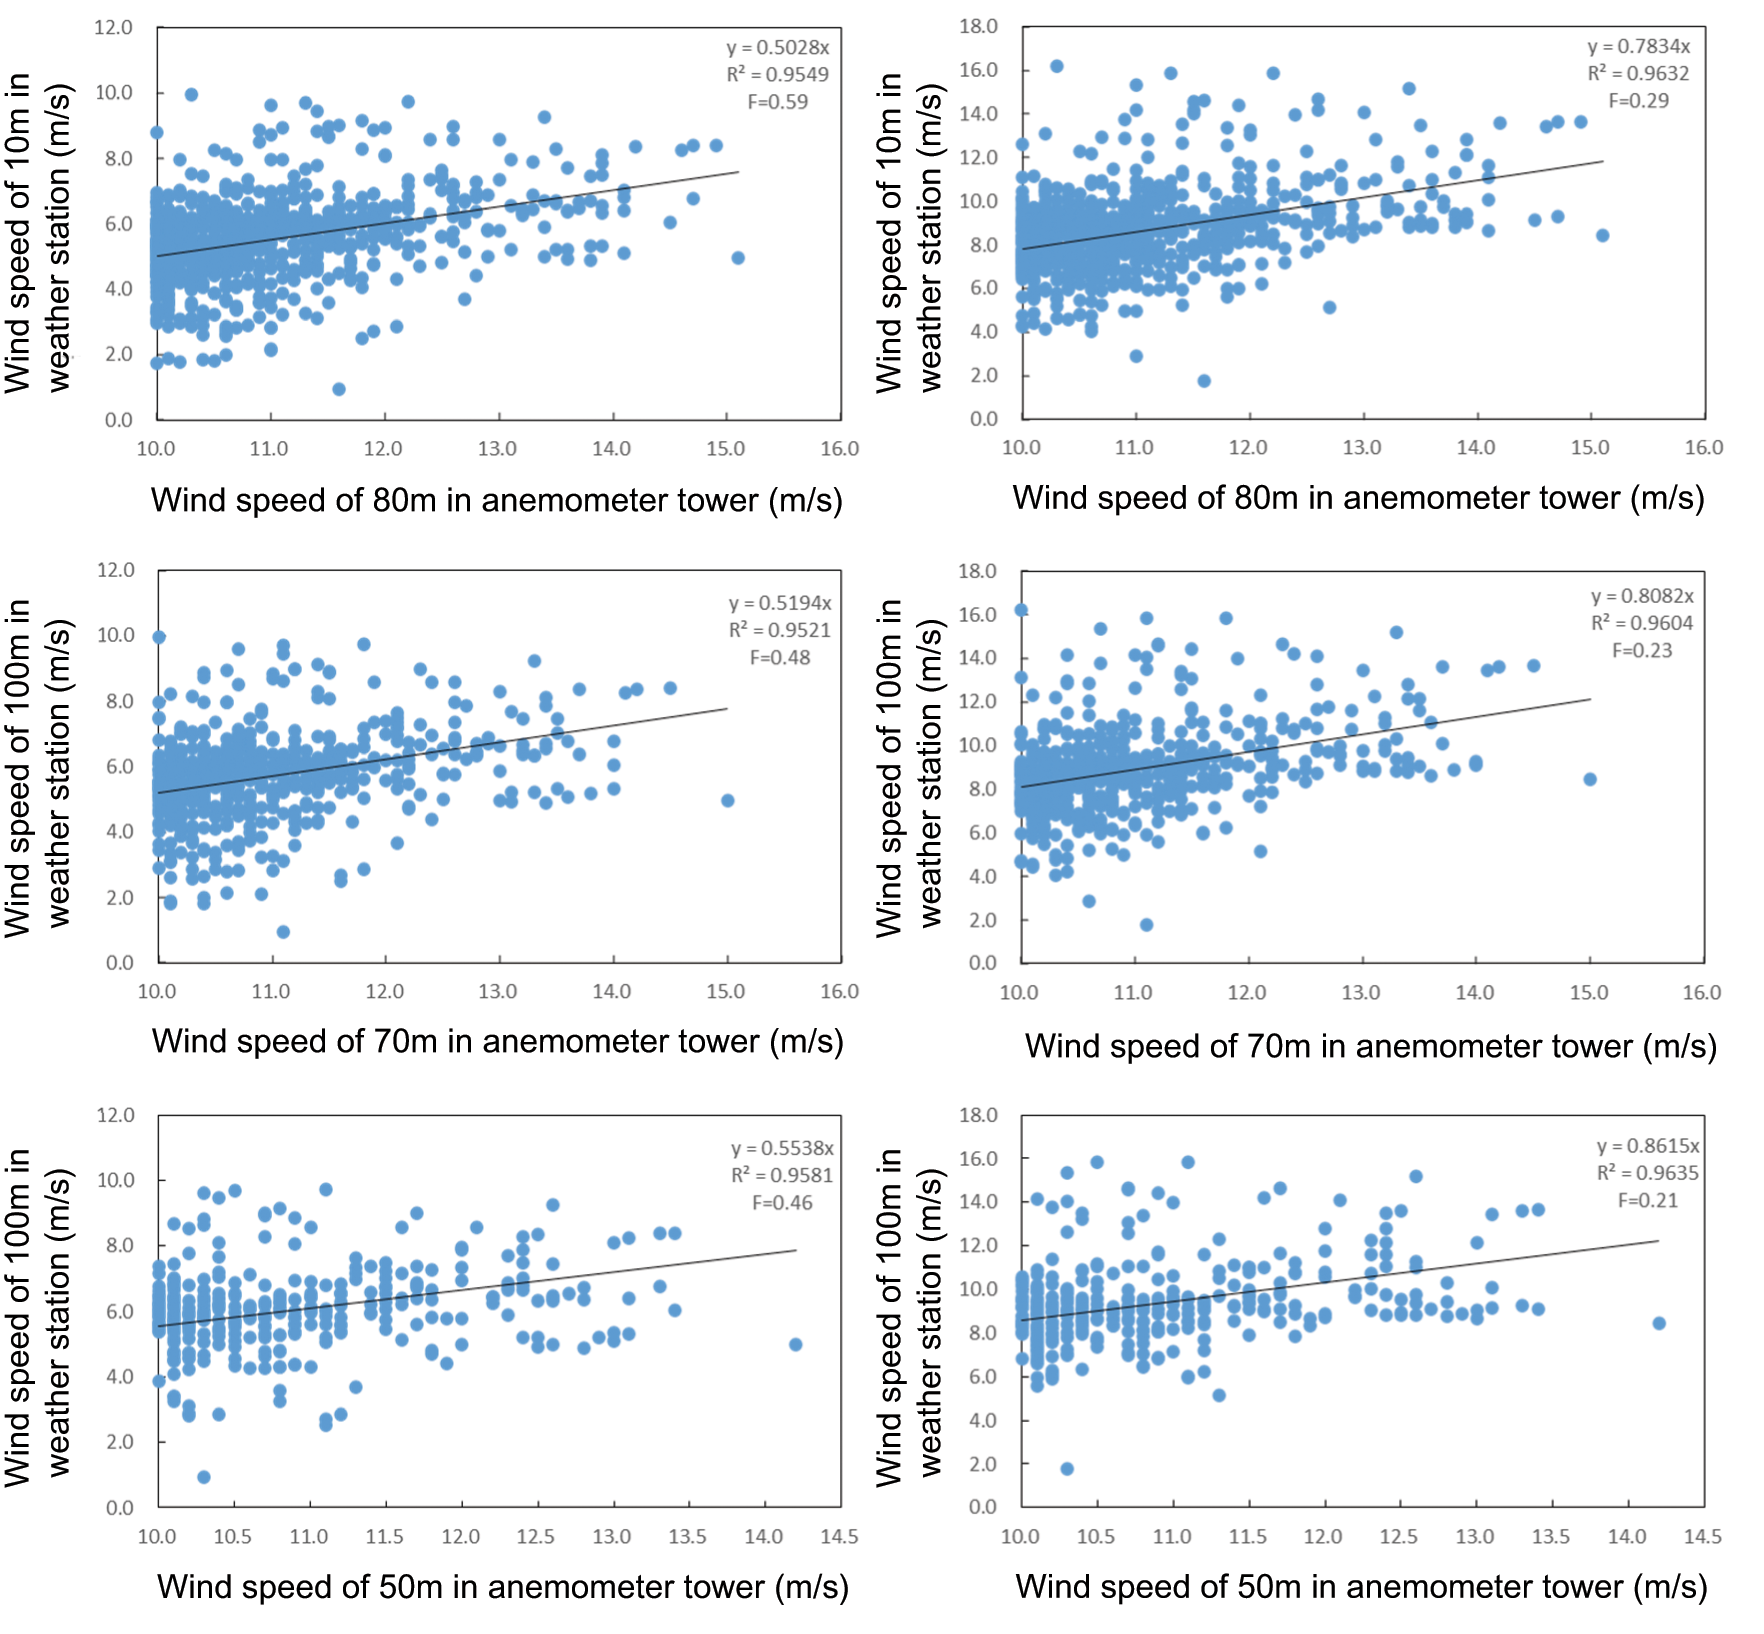
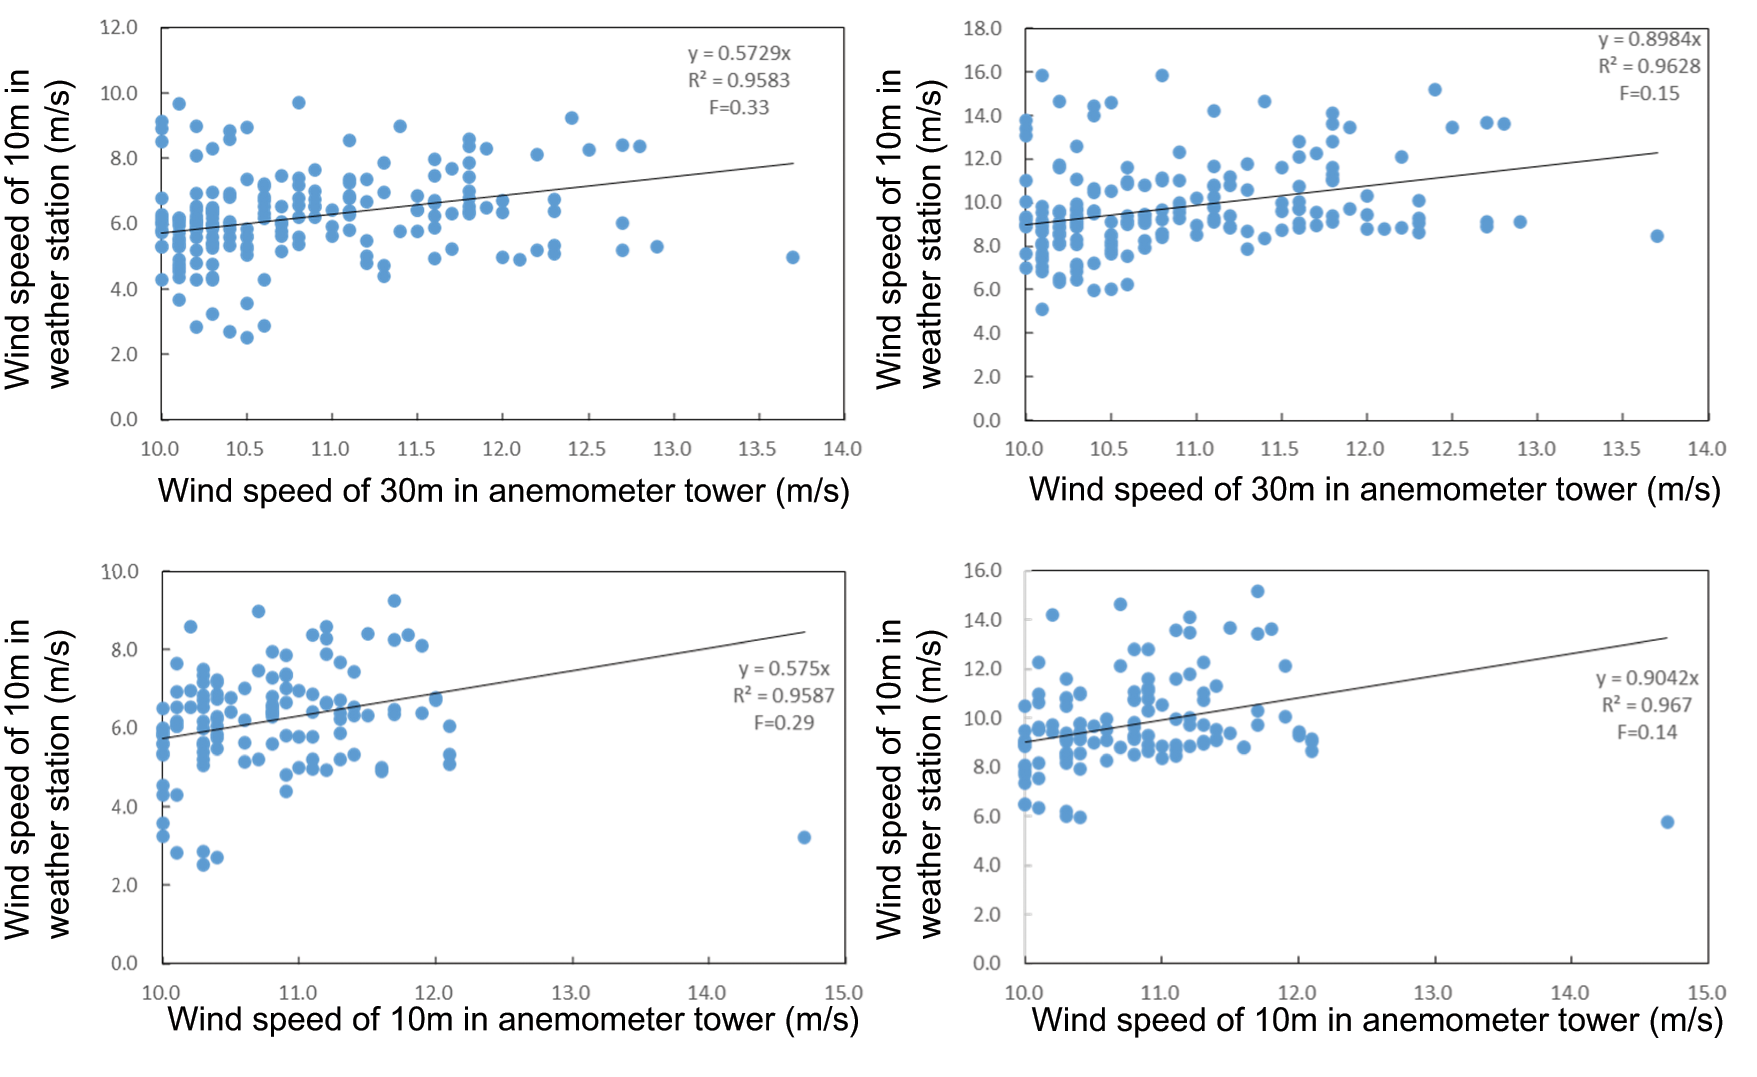
Figure 3: Correlation diagram of wind tower and strong wind samples of meteorological station
Among them, y is the wind speed of 100 m of Qinzhou Weather Station and x is the wind speed of wind measuring tower.
4 Wind Measuring Tower Wind Speed was Restored During Typhoon Rammasun Made Landfall
4.1 The Hourly Average Wind Speed of the Measuring Tower During the Typhoon Made Landfall
Typhoon Rammasun started at 14:00 on July 12, 2014 and 5:00 on July 20, 2014. It passed through Qinzhou, Guangxi at 7:00 on July 19,2014 (shown in the figure). Fig. 4 showed purple Rammasun path, * is the position of wind measurement tower, and ▴ is the position of Qinzhou Meteorological Station. Therefore, the time-by-time wind speed data in July 2014 was selected for analysis and restoration. Tab. 1 in the attached table shows the hourly average wind speed value of 100 m per hour from 2014/7/1–2014/7/31 of Qinzhou Meteorological Station.
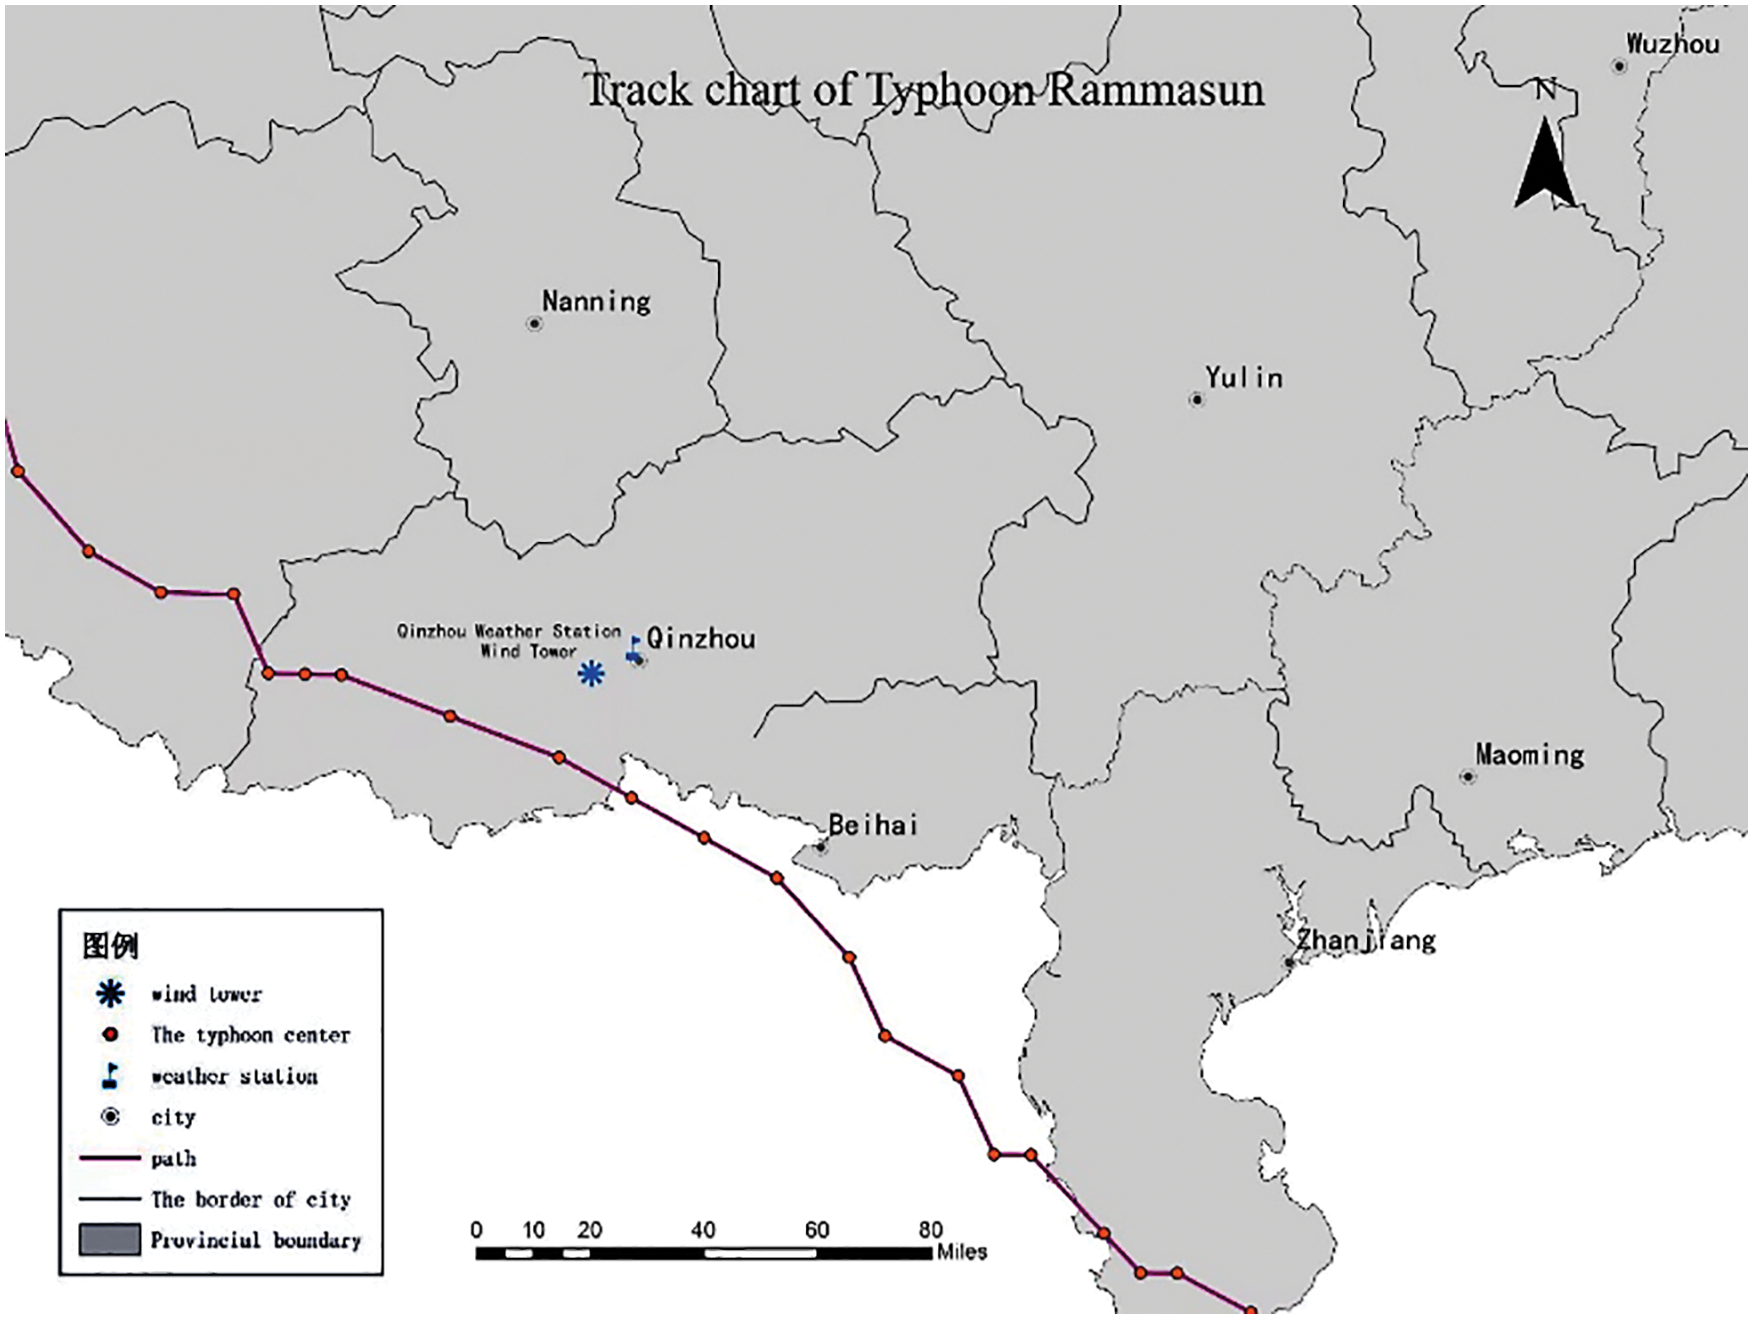
Figure 4: Rammasun transit path map (including the location of qinzhou meteorological station and wind measuring tower)
The hourly average wind speed of the wind measuring tower was calculated using the Qinzhou Weather Station data and the correlative wind model obtained in 3.2, and the results were obtained in Fig. 5.
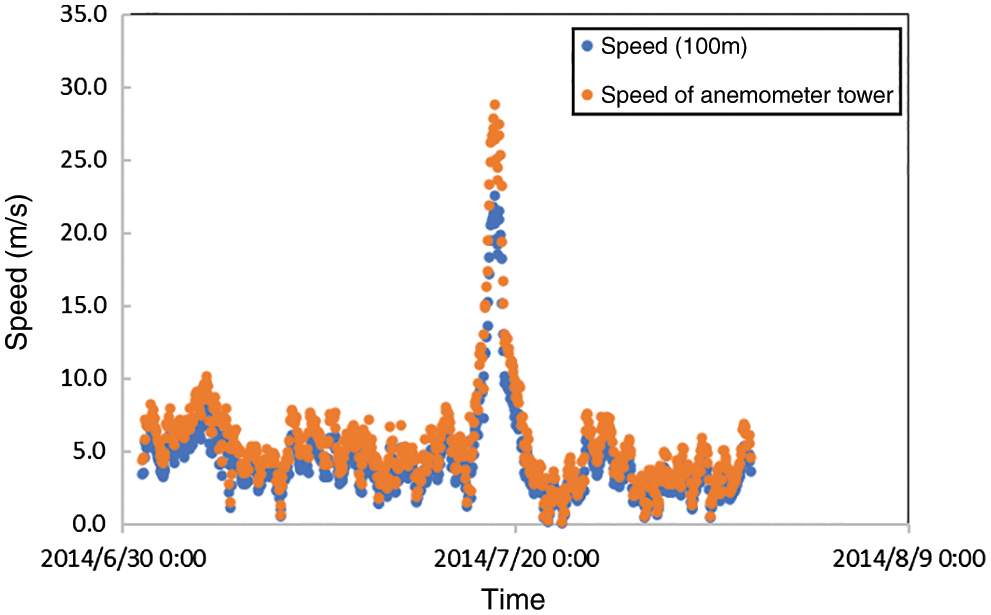
Figure 5: The hourly average wind speed of the wind tower during the same period
It can be seen that when calculating the wind speed of 80 m with the correlative model, the overall trend is basically the wind speed data of Qinzhou Weather Station, and the wind speed value was consistent. A large sample indicated that the correlative model effect in 3.2 met expectations.
4.2 Restoration of the Spatial Interpolated Wind Speed
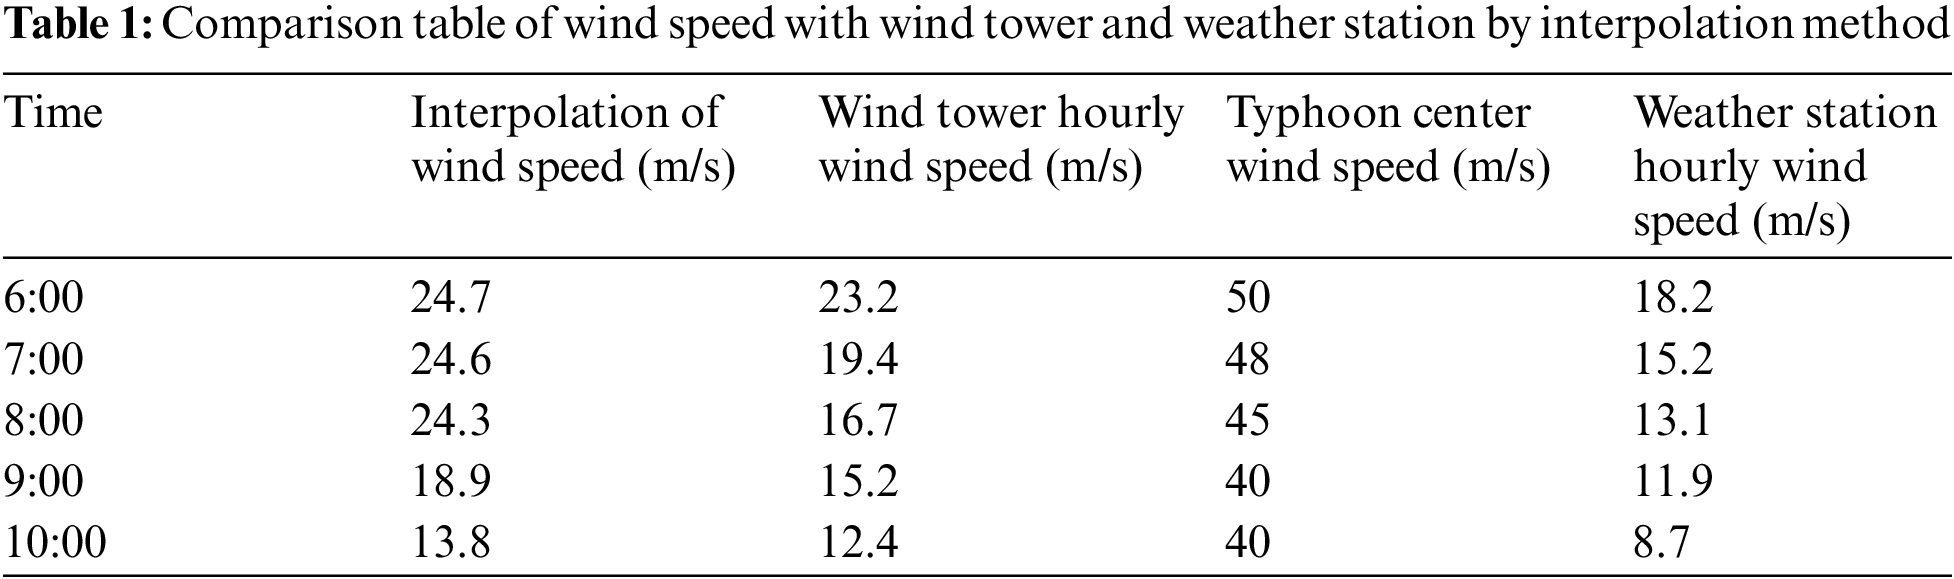
By selecting the central maximum wind speed at 6, 7, 8, 9 and 10 o ‘clock on the path of Typhoon rammasun on June 19 and the 60-minute average wind speed at the corresponding Qinzhou meteorological station, spatial interpolation analysis was adopted to obtain the wind speed at the height of 80 m from the wind tower. The results are shown in Tab. 1. At six o ‘clock, the interpolated wind speed of the wind tower is 24.7 m/s, and the wind speed of the wind tower obtained by the correlation model established between the wind tower and the weather station is 23.2 m/s. At seven o ‘clock, the interpolated wind speed is 24.6 m/s, and the model wind speed is 19.4 m/s. At eight o ‘clock, the interpolated wind speed is 24.3 m/s, and the model wind speed is 16.7 m/s. The interpolated wind speed is 18.9 m/s, and the model wind speed is 15.2 m/s. At ten o ‘clock, the interpolated wind speed is 13.8 m/s, and the wind speed of the wind measuring tower fitted by the model is 12.4 m/s. Through comparative analysis, it can be seen that the spatial interpolation method has some limitations on wind speed of wind tower. Therefore, it can be seen that the factors affecting wind speed is not only the distance from the typhoon center, but wind direction, vegetation coverage, geomorphic conditions and other factors.
Average hourly wind speed of 80 m height is significantly associated with the average hourly wind speed of 100 m of Qinzhou Weather Station. Its R2 was up to 0.9632, and F = 0.29 passed the F test, the correlation equation was Y = 0.7834X. X was the average wind speed of 80 m in the measuring tower and Y was the average wind speed of 100 m at Qinzhou Station. We used the equation to successfully restore the hourly average wind speed of the wind measuring tower at 80 m height during the 2014 Rammasun landfall.
Acknowledgement: This work was supported by the Second Tibet Plateau Scientific Expedition and Research Program (STEP) under Grant Number 2019QZKK0804, and the National Natural Science Foundation of China “Study on the dynamic mechanism of grassland ecosystem response to climate change in Qinghai Plat-eau” under Grant Number U20A2098.
Funding Statement: This work was supported by the Second Tibet Plateau Scientific Expedition and Research Program (STEP) under Grant Number 2019QZKK0804, and the National Natural Science Foundation of China “Study on the dynamic mechanism of grassland ecosystem response to climate change in Qinghai Plateau” under Grant Number U20A2098.
Conflicts of Interest: The authors declare that they have no conflicts of interest to report regarding the present study.
1. J. M. Yang, G. Z. Huang and D. S. Xue, “Review of regional environmental governance research in the west and its enlightenment to the guangdong-Hong Kong-macao greater bay area,” Tropical Geography, vol. 42, no. 2, pp. 293–304, 2022. [Google Scholar]
2. R. Liang and B. Z. Chen, “Damage assessment of extreme weather events under climate change,” Systems Engineering-Theory & Practice, vol. 39, no. 3, pp. 557–568, 2019. [Google Scholar]
3. G. G. James and M. Joshua, “Coal with carbon capture and sequestration is not as land use efficient as solar photovoltaic technology for climate neutral electricity production,” Scientific Reports, vol. 8, no. 10, pp. 13476, 2018. [Google Scholar]
4. B. Julia and W. Turner, “Environmental art, prior knowledge about climate change, and carbon offsetsn,” Journal of Environmental Studies and Sciences, vol. 6, no. 4, pp. 691, 2016. [Google Scholar]
5. Y. Qiao, J. N. Li and Z. Chen, “Research on the real-time assessment methods of distribution of wind energy resource,” China Sciencepaper, vol. 11, no. 23, pp. 2633–2639, 2016. [Google Scholar]
6. X. D. Peng, “Research on risk management and risk countermeasures during the construction period of wind power generation projects,” Yunnan Water Power, vol. 32, no. 6, pp. 15–16+27, 2016. [Google Scholar]
7. J. X. Ye, P. Wang, W. Zhang, F. Y. Du, L. Z. Li et al., “Study on macro location of wind farm based on fuzzy comprehensive evaluation model,” Qinghai Electric Power, vol. 40, no. 1, pp. 23–28,+34, 2021. [Google Scholar]
8. D. Y. Fu, T. Li, A. Q. Wang and L. C. Gong, “Research on load characteristics of offshore wind turbine coupling with wind and wave,” Acta Energiae Solaris Sinica, vol. 42, no. 9, pp. 256–262, 2021. [Google Scholar]
9. S. J. Li, M. N. Yue, B. Wang, C. Li and Q. W. Ding, “Large-scale response analysis of floating wind farm under different sea conditions,” Journal of Chinese Society of Power Engineering, vol. 41, no. 11, pp. 991–1000, 2021. [Google Scholar]
10. X. Xia, H. Yu, L. X. Dong, K. R. Chen, G. Zhao et al., “Characteristics of near surface turbulence intensity before and after wind farm construction,” Plateau Meteorology, vol. 1, pp. 1–12, 2022. [Google Scholar]
11. J. Wang, P. Guo, X. F. He and S. F. Liu, “Research on the correction method of gridded wind speed data based on wind tower observation,” Journal of Meteorology and Environment, vol. 36, no. 6, pp. 115–121, 2020. [Google Scholar]
12. D. X. Wang, C. B. Cai and J. H. Wang, “Quantitative analysis on representative influencing factors of wind measurementmast based on power generation,” Huadian Technology, vol. 42, no. 12, pp. 72–77, 2020. [Google Scholar]
13. Y. J. Li, J. Lu, Y. L. Li, J. L. He, X. S. Huang et al., “Climate survey of guangxi in 2020, ” Journal of Meteorological Research and Application, vol. 42, no. 2, pp. 100–104, 2021. [Google Scholar]
14. H. L. Luo, J. L. He, Y. L. Li and X. S. Huang, “Main meteorological disasters and variation characteristics in guangxi under the background of climate changes, ” Journal of Meteorological Research and Application, vol. 37, no. 1, pp. 10–14, 2016. [Google Scholar]
15. S. Q. Chen, H. Huang and H. L. Zhao, “Characteristics of typhoon ramasun’s structure,” Marine Forecasts, no. 3, pp. 9–14, 2004. [Google Scholar]
16. W. Y. Shi, T. Z. Yang and J. B. Zhang, “Calculation and analysis of the observed storm current during the rammasun typhoon (0205TY),”. The Ocean Engineering, vol. 1, no. 2, pp. 66–69+74, 2004. [Google Scholar]
17. L. L. Qiao, L. D. Cuong, Y. Li, X. Y. Duan and P. Yin, “Numerical modeling of hydrodynamic changes due to super typhoon rammasun in the Red river delta coastal area,” Marine Sciences, vol. 45, no. 4, pp. 64–74, 2021. [Google Scholar]
18. L. Y. Wang and Y. Q. Xu, “Preliminary exploration of typhoon damage to wind farms and typhoon characteristics,” Wind Energy, vol. 1, no. 5, pp. 74–79, 2012. [Google Scholar]
19. R. K. Grace and R. Manimegalai, “Design of neural network based wind speed prediction model using gwo,” Computer Systems Science and Engineering, vol. 1, no. 2, pp. 593–606, 2022. [Google Scholar]
20. B. Xu, J. Zhu, J. Wen, S. Lin, Y. Zhao et al., “Optimization for variable height wind farm layout model,” Intelligent Automation & Soft Computing, vol. 29, no. 2, pp. 525–537, 2021. [Google Scholar]
21. H. L. Wang, X. Q. Wu, Z. H. Huang, Y. F. Cai and C. H. Zhang, “Study on the boundary layer wind variationcharacteristics of super-typhoon rammasun during landing on xuwen county,” Journal of Tropical Meteorology, vol. 34, no. 3, pp. 297–304, 2018. [Google Scholar]
22. Y. C. Peng, “Study on the effectiveness evaluation of the typhoon disaster prevention in ‘weimasun’,” Jilin Water Resources, vol. 1, no. 6, pp. 22–25, 2018. [Google Scholar]
23. A. El-Bshah, F. N. Al-Wesabi, A. M. Al-Kustoban, M. Alamgeer, N. Nemri et al., “Resource assessment of wind energy potential of mokha in Yemen with weibull speed,” Computers, Materials & Continua, vol. 1, no. 1, pp. 1123–1140, 2021. [Google Scholar]
24. M. A. Almekhlafi, F. N. Al-Wesabi, I. Khan, N. Nemri, K. Mahmood et al., “Analysis and assessment of wind energy potential of socotra archipelago in Yemen,” Computers, Materials & Continua, vol. 70, no. 1, pp. 1177–1193, 2022. [Google Scholar]
25. J. Huang, B. Zhou, H. Huang, D. Qing and N. N. Xiong, “Main factor selection algorithm and stability analysis of regional FDI statistics,” Intelligent Automation & Soft Computing, vol. 30, no. 1, pp. 303–318, 2021. [Google Scholar]
 | This work is licensed under a Creative Commons Attribution 4.0 International License, which permits unrestricted use, distribution, and reproduction in any medium, provided the original work is properly cited. |